08 epee 3.2012 algieri-et-al - portale unical · according to eeag (2012, pp. 131-134), at the end...
TRANSCRIPT

© Ediz
ioni F
ranco
Angeli
Articles
Economics and policy of energy and the environment, n. 3/2012
“SUNNY” PROSPECTS: AN ANALYSIS OF THE PHOTOVOLTAIC INDUSTRY IN ITALY
Bernardina Algieri, Antonio Aquino, Marianna Succurro*
Introduction Climate change, the prospect of shortages of fossil fuels, and the need to
improve the security of the energy supply have greatly increased the necessity of promoting renewable energy. In particular, the need to reduce dependence on imported fossil fuel energy has increased following strong surges in the prices of oil, gas, and coal caused by growing demand from China and other emerging markets.
According to EEAG (2012, pp. 131-134), at the end of 2008, fossil fuel still represented 77 per cent of the world’s total energy consumption, with a decline of only six percentage points since 1990. Nuclear power’s share was 13.4 per cent, slightly declining since 2002, while the share of renewables, though almost doubled since 1990, was still as low as 8.4 per cent. The main sources of renewable energy by a large majority were, at the end of 2008, biomass and wastes (mainly wood and wood waste) with a share of 70 per cent of total renewable energy, followed by hydro power, whose share of renewables declined from 35 per cent in 1990 to 19 per cent in 2008, wind power, with a share climbing from almost zero in 1990 to 7 per cent of renewable energy in 2008, geothermal, with a constant share of about 4 per cent, and solar power with a share of only one per cent of renewable energy production (and 0.08 per cent of total world energy production and consumption).
Over recent years, however, two new tendencies have emerged that could substantially change the energy production framework. Namely: 1) an increase of the share of renewable sources in total energy production much stronger than in the past (from 8.4 per cent in 2008 to about 20 per cent in 2020); and 2) a resilient growth in the share of wind power and solar power in renewable energy production.
* Department of Economics and Statistics, University of Calabria, 87036 Rende. Author
contacts: [email protected], tel. +39 0984 492443; [email protected], tel. +39 0984 492467); [email protected], tel. +39 0984 492445. The authors contributed equally to the writing of this paper.
N.B. Copia ad uso personale. Non ne è consentita la condivisione e/o la messa a disposizione al pubblico su rete pubblica o privata,
sia in forma gratuita sia a pagamento.

© Ediz
ioni F
ranco
Angeli
112
The countries which most increased wind power capacity have been China (62 gigawatts (GW) at the end of 2011), the United States (48 GW), Germany (29 GW), Spain (21 GW), India (16 GW), followed by France, Italy and the United Kingdom, each with about eight GW of cumulative installed capacity at the end of 2011 (Earth Policy Institute, Eco-economy indicators, 2011).
The growth of solar power energy started somewhat later than that of wind power, but its prospects seem to be even brighter despite the current economic crisis (Shen et al., 2011). Germany is the leader in photovoltaic installations (about 25 GW of cumulative installed capacity at the end of 2011) and Italy follows soon behind (with about 13 GW). China, instead, has recently become by far the main world producer (11 GW of PV cell production in 2010), but lags far behind in installed capacity. However, this situation seems to be changing rapidly, owing to the fall in prices of solar panels and the adoption by the Chinese government of a PV feed-in tariff scheme to stimulate the solar industry and therefore PV installations (Earth Policy Institute, eco-economy indicators, 2011; Polytechnic of Milan, 2012, p. 50).
The exceptional growth prospects of PV energy production can be better understood if one considers that PV power available in likely developable locations is estimated to expand to about 340 terawatt (TW) (340.000 GW), compared to 40-85 TW for wind power and 1.6 TW for hydro power (Jacobson, Delucchi, 2011).
In this context, the present study aims to analyse the main characteristics and dynamics of the Italian photovoltaic sector, because the PV industry can be a great opportunity for Italian companies and an engine of growth for the whole economy (Worldwatch Institute, 2011). In particular, the structure of the industry, the behaviour, and performance of the Italian producers are investigated using the accounting data collected from the Bureau van Dijk’s Amadeus database over the years of 2000 to 2010. The points of strength of the PV industry, its limitations, and its prospects for growth in the current regulatory environment will then be identified.
This analysis contributes to the economic literature on solar energy in several respects. First, it offers a detailed study of the Italian PV sector. To our knowledge, the studies on the Italian PV industry are relatively scarce. For instance, Cucchiella and D’Adamo (2012) have analysed the determinants in investment risk in the Italian PV industry. Battisti (2005) has assessed the impact of the first PV Law on the uptaking of PV technology.
Second, this study offers a comparison of the incentive unit costs among different energy sources and countries, and computes a set of indicators regarding the industry structure that could help policy makers better assess future profitability and define more efficient incentive schemes.
The rest of the paper is organised as follows: Section 1 briefly highlights the current “revolution” in electricity power; Section 2 reviews the promoting strategies for renewable energy systems and, in particular, the costs and benefits of the Italian feed-in premium; Section 3 briefly analyses the evolution of demand for PV systems over recent years; Section 4 investigates the structural characteristics and the dynamics of the PV supply; and the last Section concludes.
N.B. Copia ad uso personale. Non ne è consentita la condivisione e/o la messa a disposizione al pubblico su rete pubblica o privata,
sia in forma gratuita sia a pagamento.

© Ediz
ioni F
ranco
Angeli
113
1. A “revolution” in electricity power generation The solar-photovoltaic sector is experiencing a transformation from a “cottage
industry” centred in the United States, Japan and Germany1 to a global business generating more than $100 billion on a yearly basis. Among the drivers of this growth are government subsidies, innovation, and new players mainly from China. PV prices have fallen intensely, and the global installed capacity surged from 4.5 GW in 2005, to 23 GW in 2009, to reach 65 GW in 2011. The expansion in installed capacity registered in 2010 and 2011 occurred mainly in Germany and Italy, facilitated by feed-in tariffs set in 2007-2008. The incentive schemes spawned, in fact, marked price reductions in solar-PV modules, which went from more than $4 per Wp
2 in 2008 to about $1 per Wp in January 2012. Over the same period, balance-of-system costs3 were halved from about $4 per Wp to approximately $2 per Wp, so that total costs of PV power electricity dropped from about $8 per Wp in 2008 to less than $3 per Wp in January 20124.
PV prices are expected to fall further in the coming years as a result of increasing manufacturing capacity, drops in underlying costs5, and product standardisation. As the industry matures, indeed, manufacturing is likely to become more standardised, thus decreasing the possibilities for upstream players to differentiate themselves. This, in turn, will boost competition. Conversely, downstream players will have more chances to generate value, above all those that target the highest-value customers in the distributed-generation segment, delivering quality products and services across areas while holding their customer-acquisition and operational costs low. According to Aanesen et al. (2012), the cost of a commercial-scale rooftop system could be reduced by 40 percent by 2015 (from roughly $2.90 per Wp to $1.70 per Wp), and by approximately another 30 percent by by 2020 – to nearly $1.20 per Wp. Price declines would imply that the annual revenues generated across the value chain will probably stay levelled off, at about $90 billion per year.
In this context, the rapid development in the distributed electricity generation
1 The United States were the main world producer of PV panels until 1998; from 1999 to
2007 the main world producer was Japan; Germany was second from 2003 to 2007, and the first in 2008; since 2008, China has become by far the main world producer of PV panels.
2 The watt peak (Wp) is the amount of power that a PV module is able to supply when it receives 1000 watts per square meter of solar irradiance.
3 “Balance of system” costs refer to all solar components excluding PV panels (mainly wires, switches, inverters, acquisition and installation costs).
4 The total price of installing PV systems to residential customers fell from more than $100 per watt peak (Wp) in 1975 to a little more than $ 8 per watt peak (Wp) in 2005, but declined by only four percent per year from 2005 to 2008.
5 World installed PV capacity is expected to soar from 65 GW in 2011 to about 500 GW in 2020, corresponding to about 2.5 per cent of world energy consumption, while costs are estimated to decline to $1- $2 per watt peak for a fully installed residential system by 2020. Annual installations of solar PV could rival those of gas, wind, and hydro, and overtake nuclear by 2020.
N.B. Copia ad uso personale. Non ne è consentita la condivisione e/o la messa a disposizione al pubblico su rete pubblica o privata,
sia in forma gratuita sia a pagamento.

© Ediz
ioni F
ranco
Angeli
114
could crowd out the regulated utility industry in advanced countries, as well as bring electricity to millions of poor people living in rural areas, greatly improving their standards of living. Distributed rooftop generation are expected to be the dominant source of solar demand in OECD countries; while distributed ground-mounted generation is likely to dominate non-OECD countries.
2. Promoting strategies for renewable energy systems
A relevant part of recent literature focuses on how to effectively stimulate the production of electricity from renewable energy sources (RES) (Haas et al., 2004), and on pros and cons of various promotion strategies (Couture, Gagnon, 2010; Menanteau et al., 2003). Indeed, the policies adopted to support renewable sources have had different outcomes on a global level, depending on market characteristics and other country-specific factors (Tsoutsos et al., 2008).
The incentive systems can mainly take the form of green certificates or feed-in-tariffs (FIT).
Green certificates are negotiable instruments that fix the production of electricity from renewable sources and attest to the fulfilment of the obligations established by the government for placing in the electrical system a share of electricity coming from renewable sources. The system of green certificates prescribes that the regulator only specifies the quantity of electricity that each firm has to produce using RES, letting each firm decide the way to comply with its obligation, through the use of the incentivised sources, or through the purchase of production certificates by firms that have used renewables in excess of their obligation. In this context, green certificates represent a quantity mechanism: the regulator sets the quantity, while market determines the price. The main drawback of green certificates is related to price volatility, which places a risk on investors.
In Europe, the green certificate system is used in the U.K. and, for wind power, in Italy6, Denmark, Sweden, Romania and Poland. In Italy, there has been an oversupply of green certificates with a supply equal to about twice the demand.
The feed-in tariff approach, on the other hand, ensures a fixed price for generated power unit to producers of renewable energies. Within the FIT system, a government fixes a price for renewable energy above the market price for a number of years. The difference between the two prices represents the incentive to invest in the development of innovative and green technologies. Given the price, the market chooses the quantity, thereby giving rise to a specular mechanism with respect to the green certificates.
Feed-in tariffs provide energy producers with a certain revenue for each produced unit of power. Within this system, it is crucial to set the appropriate price, upon which depends the effectiveness of regulation in ensuring the appropriate level of investment.
6 From 2014, Italy will adopt the system of feed-in premium incentives for wind power.
N.B. Copia ad uso personale. Non ne è consentita la condivisione e/o la messa a disposizione al pubblico su rete pubblica o privata,
sia in forma gratuita sia a pagamento.

© Ediz
ioni F
ranco
Angeli
115
The system of certificates allocates a larger role to the market and seems more in line with liberalised energy markets with respect to the feed in approach, with a stronger administrative imprint. However, as feed-in-tariffs induce more certainty in the operating companies, a large portion of European countries has converged on them. Feed-in tariffs are increasingly considered “the most efficient and
effective support schemes for promoting renewable electricity” (European Commission, 2008). Indeed, the FIT system is currently the prevailing promoting strategy, even if price determination mechanisms vary according to the different regulatory options.
A known difference between feed-in tariff policies is whether the remuneration they offer to renewable energy developers is dependent or independent from the actual electricity market price (Couture and Gagnon, 2010; Klein et al., 2008).
Market-independent feed-in tariffs are generally known as fixed-price policies, since they offer a fixed price for electricity from RES delivered to the grid for a certain number of years.
Market-dependent feed-in tariffs are generally known as feed-in premiums, since a premium payment is added to the market price. They usually require that renewable energy developers provide their electricity to the market competing with traditional suppliers to meet demand; they then receive a premium above the spot market price for the electricity sold.
2.1. The Italian feed-in premium: costs and benefits In order to accelerate the development of renewable energy, the Italian
government has put in force a “mixed” or “hybrid” feed-in tariff scheme. Specifically, the latter provides both an incentive tariff proportional to the production of electricity – which is fixed for a period of 20 years – to the owner of a PV plant and the proceeds deriving from the energy sold at the market price. In this way, the price of renewable energy is determined by two factors: a constant tariff fixed by the government and the value of the electricity market exposed to supply and demand fluctuations7. The fixed tariff increases investor security through a more stable price and accelerates investments, while the market-based support mechanism should improve the integration of PV electricity into the electricity system by giving incentives to supply electricity to the grid when the demand is high (and the market price increases).
The first Italian PV feed-in scheme was established by law on August 5, 2005 (PV LAW). The original PV Law covered all grid connected PV systems between 1 and 1000 Kwp, but it did not foresee any additional incentives for building integrated
7 The electricity produced can be completely self-consumed or placed on the electricity
market. The consumption of self-produced energy involves implicit revenues (savings in electricity bills), while the energy produced and sold (not self-consumed) represents explicit revenue.
N.B. Copia ad uso personale. Non ne è consentita la condivisione e/o la messa a disposizione al pubblico su rete pubblica o privata,
sia in forma gratuita sia a pagamento.

© Ediz
ioni F
ranco
Angeli
116
systems (Battisti, 2005). Since then, the government has progressively reviewed the incentive schemes and the plan capacity ranges adopting the so-called Energy Bills.
The last fixed tariffs set by the 4th Energy Bill (Quarto Conto Energia) and the 5th Energy Bill (Quinto Conto Energia) are given in Table 1. They vary depending on project size: the highest rates are imposed on small domestic and architecturally integrated plants up to 3 kW, while the lowest rates are imposed on large plants that are not architecturally integrated8. As it is illustrated, the rates decrease with increasing plant power and over time, in order to take into account the significant drops in the cost of photovoltaic technology.
Tab. 1 – PV tariffs (€/kWh) under the Fourth and the Fifth Energy Bills
Fourth Energy
Bill
Plants operating in January-June 2012
Plants operating in July-December 2012
Power capacity Building
integrated PV plants
Other plants Building
integrated PV plants
Other plants
kW €/kWh €/kWh €/kWh €/kWh
1<P<3 0.274 0.240 0.252 0.221
3<P<20 0.247 0.219 0.227 0.202
20<P<200 0.233 0.206 0.214 0.189
200<P<1000 0.224 0.172 0.202 0.155
1000<P<5000 0.182 0.156 0.164 0.140
P > 5000 0.171 0.148 0.154 0.133
Fifth Energy
Bill
Plants operating in the first semester of application
Power capacity Building integrated PV plants Other plants
all-encompassing
tariff self-consumption
premium all-encompassing
tariff self-consumption
premium
kW €/kWh €/kWh €/kWh €/kWh
1<P<3 0.237 0.155 0.229 0.147
3<P<20 0.222 0.140 0.214 0.132
20<P<200 0.199 0.117 0.191 0.109
200<P<1000 0.161 0.79 0.153 0.71
1000<P<5000 0.144 0.62 0.137 0.55
P > 5000 0.135 0.53 0.128 0.46
Source: GSE and Ministry of Economic Development
8 Under the Fourth Energy Bill, an additional 10% on the base tariff is guaranteed to the
owner of the plant if installed panels are produced in European countries.
N.B. Copia ad uso personale. Non ne è consentita la condivisione e/o la messa a disposizione al pubblico su rete pubblica o privata,
sia in forma gratuita sia a pagamento.

© Ediz
ioni F
ranco
Angeli
117
The Italian PV support scheme, justified by the long-term economic and environmental benefits associated with the use of renewables, has offered high incentives to invest in PV systems. Indeed, despite Italy showing a significant international despecialisation in the sector (Algieri et al., 2011), energy production from photovoltaic systems has tripled in a few years and its installed PV capacity has grown substantially (+160% only in 2010). If, on the one hand, the government objective to foster PV growth has been reached, on the other hand, the costs associated with the Italian FIT scheme illustrated below have been underestimated, at least during the first phases of the promoting policy implementation.
To start with, the “law of one price” has been widely violated9 in Italy and in many other European countries since policies favouring green technologies have not been neutral with respect to the way emissions are reduced. One justification for this different treatment among green technologies has been the relative size of learning externalities. More specifically, the size of the learning externality depends on the maturity of the technology; for young technologies, the external learning curve is particularly steep. According to the EEAG Report 2012, large subsidies for different green technologies can be motivated by the presence of learning externalities. As is reported in Table 2, the learning rate10 is very high for solar photovoltaic – estimated at 17 percent per doubling of installed capacity – but it is negligible for hydropower (1 percent). Table 2 provides some rough estimates of the discounted value of the reduction in the cost of future investments due to learning externalities as a percentage of current investment costs.
For solar photovoltaic, when the stock of installed capacity is equal to one year of investments, the value of the cost reduction is 50.8 percent of the installation cost. After five years, the reduction falls to 31.6 percent. Part of the cost reductions are externalities because the knowledge acquired, not completely appropriated by the individual firm, is somehow dissipated to the industry as a whole. Indeed, the traditional argument in favour of government interventions in the market for energy is that the development of new technologies may suffer from market failures. The values reported in Table 2 should be taken as upper bounds of the learning externalities that would occur if production were undertaken by a large number of small producers, each with a negligible effect on total learning. In that case, a subsidy to investments, as represented by the numbers in Table 2, can be justified. Therefore, the reported values are upper bounds on reasonable values of subsidies.
The production costs must be compared across different production technologies and the cheapest should be chosen. Since there is learning, the currently cheapest technology does not necessarily have the lowest costs when learning rates are taken into account. However, as reported by EEAG (2012, p.
9 According to the “law of one price”, “…emitting one unit of CO2 has a cost that is
independent of how it was emitted. Consequently, reducing emissions by one unit has the same value regardless of how and where it is achieved” (EEAG, 2012, p. 142).
10 The learning rate is defined as the cost reduction implied by a doubling of the installed capacity.
N.B. Copia ad uso personale. Non ne è consentita la condivisione e/o la messa a disposizione al pubblico su rete pubblica o privata,
sia in forma gratuita sia a pagamento.

© Ediz
ioni F
ranco
Angeli
118
143), “...even with the most generous assumptions on learning rates, as for photovoltaic electricity, current costs of more than twice the cost of the cheapest technology should not be accepted”. In other words, learning externalities may vary between dissimilar technologies, but are not large enough to motivate any substantially different treatment of them. Instead, “…policy in many countries has been based on the principle that the costlier a particular technology is, the heavier it should be subsidised” (EEAG, 2012, p. 144). Hence, policies that make it several times more valuable to reduce emissions via photovoltaic panels than to use wind power or other sources, have been inefficient. Besides, one has to consider that most of the costs of learning activities in the development of PV technologies are actually sustained by German and Italian electricity consumers, while their benefits go mainly to PV producers in China, as well as to electricity consumers, and to people in general all over the world due to environmental externalities.
Tab. 2 – Cost reductions of future investments due to learning externalities in % of current
investment costs
Installed capacity in terms of years of investment flow Learning rate
1 5 10 20
Hydro, δ=0.01 4.0 2.1 1.5 1.0
Biomass, δ=0.05 18.4 10.3 7.4 4.9
Onshore wind, δ=0.07 24.8 14.2 10.2 6.9
Offshore wind, δ=0.09 30.8 17.9 13.0 8.8
Geothermal, δ=0.05 18.4 10.3 7.4 4.9
Photovoltaic, δ=0.17 50.8 31.6 23.5 16.3
Concentrated solar, δ=0.10 33.7 19.8 14.3 9.7
Source: EEAG Report 2012
Indeed, in Italy, the Energy Bills have resulted in the most expensive incentive
schemes among all of the promoting strategies established for RES. Note that, of the 5.7 billion euros destined for renewable energy in 2011, three billion have been spent on promoting photovoltaics (www.autorita.energia.it). To better assess relative efficiency, we have computed the unit costs of several incentive schemes associated with different energy sources (Table 3). The results show that in absolute terms, the Energy Bill for solar energy is the most expensive incentive scheme with 0.407 euro/kWh, the smallest unit costs are recorded within the CIP6 scheme which is not adopted in the solar sector. All inclusive feed-in premium tariffs for wind and biomass follow behind with 0.30 and 0.26 euro/kWh, respectively. Within green-certificate schemes, biomass registers the highest unit-costs (0.104 euro/kWh), followed by solar energy (0.09 euro/kWh). Within the priority dispatch, the highest unit costs are associated once again with the solar sector (0.087 euro/kWh) followed by the water sector (0.075 euro/kWh).
N.B. Copia ad uso personale. Non ne è consentita la condivisione e/o la messa a disposizione al pubblico su rete pubblica o privata,
sia in forma gratuita sia a pagamento.

© Ediz
ioni F
ranco
Angeli
119
Tab. 3 – Unit Costs (€/kWh) for different incentive schemes and energy sources (year 2010)
Energy Bill
2010
Green
Certificates
Priority
dispatch
All inclusive
tariff
CIP6
SOLAR
Incentivised power (MW) 3.459,10 1,78 1.921,07 - -
Incentivised production (MWh) 1.899.375 2.018 1.167.144 - -
Financial incentive (thousand €) 772.613 176 (1) 101.720 - -
Average financial incentive
per kWh (€/kWh) 0,407 0,09 0,087 - -
WATER
Incentivised power (MW) - 5.895,91 1.233,83 139,61 114,89
Incentivised production (MWh) - 18.104.756 3.932.487 494.119 178.298
Financial incentive (thousand €) - 658.811 297.192 108.706 25.767
Average financial incentive
per kWh (€/kWh) - 0,036 0,075 0,22 0,14
BIOMASS
Incentivised power (MW) - 1.134,89 445,63 213,32 856,73
Incentivised production (MWh) - 4.230.958 958.991 807.194 4.770.135
Financial incentive (thousand €) - 443.564 69.202 208.612 932.319
Average financial incentive
per kWh (€/kWh) - 0,104 0,072 0,26 0,20
WIND
Incentivised power (MW) - 4.963,04 3.213,84 3,00 622,36
Incentivised production (MWh) - 8.083.171 4.801.894 1.647 816.343
Financial incentive (thousand €) - 706.301 332.297 494 79.709
Average financial incentive
per kWh (€/kWh) - 0,087 0,069 0,30 0,10
GEOTHERMAL
Incentivised power (MW) - 360,00 60,00 - 122,53
Incentivised production (MWh) - 2.051.495 164 - 282.636
Financial incentive (thousand €) - 82.653 11 - 41.226
Average financial incentive
per kWh (€/kWh) - 0,040 0,067 - 0,15
Source: own elaboration on GSE and Aper data
N.B. Copia ad uso personale. Non ne è consentita la condivisione e/o la messa a disposizione al pubblico su rete pubblica o privata,
sia in forma gratuita sia a pagamento.

© Ediz
ioni F
ranco
Angeli
120
Several European countries, like Italy, have applied very highly incentivised feed-in tariffs for photovoltaic electricity. As is reported in Table 4, in many cases the tariffs are around 0.50 euros per kWh, while the average production cost in the European Union is 0.06 euros/kWh for wind power, 0.13 euros/kWh for biomass and 0.14 euros/kWh for Hydro power. The large subsidies spent on the PV energy are certainly a waste and they can also be counterproductive from the green house externality view point, owing to the “green paradox” (Sinn, 2012).
Note that Italy suffers from a “double inefficiency”. Not only do Italian policies deviate from the one-price principle, but the Italian feed-in tariff is also among the highest applied in Europe for all energy sources (Table 4).
Tab. 4 – Feed-in tariffs for “green” electricity in European countries (euros/kWh)
Member state Windpower
On-shore Wind power
Off-shore Solar
Photovoltaic Biomass Hydro
Austria 0.073 0.073 0.29 - 0.46 0.06 -0.16 n/a
Belgium n/a n/a n/a n/a n/a
Bulgaria 0.07 - 0.09 0.07 - 0.09 0.34 - 0.38 0.08 - 0.10 0.045
Cyprus 0.166 0.166 0.34 0.135 n/a
Czech Republic 0.108 0.108 0.455 0.077 - 0.103 0.081
Denmark 0.035 n/a n/a 0.039 n/a
Estonia 0.051 0.051 0.051 0.051 0.051
Finland n/a n/a n/a n/a n/a
France 0.082 0.31 - 0.58 n/a 0.125 0.06
Germany 0.05 - 0.09 0.13 - 0.15 0.29 - 0.55 0.08 - 0.12 0.04 - 0.13
Greece 0.07 - 0.09 0.07 - 0.09 0.55 0.07 - 0.08 0.07 - 0.08
Hungary n/a n/a 0.097 n/a 0.029 - 0.052
Ireland 0.059 0.059 n/a 0.072 0.072
Italy 0.3 0.3 0.36 - 0.44 0.2 - 0.3 0.22
Latvia 0.11 0.11 n/a n/a n/a
Lithuania 0.10 0.10 n/a 0.08 0.07
Luxembourg 0.08 - 0.10 0.08 - 0.10 0.28 - 0.56 0.103 - 0.128 0.079 - 0.103
Malta n/a n/a n/a n/a n/a
Netherlands 0.118 0.186 0.459 - 0.583 0.115 - 0.177 0.073 - 0.125
Poland n/a n/a n/a 0.038 n/a
Portugal 0.074 0.074 0.31 - 0.45 0.1 - 0.11 0.075
Romania n/a n/a n/a n/a n/a
Slovakia 0.05- 0.09 0.05- 0.09 0.27 0.072 - 0.10 0.066 - 0.10
Slovenia 0.087 - 0.094 0.087 - 0.095 0.267 - 0.414 0.074 - 0.224 0.077 - 0.105
Spain 0.073 0.073 0.32 - 0.34 0.107 - 0.158 0.077
Sweden n/a n/a n/a n/a n/a
United Kingdom 0.31 n/a 0.42 0.12 0.23
Source: Europe’s Energy Portal, http://www.energy.eu/, last accessed: April 24, 2012
N.B. Copia ad uso personale. Non ne è consentita la condivisione e/o la messa a disposizione al pubblico su rete pubblica o privata,
sia in forma gratuita sia a pagamento.

© Ediz
ioni F
ranco
Angeli
121
To summarise previous considerations, the first factor explaining the high photovoltaic electricity costs mainly refers to the “law of one price” violation. But there are additional elements to take into account.
Different from other countries, no cap and floor for the premium amount has been specifically designed in Italy (Cucchiella and D’Adamo, 2012) to ensure a total remuneration for PV energy developers within a reasonable range. The high incentive with no cap on the premium has favoured windfall profits11, speculation and, in some cases, mafia infiltrations in large investments.
Third, but strictly linked to the previous point, since the ratepayers bear the costs of the PV incentives, the sudden rise in the demand for photovoltaic systems has caused an upsurge in consumer bills12.
Fourth, the network has been unable to absorb any excess in energy supply due to network constraints. Indeed, there are no points of accumulation and energy cannot be stored. Different from other RES that can directly control their supply, PV systems are less able to correlate supply with the existing hour-by-hour demand, therefore they cannot profit from the market-based support mechanism included in the Italian incentive scheme. For this reason, the market integration of PV electricity is weak compared to other RES, against its relatively high costs.
Finally, the accelerated installation of the panels can reduce energy efficiency in the long run due to technological backwardness. Specifically, given that photovoltaics is a highly innovative sector, any saturation of the production capacity means less advanced technologies in the long run. It would be desirable, therefore, to proceed gradually so as to have a portion of the solar park in constant upgrading. Moreover, considering that the Italian manufacturers of photovoltaic panels are relatively few compared to foreign ones, the gradual installation could allow the Italian industry to grow and compete more effectively.
In order to limit these high social costs, the Fifth Energy Bill will be adopted from the 1st of July 2012. In the 5th Energy Bill, the Italian government defines new rules for PV installations, mainly affecting large-scale plants. More specifically, the new Energy Bill establishes a cap on government incentives per year/semester, a register for all PV plans with power greater than 3 KW and a rigorous ranking among different types of plans in order to favour those oriented to reclaim space and with more innovative technologies. The Italian government will provide incentives to PV plants following the rank-order grading, but only under a certain expense limit.13 Furthermore, incentives for ground-mounted PV projects
11 In order to avoid windfall profit when market prices rise, the Spanish government has
implemented a variable premium policy design (Couture and Gagnon, 2010). In this model, the premium amount declines until the retail price reaches a certain level, at which point the premium declines to zero and the producer receives the spot market price (Spanish Royal Decree 661/2007).
12 For an analysis of advantages and disadvantages of passing on the costs to tax payers versus ratepayers, see Couture and Gagnon (2010), p. 959.
13 Based on the last available information (April 2012), the established expense limit would be 80 million euros per semester.
N.B. Copia ad uso personale. Non ne è consentita la condivisione e/o la messa a disposizione al pubblico su rete pubblica o privata,
sia in forma gratuita sia a pagamento.

© Ediz
ioni F
ranco
Angeli
122
on agricultural lands are eliminated to avoid that large amount of lands are subtracted to agriculture to be covered with panels.
With reference to the support scheme, from the second semester of 2012 an all-encompassing tariff (tariffa onnicomprensiva) will be adopted by the Italian government instead of the existing hybrid tariff. A fixed premium is also adopted for self-consumption (Table 1).
In order to precipitate the improvement of previous incentive schemes, these new rules aim at limiting the impact on electricity rates, with clear advantages for consumers and society. However, policymakers should consider an appropriate regulatory framework with softer sustainable incentive mechanisms14 that respect the previously mentioned “law of one price,” of key importance for economic efficiency.
3. The Italian PV demand over recent years This paragraph briefly shows the evolution of the Italian photovoltaics market
demand and its significant growth over recent years, due to the adopted Energy Bills.
In comparison with the other RE, the PV industry has the highest number of plants for the production of electricity from renewable sources. By December 31, 2010, PV systems covered approximately 97.55 percent of all plants using renewable sources compared to a gross efficiency power of about 11.46 percent of the total. From 2009 to 2010, the number of installations has increased by +118.8 percent and the gross efficiency power by +203.3 percent (Table 5).
Tab. 5 – RES in Italy: Number of Plants and Gross Efficiency Power
N Plants Gross Efficiency Power (kW)
Type 2009 2010 Var.% 10/09 2009 2010 Var.% 10/09
Photovoltaic 71,288 155,977 +118.8 1,144,021 3,469,880 +203,3
Wind 294 487 +65.6 4,897,938 5,814,281 +18.7
Biomass 419 669 +59.7 2,018,554 2,351,545 +16.5
Geothermic 32 33 +3.1 737,000 772,000 +4.7
Water 2,249 2,729 +21.3 17,721,465 17,876,169 +0.9
Total 74,282 159,895 +115.3 26,518,978 30,283,875 +14.2
Source: GSE (2010)
14 EPIA has estimated that dynamic grid parity will occur in most European markets by
2020 (EPIA, 2011b, p. 4). According to the CEO of the Chinese company Suntech, which is the largest solar company in the world, “in five years’ time, solar won’t need subsidies…By 2050, 25% of our electricity will come from solar” (Fortune, February 27, 2012, p. 15). According to the Solar Energy Report of the Polytechnic of Milan (2012, pp. 129-143 ), the grid parity could occur in Southern Italy in 2012-2013.
N.B. Copia ad uso personale. Non ne è consentita la condivisione e/o la messa a disposizione al pubblico su rete pubblica o privata,
sia in forma gratuita sia a pagamento.

© Ediz
ioni F
ranco
Angeli
123
The intensification of PV systems demand is due to different factors, apart from the strong incentives guaranteed to energy producers by the remuneration scheme described above. First, a PV system can have different dimensions and use-destination, e.g. small residential systems for consumption (1-20 kW), industrial installations (200 kW to 1 MW), and power plants (over 1 MW). Second, photovoltaics do not require a specific site or a particular plant or machinery for operation and, above all, do not require much maintenance. Furthermore, the initial investment is considerably less expensive than that required for the installation of water, wind, or geothermal plants.
Apart from the positive trend at a national level, the demand for photovoltaic systems shows differences in regard to market segmentation and geographic distribution across Italian regions. In 2011, Puglia was the region with the highest level of installed capacity (1.68 GW) spread across 17,812 systems. Lombardy, however, was the region with the highest number of installed systems (38,810 systems with a capacity of 993 MW), followed by Veneto, 36,066 systems with a capacity of 894 MW) (GSE, 2012). The analysis of the segmentation of the installed power shows that the weight of residential installation (1-20 kW) has significantly decreased, passing from 44.5 percent in 2007 to 23.1 percent in 2010, while the relative weight of the plants belonging to the major classes (those with power between 200 kW and 1 MW or more than 1 MW) has soared (Figure 1). The segment of the solar power plants over one MW, non-existent in 2007, grew by 27 percent in 2010. As a result of growth in industrial plants and power stations, the average size of PV systems has increased from 6.8 kW in 2007 to 22.2 kW in 2010.
Fig. 1 – Installed Power Capacity (kW). % Share
Source: own calculation on GSE data
N.B. Copia ad uso personale. Non ne è consentita la condivisione e/o la messa a disposizione al pubblico su rete pubblica o privata,
sia in forma gratuita sia a pagamento.

© Ediz
ioni F
ranco
Angeli
124
4. Structural characteristics of the Italian PV supply
4.1. Firm size and structural organisation To evaluate the main features of the Italian photovoltaics supply and identify
new industrial strategies for the industry, we have analysed the accounting data for the universe of the Italian PV cells and modules producers during the years 2000 to 201015. The Bureau van Dijk’s Amadeus database has been used for this purpose. The list of the analysed companies and the operating revenue of the top 20 Italian PV producers are reported in the appendix (Tables A1 and A2).
The main indicators, illustrated in Figure 2, show a very dynamic sector. Total revenues and total value of production have increased by 166.8 percent and by 172.5 percent respectively over the 2005-2010 period.
Fig. 2 – Total Revenues and Value of Production (billion euros), 2000-2010
Source: own calculations on Amadeus database
The Italian photovoltaic supply is characterised by a high firm birth rate; the
number of firms operating as PV cells and modules producers has grown by 482% over the 2005-2010 period. With reference to firm size, the PV sector is essentially made up of micro firms (annual turnover of less than 2 million euros). At the same time, the number of medium-sized firms (annual turnover between 10 and 50 million euros) and large firms (annual turnover over 50 million euros) has increased by 195.5% and 11.6% respectively between 2005 and 2010 (Table 6). Therefore, even if micro-firms represent the largest segment,16 the medium sized enterprises have registered the highest growth rate. At the sector level, the average turnover per firm has decreased from 68 million euros in 2005 to 40 million euros
15 Note that around 8.3% percent of the universe of the Italian PV cells and modules
producers have not been considered in our research since their balance sheets are not included in the Amadeus database.
16 Also in terms of number of employees, the largest segment is represented by small firms, with less than 50 workers, and it is equal to 65.21%.
N.B. Copia ad uso personale. Non ne è consentita la condivisione e/o la messa a disposizione al pubblico su rete pubblica o privata,
sia in forma gratuita sia a pagamento.

© Ediz
ioni F
ranco
Angeli
125
in 2010, showing that the high growth rate of medium sized enterprises is probably counterbalanced by a more significant birth rate, also sustained by the absence of relevant barriers to entry.
Although the PV industry is mainly made up of micro and small firms, their share of the total number diminished by 17.4 percent and 42.6 percent, respectively, from 2005 to 2010 (Table 6).
Tab. 6 – Firm size in terms of turnover (millions euro)
N of firms (% values) %
2005 2010 change 2010/2005
Micro (Turnover < 2 ml) 45.4 37.5 -17.4%
Small (2 ml < Turnover < 10 ml) 27.2 15.6 -42.6%
Medium (10 ml < Turnover < 50 ml) 9.0 26.6 +195.5%
Large (Turnover > 50 ml) 18.18 20.3 +11.6%
N=11 N=65 +481.8%
Source: own calculations on Amadeus database
The Adelman index17 (Table 7) reveals an increasing degree of vertical
integration. The greater the value added inside the firm with respect to the total value of production, the greater the degree of vertical integration.
With reference to the Italian PV sector, even though the Adelman index is relatively low, its positive trend from 0,098 in 2008 to 0,171 in 2010 (Table 7) could indicate a decreasing volume of outsourced activities. Vertical integration strategies can increase downstream and upstream control with a series of advantages in terms of profitability and new opportunities to compete in international markets. In addition, vertical integration allows firms to improve product quality and gain cutting-edge technology expertise. As a matter of fact, several Italian PV producers have started vertical integration processes. In some cases, they integrate mainly downstream with energy distribution; at other times, they integrate the installation activities or the energy generation process. Solsonica, for example, one of the top ten Italian producers with one of the highest growth rates (Table A2) has significantly increased the degree of downstream integration over the last years.
In brief, although PV cells are for the most part imported by the Italian modules’ producers, they are internally produced by an increasing number of Italian firms compared to the past, when they were totally foreign made. In this context, a drawback of the strong government incentives for the Italian PV industry would be that they probably benefit foreign firms at last. Actually, this drawback characterizes other industrial sectors and holds for other European countries as
17 The ratio between the added value and production value.
N.B. Copia ad uso personale. Non ne è consentita la condivisione e/o la messa a disposizione al pubblico su rete pubblica o privata,
sia in forma gratuita sia a pagamento.

© Ediz
ioni F
ranco
Angeli
126
well. The siliceous production and optimization processes are very expensive and the Italian firms, like the European competitors, find it difficult to compete with the Asian producers. However, it is important to consider the strong impact of the high PV systems’ demand on the national PV installers which, although not explicitly analysed in this paper, have registered a relevant growth rate. In this context, it should be noted, however, that the Adelman index could also mirror changes occurring in the value chain. Aanesen et al. (2012) has shown that value migrated downstream, from producers of PV modules to firms that develop and finance solar projects, and that venture-capital firms began to shift their new solar investments from capital-intensive solar-cell manufacturers to companies focused on developing innovative downstream business models.
Tab. 7 – Degree of Vertical Integration - Adelman Index
2008 2009 2010
Added value/ Production value 0.098 0.124 0.171
Source: own calculations on Amadeus database
4.2. Investments and degree of competition The analysis of the accounting data allows us to evaluate both the nature and
the composition of the investments in the Italian photovoltaic sector. Table 8 shows that fixed assets are greater than intangibles and financial assets, and their percentages have a wave-like behaviour. Tab. 8 – Investment composition (% values)
2000 2005 2010
Intangibles 21.99 21.08 22.22
Fixed assets 73.41 76.53 74.71
Financial assets 4.59 2.37 3.06
Total investments 100 100 100
Source: own calculations on Amadeus database
The ratio between intangibles and fixed assets and between intangibles and
turnover has decreased over the decade (Table 9). This trend has inverted in the last year.
N.B. Copia ad uso personale. Non ne è consentita la condivisione e/o la messa a disposizione al pubblico su rete pubblica o privata,
sia in forma gratuita sia a pagamento.
© Ediz
ioni F
ranco
Angeli
127
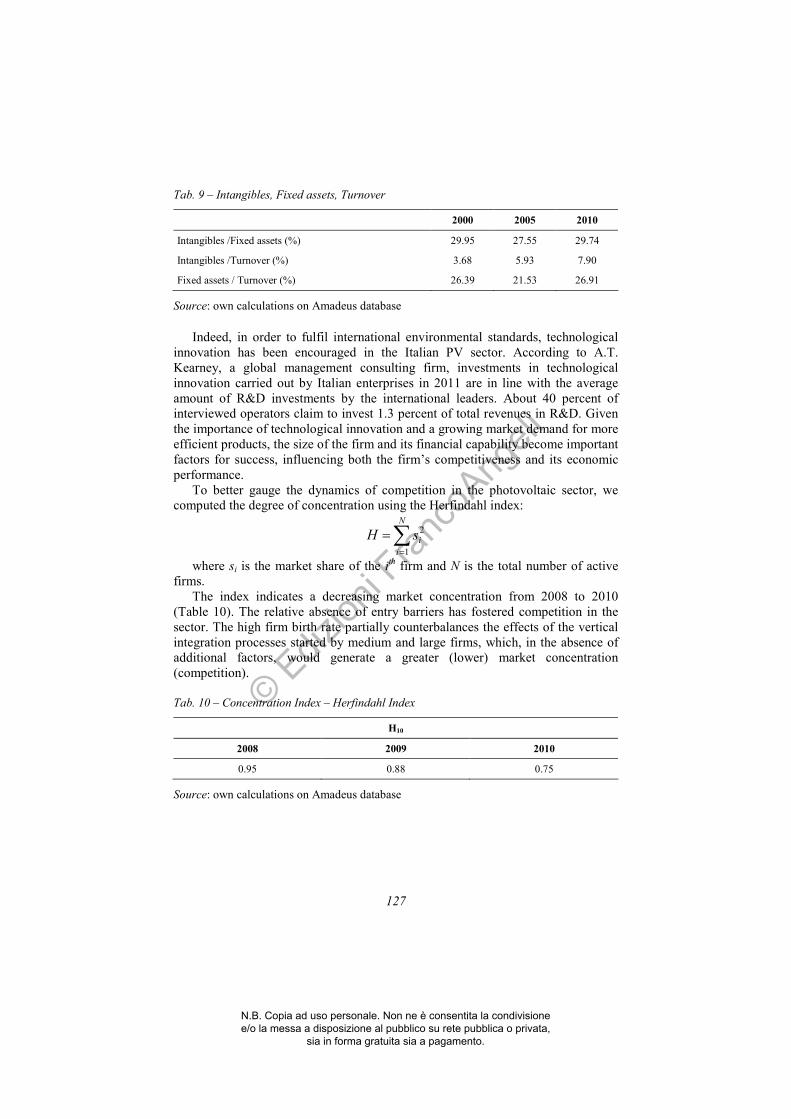
Tab. 9 – Intangibles, Fixed assets, Turnover
2000 2005 2010
Intangibles /Fixed assets (%) 29.95 27.55 29.74
Intangibles /Turnover (%) 3.68 5.93 7.90
Fixed assets / Turnover (%) 26.39 21.53 26.91
Source: own calculations on Amadeus database
Indeed, in order to fulfil international environmental standards, technological
innovation has been encouraged in the Italian PV sector. According to A.T. Kearney, a global management consulting firm, investments in technological innovation carried out by Italian enterprises in 2011 are in line with the average amount of R&D investments by the international leaders. About 40 percent of interviewed operators claim to invest 1.3 percent of total revenues in R&D. Given the importance of technological innovation and a growing market demand for more efficient products, the size of the firm and its financial capability become important factors for success, influencing both the firm’s competitiveness and its economic performance.
To better gauge the dynamics of competition in the photovoltaic sector, we computed the degree of concentration using the Herfindahl index:
∑=
=
N
i
isH1
2
where si is the market share of the ith firm and N is the total number of active
firms. The index indicates a decreasing market concentration from 2008 to 2010
(Table 10). The relative absence of entry barriers has fostered competition in the sector. The high firm birth rate partially counterbalances the effects of the vertical integration processes started by medium and large firms, which, in the absence of additional factors, would generate a greater (lower) market concentration (competition). Tab. 10 – Concentration Index – Herfindahl Index
H10
2008 2009 2010
0.95 0.88 0.75
Source: own calculations on Amadeus database
N.B. Copia ad uso personale. Non ne è consentita la condivisione e/o la messa a disposizione al pubblico su rete pubblica o privata,
sia in forma gratuita sia a pagamento.

© Ediz
ioni F
ranco
Angeli
128
4.3. Labour market and productivity indicators The Italian PV sector is characterised by a great capacity to generate employment
and income. Under the worst scenario (BAU 2020), CNEL (2010) estimates a direct and indirect impact on employment level equal to 4,669 new jobs and an induced impact on related industrial sectors employment equal to 2,021 new jobs over the 2010-2020 period. Under the best scenario (EU 2020 Competitiveness), CNEL (2010) estimates a direct and indirect impact on employment level equal to 19,540 new jobs and an induced employment of 8,588 new jobs.
Our research shows a strong increase in total cost of employees, which signals the significant growth rate of the Italian photovoltaic employment. Figure 3 shows the evolution of total personnel costs over the 2003-2010 period18 at the sector level. Between 2003 and 2010, total personnel costs showed a positive trend, which reflected an increase in the volume of Italian photovoltaic activities, albeit of varying rates over the years. Specifically, personnel costs have increased by 156.6 percent from 2003 to 2010.
From the accounting data, it is difficult to understand the composition of the work force with respect to labour contract, qualification and expertise, skills, etc. However, the analysis uses an indirect measurement of workforce quality given by the ratio between total personnel costs and number of employees. The elaborations show a surge in the labour force quality of 3.1 percent over the 2000-2005 years and 5.8 percent over the 2005-2010 period. Given the positive correlation between wage and qualification level, this positive trend could indicate an increase of skilled labour in the composition of the workforce. Data also show a rise in the ratio “intangibles/turnover” (Table 9), likely due to significant increases in worker education and training programs.
Fig. 3 – Total Personnel Costs (million euros, 2003-2010)
Source: own calculations on Amadeus database
18 Figure 3 illustrates only the 2007-2010 years because data on total personnel costs are
not available or are not reported correctly by several firms over the 2000-2003 period.
N.B. Copia ad uso personale. Non ne è consentita la condivisione e/o la messa a disposizione al pubblico su rete pubblica o privata,
sia in forma gratuita sia a pagamento.

© Ediz
ioni F
ranco
Angeli
129
To have a more complete picture of Italian photovoltaic supply, some productivity indicators have been calculated and reported in Table 11. They show the percentage variation in labour and capital productivity.
Labour productivity, calculated as the ratio between added value and total number of employees, records a positive trend over the period between 2004-2007, while it registers negative percentage variations over the 2001-2004 and 2007-2010 periods. Recent data on PV labour productivity are in line with national statistics, given the relevant fall in labour productivity characterising the Italian economy as a whole. Data show similar trends for capital productivity, calculated as the ratio between added value and net technical assets, which registers a significant drop (-45.13 percent) since 2007. The drop in capital productivity might reflect the considerable investments in technical assets (+180.6 percent over the 2005-2010 period) carried out by the Italian photovoltaic cells and modules producers. Tab. 11 – Labour and capital productivity (% change)
2004/2001 2007/2004 2010/2007
Labour Productivity (VA/employees) -70.63 17.19 -26.27
Capital Productivity (VA/net technical assets) -10.07 8.70 -45.13
Source: own calculations on Amadeus database
To verify the existence of economies of scale, we have evaluated the ratio
between the productivity index and the average firm size. With some caution in the utilisation of accounting data referring to total number of employees, the analysis would show the existence of strong economies of scale in the PV production (Figure 4). This evidence explains, to a certain extent, the reason that the share of medium and large firms has increased over time while the share of small-sized firms has progressively gone down. Evidently, the advantages deriving from economies of scale are relatively higher than the increasing coordination and control costs associated with a larger and more complex organisational structure.
Fig. 4 – Labour Productivity and Firm Size (year 2010)
Source: own calculations on Amadeus database
N.B. Copia ad uso personale. Non ne è consentita la condivisione e/o la messa a disposizione al pubblico su rete pubblica o privata,
sia in forma gratuita sia a pagamento.

© Ediz
ioni F
ranco
Angeli
130
Conclusions This study has highlighted the main characteristics and dynamics of the Italian
photovoltaic sector. Despite Italy showing an international despecialisation in the photovoltaic sector, it is classified as second in Europe in terms of cumulative installed capacity. Considering that in the next ten years the expected global investment in renewable energies – nine percent of which is projected in Italy –will be about 3,000 billion euro, the Italian PV sector could gain relative importance on the national and international scene.
Notwithstanding the high despecialisation, the Italian PV energy production has tripled in recent years, thanks to government incentives to the photovoltaic sector. Even bigger increases in PV installations have occurred in Germany. Actually, the bulk of the cost of learning activities in developing PV technologies is sustained by German and Italian electricity consumers, while their benefits go mainly to PV producers in China and to worldwide electricity consumers, spurred by environmental externalities.
In Italy, several PV firms have increased their vertical integration in order to extend their vertical control, both downstream and upstream. This organisational strategy would allow them to obtain high profitability and increase their international competitiveness. Moreover, the evolution of the concentration index over time indicates a lower concentration compared to the past. The relative absence of entry barriers has fostered competition in the sector. The high firm birth rate partially counterbalances the effects of the vertical integration process started by medium and large firms, which, in the absence of additional factors, would generate a greater (lower) market concentration (competition).
The Italian PV support scheme, justified by the long-term economic and environmental benefits associated with the use of renewable sources, has offered high incentives to invest in PV systems. If the government’s objective of fostering PV market growth has been reached, the costs associated with the Italian support scheme have been underestimated, at least during the first phases of the promoting policy implementation. In order to limit the high costs for energy consumers, a new Energy Bill is now under discussion and will most probably be applied from the 1st of July 2012 with new rules for PV installations. These new rules aim at paring down government expenses and limiting the impact on electricity rates. However, policymakers should consider an appropriate regulatory framework with softer sustainable incentive mechanisms, which respects the “law of one price”, of key importance for economic efficiency.
Moreover, the unexpected Italian government decision to cut incentives, adopted at the beginning of 2011 and again in April 2012, has led to great uncertainty by increasing investment risk for operators. When reforming incentive schemes, it is necessary to take into account two conflicting interests. On the one side, it is necessary to adjust incentives to technological improvements in order to limit costs for energy consumers; on the other, it is essential to avoid abrupt and unexpected incentive cuts which discourage investments in a sector that is characterised by a great capacity to generate learning externalities.
In this context, it would be socially desirable to adopt an ex-ante well-defined support policy which obeys the one-price principle and with a clear regulatory context known in advance to firms and investors. This could significantly contribute to the achievement of both environmental and energy security objectives fixed at an international level and the reduction of relatively high social costs without slowing down one of the most dynamic sectors of the Italian economy.
N.B. Copia ad uso personale. Non ne è consentita la condivisione e/o la messa a disposizione al pubblico su rete pubblica o privata,
sia in forma gratuita sia a pagamento.

© Ediz
ioni F
ranco
Angeli
131
Appendix Tab. A1 – List of the analysed Italian PV producers
Anaf Solar Fotovolt S.r.l. Scenerg S.p.a.
AV Project S.r.l. FVG Energy S.p.a. Senso Tecnologie
Azimut S.r.l. GAIA System Silfab S.p.a.
Brandoni Solare S.p.a. Helios Technology S.p.a. Soco S.n.c.
Cappello Alluminio S.r.l. Intesa Energia Solar Power S.r.l.
Clean Energy D-P S.r.l. Ioli Impianti S.r.l. Solarday S.p.a.
Depasol Eco-energy Systems Isofotòn Italia S.r.l. Solaring Italia
DG Energy Istar Solar S.r.l. Solecho
e-novasolar Kfe Solon S.p.a.
Eclipse Italia Kwpower Solsonica S.p.a.
Ecojoule KWANT S.r.l. SPS Istm S.r.l.
Eco Power S.r.l. MX Group S.p.a. Sun Technology
Ecoware On Energy S.p.a. Sunerg Solar
EL.ITAL. S.p.a. Oviera Solar Sunergy S.a.s.
Electro Solar S.r.l. Picasistemi Torri Solare S.r.l.
Enecom Italia S.r.l. Pramac Trienergia / Coenergia s.r.l.
Energica S.r.l. Pa.Sol.Italia S.p.a. V-energy S.r.l.
ENI Power S.p.a. RA NRG S.n.c. Vipiemme Solar S.r.l.
Eosolare S.r.l. Randazzo Energy WARIS
EU Energy S.r.l. Renergies Italia WINAICO
Eurener Italia S.r.l. S.D.L. Energy S.r.l. X-Group S.p.a.
Ferrania Solis S.r.l. Saiphil Sunny S.r.l.
Source: Amadeus database
N.B. Copia ad uso personale. Non ne è consentita la condivisione e/o la messa a disposizione al pubblico su rete pubblica o privata,
sia in forma gratuita sia a pagamento.

© Ediz
ioni F
ranco
Angeli
132
Tab. A2 – Top 20 Italian PV producers
Operating Revenue (Turnover)
(thousands euro)
% Change
2009 2010 09-10
AZIMUT BENETTI SPA 622.030 462.480 -25.6%
SOLON SPA 106.693 266.537 +149.8%
PRAMAC SPA 189.375 260.097 +37.3%
ECOWARE SPA 100.858 221.802 +119.9%
SUNERG SOLAR SRL 32.767 106.182 +224%
SOLSONICA SPA 40.184 105.220 +161.8%
XGROUP SPA 41.773 97.418 +133.2%
SILFAB SPA n.a. 92.647 n.a.
MX GROUP SPA 90.185 n.a. n.a.
SOLARDAY SPA 57.505 72.777 +26.5%
RENERGIES ITALIA SPA 28.911 60.492 +109.2%
BRANDONI SOLARE SPA 6.868 44.335 +545.6%
HELIOS TECHNOLOGY SPA 75.486 42.123 -44.2%
ISOFOTON ITALIA SRL 27.022 38.848 +43.7%
VIPIEMME SOLAR SRL 6.655 33.089 +397.2%
EURENER ITALIA SRL 5.016 32.492 +547.7%
ECOJOULE SRL 8.317 28.669 +244.7%
SPS ISTEM SRL 10.106 25.689 +154.2%
ISTAR SOLAR SRL 14.977 22.196 +48.2%
COENERGIA SRL 1.668 19.669 +1078.8%
Source: own calculations on Amadeus database
References Aanesen K., Heck S., Pinner D. (2012). Solar power: Darkest before dawn, McKinsey &
Co., www.mckinsey.com. Algieri B., Aquino A., Succurro M. (2011). Going “green”: trade specialisation dynamics in
the solar photovoltaic sector. Energy Policy, Springer DOI: 10.1016/j.enpol.2011.08.049 SpingerLink: http://dx.doi.org/10.1016/j.enpol.2011.08.049.
Bank of Italy (2010). Annual Report, May, www..bancaditalia.it. Battisti R. (2005). Dolce vita for PV in Italy? Refocus, Vol. 6, n. 5: 23-24. CNEL (2010). Le ricadute economiche ed occupazionali degli scenari di produzione
elettrica al 2020 in Italia, Fondazione per lo Sviluppo Sostenibile.
N.B. Copia ad uso personale. Non ne è consentita la condivisione e/o la messa a disposizione al pubblico su rete pubblica o privata,
sia in forma gratuita sia a pagamento.

© Ediz
ioni F
ranco
Angeli
133
Couture T., Gagnon Y. (2010). An analysis of feed-in tariff remuneration models: Implications for renewable energy investment. Energy Policy, Vol. 38, n. 2: 955-965.
Cucchiella F., D’Adamo I. (2012). Feasibility study of developing photovoltaic power projects in Italy: An integrated approach. Renewable and Sustainable Energy Reviews, Vol. 16: 1562-1576.
EEAG (2012). EEAG Report 2012, available at http://www.cesifo-group.de/portal/ page/portal/ifoHome/B-politik/70eeagreport.
EPIA (2011a). Market Report, available at www.epia.org. EPIA (2011b), Towards a bright 2050 energy future in Europe: Recommendation from the
PV industry, available at www.epia.org. EPIA (2010). Electricity From The Sun, available at www.epia.org. European Commission (2008). Commission Staff Working Document, Brussels, 57, 23
January 2008. Accessed March 2012 at: http://ec.europa.eu/ energy/climate_actions/doc/ 2008_res_working_document_en.pdf.
GSE (2012). Guida sulle fonti rinnovabili. GSE (2010). Rapporto Statistico 2010. Haas R., Eichhammerb W., Hubera C., Langnissc O., Lorenzonid A., Madlenere R.,
Menanteauf P., Morthorstg P.-E., Martinsh A., Oniszki A., Schleichb J., Smithj A., Vassk Z., Verbruggen A. (2004). How to promote renewable energy systems successfully and Effectively. Energy Policy, n. 32: 833-839.
Jacobson M.Z., Delucchi M.A. (2011), Providing all global energy with wind, water, and solar power, Part I: Technologies, energy resources, quantities and areas of infrastructure, and materials. Energy Policy, Vol. 39: 1154-1169.
Klein A., Held A., Ragwitz M., Resch G., Faber T. (2008). Evaluation of Different Feed-in
Tariff Design Options: Best Practice Paper for the International Feed-in Cooperation. Energy Economics Group & Fraunhofer Institute Systems and Innovation Research, Germany.
Menanteau P., Finon D., Lamy M.L. (2003). Prices versus quantities: choosing policies for promoting the development of renewable energy. Energy Policy, Vol. 31: 799-812.
Polytechnic of Milan (2012). Solar Energy Report, Politecnico di Milano School of Management, Milan.
Shen Y.C., Chou C.J, Lin C.T.R. (2011). The portfolio of renewable energy sources for achieving the three E policy goals. Energy, doi:10.1016/j.energy.2011.01.053.
Sinn H.W. (2012). The Green Paradox, MIT Press, Cambridge, MA. Tsoutsos T., Papadopoulou E., Katsiri A., Papadopoulos A.M. (2008). Supporting schemes
for renewable energy sources and their impact on reducing the emissions of greenhouse gases in Greece. Renewable and Sustainable Energy Reviews, Vol. 12: 1767-1788.
Weitzman M.L. (1974). Prices vs quantities. The Review of Economic Studies, Vol. 41 (4): 477-491.
Worldwatch Institute (2011), Jobs in Renewable EnergyExpanding, http://www.worldwatch.org/ node/5821.
N.B. Copia ad uso personale. Non ne è consentita la condivisione e/o la messa a disposizione al pubblico su rete pubblica o privata,
sia in forma gratuita sia a pagamento.

© Ediz
ioni F
ranco
Angeli
134
N.B. Copia ad uso personale. Non ne è consentita la condivisione e/o la messa a disposizione al pubblico su rete pubblica o privata,
sia in forma gratuita sia a pagamento.