09-10 - university of strathclyde
TRANSCRIPT

1
APPENDIX A
SAMPLING LOCATIONS

2
SAMPLING LOCATIONS
The major sources and export sites of freshwater in the estuary were sampled monthly to determine their mercury concentrations and calculate a mercury budget for the Delta. Sacramento River @ Greene’s Landing. N38-20.721 W121-32.812 River sampled from the end of the U.S. Bureau of Reclamation water quality pier off Randall Island Road. Site is about 3 miles downstream of Freeport. Samples were collected on outgoing tide. Flow rates were obtained from the California Department of Water Resources web site for Freeport (FPT) at HTTP://cdec.water.ca.gov. San Joaquin @ Vernalis. N37-40.510 W121-15.994 Sample collected off middle of Airport Way Bridge (Rd J3). Site is above tidal influence. Flow rates were obtained from the California Department of Water Resources web site for Vernalis (VNS) at HTTP://cdec.water.ca.gov. Mokelumne-Consumnes Rivers. N38-15.276 W121-27.075 Sampled by boat about one mile downstream of the I-5 bridge on outgoing tide. Flow rate was estimated by summing the discharge from Camanche Reservoir (CMN) and Cosumnes River at Michigan Bar (MHB). Discharge rates for both sites can be obtained from the California Department of Water Resources web site at HTTP://cdec.water.ca.gov. Prospect Slough N38-19.216 W121-39.236 Sampled by boat at junction of Prospect Slough and Toe drain. Prospect Slough is the main channel draining the Yolo Bypass. Samples collected on an outgoing tide. If the Slough’s discharge rate is above 1,000 cfs then it is reported on the California Department of Water Resources web site under the heading of YBY. At lower flows, discharge was estimated by summing the flow of Cache Creek at Yolo and Putah Creek at Winters and subtracting the Solano Irrigation District’s diversion on the South Putah Canal. The Cache and Putah data sets are provisional and were obtained from the U.S. Geological Survey. Solano Irrigation District diversions were obtained from Don Busby (personal communication). Putah Creek N38-31.067 W121-41.710 Sampled by wading into mid stream at Mace BLVD bridge. Provisional discharge rates for the Creek at Winters were obtained from the U.S. Geological Survey and was corrected for the Solano Irrigation District’s diversion on the South Putah Canal (personal communication Don Busby). Delta Mendota Canal N37-48.735 W121-34.713 Sample collected by lowering bailer into mid canal off Byron HWY (County Road J4). Flow data for the Canal was obtained from the U.S. Bureau of Reclamation’s provisional operations schedule (personal communication, Richard Oltmann). State Water Project. N37-46.890 W121-36.978 Sample collected by boat from input canal to Bethany Reservoir. Bethany is the first lift station on the State Water Project canal system about 1 mile south of Clifton Court in the Bay-Delta Estuary. Diversion data for the State Water Project was obtained from the U.S. Bureau of Reclamation’s provisional operation schedule (personal communication, Richard Oltmann). X2. X2 is defined as that point in the Estuary with 2 o/oo salinity on the bottom. The position of X2 varies as a function of freshwater outflow and tidal cycle. Samples were collected by boat after verifying the salt content of the bottom water. The location of X2 varied between the Cities of Martinez and Pittsburg.
DELTA ISLAND MAIN DRAIN SAMPLES Samples were taken from representative Delta Island drains in June and July to ascertain whether the islands were a net source or sink for mercury. The initial strategy was to sample

3
mercury concentrations in main drains of a set of representative peat and mineral islands. However, most island drains were not actively pumping when we attempted to collect the samples. Therefore, the initial strategy was abandoned and samples were only collected from islands with active flow. All the samples were taken from the main drain at or within a quarter mile of the pump house so as to collect water as representative as possible of what was being discharged back into the delta. Staten Island N38-09.363 W121-13.011 Sample collected by wading into the drainage ditch several hundred yards from pump house along the Staten Island Road. Empire Tract N38-03.607 W121-29.909 Sample collected from culvert at intersection of Eight Mile and Empire Tract Roads. Lower Jones Main Drain Sample collected from middle of drain off the pump house platform. Site is located of Lower Jones Road. Twitchell Island Drain N 38-05.799 W121-39.05 Sample collected from middle of drain off the pump house platform. Pump house is off Brannon Island Road. Upper Jones Main Drain N37-56.353 W121-31.872 Sample collected from middle of drain off the pump house platform. Site located off Bacon Island Road.

4
APPENDIX B
QUALITY ASSURANCE AND QUALITY CONTROL TABLES

Table 1. Summary of travel blanks analyzed for raw and filtered total and methyl mercury. Twelve of the 67 analyses for total mercury were above the program’s quality assurance/quality control’s detection limit of 0.2 ng/l. These are noted in bold. Similarly, 4 of the methyl mercury analyses were above the detection limit of 0.02 ng/l. The probable cause and resulting corrective action undertaken are discussed in the text. TOTAL MERCURY (ng/l) METHYL MERCURY (ng/l)1
DATE SITE RAW FILTERED RAW FILTERED 27 Mar Putah Ck Blank 0.06 0.21 0.02U 0.02U
Sacramento R. Blank 0.23 1.05 0.02U 0.02U 27 April Putah Ck Blank 0.11 0.24 0.02U 0.02U
Mokelumne R. Blank 0.13 0.11 0.02U 0.02U 30 May Sacramento R. Blank 0.01 0.15 0.055 0.02U
San Joaquin R. Blank 0.09 0.15 0.098 0.02U 26 June Putah Ck Blank 0.05 0.07 0.02U 0.02U
Prospect Sl. Blank 0.06 0.05 0.02U 0.02U 24 July Delta Mendota Canal Blank 0.08 0.06 0.02U 0.02U
Field Blank 0.09 0.07 0.02U 0.02U 21 August Prospect Sl Blank 0.08 0.05 0.02U 0.02U
X2 Blank 0.19 0.23 0.071 0.02U Field Blank 1.10 - 0.037 -
28 September State Water Project Blank 0.12 0.20 0.01U 0.02U Field Blank 0.18 0.11 0.02U 0.02U
29 October Field Blank 0.57 0.49 0.02U 0.02U Prospect Sl old Blank 0.44 0.61 0.02U 0.02U Green Landing new blank 0.48 0.70 0.02U 0.02U
18 December Prospect Sl new blank 0.02 0.02 0.01U 0.01U 29 January Greens Landing Blank 0.17 0.02 0.02U 0.02U
X2 Blank 0.02 0.11 0.02 U 0.02U 26 Feb Greens Landing Blank 0.02 0.04 0.01 U 0.01U
X2 Blank 0.02 0.02 0.01U 0.01U 25 March Greens Landing Blank 0.02 0.02 0.01U 0.01U
Old Blank 0.02 0.02 0.01U 0.01U 29 April Prospect Slough 0.02 0.02 0.01U 0.01U
1 The U denotes that the value was below the laboratories analytical detection limit.

6
Table 1. (Continued)
TOTAL MERCURY (ng/l) METHYL MERCURY (ng/l)2
DATE SITE RAW FILTERED RAW FILTERED 29 May Prospect Slough Blank 0.02 0.02 0.01U 0.01U
Blank 0.05 0.04 0.01U 0.01U 24 June Yolo Bypass 0.12 0.02 0.01U 0.01U
Blank 0.14 0.07 0.01U 0.01U 31 July Field Blank 0.02 0.02 0.01U 0.01U
Mokelumne R 0.02 0.09 0.01U 0.01U 27 August Prospect Slough 0.02 0.02 0.01U 0.01U
1 Oct Prospect Slough 0.02 0.02 0.01U 0.01U
2 The U denotes that the value was below the laboratories analytical detection limit.

7
Table 2. Summary of mercury and total suspended solid (TSS) concentrations in replicate field samples collected simultaneously. Relative percent difference (RPD) is defined as the difference of the two measurements divided by their average and multiplied by 100. Summary statistics are provided at the bottom of the table. DATE SITE RAW
Hg (ng/l)
FILTERED Hg
(ng/l)
RAW METHYL Hg
(ng/l)
FILTERED METHYL Hg
(ng/l)
TSS (mg/l)
29 Mar Prospect Sl #1 32.8 1.40 0.722 0.151 129 Prospect Sl #2 44.3 2.38 0.681 0.138 136 RPD 30% 52% 6% 9% 5% Sacramento R #1 8.70 1.14 0.148 0.0305 42 Sacramento R #2 8.96 1.05 0.149 0.0481 41 RPD 3% 8% 1% 45% 2%
24 Apr Mokelumne R #1 7.42 1.28 0.291 0.175 16 Mokelumne R #2 7.56 1.63 0.268 0.155 13 RPD 2% 24% 8% 12% 21% Prospect Sl #1 21.19 1.30 0.361 0.0646 76 Prospect Sl #2 20.79 1.36 0.433 0.129 87 RPD 2% 5% 18% 67% 13%
30 May Mokelumne R #1 5.60 1.07 0.290 0.156 11 Mokelumne R #2 4.83 0.94 0.290 0.134 13 RPD 15% 13% 0% 15% 17% State Water Proj #1 3.70 0.92 0.165 0.0279 20 State Water Proj #2 3.88 0.75 0.122 0.0802 20 RPD 5% 20% 30% 97% 0%
26 Jun Prospect Sl #1 32.96 1.34 0.243 0.109 152 Prospect Sl #2 30.57 1.28 0.234 0.0882 159 RPD 8% 5% 4% 21% 5% Putah Ck #1 13.06 0.86 0.356 0.116 37 Putah Ck #2 13.05 0.97 0.341 0.296 32 RPD 0% 12% 4% 87% 14%
24 Jul San Joaquin R #1 7.79 1.18 0.108 0.0220U 73 San Joaquin R #2 6.72 1.48 0.127 0.0222U 61 RPD 15% 23% 16% 0% 18%
21 Aug Prospect Sl #1 22.7 2.25 0.186 0.0664 111
Prospect Sl #2 25.0 1.38 0.230 0.0762 101 RPD 10% 48% 21% 14% 9% X2 #1 9.88 0.60 0.0209U 0.0211U 31 X2 #2 9.55 0.54 0.0209U 0.0210U 24 RPD 3% 11% 0% 0% 25
24 Sep San Joaquin R #1 6.25 0.790 0.103 0.0420 45

8
Table 2. (Continued) DATE SITE RAW
Hg (ng/l)
FILTERED Hg
(ng/l)
RAW METHYL Hg
(ng/l)
FILTERED METHYL Hg
(ng/l)
TSS (mg/l)
San Joaquin R #2 6.17 0.770 0.0942 0.0243 46 RPD 1% 3% 9% 53% 2%
29 Oct Greens Landing #1 3.54 1.31 0.0847 0.0 17 Greens Landing #2 4 1.26 0.0856 0 17 RPD 12% 4% 1% 0% 0%
18 Dec Greens Landing #1 2.89 0.33 0.0869 0.0581 19 Greens Landing #2 3.1 0.42 0.0912 0.0649 16 RPD 7% 24% 5% 11% 17%
18 Dec Prospect Slough #1 14.6 1.17 0.251 0.124 48 Prospect Slough #2 13.5 1.25 0.287 0.0837 51 RPD 8% 7% 13% 39% 6%
28 Jan Greens Landing #1 20.5 2.37 0.24 0.0532 162 Greens Landing #2 25.27 2.73 0.248 0.062 173 RPD 21% 14% 3% 15% 7%
26 Feb Greens Landing #1 13.5 2.58 0.159 0.0865 Greens Landing #2 15.6 2.54 0.194 0.0787 RPD 14% 2% 20% 9%
25 Mar Greens Landing #1 3.56 0.74 0.0825 0.0141U - Greens Landing #2 3.28 0.76 0.0856 0.0142U - RPD 8% 3% 4% 0%
29 April Prospect Slough #1 25.79 0.77 0.142 0.0141U 55 Prospect Slough #2 16.96 0.8 0.146 0.0142U 67 RPD 41% 4% 3% 0% 20%
28 May Prospect Slough #1 49.1 1.37 0.211 0.0943 198 Prospect Slough #2 40.50 1.470 0.2470 0.0429 172 RPD 19% 7% 16% 75% 14%
26 Jun Prospect Slough #1 37.7 1.23 0.204 0.054 Prospect Slough #2 34.70 3.16 0.208 0.053 RPD 8% 88% 2% 2%
31 July Mokelumne #1 6.45 1.17 0.148 0.0423 Mokelumne #2 7.46 1.12 0.19 0.0573 RPD 15% 4% 23% 30%
27 Aug Prospect Slough #1 28.6 1.35 0.139 0.0506 Prospect Slough #2 27.7 1.38 0.142 0.0433 RPD 3% 2% 2% 16%
1 Oct Prospect Slough #1 18.30 1.120 0.1190 0.0139U Prospect Slough #2 17.7 0.968 0.1240 0.0139U

9
Table 2. (Continued) DATE SITE RAW
Hg (ng/l)
FILTERED Hg
(ng/l)
RAW METHYL Hg
(ng/l)
FILTERED METHYL Hg
(ng/l)
TSS (mg/l)
RPD 3% 15% 4% 0% RANGE 0-41% 2-88% 0-30% 0-97% 0-25% MEAN 10.5% 16.6% 8.9% 25.7% 10.8%

10
Table 3. Summary of the repeated laboratory analysis of the same field samples. Relative percent difference (RPD) is defined as the difference of the two measurements divided by their average and multiplied by 100. Summary statistics are provided at the bottom of the table.
Date Site Raw Hg
(ng/l)
Filtered Hg
(ng/l)
Raw MMHg (ng/l)
Filtered MMHg (ng/l)
RPD (%)
29 Mar San Joaquin River @ Vernalis 0.164 1% San Joaquin River @ Vernalis 0.165
29 Mar Putah Creek 0.036 52% Putah Creek 0.061
29 Mar X2 1.54 12% X2 1.74
29 Mar State Water Project 1.77 2% State Water Project 1.81
24 Apr X2 0.081 26% X2 0.106
24 Apr Prospect Slough 0.361 1% Prospect Slough 0.358
24 Apr Putah Creek 0.86 9% Putah Creek 0.94
24 Apr San Joaquin River @ Vernalis 1.27 8% San Joaquin River @ Vernalis 1.38
24 Apr State Water Project 1.29 9% State Water Project 1.41
30 May State Water Project 0.165 4% State Water Project 0.158
30 May State Water Project 0.027 40% State Water Project 0.042
30 May Mokelumne 1.07 14% Mokelumne 0.93
30 May State Water Project 0.92 13% State Water Project 0.81
29 June Greene’s Landing 0.716 21% Greene’s Landing 0.088
29 Jun Lower Jones Tract 1.14 7% Lower Jones Tract 1.06
29 Jun Lower Jones Tract 0.302 9% Lower Jones Tract 0.277
29 Jun Lower Jones Tract 0.239 8% Lower Jones Tract 0.221
29 Jun Delta Mendota Canal 0.71 22% Delta Mendota Canal 0.57
28 July Putah Creek 0.281 13% Putah Creek 0.321
28 July Twitchell Island 1.50 20% Twitchell Island 1.23
28 July Upper Jones Island 0.129 6% Upper Jones Island 0.146 Upper Jones Island 0.136

11
Table 3. (Continued).
Date Site Raw Hg
(ng/l)
Filtered Hg
(ng/l)
Raw MMHg (ng/l)
Filtered MMHg (ng/l)
RPD (%)
28 July Mokelumne River 1.01 10% Mokelumne River 0.91
21 Aug X2 0.02U 0% X2 0.020U
21 Aug Mokelumne River 1.18 7% Mokelumne River 1.10
21 Aug Mokelumne River 0.097 5% Mokelumne River 0.092
21 Aug Franks Tract 0.59 19% Franks Tract 0.71
21 Aug Franks Tract 0.079 5% Franks Tract 0.083
21 Aug Sherman Island 0.079 1% Sherman Island 0.07
28 Sept Prospect Slough 0.114 23% Prospect Slough 0.144
28 Sept Prospect Slough 0.030 175% Prospect Slough 0.020U
28 Sept Franks Tract 1.63 3% Franks Tract 1.68
29 Oct Sherman Lake 4.92 7% 5.26
29 Oct Sulfur Creek 1801.5 19% 1482.5
29 Oct Vernalis 0.158 3% 0.163
29 Oct X2 0.02U 0% 0.02U
18 Dec Mokelumne 0.095 1% 0.094
18 Dec Propect Slough 0.287 2% 0.294
18 Dec Propect Slough 0.083 43% 0.129
18 Dec Greens Landing #1 3.15 9% 2.89
18 Dec Vernalis 3.12 9% 3.41
29 Jan Vernalis 0.239 8% 0.220
29 Jan Mokelumne 0.121 0% 0.120
29 Jan SWP 1.66 2% 1.70
29 Jan Greens Landing 20.5 11% 22.8
26 Feb Greens Landing I 13.5 8% 14.6
26 Feb X2 15.7 5%

12
Table 3. (Continued).
Date Site Raw Hg
(ng/l)
Filtered Hg
(ng/l)
Raw MMHg (ng/l)
Filtered MMHg (ng/l)
RPD (%)
16.5 26 Feb Vernalis 10.5 7%
11.7 26 Feb Putah Creek 0.290 5%
0.276 26 Feb Putah Creek 0.077 17%
0.065 28 Mar DMC 0.092 0%
0.093 28 Mar X2 0.165 14%
0.144 28 Mar Franks Tract 0.122 6^
0.115 28 Mar Putah Creek 24.8 11%
27.7 28 Mar DMC 4.40 4%
4.59 28 Mar X2 2.00 9%
1.83 29 April Putah Creek 0.148 1%
0.146 29 April Cache Creek 0.160 3%
0.165 29 April Franks Tract 0.042 98%
0.014 29 April Feather River 0.190 8%
0.175 29 April Colusa 2.70 12%
2.40 29 April Cache Creek 9.08 5%
8.27 29 May Cache Creek 0.261 14%
0.299 29 May Mud Slough 0.583 2%
0.571 29 May Mokelumne River 0.033 30%
0.044 29 May Propect Slough II 40.5 6%
42.8 29 May Cache Creek 8.54 7%
8.00 29 May Greens Landing 3.63 2%
3.75 29 May Salinity 3 10.2 2%
10.4 26 June Vernalis 9.98 6%
10.6 26 June X2 9.21 14%
10.6

13
Table 3. (Continued).
Date Site Raw Hg
(ng/l)
Filtered Hg
(ng/l)
Raw MMHg (ng/l)
Filtered MMHg (ng/l)
RPD (%)
26 June Yolo Bypass 1.23 11% 1.38
26 June Mud Slough 5.28 10% 5.82
26 June Yolo N. HWY 80 3.09 19% 3.73
26 June Putah Creek 0.105 44% 0.067
26 June Cache Creek 0.202 8% 0.186
26 June Yolo Bypass 0.208 12% 0.234
26 June Freeport I 0.040 77% 0.017
26 June Conway Ranch 0.134 0% 0.134
26 June Mud Slough 0.509 18% 0.608 0.529
26 June Mud Slough 1.14 2% 1.16
26 June Putah Creek 0.220 30% 0.164
31 July Putah Creek 1.68 14% 1.94
31 July Cache Creek 0.68 12% 0.77
31 July Middle River 1.01 7% 1.08
31 July Mokelumne River 1.17 5% 1.23
31 July Rio Vista 4.69 13% 5.35
31 July Cache Creek 0.366 29% 0.488 0.468
31 July X1 0.040 5% 0.038
31 July Franks Tract 0.038 3% 0.040
31 July DMC 0.064 21% 0.052
27 Aug Franks Tract 0.62 6% 0.59
27 Aug Putah Creek 4.03 7% 4.31
27 Aug Georgiana Slough 0.062 25% 0.080
27 Aug Prospect Sl II 0.142 7%

14
Table 3. (Continued).
Date Site Raw Hg
(ng/l)
Filtered Hg
(ng/l)
Raw MMHg (ng/l)
Filtered MMHg (ng/l)
RPD (%)
0.153 27 Aug Greens Landing 0.071 0%
0.071 10 Oct Prospect Slough I 0.119 22%
0.148 10 Oct Georgiana Slough 0.015U 0%
0.015U 10 Oct Putah Creek 0.69 21%
0.85 10 Oct Cache Creek 15.0 0%
15.0 AVERAGE RPD 7% 11% 11% 34% RPD RANGE 0-19% 3-22% 0-44% 0-175% N 22 23 37 17

15
Table 4. Summary of methyl mercury spikes and their replicated percent recovery in raw and filtered site water. DATE SITE WATER
FORM AMBIENT
CONC (ng/l)
SPIKE (ng/l)
RECOVERY IN
DUPLICATE SPIKES
(%)
RPD (%)
29 Mar Putah Ck raw 0.108 1.75 101, 99 2 29 Mar Sacramento R. raw 0.149 1.72 93, 99 7 27 April Putah Ck. raw 0.132 1.75 107, 106 0 27 April Mokelumne R. raw 0.268 1.75 107, 73 38 30 May San Joaquin R. raw 0.134 1.75 111, 90 21 30 May Sacramento R. raw 0.336 1.75 99, 99 0 29 Jun Mokelumne R. raw 0.114 3.44 95, 101 6 29 Jun San Joaquin R. raw 0.220 3.45 98, 106 9 29 Jun State Water Project raw 0.02u 3.52 105, 106 1 24 Aug Putah Ck raw 0.205 3.75 101, 104 2 24 Aug Sacramento R. raw 0.110 3.44 102, 98 5 28 Sept Sacramento R. raw 0.051 3.51 107, 118 14 28 Oct Putah Creek raw 0.114 3.46 97,102 5 28 Oct Sherman Lake raw 0.0227u 3.46 96,93 3 18 Dec Greene landing #I raw 0.0869 0.630 99,105 6 18 Dec Prospect slough #1 raw 0.251 0.631 104,93 11 18 Dec Vernalis raw 0.102 0.638 104,109 5 29 Jan DMC raw 0.144 0.637 98,103 5 29 Jan Putah CK raw 0.0780 0.623 97,102 5 28 Feb Vernalis raw 0.180 0.641 97,86 12 28 Feb Prospect Slough raw 0.414 0.643 97,119 19 25 Mar Cache Ck raw 0.203 0.633 87,107 20 25 Mar Greene Landing raw 0.0825 0.637 103,102 1 25 Mar Mud Slough raw 0.539 0.625 91,102 11 29 April Greene Landing raw 0.116 0.787 111,97 14 29 April Georgiana Slough raw 0.0833 0.787 111,97 14 29 April X1 raw 0.0528 0.789 97,98 1 29 April Sacramento R. raw 0.150 0.797 101,100 1 29 May Greene Landing raw 0.0986 0.632 101,101 1 29 May Freeport raw 0.0904 0.633 98,100 2 29 May Putah Ck raw 0.118 0.633 100,97 3 29 May Putah Ck raw 0.131 0638 104,107 3 26 Jun Putah Ck raw 0.105 0.639 87,96 9 26 Jun Putah Ck raw 0.113 0.639 112,101 11 26 Jun Franks Tract raw 0.0708 0.643 91,96 5 26 Jun Freeport raw 0.0675 0.643 107,98 9 26 Jun Greene Landing raw 0.0878 0.631 104,92 12 26 Jun Yolo North raw 0.504 0.637 100,93 7 26 Jun Putah Ck raw 0.149 0.632 108,111 3 31 July Putah Ck raw 0.158 0.631 100,94 6 31 July Mokelumne R raw 0.186 0.632 97,102 5 31 July Middle R. raw 0.0244 0.650 99,102 3 31 July X2 raw 0.0701 0.632 94,107 13 31 July Putah Ck raw 0.0980 0.644 90,103 13 29 Aug Putah Ck raw 0.104 0.631 90,106 16

16
Table 4. (Continued) DATE SITE WATER
FORM AMBIENT
CONC (ng/l)
SPIKE (ng/l)
RECOVERY IN
DUPLICATE SPIKES
(%)
RPD (%)
29 Aug Putah Ck raw 0.157 0.643 95,106 11 29 Aug Mokelumne R raw 0.0650 0.650 109,90 19 29 Aug SWP raw 0.0u 0.636 111,104 7 1 Oct Mokelumne raw 0.184 0.643 101,97 4 1 Oct Putah Ck raw 0.126 0.633 102,100 2
MEAN % RECOVERY 100.3
AVE RPD OF DUPLICATE SPIKES 8% RPD RANGE 0-38%
N 50
29 Mar San Joaquin R filtered 0.0512 1.78 107, 100 7 29 Mar X2 filtered 0.0583 1.77 90, 103 14 27 April Prospect Slough filtered 0.0646 1.76 118, 103 14 27 April State Water Project filtered 0.0214u 1.78 88, 98 11 30 May San Joaquin R. filtered 0.0713 1.74 100, 103 3 30 May State Water Project filtered 0.0802 1.76 94, 102 11 29 Jun Putah Ck filtered 0.116 3.52 102, 86 17 29 Jun Empire Tract filtered 0.0503 3.52 96, 96 0 29 Jun Twitchell Island filtered 0.229 3.52 104, 103 1 24 Aug X2 filtered 0.000u 3.44 103, 93 10 28 Sept San Joaquin R. filtered 0.0420 3.43 102, 89 14 28 Oct White Slough filtered 0.0215u 3.50 100,101 1 28 Oct Vernalis filtered 0.0421 3.51 106,103 3 18 Dec Putah Ck filtered 0.0504 0.635 99,88 11 18 Dec Vernalis filtered 0.0234 0.624 103,102 1 29 Jan Green Landing I filtered 0.0532 0.630 91,97 6 29 Jan Putah Creek filtered 0.0304 0.624 112,99 13 28 Feb SWP filtered 0.0508 0.627 107,105 2 28 Feb Greens Landing filtered 0.0787 0.616 96,92 4 25 Mar Putah Ck filtered 0.0769 0.629 102,104 2 25 Mar Georgiana Sl filtered 0.0u 0.623 91,105 14 25 Mar Mud Slough filtered 0.0901 0.628 103,101 2 29 April Feather R. filtered 0.109 0.811 90,104 14 29 April X2 filtered 0.0u 0.790 107,98 9 29 April Sutter Bypass filtered 0.0192 0.807 94,105 11 29 May Cache Ck filtered 0.0332 0.638 101,102 1 26 Jun Georgiana filtered 0.0321 0.644 98,95 3 26 Jun Rio Vista filtered 0.0173 0.631 105,101 4 26 Jun Vernalis filtered 0.0u 0.637 107,100 7 26 Jun Yolo Bypass filtered 0.0540 0.632 100,81 19 31 July Mokelumne filtered 0.0423 0.634 105,98 7 31 July N. F. Mokelumne filtered 0.0508 0.626 94,104 10 31 July Freeport filtered 0.0546 0.628 100,89 11 29 Aug Prospect II filtered 0.0433 0.790 90,89 1 29 Aug Mokelumne R. filtered 0.0538 0.794 106,115 9 29 Aug Georgiana Sl filtered 0.0382 0.642 96,91 5

17
Table 4. (Continued). DATE SITE WATER
FORM AMBIENT
CONC (ng/l)
SPIKE (ng/l)
RECOVERY IN
DUPLICATE SPIKES
(%)
RPD (%)
1 Oct X2 filtered 0.0U 0.631 107,97 10 1 Oct Greene Landing filtered 0.088 0.640 94,102 8
MEAN % RECOVERY 99.4
AVE RPD OF DUPLICATE SPIKES 8% RPD RANGE 0-19%
N 38

18
Table 5. Summary of inorganic mercury spikes and their replicated percent recovery in site water. The relative percent difference is defined at the difference between values divided by their average and multiplied by 100. DATE SITE WATER
FORM BACKGROUND
(ng/l) SPIKE (ng/l)
RECOVERY IN
DUPLICATE SPIKES
(%)
RPD (%)
27 Mar X2 filtered 1.54 1.71 108,123 13 27 Mar State Water Project filtered 1.77 1.96 94,109 15 24 April Putah Creek filtered 0.86 0.98 126,164 26 24 April San Joaquin River filtered 1.27 1.24 106,109 3 24 April State Water Project filtered 1.29 1.24 111,122 9 30 May Mokelumne River filtered 1.07 0.98 117,102 14 30 May State Water Project filtered 0.92 0.98 96,84 14 29 Jun State Water Project filtered 0.82 0.99 98,109 10 29 Jun Prospect Slough filtered 1.34 0.74 115,124 8 24 July Staten Island filtered 1.74 2.97 112,119 7 24 July Upper Jones Island filtered 0.86 2.99 111,118 8 24 Sept Sherman Island filtered 0.42 2.98 93,100 7 18 Dec Greene Landing filtered 0.42 4.00 91,101 10 28 Jan Greene Landing II filtered 2.73 3.99 102,111 9 28 Feb Greene Landing II filtered 2.54 2.00 125,129 4 28 Feb Mokelumne filtered 5.39 4.00 93,93 0 25 Mar Vernalis filtered 2.95 1.99 110,111 1 25 Mar X2 filtered 4.11 1.99 110,117 7 29 April Feather R. filtered 0.60 2.00 71,75,120 56 29 April Greene Landing filtered 0.58 2.00 74,73 1 28 May SWP filtered 0.86 2.00 118,130 12 28 May Mud Sl filtered 0.49 2.00 102,124 20 28 May Greene Landing filtered 0.50 2.00 107,116 11 26 Jun Vernalis filtered 0.25 2.02 105,121 14 26 Jun Mud Slough filtered 3.55 4.04 110,113 3 26 Jun Yolo North filtered 3.09 4.04 120,123 3 31 July Putah Ck filtered 2.61 2.00 103,108 5 31 July Mokelumne filtered 1.12 2.00 111,105 6 1 Oct Putah Ck filtered 0.69 2.00 111,113 2 1 Oct Cache Ck filtered 0.85 2.00 105,96 9
MEAN % RECOVERY 108%
AVE RPD OF DUPLICATE SPIKES 10% RPD RANGE 0-56%
N 30
18 Dec Putah Ck raw 0.49 3.99 97,105 8 28 Jan Vernalis raw 7.09 3.99 103,80 25 28 Feb SWP raw 2.46 4.00 84,79 6 25 Mar SWP raw 7.49 3.99 102,107 5 29 April Propect Slough raw 25.79 2.00 115,121 6 28 May DMC raw 3.41 4.04 102,101 1 28 May Putah Ck raw 1.90 2.02 113,102 11 26 Jun Franks Tract raw 1.31 2.02 113,120 7

19
Table 5. (Continued). DATE SITE WATER
FORM BACKGROUND
(ng/l) SPIKE (ng/l)
RECOVERY IN
DUPLICATE SPIKES
(%)
RPD (%)
26 Jun Mokelumne raw 7.35 8.08 119,108 11 31 July Putah Ck raw 4.27 2.02 113,102 11 31 July Franks Tract raw 0.53 2.00 107,120 13 31 July Knights Landing raw 3.11 2.00 118,110 8 27 Aug Franks Tract raw 0.59 2.00 109,105 4 27 Aug Putah Ck raw 4.03 4.00 109,102 7
MEAN % RECOVERY 106 AVE RPD OF DUPLICATE SPIKES 9%
RPD RANGE 1-25% N 14

20
APPENDIX C
SUMMARY OF WATER QUALITY DATA

21
SACRAMENTO RIVER @ GREENE LANDING (N38 20.721 W121 32.812) Date
THg (ng/l)
DHg (ng/l)
TMMHg
(ng/l)
DMMHg
(ng/l)
EC
(µmhos/cm)
Temp (OC)
TSS
(mg/l)
VSS
(mg/l)
Chloro (µg/l)
Phaeo (µg/l)
Flow
(af/mo)
SO4
(mg/l)
28-29 Mar 2000 8.83 1.10 0.148 0.039 150 41 3,594,733 24-25 Apr 6.59 1.19 0.117 0.022U 138 17.0 38 1,583,261 30-31 May 3.36 0.74 0.336 0.074 128 20.1 16 1,254,353 26-27 Jun 3.36 0.58 0.072 0.042 112 21.6 15 975,312 19-21 July 3.06 0.67 0.052 0.022 273 21.2 17 1,285,548 21-22 Aug 3.43 0.64 0.110 0.090 167 21.0 20 1,080,689 26-27 Sept 3.04 0.60 0.051 0.053 159 20.0 17 900,618 7 28-29 Oct 3.77 1.28 0.085 0.022U 175 14.1 17 732635.64 11 18-19 Dec 3.00 0.38 0.089 0.062 139 10.0 18 856959.84 12 29-30 Jan 2001 22.89 2.55 0.244 0.058 94 7.6 167 1072977.84 14 26-27 Feb 14.55 2.56 0.177 0.083 138 9.9 81 5.4 1.0 2.4 1175597.28 10 26-27 Mar 3.42 0.75 0.084 0.015 174 17.6 16 1.6 0.8 0.6 1532622.96 10 29-30 Apr 4.52 0.58 0.113 0.025 189 20.8 30 2.8 4.1 3.4 743596.92 10 27-28 May 3.63 0.5 0.099 0.034 180 22.0 21 1.6 6.1 6.2 574128.72 12 29-30 Jun 4.46 0.15 0.088 0.013U 145 21.6 21 1.6 3.0 2.8 742076.28 7 30-31 July 4.31 0.28 0.108 0.0197 13 1.0 2.8 2.2 923277.96 7 27-28 Aug 5.57 0.68 0.071 0.0185 209 22.4 21 1.7 2.0 2.3 820072 9 1-2 Oct 2.13 0.45 0.095 0.0888 167 20.7 8 1.2 3.2 4.0 746763 6
22
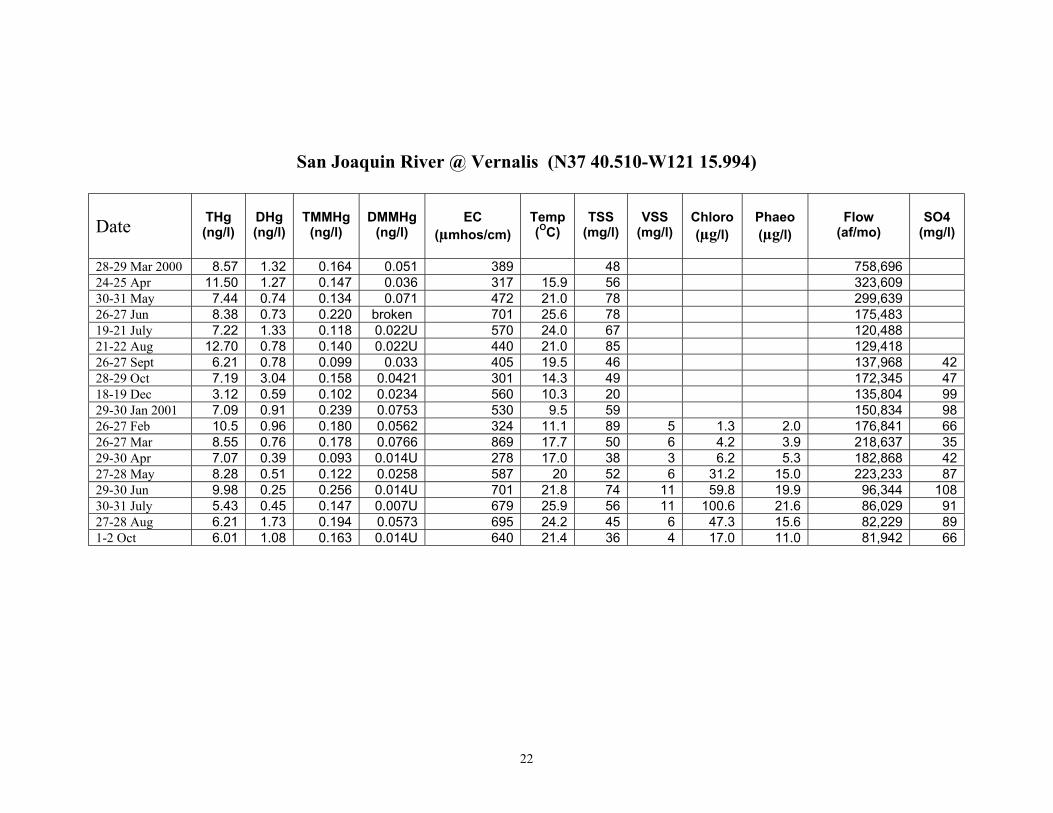
San Joaquin River @ Vernalis (N37 40.510-W121 15.994) Date
THg (ng/l)
DHg (ng/l)
TMMHg
(ng/l)
DMMHg
(ng/l)
EC
(µmhos/cm)
Temp (OC)
TSS
(mg/l)
VSS
(mg/l)
Chloro (µg/l)
Phaeo (µg/l)
Flow
(af/mo)
SO4
(mg/l)
28-29 Mar 2000 8.57 1.32 0.164 0.051 389 48 758,696 24-25 Apr 11.50 1.27 0.147 0.036 317 15.9 56 323,609 30-31 May 7.44 0.74 0.134 0.071 472 21.0 78 299,639 26-27 Jun 8.38 0.73 0.220 broken 701 25.6 78 175,483 19-21 July 7.22 1.33 0.118 0.022U 570 24.0 67 120,488 21-22 Aug 12.70 0.78 0.140 0.022U 440 21.0 85 129,418 26-27 Sept 6.21 0.78 0.099 0.033 405 19.5 46 137,968 42 28-29 Oct 7.19 3.04 0.158 0.0421 301 14.3 49 172,345 47 18-19 Dec 3.12 0.59 0.102 0.0234 560 10.3 20 135,804 99 29-30 Jan 2001 7.09 0.91 0.239 0.0753 530 9.5 59 150,834 98 26-27 Feb 10.5 0.96 0.180 0.0562 324 11.1 89 5 1.3 2.0 176,841 66 26-27 Mar 8.55 0.76 0.178 0.0766 869 17.7 50 6 4.2 3.9 218,637 35 29-30 Apr 7.07 0.39 0.093 0.014U 278 17.0 38 3 6.2 5.3 182,868 42 27-28 May 8.28 0.51 0.122 0.0258 587 20 52 6 31.2 15.0 223,233 87 29-30 Jun 9.98 0.25 0.256 0.014U 701 21.8 74 11 59.8 19.9 96,344 108 30-31 July 5.43 0.45 0.147 0.007U 679 25.9 56 11 100.6 21.6 86,029 91 27-28 Aug 6.21 1.73 0.194 0.0573 695 24.2 45 6 47.3 15.6 82,229 89 1-2 Oct 6.01 1.08 0.163 0.014U 640 21.4 36 4 17.0 11.0 81,942 66
23
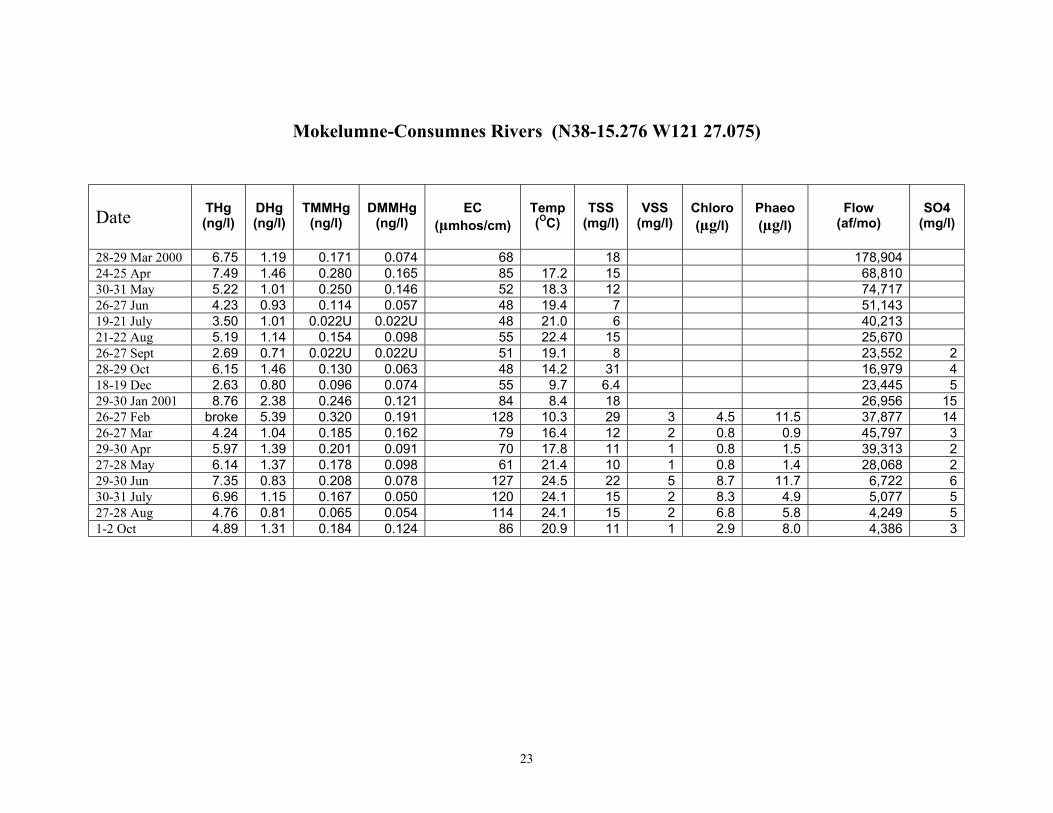
Mokelumne-Consumnes Rivers (N38-15.276 W121 27.075) Date
THg (ng/l)
DHg (ng/l)
TMMHg
(ng/l)
DMMHg
(ng/l)
EC
(µmhos/cm)
Temp (OC)
TSS
(mg/l)
VSS
(mg/l)
Chloro (µg/l)
Phaeo (µg/l)
Flow
(af/mo)
SO4
(mg/l)
28-29 Mar 2000 6.75 1.19 0.171 0.074 68 18 178,904 24-25 Apr 7.49 1.46 0.280 0.165 85 17.2 15 68,810 30-31 May 5.22 1.01 0.250 0.146 52 18.3 12 74,717 26-27 Jun 4.23 0.93 0.114 0.057 48 19.4 7 51,143 19-21 July 3.50 1.01 0.022U 0.022U 48 21.0 6 40,213 21-22 Aug 5.19 1.14 0.154 0.098 55 22.4 15 25,670 26-27 Sept 2.69 0.71 0.022U 0.022U 51 19.1 8 23,552 2 28-29 Oct 6.15 1.46 0.130 0.063 48 14.2 31 16,979 4 18-19 Dec 2.63 0.80 0.096 0.074 55 9.7 6.4 23,445 5 29-30 Jan 2001 8.76 2.38 0.246 0.121 84 8.4 18 26,956 15 26-27 Feb broke 5.39 0.320 0.191 128 10.3 29 3 4.5 11.5 37,877 14 26-27 Mar 4.24 1.04 0.185 0.162 79 16.4 12 2 0.8 0.9 45,797 3 29-30 Apr 5.97 1.39 0.201 0.091 70 17.8 11 1 0.8 1.5 39,313 2 27-28 May 6.14 1.37 0.178 0.098 61 21.4 10 1 0.8 1.4 28,068 2 29-30 Jun 7.35 0.83 0.208 0.078 127 24.5 22 5 8.7 11.7 6,722 6 30-31 July 6.96 1.15 0.167 0.050 120 24.1 15 2 8.3 4.9 5,077 5 27-28 Aug 4.76 0.81 0.065 0.054 114 24.1 15 2 6.8 5.8 4,249 5 1-2 Oct 4.89 1.31 0.184 0.124 86 20.9 11 1 2.9 8.0 4,386 3

25
Prospect Slough (N38 19.216 W121 39.236)
Date
THg (ng/l)
DHg (ng/l)
TMMHg
(ng/l)
DMMHg
(ng/l)
EC
(µmhos/cm)
Temp (OC)
TSS
(mg/l)
VSS
(mg/l)
Chloro (µg/l)
Phaeo (µg/l)
Flow
(af/mo)
SO4
(mg/l)
28-29 Mar 2000 38.6 1.89 0.701 0.145 550 132 1,479,036 24-25 Apr 21.0 1.33 0.397 0.096 483 19.5 79 28,632 30-31 May 21.4 0.81 0.333 0.103 275 21.2 112 7,081 26-27 Jun 31.8 1.31 0.239 0.099 261 23.3 155 3,354 19-21 July 35.5 1.50 broken 0.022U 229 23.3 177 3,186 21-22 Aug 23.9 1.81 0.208 0.071 206 21.5 106 2,388 26-27 Sept 18.4 0.99 0.114 0.031 317 21.7 82 3,150 15 28-29 Oct 14.6 1.34 0.142 0.022U 544 13.2 42 6,291 31 18-19 Dec 14.0 1.21 0.269 0.104 530 9.7 48 3,294 61 29-30 Jan 2001 26.8 1.28 0.413 0.098 356 7.6 194 18,813 69 26-27 Feb 45.2 3.50 0.414 0.127 365 11.5 251 18 4.1 1.4 72,185 64 26-27 Mar 11.7 0.78 0.325 0.117 718 19.4 63 4 2.9 2.7 147,393 89 29-30 Apr 21.4 0.79 0.144 0.014U 687 19.5 61 7 9.5 12.5 5,066 66 27-28 May 44.8 1.40 0.229 0.069 274 18.5 185 16 14.7 17.9 3,811 22 29-30 Jun 37.7 1.23 0.208 0.053 234 20.9 145 11 12.8 10.2 2,750 30-31 July 47.3 0.90 0.273 0.045 227 20.5 218 4 33.3 17.3 3,440 13 27-28 Aug 28.1 1.36 0.141 0.047 247 23.5 109 10 21.1 11.9 3,604 13 1-2 Oct 18.0 1.04 0.122 0.014U 256 20.7 65 4 13.0 25.0 1,427 12

26
Putah Creek @ Mace Blvd (N38 31.067-W121 41.710)
Date
THg (ng/l)
DHg (ng/l)
TMMHg
(ng/l)
DMMHg
(ng/l)
EC
(µmhos/cm)
Temp (OC)
TSS
(mg/l)
VSS
(mg/l)
Chloro (µg/l)
Phaeo (µg/l)
Flow
(af/mo)
SO4
(mg/l)
28-29 Mar 2000 5.57 0.63 0.108 0.036 355 17 31,944 24-25 Apr 8.98 0.86 0.132 0.051 575 17.4 28 2,922 30-31 May 14.90 1.02 1.120 0.091 564 21.3 46 1,051 26-27 Jun 13.10 0.92 0.348 0.206 553 23.6 34 188 19-21 July 12.50 0.92 0.281 0.094 518 24.4 30 879 21-22 Aug 24.30 0.82 0.205 0.031 540 22.5 46 1,279 26-27 Sept 8.25 0.96 0.122 0.057 609 19.9 20 2,976 41 28-29 Oct 5.49 1.31 0.114 0.038 470 13.9 11 2,181 40 18-19 Dec 1.94 0.49 0.053 0.050 400 8.4 4 2,233 36 29-30 Jan 2001 1.84 0.64 0.078 0.030 389 7.4 2 1,815 37 26-27 Feb 22.10 3.06 0.290 0.078 196 9.4 120 1,478 33 26-27 Mar 24.80 2.10 0.228 0.077 636 15.8 70 5 2,653 41 29-30 Apr 9.51 0.68 0.105 broken 450 17.5 61 5 2.8 6.5 2,570 36 27-28 May 2.54 0.59 0.141 0.103 450 23.9 7 <1.0 1.3 1.8 2,623 26 29-30 Jun 1.66 0.39 0.113 0.041 483 25.2 7 <1.0 0.7 1.5 2,499 26 30-31 July 2.63 0.55 0.098 0.061 437 26.4 3 <1.0 1.1 2.1 3,127 30 27-28 Aug 4.03 0.47 0.157 0.073 407 27.0 17 2 1.7 3.2 2,869 21 1-2 Oct 1.62 0.69 0.126 0.014U 557 22.2 2 <1.0 <2.0 4.2 1,427 29

27
Delta Mendota Canal (DMC) (N37 48.735 W121 34.713) Date
THg (ng/l)
DHg (ng/l)
TMMHg
(ng/l)
DMMHg
(ng/l)
EC
(µmhos/cm)
Temp (OC)
TSS
(mg/l)
VSS
(mg/l)
Chloro (µg/l)
Phaeo (µg/l)
Flow
(af/mo)
SO4
(mg/l)
28-29 Mar 2000 4.17 1.65 0.153 0.077 390 16 207,478 24-25 Apr 2.64 1.14 0.022U 0.022U 443 18.8 9 131,079 30-31 May 5.96 0.78 0.171 0.093 302 22.4 36 77,509 26-27 Jun 2.66 0.71 0.074 0.038 340 25.5 13 180,873 19-21 July 2.71 0.64 0.022U 0.022U 327 24.0 14 265,074 21-22 Aug 4.52 0.86 0.022U 0.022U 245 23.7 28 269,206 26-27 Sept 4.26 0.022U 0.022U 423 22.5 31 252,424 39 28-29 Oct 3.99 0.73 0.022U 0.022U 404 15.7 26 257,952 27 18-19 Dec 2.43 0.42 0.063 0.039 410 10.3 14 238,624 33 29-30 Jan 2001 3.12 0.73 0.144 0.068 489 8.9 15 168,005 77 26-27 Feb 4.05 0.93 broken 0.075 310 10.5 19 195,115 47 26-27 Mar 4.40 1.79 0.092 0.024 338 17.1 17 115,590 42 29-30 Apr 2.09 0.83 0.024 0.014U 398 19.6 12 129,617 52 27-28 May 3.41 1.09 0.056 0.0283 443 21.2 18 52,585 57 29-30 Jun 3.48 0.10 0.061 0.032 346 23.2 29 178,568 32 30-31 July 2.84 0.56 0.065 0.016 470 22.9 22 2 4.2 6.0 253,834 34 27-28 Aug 2.86 0.46 0.032 0.0217 629 24.5 16 3 2.9 4.9 253,519 35 1-2 Oct 4.26 0.46 0.014U 0.014U 558 21.3 24 242,578 37

28
State Water Project (SWP) (N37 46.890 W121 36.978) Date
THg (ng/l)
DHg (ng/l)
TMMHg
(ng/l)
DMMHg
(ng/l)
EC
(µmhos/cm)
Temp (OC)
TSS
(mg/l)
VSS
(mg/l)
Chloro (µg/l)
Phaeo (µg/l)
Flow
(af/mo)
SO4
(mg/l)
28-29 Mar 2000 2.75 1.77 0.139 0.077 369 5 340,926 24-25 Apr 7.17 1.35 0.047 0.021 308 16.3 22 181,063 30-31 May 3.79 0.84 0.144 0.054 264 21.6 20 105,126 26-27 Jun 2.21 0.82 0.022U 0.022U 258 24.7 5 260,291 19-21 July 1.91 0.82 0.022U 0.022U 241 23.8 6 359,177 21-22 Aug 2.19 1.75 0.022U 0.022U 245 21.5 12 385,870 26-27 Sept 1.71 0.59 0.058 0.022U 357 22.0 6 386,323 21 28-29 Oct 2.49 0.75 0.022U 0.022U 464 14.9 11 306,130 27 18-19 Dec broke 0.53 0.050 0.041 422 9.9 11 291,719 35 29-30 Jan 2001 1.66 0.67 0.113 0.048 382 8.4 7 240,938 48 26-27 Feb 2.46 0.75 0.077 0.051 314 10.2 11 2 0.8 6.4 260,376 45 26-27 Mar 3.41 1.65 0.055 0.024 364 16.7 8 2 0.8 1.8 360,093 47 29-30 Apr 2.19 0.93 0.058 0.040 387 17.7 4 2 2.2 4.9 98,297 54 27-28 May 2.73 0.86 0.050 0.039 400 20.4 8 1 0.9 2.2 33,747 47 29-30 Jun leak in State Water Project lift Canal, reservoir dry 8,973 30-31 July 6.93 0.38 0.021 0.007U 435 21.3 59 4 216,258 25 27-28 Aug 1.58 0.37 0.014U 0.014U 615 24.1 5 <1 3.3 3.6 248,104 32 1-2 Oct 2.06 0.40 0.032 0.014U 721 20.9 7 <1 212,325 34

29
X2 varies as a function of tidal cycle and outflow but was located in this study between the City of Martinez and Sherman Lake at a site with approximately 0.5 o/oo salinity on the surface and 2.0 o/oo on the bottom. Date
THg (ng/l)
DHg (ng/l)
TMMHg
(ng/l)
DMMHg
(ng/l)
EC
(µmhos/cm)
Temp (OC)
TSS
(mg/l)
VSS
(mg/l)
Chloro (µg/l)
Phaeo (µg/l)
Flow
(af/mo)
SO4
(mg/l)
28-29 Mar 2000 35.60 1.54 0.204 0.0583 2.0 13.0 109 6,358,770 24-25 Apr 49.20 1.06 0.082 0.022U 1.8 16.7 168 1,686,148 30-31 May 49.20 0.58 0.241 0.022U 1.8 19.1 144 1,439,391 26-27 Jun 19.10 0.60 0.109 0.031 2.0 21.4 60 588,911 19-21 July 25.90 0.81 0.022U 0.022U 2.0 21.5 92 604,137 21-22 Aug 9.71 0.57 0.022U 0.022U 2.0 21.5 27 397,843 26-27 Sept 9.94 0.61 0.023 0.022U 1.9 21.5 36 294,584 159 28-29 Oct 7.76 0.55 0.022U 0.022U 2.0 15.2 28 356,044 184 18-19 Dec 9.05 0.39 0.0595 0.022U 1.8 10.6 32 428,163 147 29-30 Jan 2001 12.50 0.52 0.0945 0.0321 1.7 8.9 39 968,097 131 26-27 Feb 15.70 0.83 0.0667 0.0483 1.5 10.8 73 1031,135 132 26-27 Mar 24.00 1.83 0.165 0.014U 1.6 15.9 87 1426,638 103 29-30 Apr 11.08 0.51 0.014U 0.014U 1.5 17.7 43 735,429 187 27-28 May 10.20 0.31 0.0409 0.014U 34 2.5 2.9 612,612 126 29-30 Jun 11.00 0.43 0.0369 0.014U 59 1.8 3.7 484,375 237 30-31 July 3.95 0.26 0.0701 0.014U 2.0 20.0 27 1 2.1 2.4 310,375 167 27-28 Aug 9.99 0.37 0.0541 0.041 2.0 21.5 46 4 215,032 198 1-2 Oct 12.10 0.38 0.014U 0.014U 2.0 20.7 41 2 275,200 184

30
Delta Island Main Drains
THg (ng/l)
DHg (ng/l)
TMMHg
(ng/l)
DMMHg
(ng/l)
EC
(µmhos/cm)
Temp (OC)
TSS
(mg/l) Staten Island Main Drain (N38-09.363 W121-13.011)
26-27Jun 2000 10.11 1.56 0.198 0.071 127 21.5 59 19-21 Jul 2000 7.22 1.74 0.094 0.022U 183 21.0 58
Empire Tract Main Drain (N38-03.607 W121-29.909)
26-27Jun 2000 3.22 0.94 0.093 0.050 256 21.5 38 19-21 Jul 2000 10.2 3.75 0.117 0.056 299 22.4 69
Lower Jones Main Drain
19-21 Jul 2000 1.14 0.09 0.302 0.239 500 25.5 14 Upper Jones Main Drain (N37-56.353 W121-31.872)
19-21 Jul 2000 1.52 0.86 0.131 0.129 690 22.9 11 Twichell Island Main Drain (N38-05.799 W121-39.05)
26-27Jun 2000 3.99 1.06 0.387 0.229 398 20.0 30 19-21 Jul 2000 4.49 1.97 1.500 0.056 380 23.0 247