09bma10pu production system - aquafish · production system design & best management...
TRANSCRIPT

38
TOPIC AREA: PRODUCTION SYSTEM DESIGN & BEST MANAGEMENT
ALTERNATIVES vv
EXPERIMENTAL POND UNIT ASSESSMENT IN GHANA
Production System Design & Best Management Alternatives/Study/09BMA10PU
FINAL INVESTIGATION REPORT
Emmanuel Frimpong and Yaw Ansah Department of Fish and Wildlife Conservation
Virginia Polytechnic Institute and State University Blacksburg, Virginia, USA
Nelson Agbo and Stephen Amisah
Department of Fisheries and Watershed Management Kwame Nkrumah University of Science and Technology
Kumasi, Ghana
ABSTRACT
This report summarizes the experimental pond unit assessment of two facilities used in AquaFish research in Ghana. The facilities are KNUST farm and the Pilot Aquaculture Center (PAC) of the Fisheries Commission. The project took place from July to October 2012 and involved physical, chemical, and biological characterization of 10 ponds of which 8 were stocked with Oreochromis niloticus at 2 m-2 and 2 were not stocked. Overall, most of the variables originally planned for measurement were successfully completed and the project played a vital role in institutional and individual capacity building.
INTRODUCTION
In furtherance of the broader objectives of the AquaFish CRSP, a set of experimental sites are being developed across select countries in Africa, Asia, and the Americas, where common experiments will be carried out to investigate aquaculture technologies and management practices that may be transferable among regions. Better management practices developed through these activities will support sustainable development of aquaculture with minimum environmental impacts. The objectives of this study were to:
1. Evaluate ponds at two experimental sites for their physical, chemical, and biological
characteristics during grow-out. 2. Develop a baseline set of physical, chemical, and biological characteristics of ponds for future
AquaFish CRSP experiments. 3. Build on existing training opportunities, institutional networks, and research and extension
capacity to promote small-scale aquaculture development in Ghana.
The overarching goal was to add value to the data obtained in related AquaFish studies, in addition to providing the needed baseline information for future experiments and validation of the capacity of

39
AquaFish’s collaborating institutions in Ghana to execute a rigorous protocol of water quality and environmental data collection.
METHODS AND MATERIALS
Location
The study was conducted in the Ashanti Region of Ghana. The primary site of the study was the Kwame Nkrumah University of Science and Technology (KNUST) farm situated on the campus of the university in Kumasi. The secondary site was the Pilot Aquaculture Center (PAC) of the Fisheries Commission, located at Tano-Odumasi, north of Kumasi. These sites were selected for their proximity to campus to facilitate transportation and timely sampling and water analyses during this intensive study. Both sites and 8 out of 10 of the selected ponds were also part of ongoing demonstration experiments of AquaFish, making the data ultimately useful for analyzing the results of the demonstrations.
Methods
The study was conducted for 3 months from July to October 2012 during half of the growout phase of the demonstration experiments. Four ponds at KNUST and four ponds at PAC were the primary focus. These ponds were already being used in AquaFish CRSP demonstration experiments involving comparison of tilapia (Oreochromis niloticus) growth on locally manufactured sinking feed (L), formulated floating feed (R), recycled pond water (OW), and fresh pond water (NW). Two additional ponds at the PAC site were included as controls (i.e., not stocked: CP1 & CP2) for a total of 10 ponds. We considered the two farms as replicates and ponds within a farm as subsamples to help estimate with-in site variation. The physical, chemical, and biological characterization of ponds was designed to follow the original scheme in Table 1.
Table 1: Summary of variables originally intended for measurement and the frequency of measurements.
Variable Daily Frequency How often Type of sample PHYSICAL & CHEMICAL
Pond morphometry - Once Pond soils - Once Composite Pond depth Once Daily One Water depth Once Weekly Whole pond Evaporation Once 3 times One Seepage Once 3 times One Temperature Diel measures 3 times 3 depths DO Diel measures 3 times 3 depths DO Once Weekly at dawn Composite pH Diel measures 3 times 3 depths Alkalinity Diel measures 3 times 3 depths TP, TDS/Conductivity, TSS Once Weekly Composite TKN, NH3/NH4+, NO2/NO3 Once Weekly Composite
BIOLOGICAL Secchi disk depth Once Weekly Whole pond Chlorophyll-a Once Weekly Composite

40
Prior to the initiation of the study, a more detailed scheme of sampling was written, reviewed, and approved by the PIs. Necessary modifications of the set of variables that were deemed necessary and feasible under the local conditions were made at this time (Appendix 1). Field Technicians (4#) followed the sampling scheme in Appendix 1 as closely as possible. The methods for pond physical characterization followed Egna et al. (1987), chapters in Egna and Boyd (1997), and the Standard Methods for the Examination of Water and Wastewater (APHA et al. 2012) or an older version where specifically cited in Appendix 2. Field water quality measurements were made with a Hanna hand- held meter, except where indicated otherwise (e.g., Secchi depth). Lab analyses were conducted at the Department of Civil and Environmental Engineering of KNUST, and soil analyses were conducted at the Soil Research Institute of Ghana, Analytical Service Division in Kumasi.
Physical and chemical characterization-
The characteristics we measured include pond morphometry, pond soils, pond depth, evaporation rate, water temperature, and a suite of water chemistry variables. Morphometry was measured by measuring depths at 1-m intervals along two transects perpendicular across the pond, from the top of one bank to the opposite bank. These points were interpolated to develop a bathymetric map of each pond so that the surface area and pond volume can be calculated at each depth for the working pond. Pond depths were also measured at the deepest point daily, and served as the basis for weekly water replacements if needed. We measured evaporation rate with an evaporation pan. Amount of water discharged during rain, if any, and seepage were determined from the daily measurements of pond depth and evaporation.
Pond bottom soils were measured for their physical and chemical properties, with a suite of variables being partly determined by the capacity of the Soils Research Institute to which this work was contracted. Soil samples to be analyzed were collected at various locations from the pond bottom (before flooding for ponds that were dry prior to the sampling). Composite cores were taken from wet ponds. Water temperature, DO, pH, and Alkalinity were measured frequently (see protocol – Appendix 1, and results) and profiled vertically for each pond for surface, mid- depth, and bottom. The water chemistry variables that were measured in the laboratory include, phosphorus (as TP), various forms of nitrogen (TKN, NO2, NO3, and NH3/NH4+), pH, alkalinity, and dissolved and suspended solids (TDS and TSS).
Biological characterization-
We estimated plankton standing crop by measuring light penetration, using the Secchi disc method. The compensation point is determined as 2 × Secchi disc depth. We also measured the concentration of chlorophyll-a for a more direct indication of phytoplankton biomass and pond productivity. Due to delays in obtaining equipment replacement parts, chlorophyll-a measurements lagged about a month behind the commencement of the study. Since the values of DO, pH, and temperature were being collected at 3 depths and on a regular basis over the diel period, we anticipate the use of these measurements to calculate the net primary productivity, respiration, and gross primary productivity of each pond. Each pond included one additional dawn, midday, dusk, midnight, and the following dawn’s measurement of DO, pH, alkalinity, and temperature before the end of the experiment to allow for the use of templates developed by previous CRSP work to produce reliable estimates.
RESULTS & DISCUSSION
Raw results of all measurements taken are summarized here in a series of tables starting from Table 2 (and figures in the case of pond bottom contours). The detailed analysis, computations, and interpretations are done in conjunction with the reports on the demonstration studies. Additional tables that are too large are attached in excel files.

41
Training, capacity building, and networking- In addition to the intensive data collection on pond dynamics, we utilized this research for training of students, fisheries officers, and farmers. This was accomplished by leveraging ongoing AquaFish CRSP work. We engaged 3 fisheries officers, 2 MPhil students, and 2 national service personnel of KNUST as field and laboratory technicians and as resource persons during scheduled workshops on pond water quality management and aquaculture BMPs. The following are some specific benefits of the EPUA to Ghana:
• Two research and development facilities, the KNUST fish farm and the PAC, were enhanced
for their capacity to generate high-quality scientific information on pond and environmental soil and water quality, thereby providing the needed confidence in these facilities for use in future AquaFish CRSP research.
• KNUST and PAC personnel acquired further knowledge and practical skills, and will in turn train students and fisheries officers in various aspects of pond water quality management.
• Outreach opportunities continue to be provided through the Best Management Practices (BMP) workshops, where fisheries officers and farmers interact in a rare forum for extension, utilizing experience gained from this project.
• KNUST and the Fisheries Commission working together with Virginia Tech on this project furthers the objective of capacity building and institutional networking both within Ghana and across continents to benefit development of aquaculture in Ghana.
42
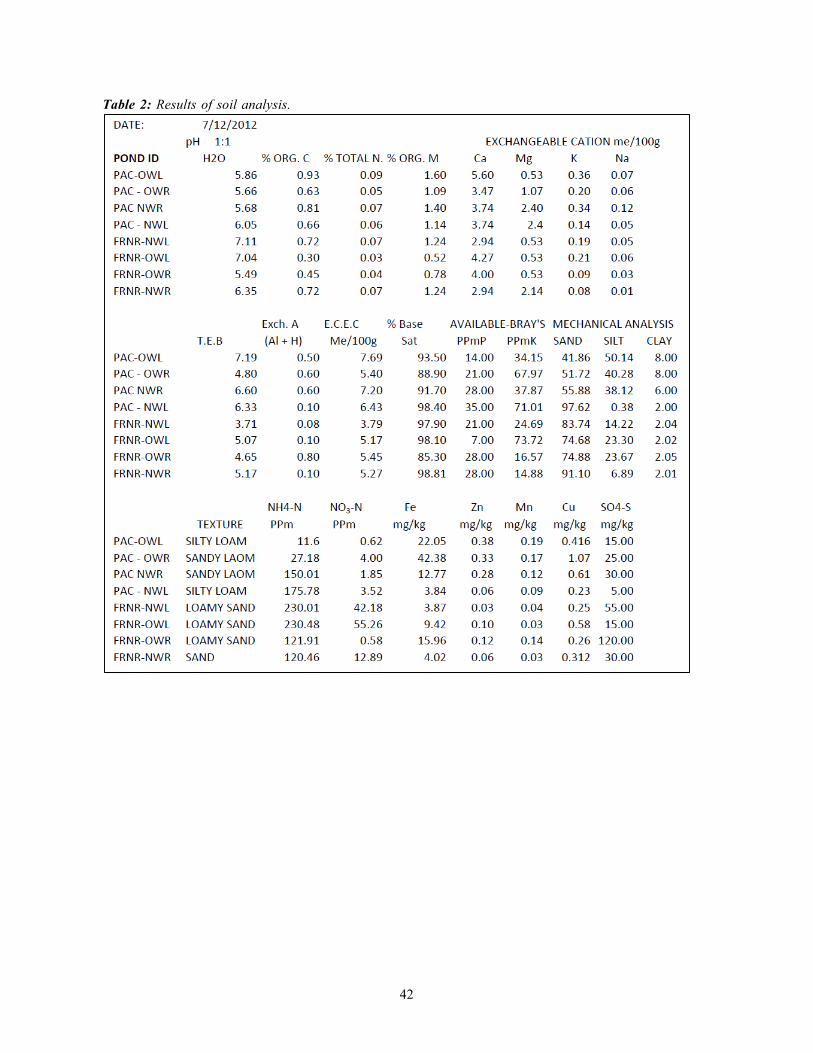
Table 2: Results of soil analysis.

43
Table 3: Chlorophyll-a analysis.

44
Table 4: Summary of pond morphometry.
Farm Average
Depth(cm) Area (m2) Volume (m3)
FRNR - NWL 33.8 287 97.0
FRNR - NWR 44.8 1067 477.7
FRNR - OWL 49.0 382 187.4
FRNR - OWR 48.2 888 427.7
PAC - NWL 94.1 248 233.3
PAC - NWR 77.2 248 191.3
PAC - OWL 77.7 248 192.8
PAC - OWR 71.3 248 176.9

45
PAC - NWL
PAC – OWL
Figure 1a: Bathymetry of experimental ponds. Depth measurements in centimeters (cm) and pond dimensions are in meters (m). Dimensions are not to scale.

46
PAC – NWR
PAC – OWR
Figure 1b: Bathymetry of experimental ponds. Depth measurements in centimeters (cm) and pond dimensions are in meters (m). Dimensions are not to scale.
47
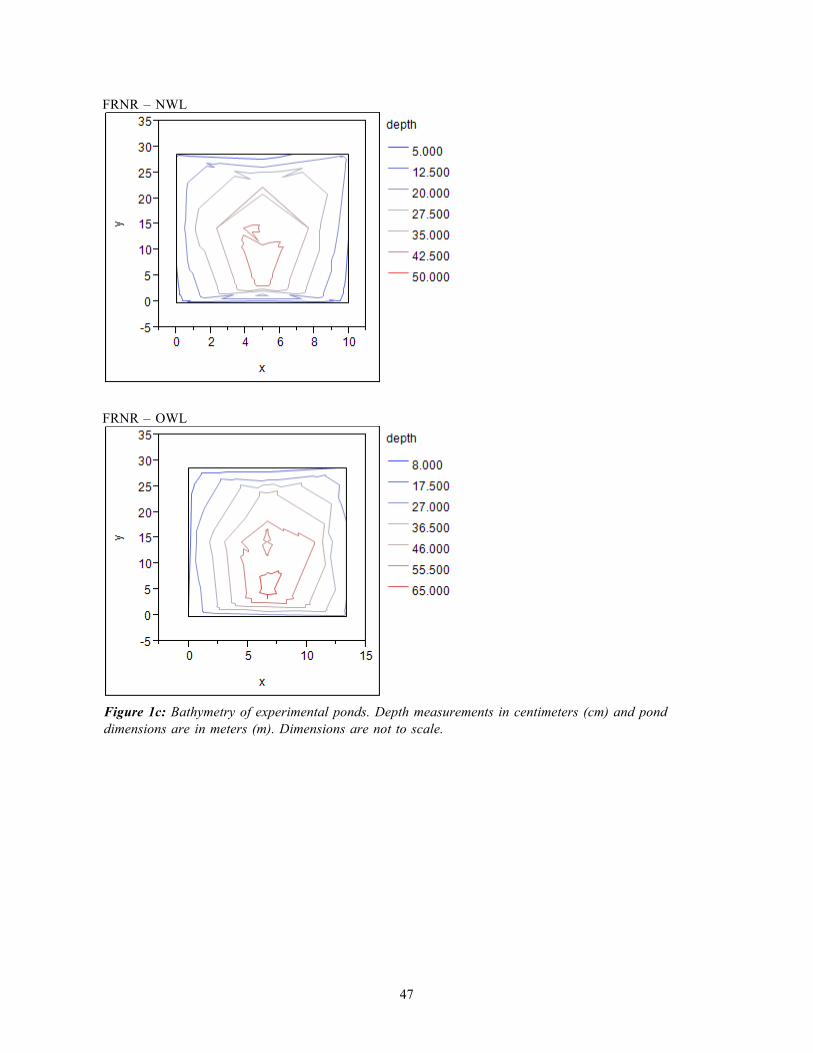
FRNR – NWL
FRNR – OWL
Figure 1c: Bathymetry of experimental ponds. Depth measurements in centimeters (cm) and pond dimensions are in meters (m). Dimensions are not to scale.

48
FRNR – NWR
FRNR – OWR
Figure 1d: Bathymetry of experimental ponds. Depth measurements in centimeters (cm) and pond dimensions are in meters (m). Dimensions are not to scale.
File attachments:
1. Chlorophyll-a 2. Depth and Evaporation 3. Field water – Temp, pH, DO – (Weekly morning and diel measurements) 4. Lab water – Alkalinity, nutrients, and solids (Weekly measurements) 5. Secchi depth 6. Soil Analysis
ACKNOWLEDGEMENTS
We are grateful to the following students, national service personnel and fisheries officers who participated in various aspects of this study, especially the field work: Francis Adjei, Derrick Owusu, Martha Okai Ababio, Iris Fynn, Yaa Tiwaa Amoah, and Michael Sasu.

49
REFERENCES
American Public Health Association (APHA), the American Water Works Association (AWWA) and the Water Environment Federation (WEF). 2012. Standard Methods for the Examination of Water and Wastewater, 22nd edition. APHA, Washington, DC.
Egna, H.S., and C.E. Boyd (editors). 1997. Dynamics of Pond Aquaculture. CRC Press, Boca Raton. Egna, H.S., N. Brown, and M. Leslie (editors). 1987. Pond Dynamics/Aquaculture Collaborative
Research Data Reports, Volume 1, General Reference: Site Descriptions, Materials and Methods for the Global Experiment. PD/A CRSP, Oregon State University, Corvallis, Oregon, 84 pp.
APPENDICES(1, 2):
Appendix 1: Field sampling procedures reviewed and approved priorto commencement of project. Appendix 2: Laboratory procedures followed for chemical and biological analysis.
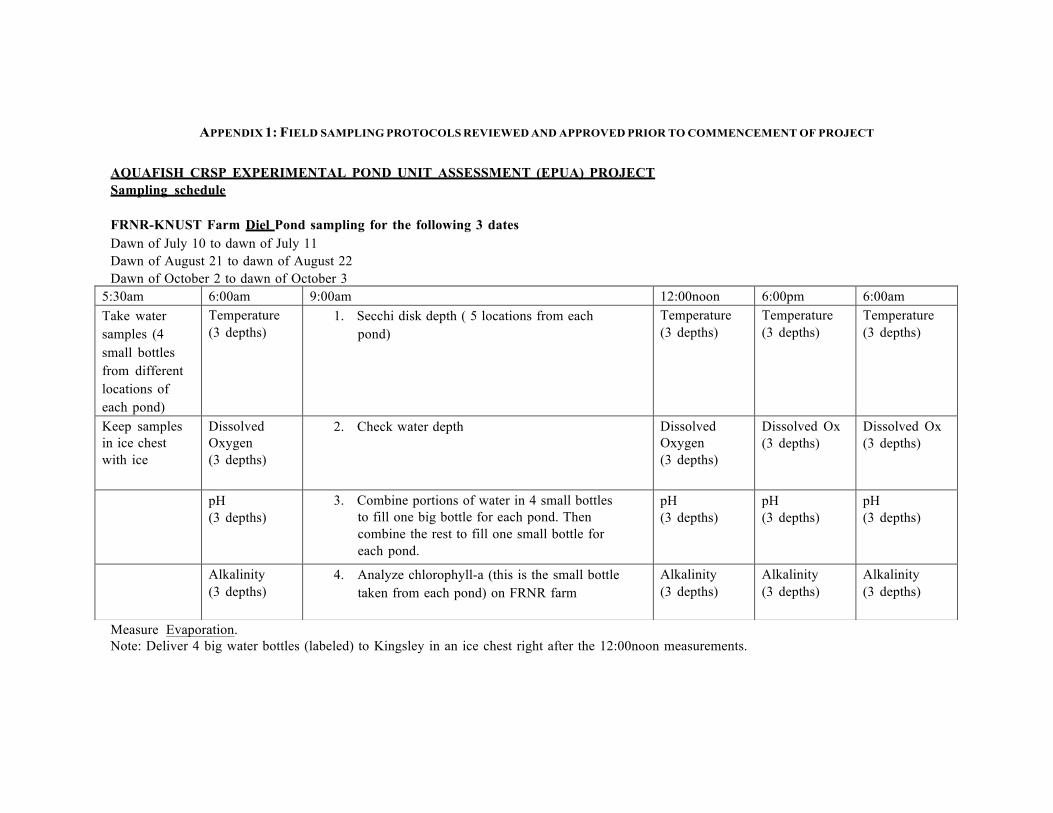
APPENDIX 1: FIELD SAMPLING PROTOCOLS REVIEWED AND APPROVED PRIOR TO COMMENCEMENT OF PROJECT
AQUAFISH CRSP EXPERIMENTAL POND UNIT ASSESSMENT (EPUA) PROJECT Sampling schedule
FRNR-KNUST Farm Diel Pond sampling for the following 3 dates Dawn of July 10 to dawn of July 11 Dawn of August 21 to dawn of August 22 Dawn of October 2 to dawn of October 3
Measure Evaporation. Note: Deliver 4 big water bottles (labeled) to Kingsley in an ice chest right after the 12:00noon measurements.
5:30am 6:00am 9:00am 12:00noon 6:00pm 6:00am Take water samples (4 small bottles from different locations of each pond)
Temperature (3 depths)
1. Secchi disk depth ( 5 locations from each pond)
Temperature (3 depths)
Temperature (3 depths)
Temperature (3 depths)
Keep samples in ice chest with ice
Dissolved Oxygen (3 depths)
2. Check water depth Dissolved Oxygen (3 depths)
Dissolved Ox (3 depths)
Dissolved Ox (3 depths)
pH (3 depths)
3. Combine portions of water in 4 small bottles to fill one big bottle for each pond. Then combine the rest to fill one small bottle for each pond.
pH (3 depths)
pH (3 depths)
pH (3 depths)
Alkalinity (3 depths)
4. Analyze chlorophyll-a (this is the small bottle taken from each pond) on FRNR farm
Alkalinity (3 depths)
Alkalinity (3 depths)
Alkalinity (3 depths)
51
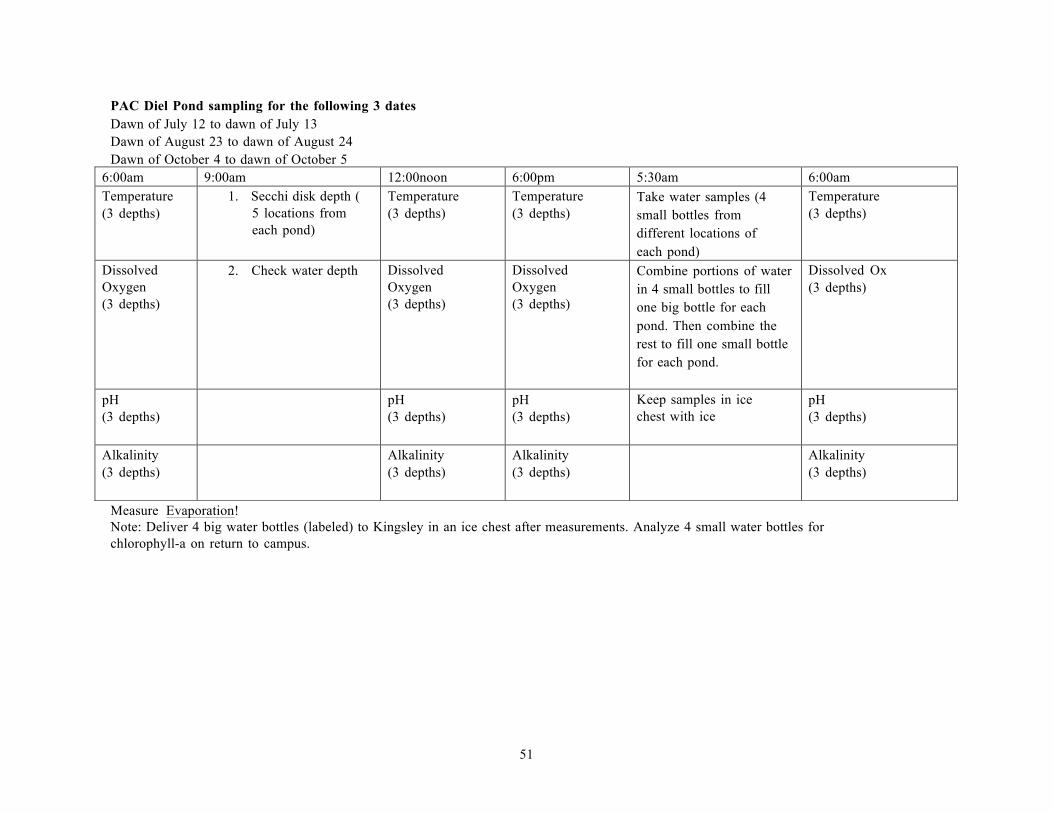
PAC Diel Pond sampling for the following 3 dates Dawn of July 12 to dawn of July 13 Dawn of August 23 to dawn of August 24 Dawn of October 4 to dawn of October 5
Measure Evaporation! Note: Deliver 4 big water bottles (labeled) to Kingsley in an ice chest after measurements. Analyze 4 small water bottles for chlorophyll-a on return to campus.
6:00am 9:00am 12:00noon 6:00pm 5:30am 6:00am Temperature (3 depths)
1. Secchi disk depth ( 5 locations from each pond)
Temperature (3 depths)
Temperature (3 depths)
Take water samples (4 small bottles from different locations of each pond)
Temperature (3 depths)
Dissolved Oxygen (3 depths)
2. Check water depth Dissolved Oxygen (3 depths)
Dissolved Oxygen (3 depths)
Combine portions of water in 4 small bottles to fill one big bottle for each pond. Then combine the rest to fill one small bottle for each pond.
Dissolved Ox (3 depths)
pH (3 depths)
pH (3 depths)
pH (3 depths)
Keep samples in ice chest with ice
pH (3 depths)
Alkalinity (3 depths)
Alkalinity (3 depths)
Alkalinity (3 depths)
Alkalinity (3 depths)

52
FRNR Farm Weekly Pond sampling for the following dates July 18, 25 August 1, 8, 15, 22, 29 September 5, 12, 19, 26
Activity Time 1 Take 4 small voltic water samples from
different points in each pond 6:00am
2 Measure dissolved oxygen 6:00am 3 Record water depths from poles 8:00am 4 Take Secchi disk depth from 5 different
locations of each pond 9:00am
5 Combine portions of water in 4 small bottles to fill one big bottle for each pond. Then combine the rest to fill one small bottle for each pond.
After Secchi disk readings
6 Analyze for chlorophyll-a using the water in the small Voltic bottle
After everything is done
PAC Weekly Pond sampling for the following dates July 16, 23, 30 August 6, 13, 20, 27 September 3, 10, 17, 24
Activity Time 1 Take 4 small voltic water samples from
different points in each pond 6:00am
2 Measure dissolved oxygen 6:00am 3 Record water depths from poles 8:00am 4 Take Secchi disk depth from 5 different
locations of each pond 9:00am
5 Combine portions of water in 4 small bottles to fill one big bottle for each pond. Then combine the rest to fill one small bottle for each pond.
After Secchi disk readings
6 Analyze for chlorophyll-a using the water in the small Voltic bottle
After everything is done
53
APPENDIX 2: LABORATORY PROTOCOLS FOLLOWED FOR CHEMICAL AND BIOLOGICAL ANALYSIS
B3. Total Suspended Solids (TSS) Procedure 50mL of a well-mixed sample was filtered through a weighed standard glass-fiber filter paper. The residue retained on the filter was then dried in an oven at 103 to 105°C for 1 hour. It was then cooled in a desiccator and weighed. The increase in weight of the filter represents the total suspended solids.
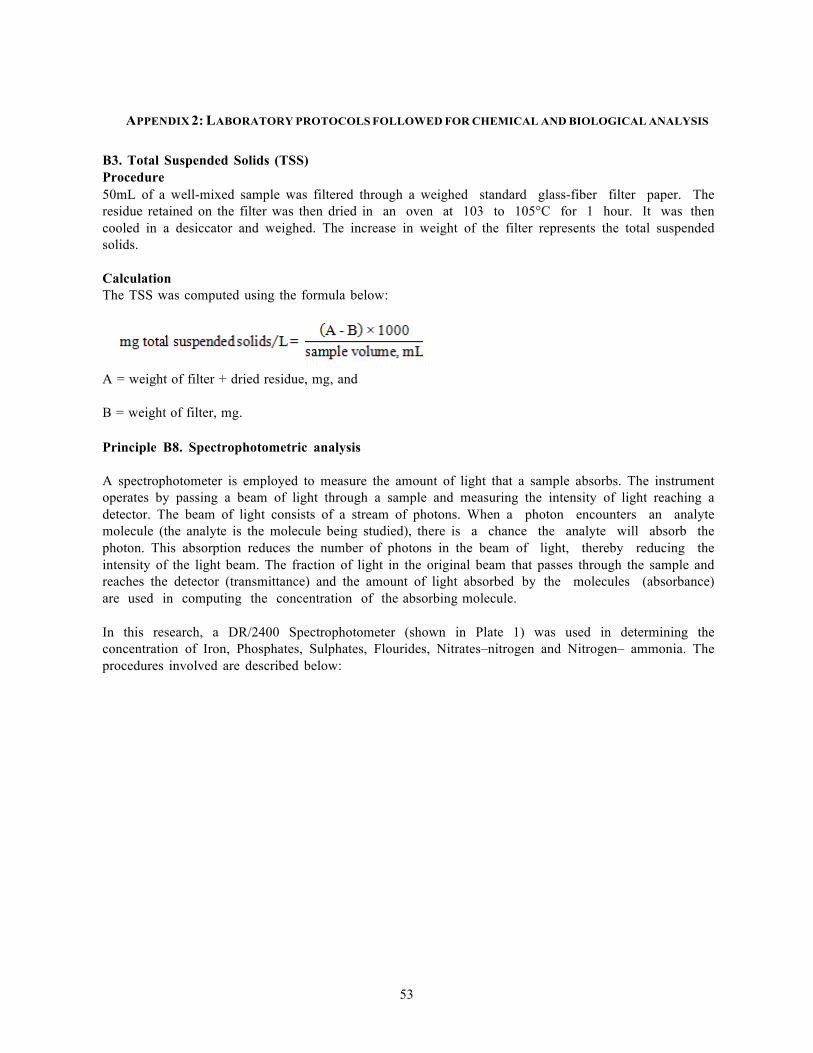
Calculation The TSS was computed using the formula below:
A = weight of filter + dried residue, mg, and
B = weight of filter, mg.
Principle B8. Spectrophotometric analysis
A spectrophotometer is employed to measure the amount of light that a sample absorbs. The instrument operates by passing a beam of light through a sample and measuring the intensity of light reaching a detector. The beam of light consists of a stream of photons. When a photon encounters an analyte molecule (the analyte is the molecule being studied), there is a chance the analyte will absorb the photon. This absorption reduces the number of photons in the beam of light, thereby reducing the intensity of the light beam. The fraction of light in the original beam that passes through the sample and reaches the detector (transmittance) and the amount of light absorbed by the molecules (absorbance) are used in computing the concentration of the absorbing molecule.
In this research, a DR/2400 Spectrophotometer (shown in Plate 1) was used in determining the concentration of Iron, Phosphates, Sulphates, Flourides, Nitrates–nitrogen and Nitrogen– ammonia. The procedures involved are described below:

54
Plate 1: DR/2400 Spectrophotometer
B8.4. Nitrate-nitrogen Cadmium Reduction Method
Principle Cadmium metal reduces nitrates in the sample to nitrite. The nitrite ion reacts in an acidic medium with sulfanilic acid to form an intermediate diazonium salt. The salt couples with gentisic acid to form an amber coloured solution.
Procedure The concentration of Nitrate-nitrogen was determined by selecting Program 353 N, Nitrate MR from the Hach Programs. A clean, round sample cell was filled with a known sample volume diluted to 10mL and the contents of one NitraVer 5 Nitrate Reagent Powder Pillow added to it. The sample cell shaken vigorously to mix the contents and the timer icon pressed to begin a one- minute reaction period. The timer icon is pressed again after the one-minute reaction for a five- minute reaction period to begin. Another sample cell was filled with 10mL distilled water (the blank) and placed in the cell holder of the spectrophotometer after thoroughly wiping it. The ‘Zero’ button was pressed and a 0.00 mg/L NO3-N.concentration was displayed. After the five-minute reaction period, the prepared sample was also placed in the cell holder after wiping the sample cell and the ‘Read’ button was pressed. The concentration of Nitrate-nitrogen was displayed in mg/L NO3-N.
Nitrite-nitrogen The method adopted was the Diazotisation method. A measuring cylinder was filled with sample to the 50ml mark and 2ml of sulphanilic acid followed by an equal quantity of 1-napthylamine-7- sulphonic acid. The mixture was allowed to stand for 35 minutes and a pink colour development indicates the presence of nitrite-nitrogen. The concentration of Nitrite-nitrogen was determined using the Hach DR 2400 spectrophotometer. The program number for low range NO2-N. was entered as 371 and the wavelength was set at 507nm. A 10ml cell was filled with 10ml blank solution and placed in the cell holder of the spectrophotometer after thoroughly wiping it. The ‘Zero’ button was pressed and a 0.00 mg/L NO2-N concentration was displayed. Another 10ml sample cell was filled with 10mL of the prepared sample and placed in the cell holder of the spectrophotometer after thoroughly wiping

55
the cell and the ‘Read’ button was pressed. The concentration of Nitrite-nitrogen present was displayed in mg/L NO2-N.
Nitrogen-ammonia
Salicylate Method
Principle Ammonia compounds combine with chlorine to form monochloramine. Monochloramine reacts with salicylate to form 5-aminosalicylate. The 5-aminosalicylate is oxidized in the presence of a sodium nitroprusside catalyst to form a blue colored compound. The blue color is masked by the yellow color from the excess reagent present to give a green-colored solution.
Procedure
Nitrogen-ammonia was determined by selecting Program 385 N, Ammonia, Salic. from the Hach Programs. A clean, round sample cell was filled with a known sample volume diluted to 10mL and another sample cell filled with 10mL deionized water (the blank). To each of these cells, the contents of one Ammonia Salicylate Powder Pillow were added. The cells were stoppered and shaken to mix the contents and the timer icon pressed to begin a three-minute reaction period. After this period, the contents of one Ammonia Cyanurate Powder Pillow were again added to each cell, stoppered and shaken to dissolve the reagent. The timer icon was pressed to begin a 15-minute reaction period. The blank was first placed into the cell holder after the reaction period and the ‘Zero’ button pressed. A 0.00 mg/L NH3-N concentration was displayed. Subsequently, the prepared sample was also placed in the cell holder after wiping the sample cell and the ‘Read’ button was pressed. The concentration of Nitrogen-ammonia was displayed in mg/L NH3-N.

56
TOTAL KJELDAHL NITROGEN Digestion Of Water Samples With The Macro-Kjeldahl Method
Field of application
The macro-Kjeldahl method is applicable for samples containing either low or high concentrations of organic nitrogen but requires a relatively large sample volume for low concentrations.
General discussion Nitrogen containing compounds will be converted to NH4+. Nitrogen in the form of azide, azine, azo, hydrazone, nitrate, nitrite, nitrile, nitro, oxime and semi-carbazone is not included. If ammonia is not removed in the initial phase the term "Kjeldahl-nitrogen" is applied to the result; if ammonia is removed, the term "organic nitrogen" is applied.
Principle
In the presence of H2SO4, K2SO4 and CuSO4 catalyst, amino nitrogen of many organic materials is
converted to (NH4)2SO4. Also NH3 and NH4+ are converted to (NH4)2SO4. During sample digestion, a copper ammonium complex is formed and afterwards decomposed by Na2S2O3. After decomposition the NH3 is distilled from an alkaline medium and absorbed in H2SO4.
Apparatus Digestion apparatus
Distillation apparatus
a) Digestion reagent: Dissolve 134 g K2SO4 and 11.4 g CuSO4.5H2O in about 800 mL H2O. Carefully add 134 mL conc. H2SO4. When it has cooled to room temperature dilute to 1 L. Keep at a temperature close to 20°C to prevent crystallization.
b) NaOH - Na2S2O3 reagent: Dissolve 500 g NaOH and 25 g Na2S2O3.5 H2O in water and dilute to 1 L.
c) H2SO4 0.02 M: Add 1.2 mL conc. H2SO4 to 1 L H2O.
d) Intermediate standard NH4Cl for Kjeldahl determination.
Digestions
Dilute 50.00 mL stock solution to 1000 mL 1.00 mL = 0.05 mg N.
Procedure

57
1. Place a measured volume of sample and blank in a Kjeldahl flask, select sample size from the following tabulation. If necessary, add water until about 300 mL. Neutralize to pH 7 in case of strong alkaline samples.
Expected N mg/L in sample Sample size, mL
0 - 1 500
1 - 10 250
10 - 20 100
20 - 50 50
50 - 100 25
100 - 200 10
200 – 250 5
2. Carefully add 50 mL digestion reagent, mix well and add a few pumice grains
3. Heat in the hood and boil until the volume is about 25 mL and fumes are observed
4. Continue to digest for an additional 30 minutes., coloured or turbid samples will turn clear or straw-colored. The total destruction time must be at least 4 hours.
5. Cool, dilute to 300 mL and mix
6. Carefully add 50 mL NaOH-Na2S2O3 mixture and connect immediately the flask to the distillation apparatus. Shake the flask to insure complete mixing. A black HgS precipitate will form, the pH should exceed 11.0.
7. Distil and collect 200 mL distillate below the surface of 50 mL 0.02 M H2SO4. Extend tip of condenser well below level of H2SO4 and do not let temperature in condenser rise above 29°C. Use a medium high flame and do not lower this flame during the distillation. At the end of the distillation, remove the distillate before the flame is turned off.
8. Measure the end volume by means of a measuring cylinder and mix.
9. Determine N content of the sample (see procedure 3.2 and start with procedure 3.2.6 step 3).
10. Distillation recovery check: Treat a standard in the same way as the sample by putting 25.00 mL of the intermediate standard solution (=1.25 mg N) in the Kjeldahl flask (as described in step 1).
Measure the end volume by means of a measuring cylinder and mix. Take 10.00 mL distillate and measure the absorbance against mg N in 50 mL (see procedure 3.2.6, starting at step 3). Check the distillation recovery.
Remark:

58
If ammonia should be removed: add 25 mL borate buffer (9.5 gram Na2B4O7.10H2O/800 mL
+ 200 mL 0.1 M NaOH) and 6 M NaOH until pH 9.5 is reached.
Add some pumice and boil off 300 mL. If desired, distill the fraction and determine ammonia nitrogen. Use the residue to determine organic nitrogen.
Reference: American Public Health Organization. Standard Methods for the examination of water and wastewater, 18th edition 1992. p. 4-95/4-97.
HCO3- / CO32- ; Alkalinity; Titrimetric analysis
Background The buffering capacity of water is an important characteristic for water quality. The term alkalinity is also directly involved in water and wastewater unit operations such as water softening, coagulation, iron removal, and pH neutralization. In natural waters, alkalinity may generally be associated with the carbonate equilibrium; most important sources are the atmospheric CO2 and limestone (CaCO3). At pH ≥
12, CO32- is exclusively present; at pH =8.3 it is all HCO3- and at pH ≤ 4.5 it is all CO2.
Alkalinity is defined as the amount of acid necessary to reach the above equivalence points. Since the first equivalence point, at pH 8.3, often the color indicator phenolphthalein is used, the corresponding alkalinity is referred to as the ‘phenolphthalein alkalinity’, and the amount of acid necessary to reach pH 4.5 is then called ‘total alkalinity’. Metacresol purple can be used as indicator instead of phenolphthalein.
Methyl orange or the mixed indicator bromocresol green-methyl red will be used to detect the second equivalence point at pH 4.5.
For historical reasons, alkalinity is often expressed as mg CaCO3 /L.
Reagents
a) Phenolphthalein indicator: Dissolve 0.5 g in 50 mL ethanol and 50 mL H2O. b) Metacresol purple indicator: Dissolve 100 mg in 100 mL H2O. c) Methyl orange indicator: Dissolve 50 mg in 100 mL H2O. d) Bromocresol green- methyl red indicator: Dissolve 100 mg bromocresol green and 20 mg methyl red in 100 mL ethanol. e) 0.020 N HCl or 0.02 N H2SO4 ( = 0.01 M H2SO4 )
Procedure
1. Transfer, with a pipet, a known volume of sample to an Erlenmeyer flask.
2. Add about 5 drops phenolphthalein indicator.
3. In case a red color appears (pH ≥ 8.3) : titrate with 0.020 N HCl until the red color
59
disappears and record the volume used. Add to the same solution about 5 drops methyl orange or the mixed indicator and titrate until a red color appears. Record the volume used.
4. In case no color will appear ( pH ≤ 8.3): add about 5 drops methyl orange or the mixed indicator and titrate until a red color appears, and record the volume used.
Calculations
Alkalinity as mg/L CaCO3 = V * N*1000 * 100
mL sample* 2
In case initial pH ≤ 8.3 : mg/L HCO3- = V * N *1000 * 61
mL sample
V = titration volume in mL, N = normality of the acid solution,
100 = molecular mass of CaCO3-,
61 = molecular mass of HCO3-.
Procedure for determining Chlorophyll-a
Chlorophyll-a analysis was conducted according to the standard procedure described in HMSO (1983). Between 30-50ml of the pond water was filtered under vacuum through a Whatman GF/C filter paper to collect the phytoplankton. The filter paper was placed in a centrifuge tube containing 10ml of methanol. The loosely capped tube was briefly heated in a water bath at 65-70˚C in a fume cupboard. The tube was removed and left for 5 minutes in the dark. The filter paper was removed from the tube after pressing it against the side of the tube to drain as much methanol as possible. The tube was then centrifuged for 8 minutes at 3500rpm to obtain a clear extract for spectrophotometric determination. Absorbance was measured after a baseline correction for methanol at wavelengths of 665nm and 750nm before and after acidification with 0.1M HCl to measure the chlorophyll-a concentration.
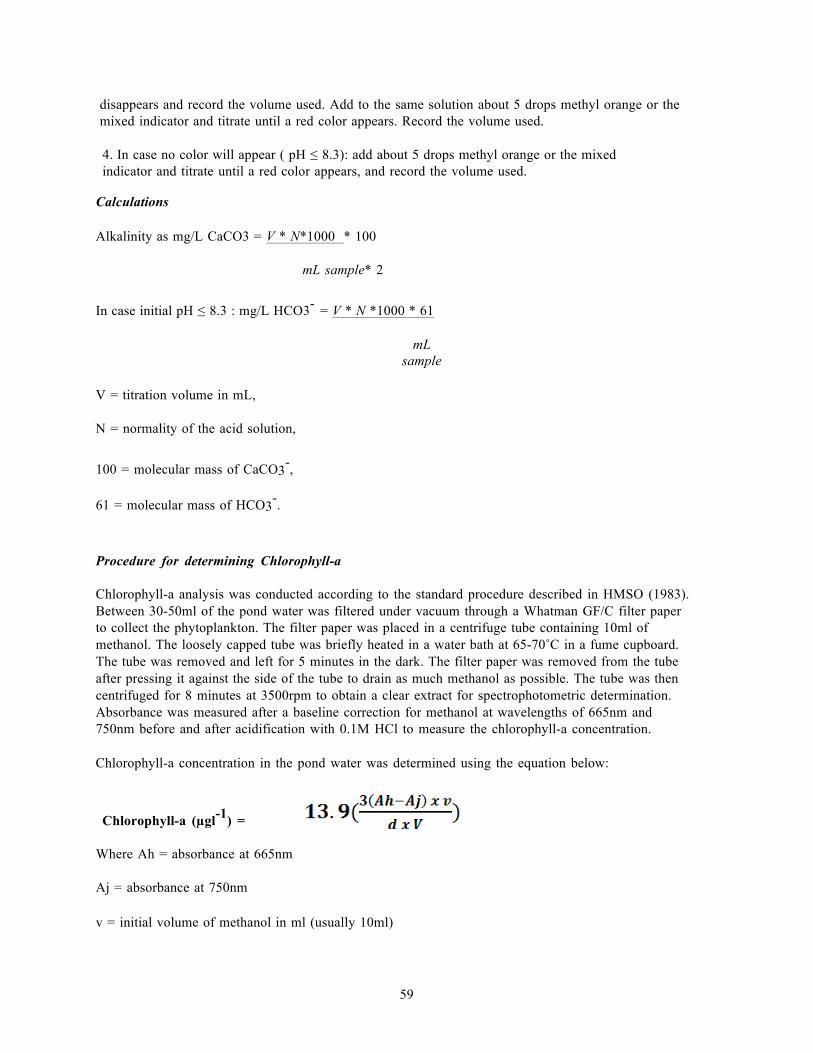
Chlorophyll-a concentration in the pond water was determined using the equation below:
Chlorophyll-a (µgl-1) =
Where Ah = absorbance at 665nm
Aj = absorbance at 750nm
v = initial volume of methanol in ml (usually 10ml)

60
d = cell length of cuvette in cm (1cm)
V = sample volume in liters (1L)
Reference: HMSO, 1983. The Determination of Chlorophyll-a in Aquatic Environments. HMSO Publications, London.