0dwhuldo (6, iru &khplfdo 6flhqfh 7klv molecular docking. the crystallographic structure of...
TRANSCRIPT

S1
Supporting Information for
Bioimaging, Cellular Uptake and Dynamics in Living Cells of a Lipophilic
Fluorescent Benzothiadiazole at Low Temperature (4 °C)
Alberto A. R. Mota,a Pedro H. P. R. Carvalho,a Bruna C. Guido,a Heibbe C. B. de Oliveira,a Thereza A.
Soares,b José R. Corrêa,a and Brenno A. D. Neto,*a
a Laboratory of Medicinal and Technological Chemistry, University of Brasilia (IQ-UnB). Campus
Universitario Darcy Ribeiro, CEP 70904970, P.O.Box 4478, Brasilia-DF, Brazil.
b Department of Fundamental Chemistry, (dQF-UFPE), Av. Jornalista Anibal Fernandes, s/n – Cidade
Universitaria, 50740-560, Recife-PE, Brazil.
DFT Calculations. Theoretical treatment of BTD-AO was performed using the density functional theory
(DFT) approach of the Gaussian 09 series of programs.1 Geometry optimization of the ground (S0) and
first excited (S1) states (in gas phase and water) were conducted with 6-311G(d) Pople’s split-valence
basis set and hybrid exchange–correlation functional using the Coulomb-attenuating method (CAM-
B3LYP).(2) Harmonic frequency calculations were performed verify whether we have located a genuine
minimum. The optimized geometries of S0 and S1 were used for the single point TD-DFT calculation
using different exchange-correlation (XC) functional (wB97XD, PBE1PBE, M062X, CAM-B3LYP,
B3LYP and B2PLYP) in combination with 6-311+G(2d,p). In particular, absorption spectra in close
agreement with experiments have been obtained using the TD-PBE1PBE/6-311+G(2d,p) level of
calculation.2, 3 To include the solvent effects in our quantum mechanics calculations we have employed
the self-consistent reaction field (SCRF) approach with the polarizable continuum model (PCM)4-6 were
the solute molecule is enclosed in a cavity embedded in a dielectric medium.
Electronic Supplementary Material (ESI) for Chemical Science.This journal is © The Royal Society of Chemistry 2014

S2
Molecular docking. The crystallographic structure of albumin (PDB ID 1BJ5)7 and the NMR structure of
FAPB (PDB ID 2FLJ)8 were used as initial coordinates for the molecular docking calculations of BTD-
AO. Five molecules of myristic acid bound to albumin were removed before the molecular docking
calculations. Likewise for the oleic acid molecule bout to FAPB. During the conformational search the
ligands were fully flexible concerning its degrees of translation, orientation and conformation with
respect to the protein structure, which was kept rigid. Each sampled conformation was evaluated and
ranked according to the empirical energy function (equation 2). Grid maps with 126 X 126 X 126 points
of dimension were calculated using AutoGrid4.9 Coarse (grid-point spacing of 0.25 Å) and fine (grid-
point spacing of 0.14 Å) sets of grid maps were used during the docking simulations in order to sample
the entire protein structure and ensure accurate estimates of host-guest interaction energies. Protonation
states were assigned accordingly to pH 7. The partial charges on the protein atoms were taken from the
AMBER all-atom force field.10 The Lamarckian genetic algorithm as implemented in AutoDock4
program11-13 was used with the following parameters: an initial population of 100 random individuals, a
maximum number of 1.5 x 10⁶ energy evaluations, a maximum number of 27000 generations with
mutation and crossover rates of 0.02 and 0.08, respectively. An optional elitism parameter equal to 1 was
applied, which determines the number of top individuals that will survive into the next generation. A
maximum of 300 iterations per local search was allowed. The probability of performing a local search on
an individual was 0.06 where the maximum number of consecutive successes or failures before doubling
or halving the search step was 4. Ligand conformations presenting the most favorable binding energy
were selected in each step of the simulation, in such a way that, at the end of calculation, atomic
coordinates of the 200 conformers that better fitted the binding site were selected. These conformers were
structurally compared through their RMSDs, and clustered into groups of similar conformations. A
tolerance of 2 Å for RMSD was employed to assign conformers to the same cluster.
Cell imaging experiments. Cells were seed on coverslips at bottom of 24 wells plate and maintained on
D-MEM medium (Sigma, MO - USA) supplemented with 10% of calf fetal serum at 37 °C in 5% CO2
atmosphere. Staining procedures: The cells were separated on eight samples; all samples were incubated
with 1mM of BTD-AO. Four samples at 4 °C and four samples at 37 °C were incubated for 5, 15, 30 min
and 60 min for each sample. After the respective incubation condition, the samples were washed three
times in phosphate buffer saline (PBS) at room temperature and fixed on formalin 3,7% for 30 min also at
room temperature. No nucleus staining procedures was performed in order to check if there was any

S3
probe affinity for the nuclei. The samples were washed three times in PBS and mounted on glass slides by
using ProLong® Gold antifade reagents (Life Technologies, NY - USA). The cell images were acquired
by using confocal laser scanning microscope TCS SP5 (Leica, IL-USA). Beside of regular images
acquisition, it was also performed a stack images acquisition of 50 images and used to do a 3D image
projection and orthogonal analysis in order to localize the probe inside. The orthogonal analyse was
performed with the sample incubated for 60 min. All assays and tests were performed in triplicate. The
nuclei were stained with propidium iodide using standard methods. Briefly, after incubation with BTD-
AO, MCF-7, MDA-MB-231, Caco-2, and HeLa cells were equilibrated in 2X Saline-Sodium Citrate
Buffer (SSC, 0.3 M NaCl, 0.03 M sodium citrate - pH 7.0), permeabilized in 2x SSC buffer with 100
g/mL RNase-free DNase and 0.1% Triton-X100 for 20 minutes at 37 ° C and further washed three times
(1 minute each) in 2X SSC. The samples were stained with propidium iodide (500 nM in 2 x SSC) for 7
minutes at room temperature, washed three times with 2 x SSC and the coverslips were mounted with
ProLong Gold Antifade (Invitrogen - Life Technologies, Carlsbad, CA, USA). The specimens were
observed and images were acquired under a laser scanning confocal microscope Leica SP 5 (Leica
Microsystems - Wetzlar Germany).
Cell viability assays. Caco-2, MCF-7, MDA-MB-231, HeLa or HUVEC cells (3 x 10³/well) were plated
in 96 well plate. After adhesion the cells were washed twice with pre-warmed (37 °C) PBS and incubated
in the buffer for 10 min at 37 °C. The samples were incubated with 1 mM of BTD-AO (diluted in DMEM
(for Caco-2 and HeLa), RPMI (for MCF-7 and HUVEC) or L15 (for MDA-MB-231) culture medium
supplemented with 10% FBS and 25 g/mL gentamicin) for 1 h at 37 °C. The cytotoxicity was
determined by using 3-(4,5-dimethylthiazol-2-yl)-2,5-diphenylterazolium bromide - known as MTT
(Molecular Probes - Life Technologies, Carlsbad, CA, USA) - according to the manufacturer instructions.
The absorbance readings were performed by spectrophotometer (SpectraMax M5, Molecular Devices -
Sunnyvale, California, USA). Statistical analyses were performed using GraphPad Prism 5 Software and
the statistical significance was determined by ANOVA with post-hoc comparison by Bonferroni test. A P
value of <0.05 was considered statistically significant (*, P < 0.05; **P < 0.01 and ***P < 0.001).
NMR analyses. NMR spectra were recorded on a Varian Mercury Plus spectrometer 7.05 T (300 MHz
for proton) at room temperature, using a 5-mm internal diameter probe. Deuterated chloroform (CDCl3)
and TMS (tetramethylsilane) were used as internal standards.
Mass spectrometry. ESI-QTOF-MS and MS/MS measurements were performed in the positive ion mode

S4
(m/z 50-2000 range) on a Waters Synapt HDMS (Manchester, UK) instrument. This instrument has a
hybrid quadrupole/ion mobility/orthogonal acceleration time-of-flight (oa-TOF) geometry and was used
in the W mode, with the mobility cell switched off and working only as an ion guide. All samples were
diluted in methanol with 0.1% formic acid to afford a 50 M solution of BTD-AO and was directly
infused into the ESI source at a flow rate of 10-20 L/min. ESI source conditions were as follows:
capillary voltage 3.0 kV, sample cone 10 to 30 V, extraction cone 3 V. Trap and Transfer cell collision
energies were at 6 and 4 eV, respectively, Argon was used as CID gas in product ion spectrum
experiments. The instrument was externally calibrated with phosphoric acid oligomers (H3PO4 0.05% v/v
in H2O/MeCN 50:50) from m/z 90 to 1000.
Synthesis of BTD-AO. 1.45 mmol of oleic acid (410 mg) was treated with SOCl2 (5 mL) at reflux for 2
h. The thionyl chloride excess is then removed under vacuum. After, the commercially available 4-amino-
2,1,3-benzothiadiazole (1.45 mmol, 220 mg) was added and heated at 130 °C for 30 min. Purification by
column chromatography (EtOAc/hexane mixtures) gave the desired product in 61% yield.
1H NMR (300 MHz, CDCl3) (ppm) = 8.50 (dd, J = 7.3 Hz and 0.9 Hz, 1H), 8.46 (bs, 1H), 7.67 (dd, J =
8.5 and 1.2 Hz, 1H), 7.62-7.55 (m, 1H), 5.34 (m, 2H), 2.53 (t, J = 7.5 Hz, 2H), 2.01 (m, 4H), 1.80 (qui, J
= 7.4 Hz, 2H), 1.36 (m, 20H), 0.87 (t, J = 7.2 Hz, 3H).
13C NMR (APT) (75 MHz, CDCl3) (ppm) = 171.8, 154.7, 147.7, 131.1, 130.0, 129.9, 129.7, 115.6,
114.8, 89.8, 37.9, 31.8, 29.7, 29.6, 29.5, 29.3, 29.2, 29.1(9), 29.1(0), 27.2, 27.1, 25.5, 22.6, 14.1.

S5
Table S1. Selected theoretical calculated data for the dye BTD-AO in their ground and first excited state
obtained from different exchange-correlation (XC) functional (wB97XD, PBE1PBE, M062X, CAM-
B3LYP, B3LYP and B2PLYP) using the large 6-311+g(2d,p) Pople’s split-valence basis. All results were
obtained using the geometry fully optimized at CAM-B3LYP/6-311G(d) level of calculation.
XC State HOMO(eV) LUMO(eV) (eV)
Gas Water Gas Water Gas Water Gas Water Gas Water
B2PLYP S0 1.9736 3.0491 -7.168 -7.209 -1.284 -1.310 5.886 5.899 341.74 343.18
S1 2.4862 3.4578 -6.671 -6.730 -1.660 -1.715 5.010 5.014 - -
B3LYP S0 1.9368 3.0588 -6.332 -6.358 -2.634 -2.644 3.698 3.714 394.21 394.62
S1 2.2225 3.3835 -5.960 -5.975 -2.971 -2.984 2.990 2.990 - -
CAM-B3LYP S0 1.9763 3.1089 -7.664 -7.696 -1.496 -1.510 6.168 6.186 347.58 347.63
S1 2.2882 3.4559 -7.233 -7.249 -1.868 -1.895 5.364 5.355 - -
M062X S0 2.0647 3.2418 -7.526 -7.587 -1.701 -1.734 5.824 5.853 340.79 340.40
S1 2.3759 3.5739 -7.079 -7.124 -2.078 -2.125 5.002 4.999 - -
PBE1PBE S0 1.9477 3.0554 -6.526 -6.575 -2.477 -2.508 4.049 4.066 380.32 380.61
S1 4.8057 3.4053 -6.139 -6.177 -2.822 -2.860 3.316 3.317 - -
wB97XD S0 1.9684 3.0940 -8.202 -8.251 -0.863 -0.894 7.339 7.357 344.33 344.98
S1 2.2852 3.4471 -7.775 -7.809 -1.233 -1.278 6.542 6.531 - -
Figure S1. (Top, left) BTD-AO emission in acetonitrile (20 M - 5 mM). (Top, right) BTD-AO emission
in phosphate buffer (2 M - 1 mM). (Bottom, right) BTD-AO emission in triton X100 solution (95 M -
1 mM). (Bottom, right) BTD-AO emission in SDS solution (50 M - 1 mM).

S6
Figure S2. HeLa cells incubated with BTD-AO at 4 °C (A, B and C) and 37 °C (D, E and F) for 5
minutes. The probe accumulated on vesicles (lipid droplets) near to the peripheral region of the cells. The
images show the same result for both temperatures tested as seen in (A), (B), (D) and (E) arrowheads. The
blue fluorescent signal is seen in (A) and (D) whereas the green emission is seen in (B) and (E). (C) and
(F) show the normal morphology of the cells by phase contrast microscopy. Scale bar of 25 m.

S7
Figure S3. HeLa cells incubated with BTD-AO at 4 °C (A, B and C) and 37 °C (D, E and F) for 15
minutes. The probe accumulated on vesicles (lipid droplets) near to the peripheral region of the cells and
at the inner position in the cells. The images show the same result for both temperatures tested as seen in
(A), (B), (D) and (E) arrowheads. The blue fluorescent signal is seen in (A) and (D) whereas the green
emission is seen in (B) and (E). (C) and (F) show the normal morphology of the cells by phase contrast
microscopy. Scale bar of 25 m.

S8
Figure S4. HeLa cells incubated with BTD-AO at 4 °C (A, B and C) and 37 °C (D, E and F) for 30
minutes. The probe accumulated on vesicles (lipid droplets) near to the peripheral region of the cells and
at the inner position in the cells. The images show the same result for both temperatures tested as seen in
(A), (B), (D) and (E) arrowheads. The blue fluorescent signal is seen in (A) and (D) whereas the green
emission is seen in (B) and (E). (C) and (F) show the normal morphology of the cells by phase contrast
microscopy. Scale bar of 25 m.

S9
Figure S5. HeLa cells incubated with BTD-AO after 60 min. BTD-AO accumulated only inside the lipid
droplets (vesicles) and only near to the cell nucleus. (A) Blue emission and (B) Green emission. (C)
Shows the normal morphological aspects to these cells by phase contrast microscopy. Scale bar of 25
m.

S10
Figure S6. HUVEC cells (human umbilical vein/vascular endothelium cells) incubated with BTD-AO at
4 °C (A, B and C) and 37 °C (D, E and F) for 5 minutes. The probe accumulated on vesicles (lipid
droplets) near to the peripheral region of the cells. The images show the same result for both temperatures
tested as seen in (A), (B), (D) and (E) arrowheads. The blue fluorescent signal is seen in (A) and (D)
whereas the green emission is seen in (B) and (E). (C) and (F) show the normal morphology of the cells
by phase contrast microscopy. Scale bar of 25 m.

S11
Figure S7. HUVEC cells (human umbilical vein/vascular endothelium cells) incubated with BTD-AO at
4 °C (A, B and C) and 37 °C (D, E and F) for 15 minutes. The probe accumulated on vesicles (lipid
droplets) near to the peripheral region of the cells and at the inner position in the cells. The images show
the same result for both temperatures tested as seen in (A), (B), (D) and (E) arrowheads. The blue
fluorescent signal is seen in (A) and (D) whereas the green emission is seen in (B) and (E). (C) and (F)
show the normal morphology of the cells by phase contrast microscopy. Scale bar of 25 m.

S12
Figure S8. HUVEC cells (human umbilical vein/vascular endothelium cells) incubated with BTD-AO at
4 °C (A, B and C) and 37 °C (D, E and F) for 30 minutes. The probe accumulated on vesicles (lipid
droplets) near to the peripheral region of the cells and at the inner position in the cells. The images show
the same result for both temperatures tested as seen in (A), (B), (D) and (E) arrowheads. The blue
fluorescent signal is seen in (A) and (D) whereas the green emission is seen in (B) and (E). (C) and (F)
show the normal morphology of the cells by phase contrast microscopy. Scale bar of 25 m.

S13
Figure S9. HUVEC cells (human umbilical vein/vascular endothelium cells) incubated with BTD-AO
after 60 min. BTD-AO accumulated only inside the lipid droplets (vesicles) and only near to the cell
nucleus. (A) Blue emission and (B) Green emission. (C) Shows the normal morphological aspects to these
cells by phase contrast microscopy. Scale bar of 25 m.

S14
Figure S10. Caco2 cells (human colorectal adenocarcinoma cells) incubated with BTD-AO at 4 °C (A, B
and C) and 37 °C (D, E and F) for 5 minutes. The probe accumulated on vesicles (lipid droplets) near to
the peripheral region of the cells. The images show the same result for both temperatures tested as seen in
(A), (B), (D) and (E) arrowheads. The blue fluorescent signal is seen in (A) and (D) whereas the green
emission is seen in (B) and (E). (C) and (F) show the normal morphology of the cells by phase contrast
microscopy. Scale bar of 25 m.

S15
Figure S11. Caco2 cells (human colorectal adenocarcinoma cells) incubated with BTD-AO at 4 °C (A, B
and C) and 37 °C (D, E and F) for 15 minutes. The probe accumulated on vesicles (lipid droplets) near to
the peripheral region of the cells and at the inner position in the cells. The images show the same result
for both temperatures tested as seen in (A), (B), (D) and (E) arrowheads. The blue fluorescent signal is
seen in (A) and (D) whereas the green emission is seen in (B) and (E). (C) and (F) show the normal
morphology of the cells by phase contrast microscopy. Scale bar of 25 m.

S16
Figure S12. Caco2 cells (human colorectal adenocarcinoma cells) incubated with BTD-AO at 4 °C (A, B
and C) and 37 °C (D, E and F) for 30 minutes. The probe accumulated on vesicles (lipid droplets) near to
the peripheral region of the cells and at the inner position in the cells. The images show the same result
for both temperatures tested as seen in (A), (B), (D) and (E) arrowheads. The blue fluorescent signal is
seen in (A) and (D) whereas the green emission is seen in (B) and (E). (C) and (F) show the normal
morphology of the cells by phase contrast microscopy. Scale bar of 25 m.

S17
Figure S13. Caco2 cells (human colorectal adenocarcinoma cells) incubated with BTD-AO after 60 min.
BTD-AO accumulated only inside the lipid droplets (vesicles) and only near to the cell nucleus. (A) Blue
emission and (B) Green emission. (C) Shows the normal morphological aspects to these cells by phase
contrast microscopy. Scale bar of 25 m.

S18
Figure S14. MCF-7 breast cancer cells incubated with BTD-AO at 4 °C (A, B and C) and 37 °C (D, E
and F) for 5 minutes. The probe accumulated on vesicles (lipid droplets) near to the peripheral region of
the cells. The images show the same result for both temperatures tested as seen in (A), (B), (D) and (E)
arrowheads. The blue fluorescent signal is seen in (A) and (D) whereas the green emission is seen in (B)
and (E). (C) and (F) show the normal morphology of the cells by phase contrast microscopy. Scale bar of
25 m.

S19
Figure S15. MCF-7 breast cancer cells incubated with BTD-AO at 4 °C (A, B and C) and 37 °C (D, E
and F) for 15 minutes. The probe accumulated on vesicles (lipid droplets) near to the peripheral region of
the cells and at the inner position in the cells. The images show the same result for both temperatures
tested as seen in (A), (B), (D) and (E) arrowheads. The blue fluorescent signal is seen in (A) and (D)
whereas the green emission is seen in (B) and (E). (C) and (F) show the normal morphology of the cells
by phase contrast microscopy. Scale bar of 25 m.

S20
Figure S16. MCF-7 breast cancer cells incubated with BTD-AO at 4 °C (A, B and C) and 37 °C (D, E
and F) for 30 minutes. The probe accumulated on vesicles (lipid droplets) near to the peripheral region of
the cells and at the inner position in the cells. The images show the same result for both temperatures
tested as seen in (A), (B), (D) and (E) arrowheads. The blue fluorescent signal is seen in (A) and (D)
whereas the green emission is seen in (B) and (E). (C) and (F) show the normal morphology of the cells
by phase contrast microscopy. Scale bar of 25 m.

S21
Figure S17. MCF-7 breast cancer cells incubated with BTD-AO after 60 min. BTD-AO accumulated
only inside the lipid droplets (vesicles) and only near to the cell nucleus. (A) Blue emission and (B) Green
emission. (C) Shows the normal morphological aspects to these cells by phase contrast microscopy. Scale
bar of 25 m.
S22
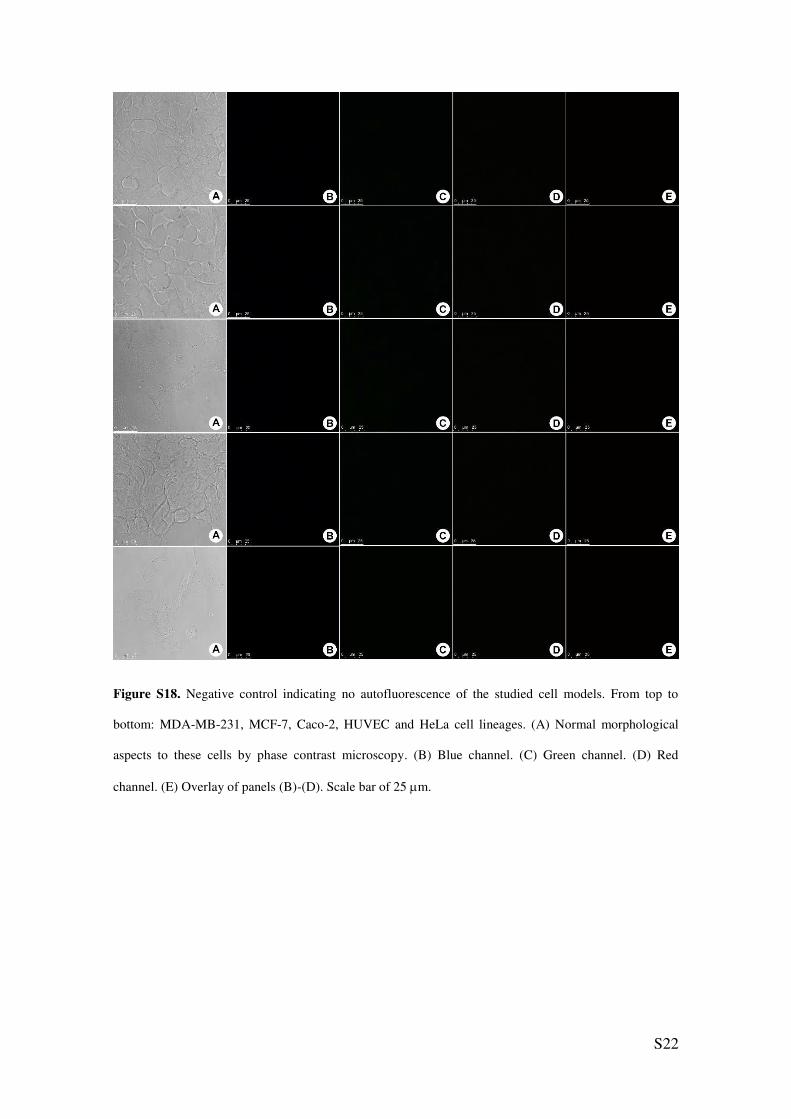
Figure S18. Negative control indicating no autofluorescence of the studied cell models. From top to
bottom: MDA-MB-231, MCF-7, Caco-2, HUVEC and HeLa cell lineages. (A) Normal morphological
aspects to these cells by phase contrast microscopy. (B) Blue channel. (C) Green channel. (D) Red
channel. (E) Overlay of panels (B)-(D). Scale bar of 25 m.

S23
Figure S19. 1H NMR (CDCl3, 300 MHz) of BTD-AO.
Figure S20. 13C NMR (CDCl3, 75 MHz) of BTD-AO.

S24
Figure S21. ESI(+)-MS/MS of the protonated BTD-AO. The inset is the high resolution ESI(+)-MS with
the expected isotopologue composition of the protonated BTD-AO. Exact mass calculated for
[C24H37N3OS + H]+ 416.2730. Found 416.2729 (error: -0.24 ppm).
Cartesian coordinates for all the calculated structures (BTD-AO)
S0 - gas phase
Standard orientation:
---------------------------------------------------------------------
Center Atomic Atomic Coordinates (Angstroms)
Number Number Type X Y Z
---------------------------------------------------------------------
1 8 0 -5.085956 -1.716752 1.060126
2 6 0 -4.933108 -0.757224 0.338872
3 6 0 -3.601800 -0.395625 -0.296576
4 7 0 -5.948956 0.112038 0.016670
5 6 0 -2.493419 -1.377534 0.050933
6 6 0 -1.158946 -1.004115 -0.585341
7 6 0 -0.039549 -1.982099 -0.243795
8 6 0 1.299506 -1.615436 -0.875049
9 6 0 2.417859 -2.593704 -0.531855
10 6 0 3.761537 -2.219667 -1.164240
11 6 0 4.834050 -3.227584 -0.874113
12 6 0 5.955203 -3.056718 -0.181398
13 6 0 6.460707 -1.803594 0.469937
14 6 0 7.780639 -1.317792 -0.135982

S25
15 6 0 8.343535 -0.083662 0.560878
16 6 0 9.656825 0.405883 -0.040795
17 6 0 10.220685 1.641048 0.654239
18 6 0 11.533684 2.130938 0.052554
19 6 0 -7.275537 0.061368 0.436191
20 6 0 -7.846938 -0.867016 1.257418
21 6 0 -9.233416 -0.788832 1.603230
22 6 0 -10.065907 0.186081 1.155126
23 6 0 -9.508768 1.173383 0.296345
24 6 0 -8.119259 1.108912 -0.059996
25 7 0 -10.129446 2.209083 -0.255938
26 16 0 -9.034337 3.016296 -1.143008
27 7 0 -7.726181 2.085388 -0.863605
28 1 0 -3.736815 -0.339629 -1.382932
29 1 0 -3.328804 0.617193 0.021889
30 1 0 -5.733894 0.888024 -0.593179
31 1 0 -2.389158 -1.430678 1.137795
32 1 0 -2.791197 -2.381216 -0.264071
33 1 0 -1.272980 -0.951196 -1.675041
34 1 0 -0.868457 0.003999 -0.265073
35 1 0 0.074313 -2.035747 0.845193
36 1 0 -0.329101 -2.989697 -0.564405
37 1 0 1.185592 -1.562378 -1.964607
38 1 0 1.587904 -0.607001 -0.554401
39 1 0 2.538687 -2.651354 0.555248
40 1 0 2.132791 -3.601462 -0.855848
41 1 0 3.629522 -2.146482 -2.250913
42 1 0 4.056106 -1.222596 -0.828307
43 1 0 4.642174 -4.221159 -1.277148
44 1 0 6.612130 -3.918915 -0.074007
45 1 0 5.719093 -1.003143 0.414334
46 1 0 6.616212 -1.998471 1.538317
47 1 0 8.518101 -2.127967 -0.094554
48 1 0 7.628329 -1.105271 -1.199725
49 1 0 7.603441 0.724829 0.522208
50 1 0 8.491284 -0.303526 1.625140
51 1 0 10.397168 -0.402134 -0.001367
52 1 0 9.508791 0.624281 -1.105148
53 1 0 9.480191 2.449069 0.615017

S26
54 1 0 10.368917 1.422513 1.718662
55 1 0 12.275209 1.323717 0.091627
56 1 0 11.386451 2.350013 -1.012025
57 1 0 -7.242486 -1.669645 1.649618
58 1 0 -9.623184 -1.558571 2.259876
59 1 0 -11.112510 0.232332 1.425167
60 6 0 12.098605 3.366395 0.746611
61 1 0 11.358579 4.173487 0.707016
62 1 0 12.246981 3.147661 1.809970
63 6 0 13.410333 3.847438 0.137501
64 1 0 13.286177 4.107587 -0.917158
65 1 0 13.793139 4.731892 0.651460
66 1 0 14.181292 3.074281 0.194419
---------------------------------------------------------------------
S0 – water Standard orientation:
---------------------------------------------------------------------
Center Atomic Atomic Coordinates (Angstroms)
Number Number Type X Y Z
---------------------------------------------------------------------
1 8 0 -5.103870 -1.714044 1.088389
2 6 0 -4.945191 -0.741562 0.375876
3 6 0 -3.608569 -0.360093 -0.228543
4 7 0 -5.963035 0.116994 0.048189
5 6 0 -2.504533 -1.361820 0.072666
6 6 0 -1.165931 -0.952149 -0.532121
7 6 0 -0.048772 -1.947766 -0.237735
8 6 0 1.292687 -1.548774 -0.843789
9 6 0 2.408595 -2.545480 -0.549171
10 6 0 3.752793 -2.142859 -1.162934
11 6 0 4.821479 -3.170445 -0.931074
12 6 0 5.958304 -3.036332 -0.253200
13 6 0 6.487559 -1.813446 0.436911
14 6 0 7.793956 -1.309041 -0.183606
15 6 0 8.385876 -0.112560 0.553724
16 6 0 9.684454 0.396187 -0.063810
17 6 0 10.278840 1.593197 0.671496
18 6 0 11.577224 2.101806 0.053715

S27
19 6 0 -7.296080 0.055445 0.445070
20 6 0 -7.874041 -0.880014 1.255776
21 6 0 -9.265848 -0.818682 1.581094
22 6 0 -10.100733 0.149598 1.120895
23 6 0 -9.538546 1.143270 0.273178
24 6 0 -8.144042 1.095459 -0.061860
25 7 0 -10.161664 2.175024 -0.288234
26 16 0 -9.062317 2.996859 -1.157410
27 7 0 -7.752713 2.079901 -0.858049
28 1 0 -3.734897 -0.243462 -1.310012
29 1 0 -3.336349 0.632317 0.147164
30 1 0 -5.737820 0.897963 -0.552254
31 1 0 -2.402384 -1.473410 1.155681
32 1 0 -2.794635 -2.345966 -0.306960
33 1 0 -1.274541 -0.839477 -1.617334
34 1 0 -0.880727 0.035962 -0.151980
35 1 0 0.061309 -2.057500 0.847660
36 1 0 -0.336847 -2.936453 -0.614334
37 1 0 1.182291 -1.440065 -1.929393
38 1 0 1.580851 -0.559601 -0.468282
39 1 0 2.527552 -2.654763 0.534581
40 1 0 2.121483 -3.534696 -0.924457
41 1 0 3.616324 -2.013712 -2.243767
42 1 0 4.051971 -1.166429 -0.774965
43 1 0 4.613345 -4.145505 -1.370452
44 1 0 6.610023 -3.907322 -0.192598
45 1 0 5.749675 -1.007873 0.434874
46 1 0 6.673618 -2.055310 1.490562
47 1 0 8.525758 -2.125165 -0.199843
48 1 0 7.613243 -1.042803 -1.231045
49 1 0 7.650785 0.701005 0.573953
50 1 0 8.564216 -0.385044 1.600917
51 1 0 10.419138 -0.417776 -0.083766
52 1 0 9.505416 0.667125 -1.111272
53 1 0 9.544151 2.407223 0.691520
54 1 0 10.458049 1.322402 1.719039
55 1 0 12.312952 1.288535 0.033748
56 1 0 11.399035 2.372915 -0.994067
57 1 0 -7.272264 -1.679029 1.657688

S28
58 1 0 -9.657818 -1.593543 2.229866
59 1 0 -11.151681 0.181364 1.376432
60 6 0 12.172839 3.299311 0.787534
61 1 0 11.438698 4.112518 0.806992
62 1 0 12.351778 3.028982 1.834222
63 6 0 13.469879 3.798999 0.161732
64 1 0 13.314977 4.108657 -0.875506
65 1 0 13.875134 4.655958 0.704669
66 1 0 14.234915 3.017669 0.159891
---------------------------------------------------------------------
S1 – gas phase Standard orientation:
---------------------------------------------------------------------
Center Atomic Atomic Coordinates (Angstroms)
Number Number Type X Y Z
---------------------------------------------------------------------
1 8 0 -5.116220 -1.790525 1.062690
2 6 0 -4.938786 -0.823319 0.367755
3 6 0 -3.614775 -0.450576 -0.258750
4 7 0 -5.964363 0.079712 0.059263
5 6 0 -2.501050 -1.430466 0.077636
6 6 0 -1.171308 -1.042445 -0.560072
7 6 0 -0.045599 -2.017005 -0.229742
8 6 0 1.288812 -1.636896 -0.862891
9 6 0 2.413776 -2.611298 -0.530502
10 6 0 3.752991 -2.225131 -1.164930
11 6 0 4.831805 -3.229294 -0.885105
12 6 0 5.954737 -3.056440 -0.195816
13 6 0 6.456800 -1.804659 0.460638
14 6 0 7.772517 -1.310005 -0.147350
15 6 0 8.332776 -0.077313 0.554177
16 6 0 9.642060 0.420477 -0.049446
17 6 0 10.203653 1.654081 0.650189
18 6 0 11.512785 2.151897 0.046590
19 6 0 -7.267727 0.070361 0.438340
20 6 0 -7.879970 -0.916050 1.271023
21 6 0 -9.215774 -0.797499 1.574442
22 6 0 -9.994825 0.271184 1.085204
23 6 0 -9.415044 1.261058 0.259467

S29
24 6 0 -8.042296 1.155509 -0.063213
25 7 0 -10.029725 2.319423 -0.269858
26 16 0 -8.859979 3.140543 -1.152009
27 7 0 -7.546633 2.111664 -0.842303
28 1 0 -3.754508 -0.380814 -1.344018
29 1 0 -3.351464 0.562166 0.068665
30 1 0 -5.737607 0.873585 -0.534532
31 1 0 -2.391884 -1.491797 1.163768
32 1 0 -2.793765 -2.432762 -0.246526
33 1 0 -1.289656 -0.981376 -1.648631
34 1 0 -0.886344 -0.035570 -0.231907
35 1 0 0.072703 -2.078486 0.858337
36 1 0 -0.330106 -3.023626 -0.557748
37 1 0 1.170856 -1.576394 -1.951532
38 1 0 1.572159 -0.629323 -0.535432
39 1 0 2.538890 -2.675913 0.555722
40 1 0 2.133359 -3.618312 -0.860785
41 1 0 3.616911 -2.145082 -2.250589
42 1 0 4.043263 -1.228909 -0.822898
43 1 0 4.643756 -4.221273 -1.293794
44 1 0 6.616641 -3.915763 -0.096534
45 1 0 5.711633 -1.007025 0.412058
46 1 0 6.617011 -2.004792 1.527336
47 1 0 8.513463 -2.117288 -0.112869
48 1 0 7.615579 -1.092406 -1.209380
49 1 0 7.589409 0.728469 0.522267
50 1 0 8.485076 -0.302209 1.616741
51 1 0 10.385602 -0.384893 -0.016876
52 1 0 9.489482 0.643955 -1.112091
53 1 0 9.460086 2.459570 0.617696
54 1 0 10.356346 1.430528 1.712938
55 1 0 12.257359 1.347194 0.078901
56 1 0 11.361103 2.376014 -1.016305
57 1 0 -7.280534 -1.731649 1.643019
58 1 0 -9.683042 -1.543285 2.205276
59 1 0 -11.045849 0.345429 1.336650
60 6 0 12.075594 3.385757 0.745193
61 1 0 11.332550 4.190369 0.712302
62 1 0 12.228381 3.162025 1.806886

S30
63 6 0 13.383489 3.874678 0.134135
64 1 0 13.254774 4.140009 -0.918676
65 1 0 13.764887 4.757744 0.651487
66 1 0 14.157394 3.104004 0.184304
---------------------------------------------------------------------
S1 – water Standard orientation:
---------------------------------------------------------------------
Center Atomic Atomic Coordinates (Angstroms)
Number Number Type X Y Z
---------------------------------------------------------------------
1 8 0 -5.181828 -1.852635 0.956525
2 6 0 -4.981315 -0.828203 0.350544
3 6 0 -3.639180 -0.392518 -0.179646
4 7 0 -6.009048 0.086424 0.070921
5 6 0 -2.535050 -1.403347 0.089102
6 6 0 -1.189918 -0.955173 -0.472245
7 6 0 -0.072977 -1.959818 -0.209615
8 6 0 1.272495 -1.532393 -0.786667
9 6 0 2.388263 -2.537702 -0.522319
10 6 0 3.733742 -2.114710 -1.119076
11 6 0 4.802532 -3.148130 -0.915448
12 6 0 5.948170 -3.027415 -0.250037
13 6 0 6.491128 -1.816167 0.449871
14 6 0 7.788215 -1.305812 -0.185278
15 6 0 8.395089 -0.120295 0.557543
16 6 0 9.684210 0.393405 -0.075561
17 6 0 10.293615 1.580405 0.663621
18 6 0 11.582493 2.093427 0.029748
19 6 0 -7.324603 0.029631 0.384849
20 6 0 -7.956444 -1.038125 1.100106
21 6 0 -9.301545 -0.979382 1.355802
22 6 0 -10.096039 0.112172 0.932580
23 6 0 -9.509814 1.180357 0.226733
24 6 0 -8.110944 1.140607 -0.050669
25 7 0 -10.127278 2.269486 -0.233166
26 16 0 -8.949410 3.201751 -0.991622
27 7 0 -7.624386 2.175030 -0.716579
28 1 0 -3.738495 -0.204577 -1.254372

S31
29 1 0 -3.393620 0.577272 0.267545
30 1 0 -5.749963 0.924236 -0.441586
31 1 0 -2.450468 -1.569200 1.166763
32 1 0 -2.813978 -2.367179 -0.346160
33 1 0 -1.282590 -0.789694 -1.551976
34 1 0 -0.916732 0.013875 -0.038596
35 1 0 0.027511 -2.115356 0.871017
36 1 0 -0.354866 -2.932062 -0.630854
37 1 0 1.171168 -1.380707 -1.867957
38 1 0 1.554413 -0.558390 -0.369258
39 1 0 2.504061 -2.683235 0.557490
40 1 0 2.102705 -3.513854 -0.931469
41 1 0 3.600086 -1.952814 -2.195910
42 1 0 4.030875 -1.150281 -0.700752
43 1 0 4.586619 -4.115645 -1.367621
44 1 0 6.598033 -3.901027 -0.211237
45 1 0 5.755353 -1.008961 0.471606
46 1 0 6.694094 -2.073876 1.496598
47 1 0 8.517886 -2.123055 -0.224541
48 1 0 7.590667 -1.025396 -1.225949
49 1 0 7.662360 0.694508 0.600597
50 1 0 8.590474 -0.406635 1.597968
51 1 0 10.416684 -0.421705 -0.117658
52 1 0 9.488113 0.677179 -1.116549
53 1 0 9.561238 2.395675 0.705589
54 1 0 10.489944 1.296978 1.704731
55 1 0 12.316010 1.278976 -0.011805
56 1 0 11.387198 2.376646 -1.011763
57 1 0 -7.357774 -1.872839 1.425450
58 1 0 -9.772780 -1.789783 1.896706
59 1 0 -11.156973 0.131618 1.148851
60 6 0 12.193053 3.281431 0.766686
61 1 0 11.461156 4.095859 0.807584
62 1 0 12.389065 2.999088 1.807123
63 6 0 13.480437 3.785407 0.124575
64 1 0 13.308717 4.106780 -0.906433
65 1 0 13.896673 4.635520 0.669955
66 1 0 14.243626 3.002620 0.101219
---------------------------------------------------------------------

S32
REFERENCES
1. Frisch, M. J., Trucks, G. W., Schlegel, H. B., Scuseria, G. E., Robb, M. A., Cheeseman, J. R., Scalmani,
G., Barone, V., Mennucci, B., Petersson, G. A., Nakatsuji, H., Caricato, M., Li, X., Hratchian, H. P.,
Izmaylov, A. F., Bloino, J., Zheng, G., Sonnenberg, J. L., Hada, M., Ehara, M., Toyota, K., Fukuda, R.,
Hasegawa, J., Ishida, M., Nakajima, T., Honda, Y., Kitao, O., Nakai, H., Vreven, T., Montgomery, J. A.,
Peralta, J. E., Ogliaro, F., Bearpark, M., Heyd, J. J., Brothers, E., Kudin, K. N., Staroverov, V. N.,
Kobayashi, R., Normand, J., Raghavachari, K., Rendell, A., Burant, J. C., Iyengar, S. S., Tomasi, J.,
Cossi, M., Rega, N., Millam, J. M., Klene, M., Knox, J. E., Cross, J. B., Bakken, V., Adamo, C.,
Jaramillo, J., Gomperts, R., Stratmann, R. E., Yazyev, O., Austin, A. J., Cammi, R., Pomelli, C.,
Ochterski, J. W., Martin, R. L., Morokuma, K., Zakrzewski, V. G., Voth, G. A., Salvador, P.,
Dannenberg, J. J., Dapprich, S., Daniels, A. D., Farkas, Foresman, J. B., Ortiz, J. V., Cioslowski, J., and
Fox, D. J. (2009) Gaussian 09, Revision A.02, Wallingford CT.
2. T. Yanai, D. Tew, and N. Hand , A new h rid e hange-correlation functional using the Coulomb-
attenuating method (CAM-B3LYP), Chem. Phys. Lett., 393 (2004) 51-57
3. Fonseca, T. L., de Oliveira, H. C. B., and Castro, M. A. (2008) Theoretical study of the lowest
electronic transitions of sulfur-bearing mesoionic compounds in gas-phase and in dimethyl
sulfoxide, Chem. Phys. Lett. 457, 119-123.
4. Miertus, S., Scrocco, E., and Tomasi, J. (1981) Electrostatic interaction of a solute with a continuum
- a direct utilization of abinitio molecular potentials for the prevision of solvent effects, Chem. Phys.
55, 117-129.
5. Cammi, R., and Tomasi, J. (1995) Remarks on the use of the apparent surface-charges (asc) methods
in solvation problems - iterative versus matrix-inversion procedures and the renormalization of the
apparent charges, J. Comput. Chem. 16, 1449-1458.
6. Tomasi, J., Mennucci, B., and Cammi, R. (2005) Quantum mechanical continuum solvation models,
Chem Rev 105, 2999-3093.
7. M. J. Frisch, G. W. Trucks, H. B. Schlegel, G. E. Scuseria, M. A. Robb, J. R. Cheeseman, G.
Scalmani, V. Barone, B. Mennucci, G. A. Petersson, H. Nakatsuji, M. Caricato, X. Li, H. P.
Hratchian, A. F. Izmaylov, J. Bloino, G. Zheng, J. L. Sonnenberg, M. Hada, M. Ehara, K. Toyota, R.
Fukuda, J. Hasegawa, M. Ishida, T. Nakajima, Y. Honda, O. Kitao, H. Nakai, T. Vreven, J. A.
S33
Montgomery, J. E. Peralta, F. Ogliaro, M. Bearpark, J. J. Heyd, E. Brothers, K. N. Kudin, V. N.
Staroverov, R. Kobayashi, J. Normand, K. Raghavachari, A. Rendell, J. C. Burant, S. S. Iyengar, J.
Tomasi, M. Cossi, N. Rega, J. M. Millam, M. Klene, J. E. Knox, J. B. Cross, V. Bakken, C. Adamo,
J. Jaramillo, R. Gomperts, R. E. Stratmann, O. Yazyev, A. J. Austin, R. Cammi, C. Pomelli, J. W.
Ochterski, R. L. Martin, K. Morokuma, V. G. Zakrzewski, G. A. Voth, P. Salvador, J. J.
Dannenberg, S. Dapprich, A. D. Daniels, Farkas, J. B. Foresman, J. V. Ortiz, J. Cioslowski and D. J.
Fox, Wallingford CT, 2009.
8. T. L. Fonseca, H. C. B. de Oliveira and M. A. Castro, Chem. Phys. Lett., 2008, 457, 119-123.
9. N. L. Marana, V. M. Longo, E. Longo, J. B. L. Martins and J. R. Sambrano, J. Phys. Chem. A, 2008,
112, 8958-8963.
10. S. Miertus, E. Scrocco and J. Tomasi, Chem. Phys., 1981, 55, 117-129.
11. R. Cammi and J. Tomasi, J. Comput. Chem., 1995, 16, 1449-1458.
12. J. Tomasi, B. Mennucci and R. Cammi, Chem. Rev., 2005, 105, 2999-3093.
13. S. Curry, H. Mandelkow, P. Brick and N. Franks, Nat Struct Biol, 1998, 5, 827-835.
14. C. Lucke, Y. Qiao, H. T. van Moerkerk, J. H. Veerkamp and J. A. Hamilton, Biochemistry, 2006,
45, 6296-6305.
15. P. J. Goodford, J. Med. Chem., 1985, 28, 849-857.
16. S. J. Weiner, P. A. Kollman, D. T. Nguyen and D. A. Case, J. Comp. Chem., 1986, 7, 230-252.
17. G. M. Morris, D. S. Goodsell, R. S. Halliday, R. Huey, W. E. Hart, R. K. Belew and A. J. Olson, J.
Comp. Chem., 1998, 19, 1639-1662.
18. R. Huey, G. M. Morris, A. J. Olson and D. S. Goodsell, J. Comp. Chem., 2007, 28, 1145-1152.
19. G. M. Morris, R. Huey, W. Lindstrom, M. F. Sanner, R. K. Belew, D. S. Goodsell and A. J. Olson,
J. Comp. Chem., 2009, 30, 2785-2791.