*1 .%/%/ 0+ '/ * % ( ( // ++) - wika · corporate assessment 1.bpkp = board of finance and...
TRANSCRIPT

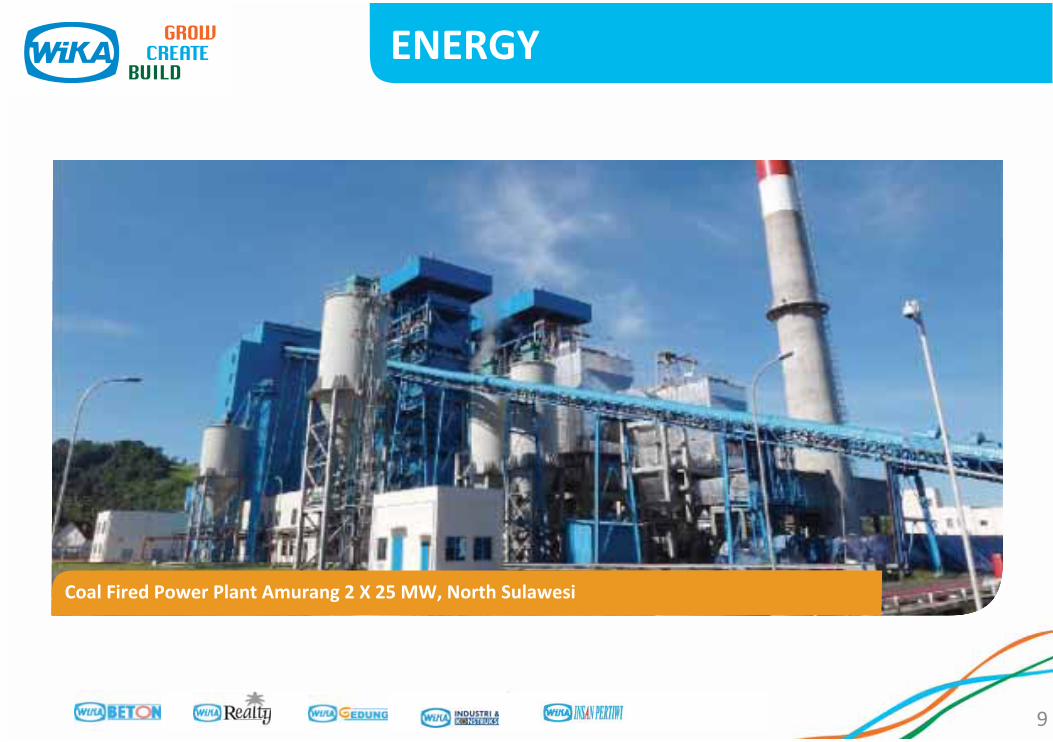
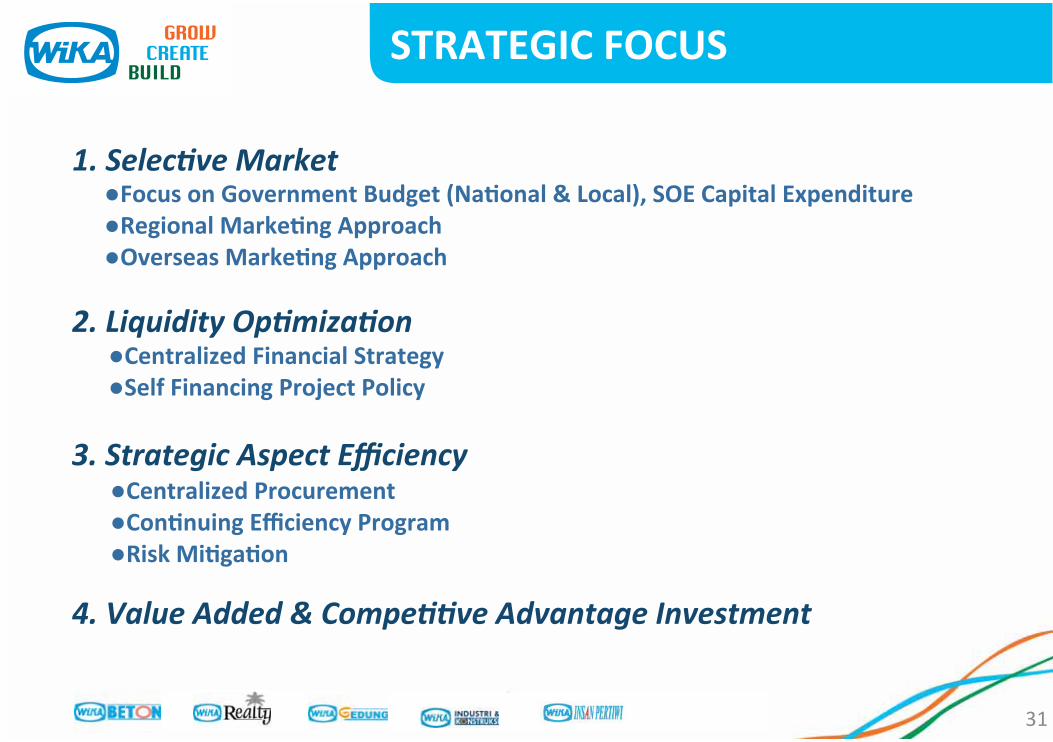
• Providing Excellent Integrated Product in Energy, Industrial & Infrastructure
• Accomplish Key Stakeholders Expectation• Practicing Business Ethics to Promote Good Corporate Citizen
and Company Sustainability• Strategic Overseas Expansion• Implementing “Best Practice” Integrated Management System
••
••••••
•
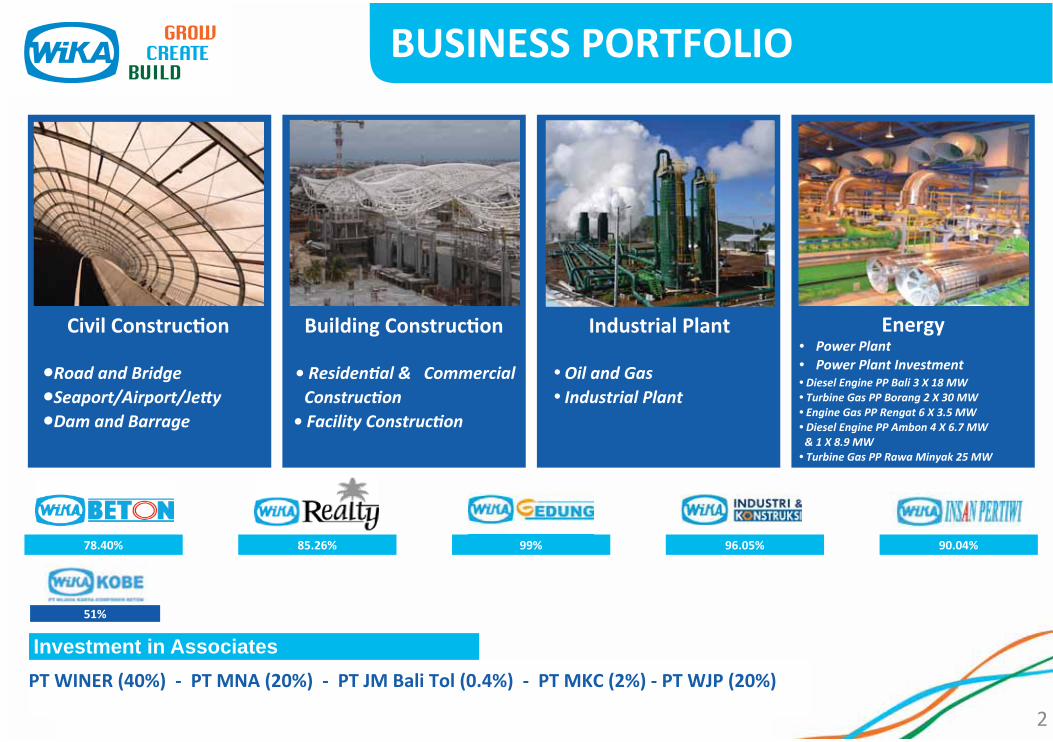
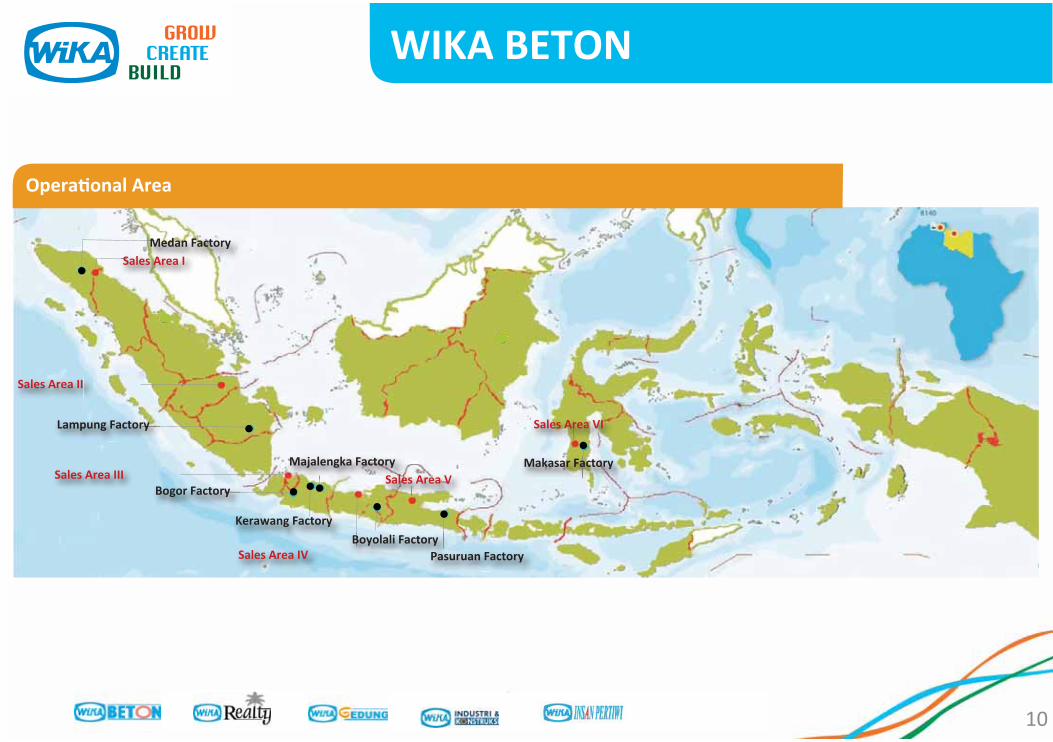
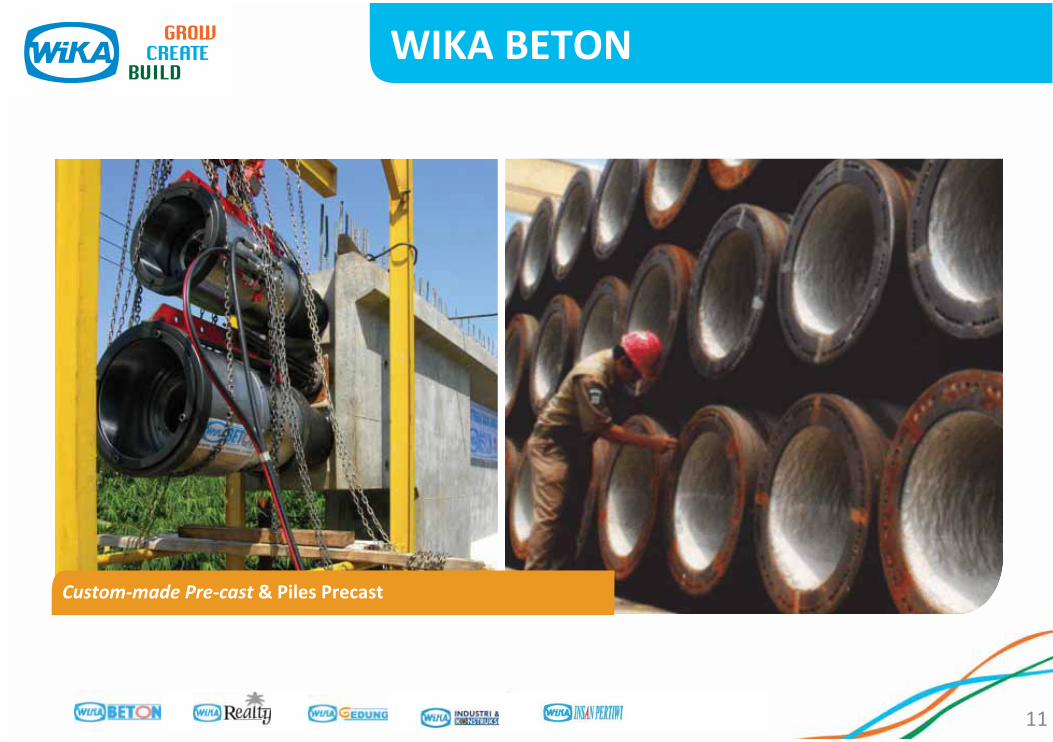
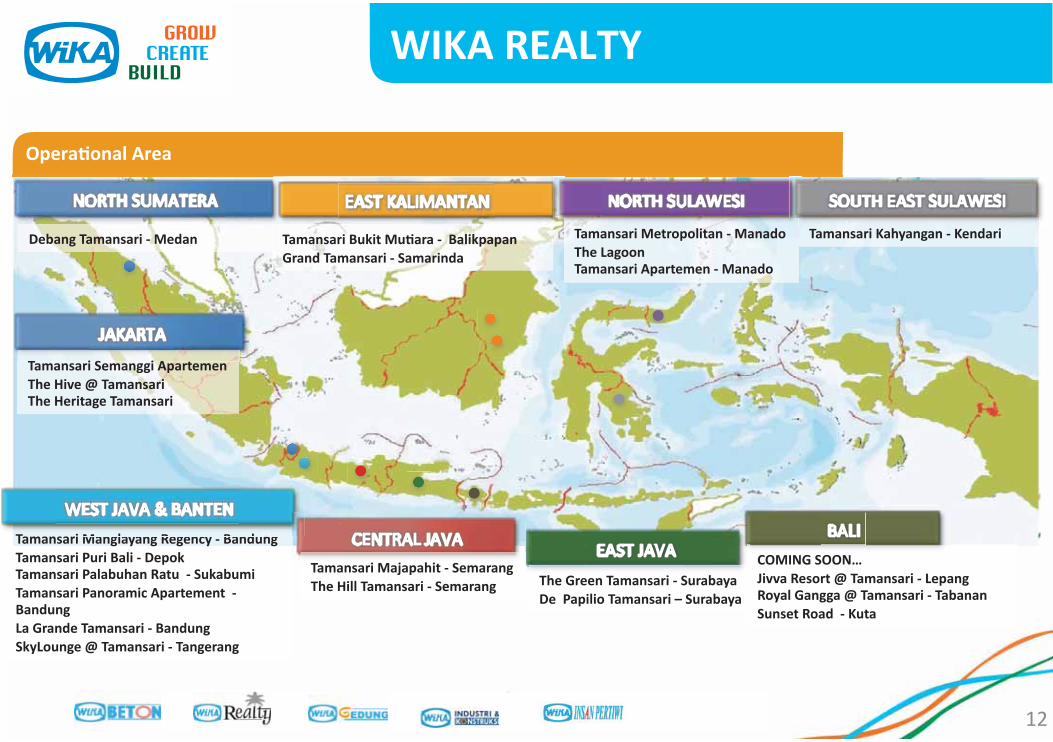
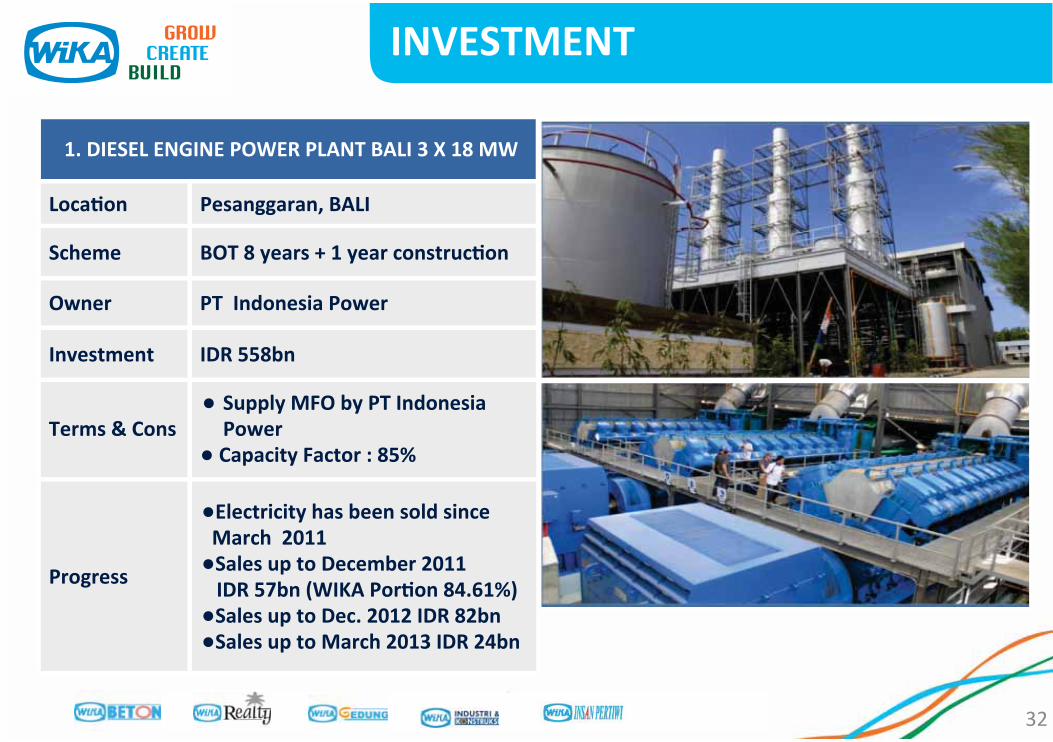
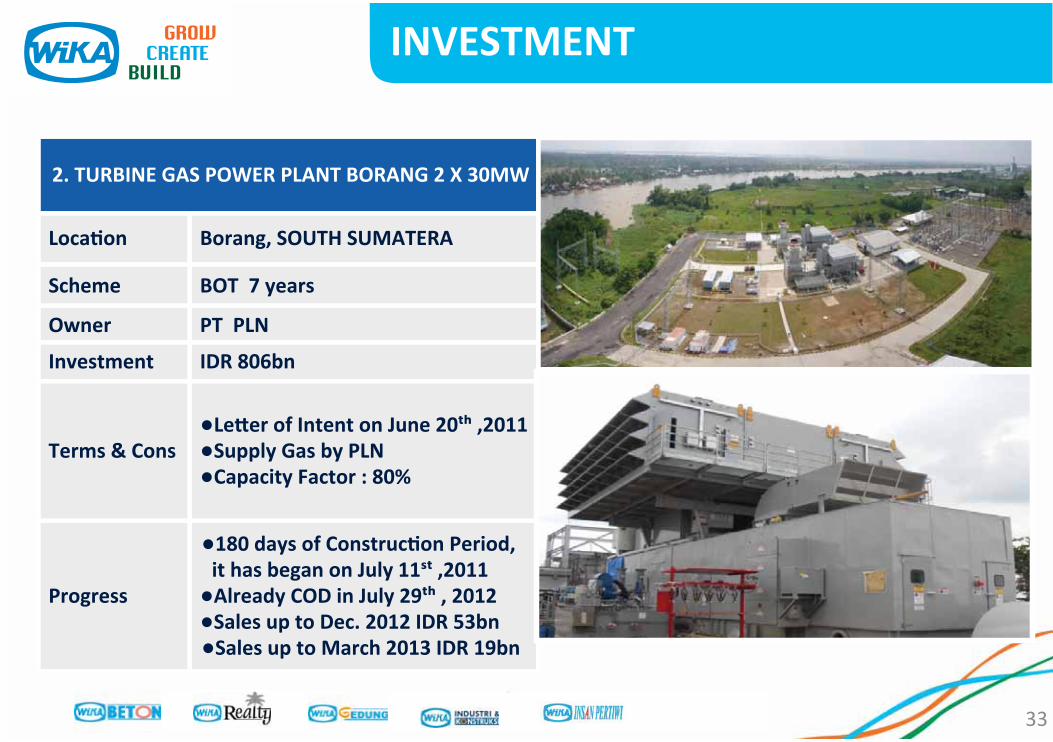
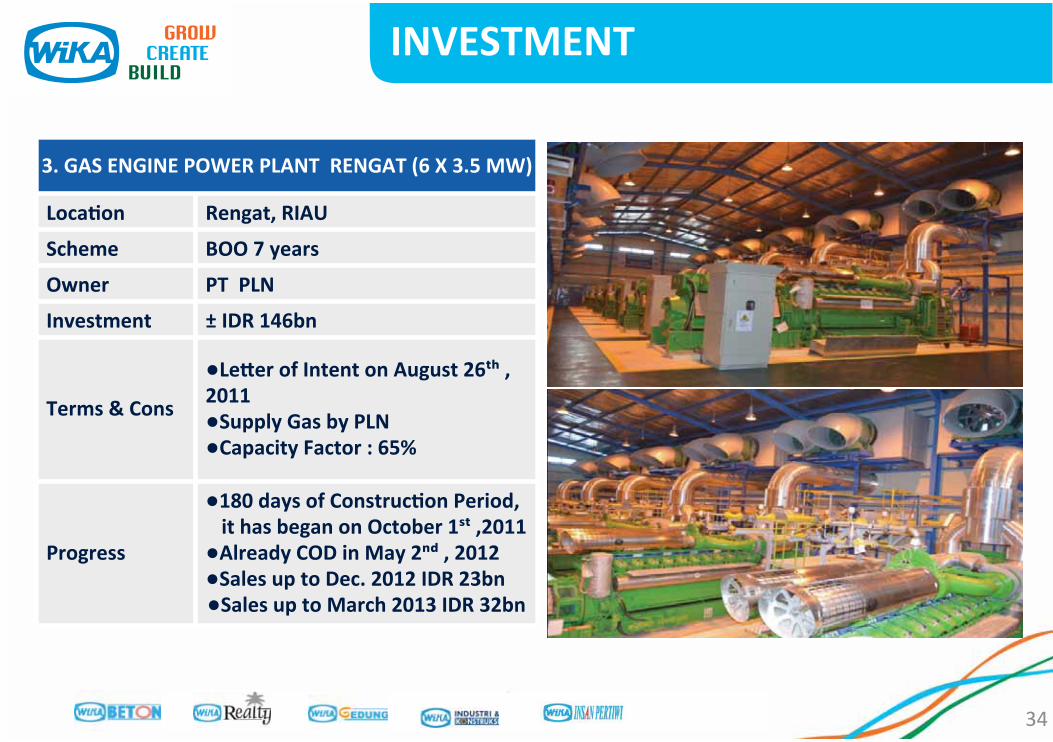
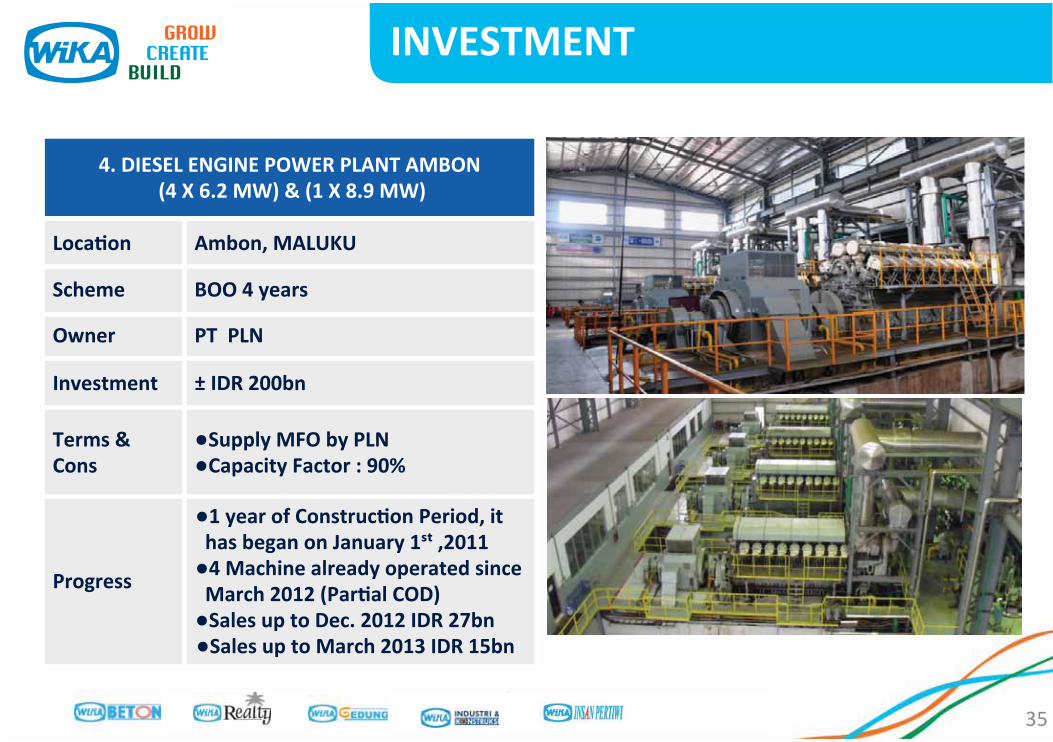
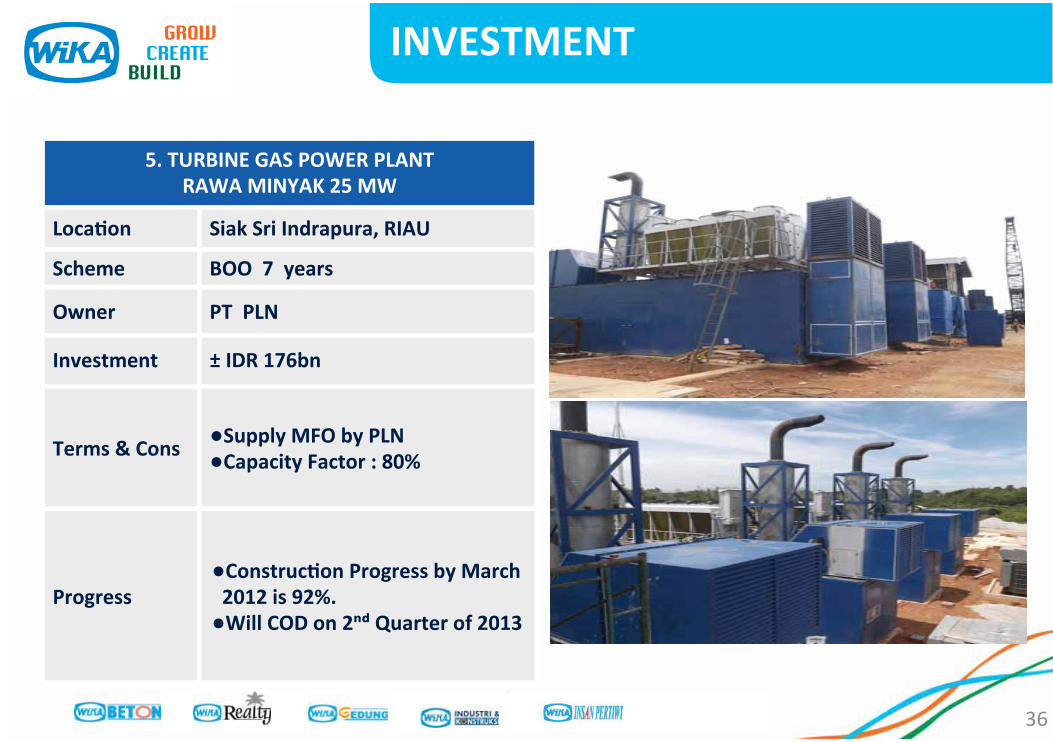
Investment in Associates


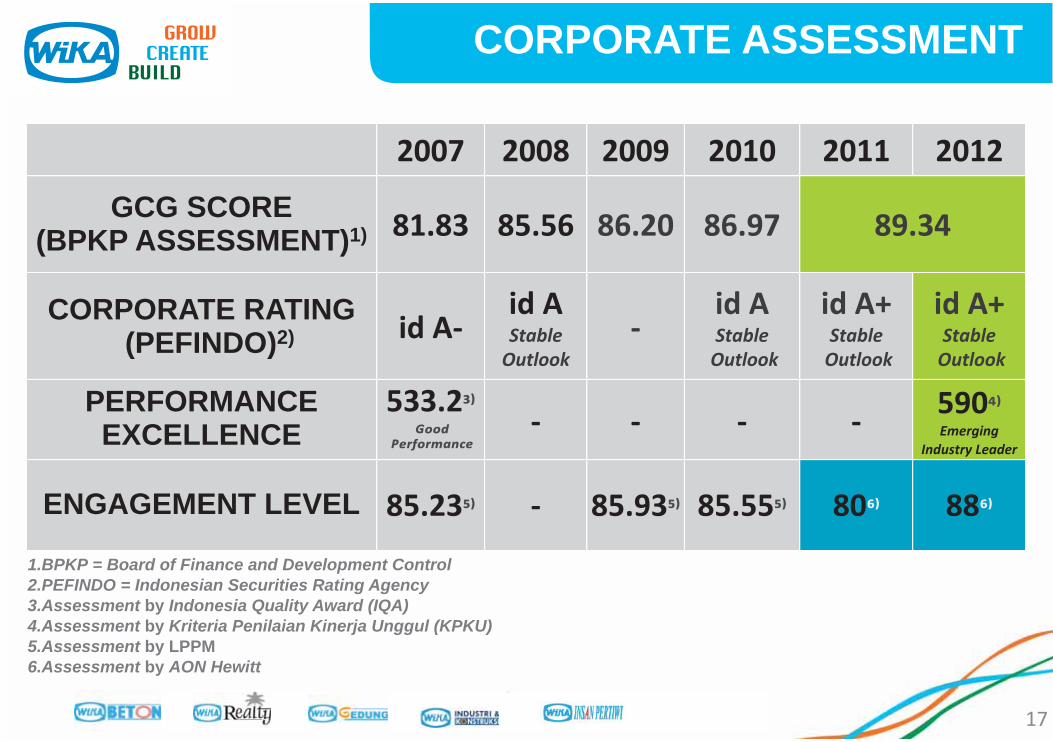
CORPORATE ASSESSMENT
1.BPKP = Board of Finance and Development Control2.PEFINDO = Indonesian Securities Rating Agency3.Assessment by Indonesia Quality Award (IQA)4.Assessment by Kriteria Penilaian Kinerja Unggul (KPKU)5.Assessment by LPPM6.Assessment by AON Hewitt
GCG SCORE(BPKP ASSESSMENT)1)
CORPORATE RATING (PEFINDO)2)
PERFORMANCE EXCELLENCE
ENGAGEMENT LEVEL

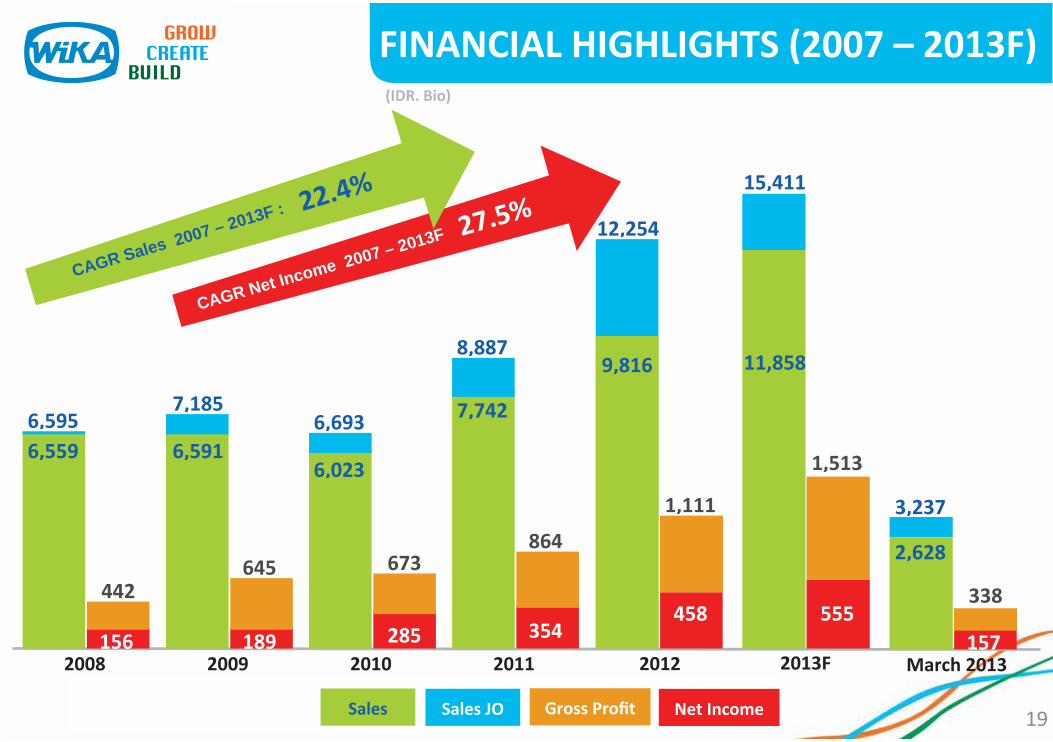
CAGR Net Income 2007 – 2013F
CAGR Sales 2007 – 2013F :
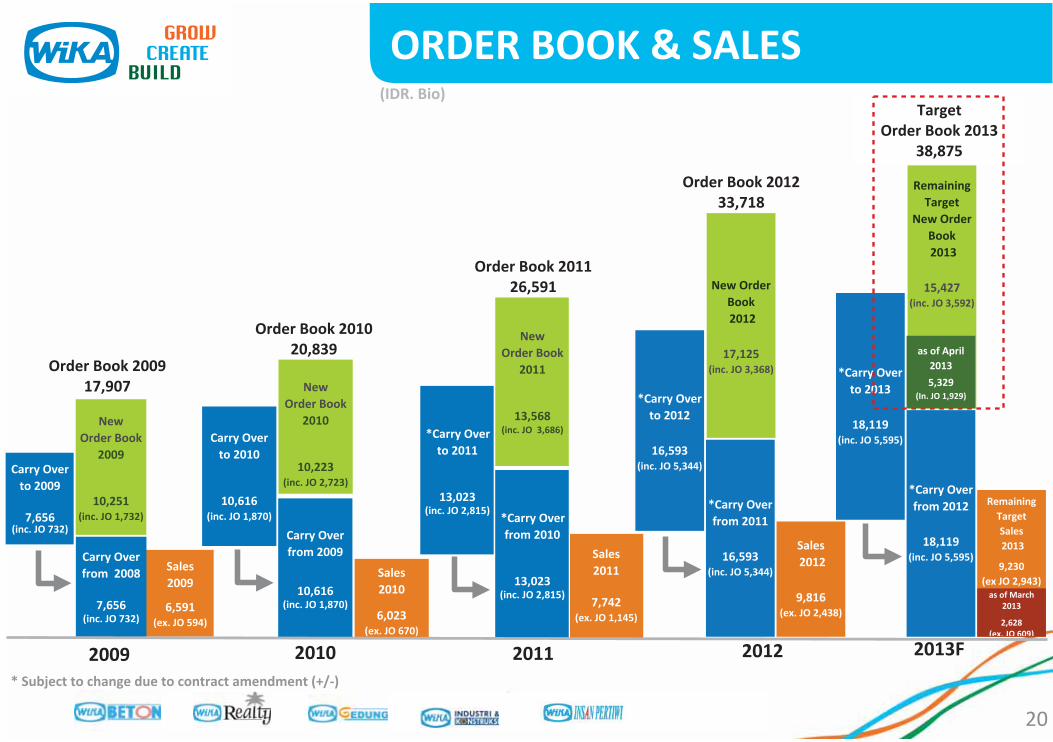
Carry Over from 2009
Carry Over
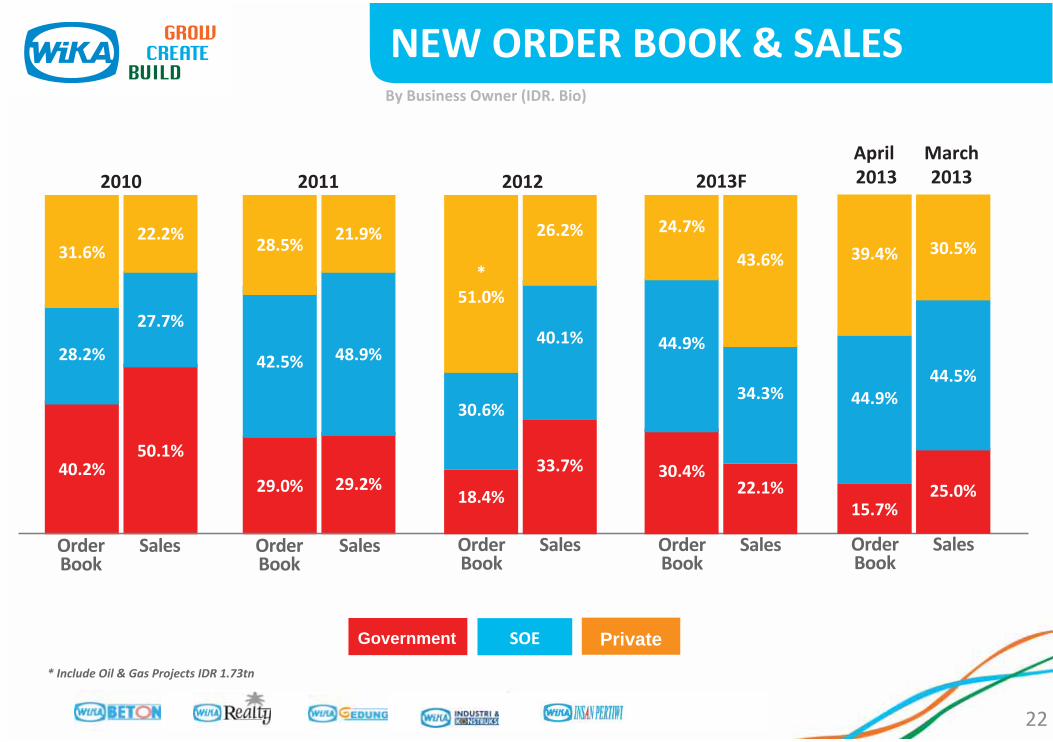
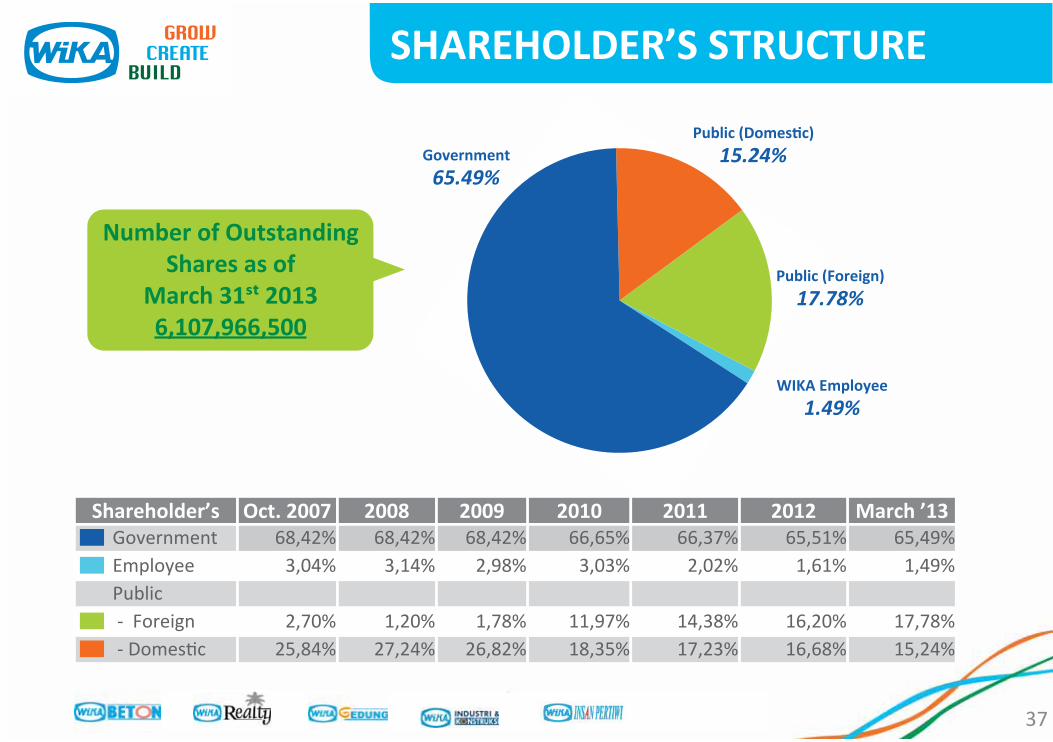
Government Private
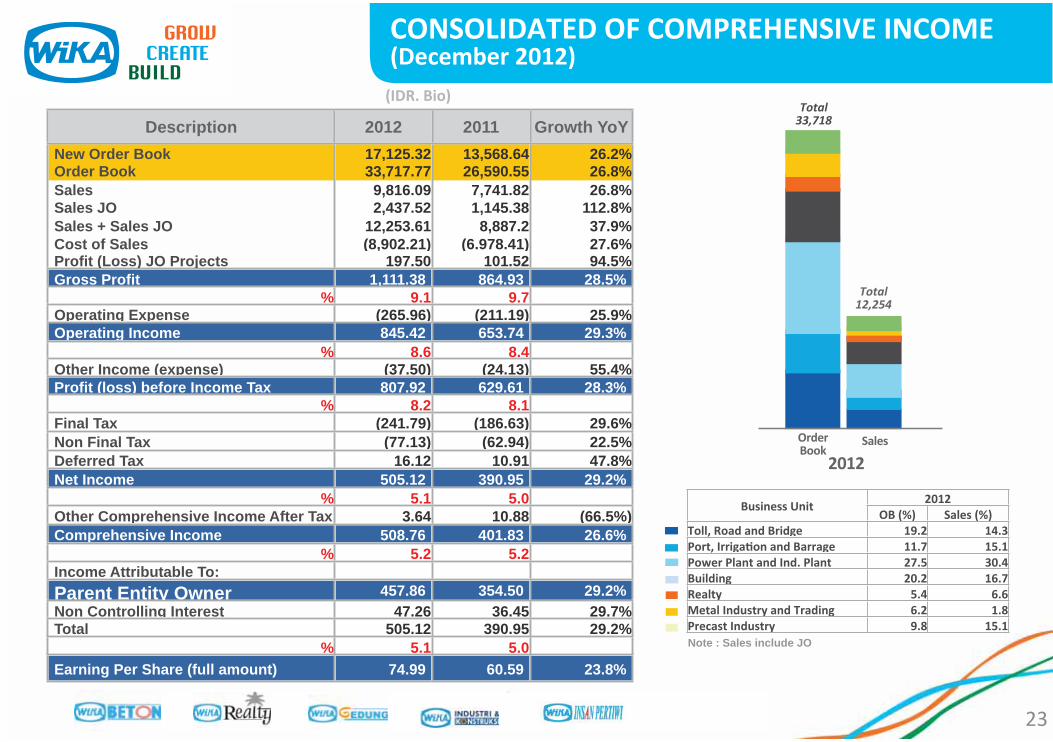
Description 2012 2011 Growth YoY
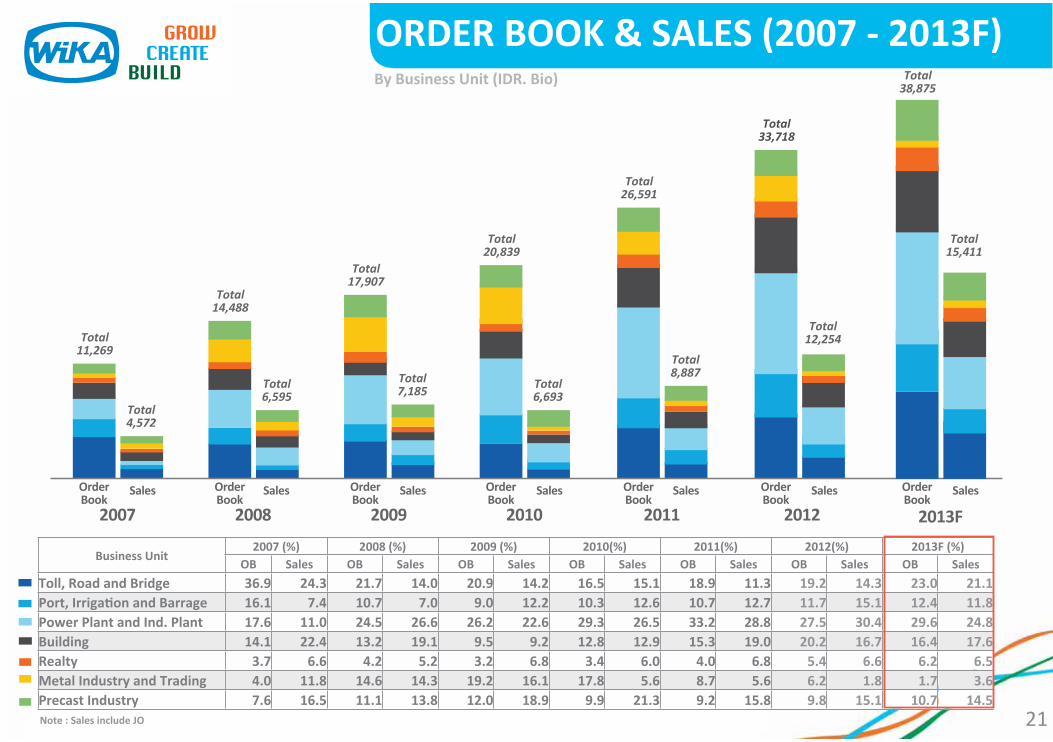
New Order Book 17,125.32 13,568.64 26.2%Order Book 33,717.77 26,590.55 26.8%Sales 9,816.09 7,741.82 26.8%Sales JO 2,437.52 1,145.38 112.8%Sales + Sales JO 12,253.61 8,887.2 37.9%Cost of Sales (8,902.21) (6.978.41) 27.6%Profit (Loss) JO Projects 197.50 101.52 94.5%Gross Profit 1,111.38 864.93 28.5%
% 9.1 9.7Operating Expense (265.96) (211.19) 25.9%Operating Income 845.42 653.74 29.3%
% 8.6 8.4Other Income (expense) (37.50) (24.13) 55.4%Profit (loss) before Income Tax 807.92 629.61 28.3%
% 8.2 8.1Final Tax (241.79) (186.63) 29.6%Non Final Tax (77.13) (62.94) 22.5%Deferred Tax 16.12 10.91 47.8%Net Income 505.12 390.95 29.2%
% 5.1 5.0Other Comprehensive Income After Tax 3.64 10.88 (66.5%)Comprehensive Income 508.76 401.83 26.6%
% 5.2 5.2Income Attributable To:
Parent Entity Owner 457.86 354.50 29.2%Non Controlling Interest 47.26 36.45 29.7%Total 505.12 390.95 29.2%
% 5.1 5.0Earning Per Share (full amount) 74.99 60.59 23.8%
Note : Sales include JO
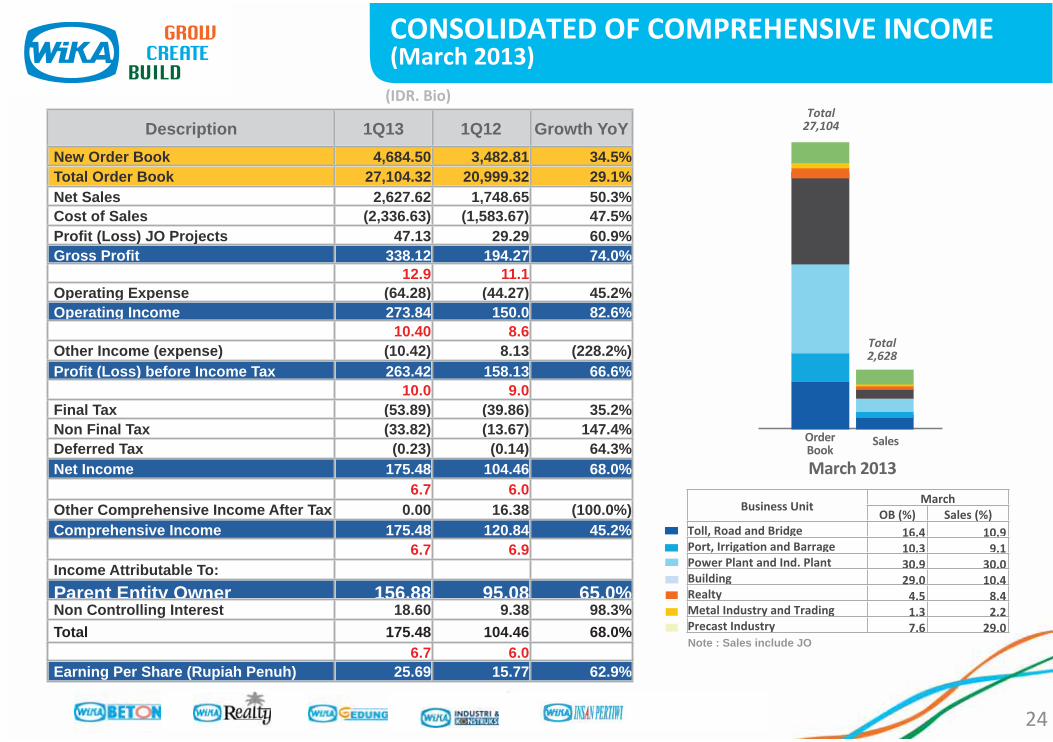
Description 1Q13 1Q12 Growth YoY
New Order Book 4,684.50 3,482.81 34.5%Total Order Book 27,104.32 20,999.32 29.1%Net Sales 2,627.62 1,748.65 50.3%Cost of Sales (2,336.63) (1,583.67) 47.5%Profit (Loss) JO Projects 47.13 29.29 60.9%Gross Profit 338.12 194.27 74.0%
12.9 11.1Operating Expense (64.28) (44.27) 45.2%Operating Income 273.84 150.0 82.6%
10.40 8.6Other Income (expense) (10.42) 8.13 (228.2%)Profit (Loss) before Income Tax 263.42 158.13 66.6%
10.0 9.0Final Tax (53.89) (39.86) 35.2%Non Final Tax (33.82) (13.67) 147.4%Deferred Tax (0.23) (0.14) 64.3%Net Income 175.48 104.46 68.0%
6.7 6.0Other Comprehensive Income After Tax 0.00 16.38 (100.0%)Comprehensive Income 175.48 120.84 45.2%
6.7 6.9Income Attributable To:
Parent Entity Owner 156.88 95.08 65,0%Non Controlling Interest 18.60 9.38 98.3%
Total 175.48 104.46 68.0%6.7 6.0
Earning Per Share (Rupiah Penuh) 25.69 15.77 62.9%
Note : Sales include JO
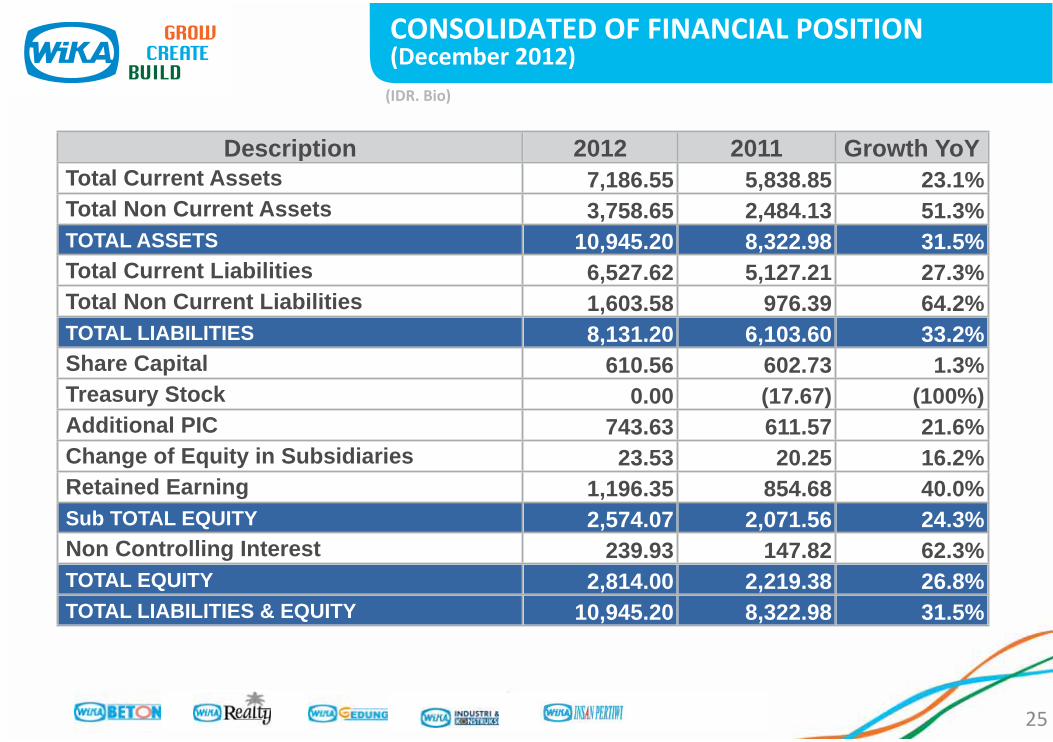
Description 2012 2011 Growth YoYTotal Current Assets 7,186.55 5,838.85 23.1%Total Non Current Assets 3,758.65 2,484.13 51.3%TOTAL ASSETS 10,945.20 8,322.98 31.5%Total Current Liabilities 6,527.62 5,127.21 27.3%Total Non Current Liabilities 1,603.58 976.39 64.2%TOTAL LIABILITIES 8,131.20 6,103.60 33.2%Share Capital 610.56 602.73 1.3%Treasury Stock 0.00 (17.67) (100%)Additional PIC 743.63 611.57 21.6%Change of Equity in Subsidiaries 23.53 20.25 16.2%Retained Earning 1,196.35 854.68 40.0%Sub TOTAL EQUITY 2,574.07 2,071.56 24.3%Non Controlling Interest 239.93 147.82 62.3%TOTAL EQUITY 2,814.00 2,219.38 26.8%TOTAL LIABILITIES & EQUITY 10,945.20 8,322.98 31.5%
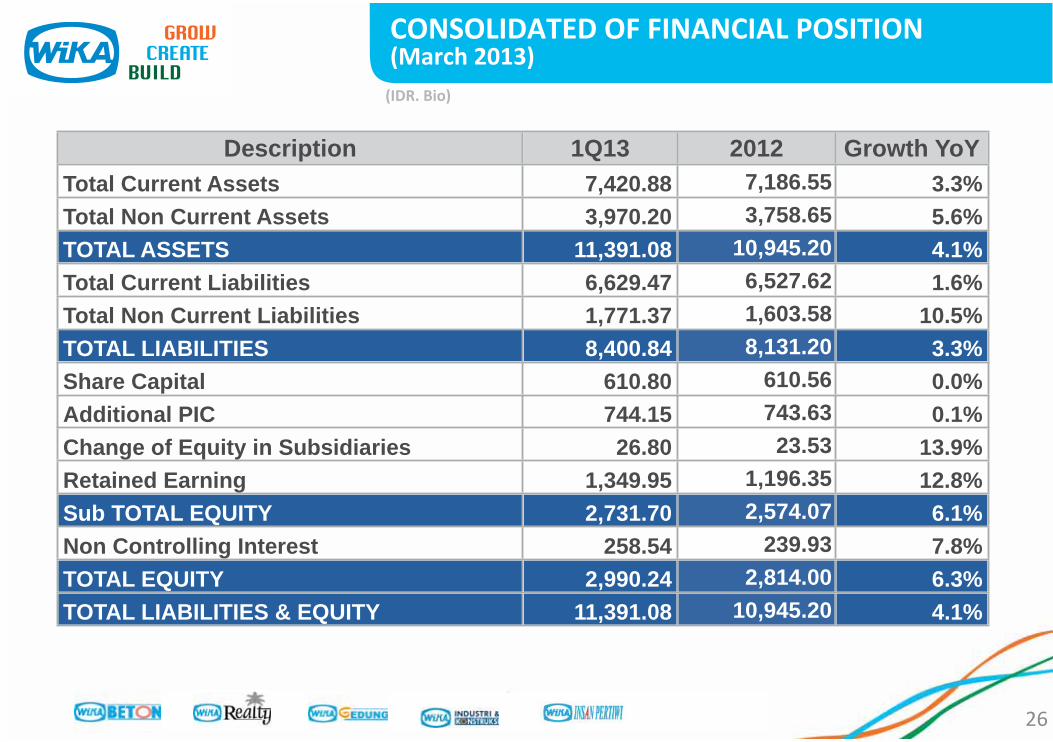
Description 1Q13 2012 Growth YoYTotal Current Assets 7,420.88 7,186.55 3.3%Total Non Current Assets 3,970.20 3,758.65 5.6%TOTAL ASSETS 11,391.08 10,945.20 4.1%Total Current Liabilities 6,629.47 6,527.62 1.6%Total Non Current Liabilities 1,771.37 1,603.58 10.5%TOTAL LIABILITIES 8,400.84 8,131.20 3.3%Share Capital 610.80 610.56 0.0%Additional PIC 744.15 743.63 0.1%Change of Equity in Subsidiaries 26.80 23.53 13.9%Retained Earning 1,349.95 1,196.35 12.8%Sub TOTAL EQUITY 2,731.70 2,574.07 6.1%Non Controlling Interest 258.54 239.93 7.8%TOTAL EQUITY 2,990.24 2,814.00 6.3%TOTAL LIABILITIES & EQUITY 11,391.08 10,945.20 4.1%
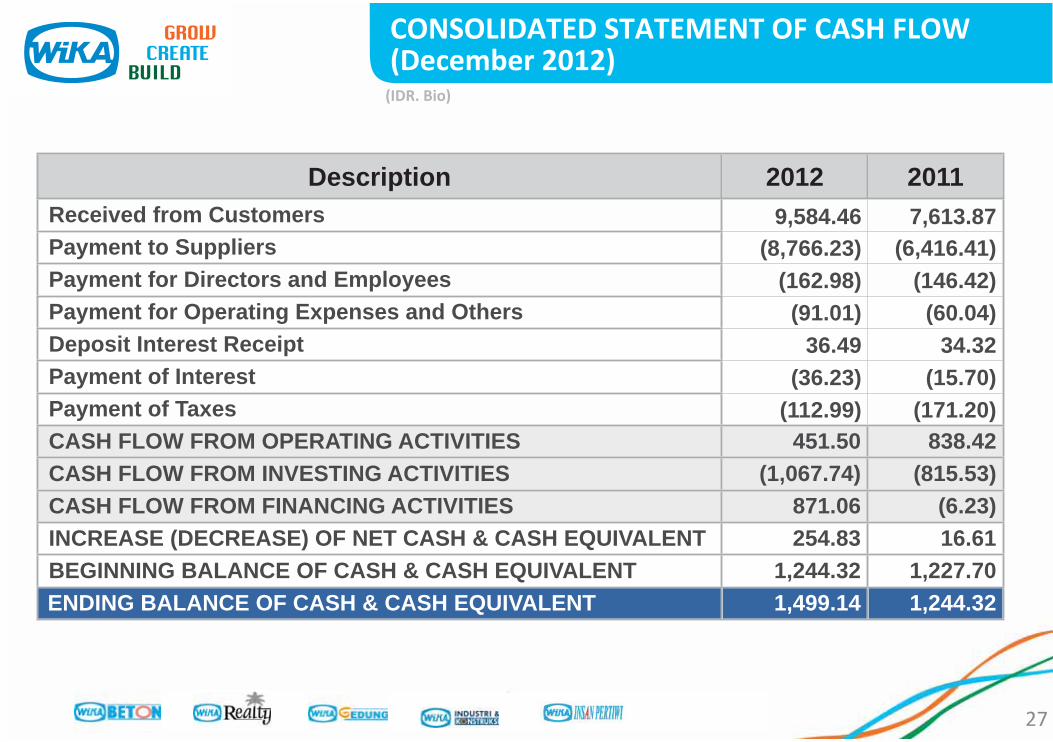
Description 2012 2011Received from Customers 9,584.46 7,613.87Payment to Suppliers (8,766.23) (6,416.41)Payment for Directors and Employees (162.98) (146.42)Payment for Operating Expenses and Others (91.01) (60.04)Deposit Interest Receipt 36.49 34.32Payment of Interest (36.23) (15.70)Payment of Taxes (112.99) (171.20)CASH FLOW FROM OPERATING ACTIVITIES 451.50 838.42CASH FLOW FROM INVESTING ACTIVITIES (1,067.74) (815.53)CASH FLOW FROM FINANCING ACTIVITIES 871.06 (6.23)INCREASE (DECREASE) OF NET CASH & CASH EQUIVALENT 254.83 16.61BEGINNING BALANCE OF CASH & CASH EQUIVALENT 1,244.32 1,227.70ENDING BALANCE OF CASH & CASH EQUIVALENT 1,499.14 1,244.32
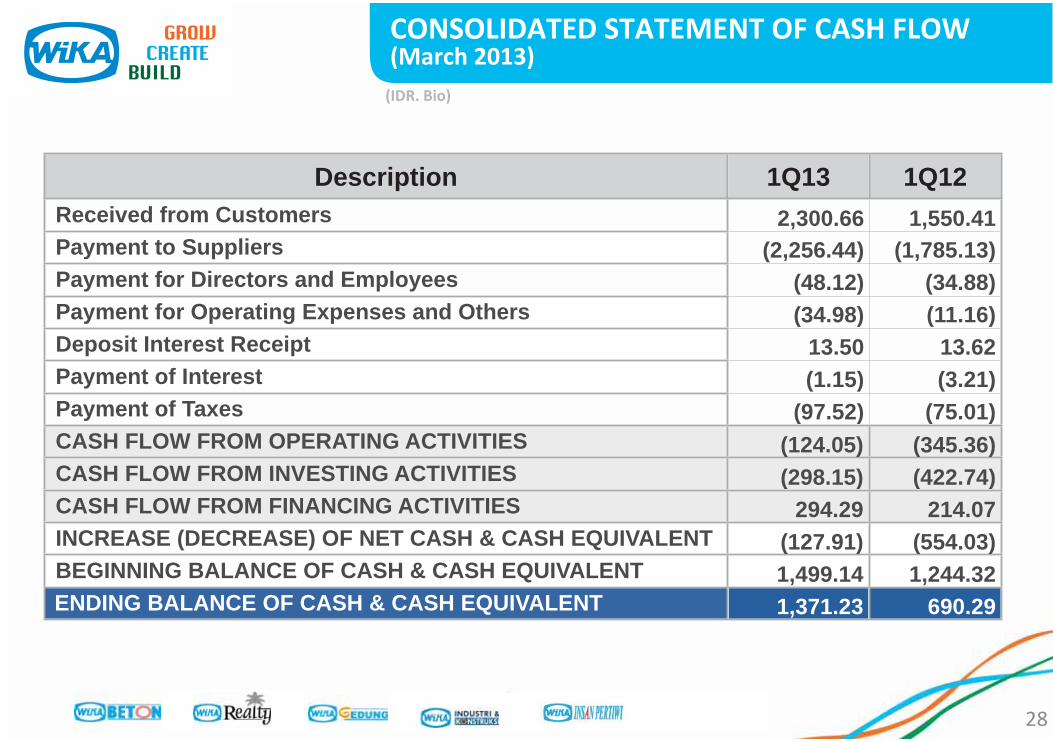
Description 1Q13 1Q12Received from Customers 2,300.66 1,550.41Payment to Suppliers (2,256.44) (1,785.13)Payment for Directors and Employees (48.12) (34.88)Payment for Operating Expenses and Others (34.98) (11.16)Deposit Interest Receipt 13.50 13.62Payment of Interest (1.15) (3.21)Payment of Taxes (97.52) (75.01)CASH FLOW FROM OPERATING ACTIVITIES (124.05) (345.36)CASH FLOW FROM INVESTING ACTIVITIES (298.15) (422.74)CASH FLOW FROM FINANCING ACTIVITIES 294.29 214.07INCREASE (DECREASE) OF NET CASH & CASH EQUIVALENT (127.91) (554.03)BEGINNING BALANCE OF CASH & CASH EQUIVALENT 1,499.14 1,244.32ENDING BALANCE OF CASH & CASH EQUIVALENT 1,371.23 690.29
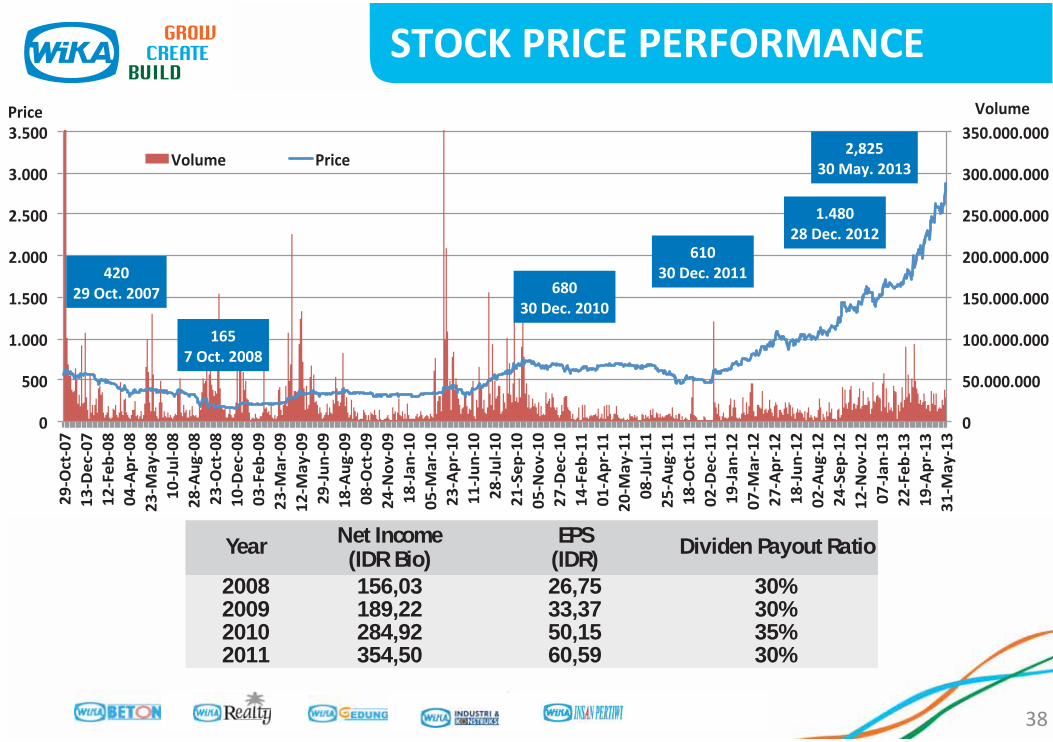
Year Net Income(IDR Bio)
EPS(IDR)
Dividen Payout Ratio
2008 156,03 26,75 30%2009 189,22 33,37 30%2010 284,92 50,15 35%2011 354,50 60,59 30%
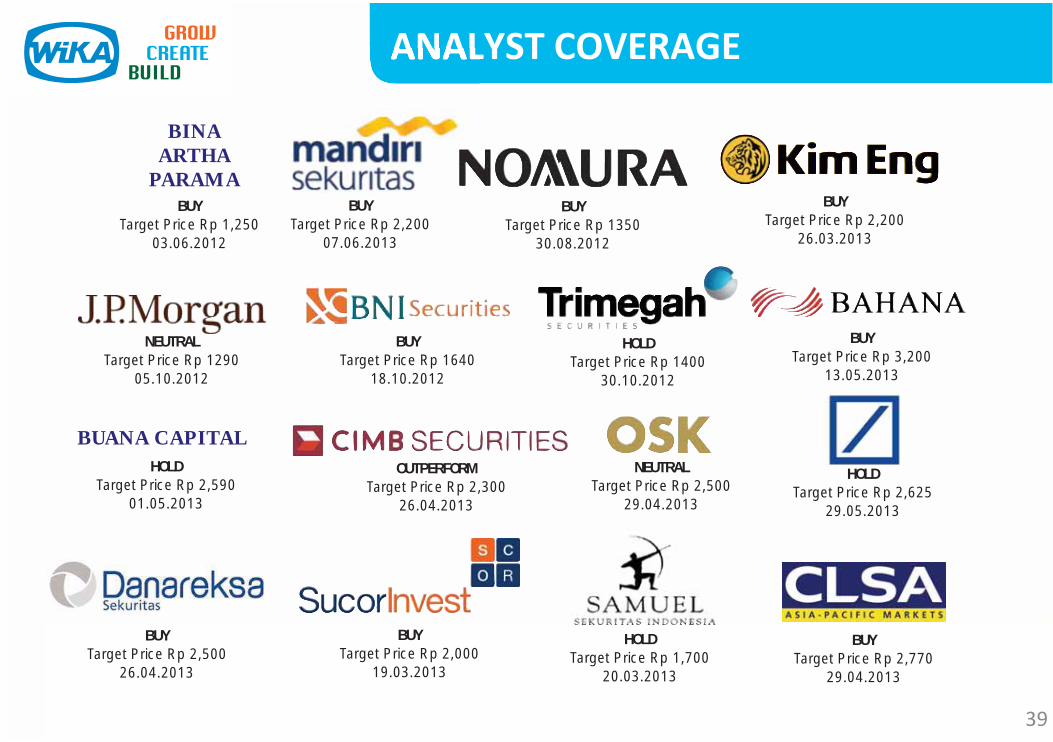
BUYTarget Price Rp 2,770
29.04.2013
BINAARTHA
PARAMABUY
Target Price Rp 1,25003.06.2012
BUYTarget Price Rp 2,200
07.06.2013
BUYTarget Price Rp 1350
30.08.2012
BUYTarget Price Rp 2,200
26.03.2013
NEUTRALTarget Price Rp 1290
05.10.2012
BUYTarget Price Rp 1640
18.10.2012
HOLDTarget Price Rp 1400
30.10.2012
BUYTarget Price Rp 2,000
19.03.2013
OUTPERFORMTarget Price Rp 2,300
26.04.2013
BUANA CAPITALHOLD
Target Price Rp 2,59001.05.2013
BUYTarget Price Rp 3,200
13.05.2013
HOLDTarget Price Rp 1,700
20.03.2013
NEUTRALTarget Price Rp 2,500
29.04.2013
HOLDTarget Price Rp 2,625
29.05.2013
BUYTarget Price Rp 2,500
26.04.2013
Additional Information is available upon request. For further Information please contact:
Natal Argawan Pardede, Corporate SecretaryPhone (021) 8192808 or Facsimile (021) 8191235
Visit us: www.wika.co.id
DisclaimerThis material is for Information only, and we are not soliciting any action based upon it. This report is not to be construed as an offer to sell or the solicitation of an offer to buy any security in any jurisdiction where such an offer or solicitation would be illegal. The Information herein has been obtained from sources believed to be reliable, but we do not warrant that it is accurate or complete, and it should not be relied upon as such. Opinion expressed is our current opinion as of the date appearing on this material only, and subject to change without notice. It is intended for the use by recipient only and may not be reproduced or copied/photocopied or duplicated or made available in any form, by any means, or redistributed to others without written permission of PT Wijaya Karya (Persero) Tbk.
The End of Presentation