1. 2 main sources of official statistics surveys administrative records estimates survey collecting...
TRANSCRIPT

1

2
Main sources of official statistics
Surveys Administrative records Estimates
Survey Collecting information to meet a definite need
Sampling:-

3
Sampling:-Sampling is a procedure by which we draw a part of an aggregate in the
belief that the part will possess the same qualities which that aggregate possesses.
Statistical Population: The total group of people from whom information is needed
Sample: A subset of the population
Finite and Infinit Population:-

4
Target Population
is total population about which one requires information
Surveyed/Sampled Population
is more accessable population out of target population
which is available at the time of enquiry
Statistical survey: is the process of collecting data through the field work.
Types of surveys:– Census.– Sample surveys

5
Time Saving: To contact the whole population would be time consuming Reduced Cost: Data are secured from only a small fraction of the aggregate
and Expenditures are small Greater Speed: Data can be collected and summarized more quickly with a
sample than with a complete count Greater Scope: More scope and flexibility regarding the types of information
that can be obtained Greater Accuracy: Personnel of higher quality can be employed and given
intensive training & More careful supervision of the field work and processing of results becomes feasible
Destructive Nature of Some Tests: Sampling is essential to obtaining the data when the measurement process physically damages or destroys the sampling unit under investigation
Adaptability: Many topics could be covered in a single sample survey. This may not be possible in census due to wider coverage we can not go in detail
Advantages of Sampling

6
Statistic•Numerical quantity calculated from the sample
•It is used to give information about unknown values of the corresponding population parameter i,.e guess value about population parameter
•Statistics are usually denoted by Latin letters Sample mean (X), variance(S2), proportion (p^)
•Statistics are variables as it varies from sample to sampleX
Parameter• Numerical quantity describing a population
Population mean(μ), variance (σ2) proportion (P).
• Parameters are usually denoted by Greek letters
•Parameters are usually unknown
•Parameters are fixed (constant) values

7
Parameter Vs Statistic
Population X1, X2, …, XN
Population Mean
N
X
N
1=ii
Sample x1, x2, …, xn
Sample Meann
ii=1
x x
n
x
Parameter Statistic

8
Census
A census is a collection of data from all units in the statistical population for a certain characteristics.
Or is a complete enumeration of the statistical population.
Types of censuses1. Population census2. Agricultural census3. Economic census and other types of census.

9
Sampling Frame Complete list of all the sampling units in a population
Requirements of a reasonably good frame are that the frame should
Not contain inaccurate sampling units Be complete and exhaustive Be free from errors of omission and duplication of sampling
units Be as up-to-date as possible at the time of use
Sampling units:
The population is divided into parts before selecting a sample. These parts are known as sampling units or units
For example; in sampling the people in a city the unit may be an individual person, the family or a block of several households

10
Sampling With and Without Replacement
Sampling is said to be with replacement when we draw a sampling unit from a population and return it to the population before next unit is drawn. In this case sampling unit can be chosen more than once. On the other hand ,if we do not return the sampling unit to the population and drawn the next unit, the sampling is said to be without replacement. In this case the sampling unit can be chosen only once.

11
Total survey errors Sampling errors
Probability sampling Non probability sampling
Non sampling errors

12
Errors in Sampling (continue)Sampling ErrorDifference between sample estimate and its corresponding
parameter
For example,Sampling Error=Sample Mean - Population Mean
Sampling Error occurs because only a part of the population, i.e., sample is used to obtain estimate.
The sampling error can be minimized by: Increasing the size of the sample Improving the procedure of sample selection (sample
design) By using additional information about population

13
TotalError
Sampling Error
Non-SamplingError
RespondentError
Non-response
Response Bias
Admin.Error
Data ProcessingError
Coverage Error
Measurement Error
Interviewer
SocialDesirability
Guessing
Respondent Misunder-standing
Attention Loss
Fatigue
Survey Errors

14
SAMPLING METHODSSAMPLING METHODS
Simple random
sampling
Simple random
sampling
Systematic sampling
Systematic sampling
Stratified sampling
Stratified sampling
Cluster sampling
Cluster sampling
Judgment sampling
Judgment sampling
Convenience sampling
Convenience sampling Quota
sampling
Quota sampling
Snowball sampling
Snowball sampling
Probability SamplingProbability Sampling Nonprobability SamplingNonprobability Sampling

15
Probability Sampling
In probability sampling, every element in the population has a known non-zero probability of being selected.
Provides a measure of precision of the estimates Personal factor is eliminated No factor other than chance affects the likelihood of an
item being included in or excluded from the sample The probability samples are usually designed to be
measurable.
Probability of Selection = Sample Size
Population Size

16
In a general probability sampling scheme: First specify the size ‘n’ of sample to be drawn Consider (atleast conceptually) all possible samples of size
‘n’ that could be drawn from the population i.e. S1, S2, …, where each Si is a distinct sample of size ‘n’
Assign a known probability of selection to each Si Select one of the Si by a random process in which each Si
receives its appropriate probability of being selected Take into account these probabilities of selection in making
estimates from sample
Procedure for Probability Sampling

17
Probability (Random) Sampling
The major types of random sampling:• Simple Random Sampling• Stratified Random Sampling• Systematic Random Sampling• Cluster Random Sampling

18
SIMPLE RANDOM SAMPLE (SRS)
Suitable whenSuitable when Population is small and consists of homogenous units
in terms of some characteristics relevant to the enquiry Sampling frame is available and units of populations are
easily accessible
Simple random sampleSimple random sampleA sample of size n is called a simple random sample if
each unit in the sample has an equal chance of being selected in the sample

19
Procedure for Selecting SRS
Lottery Method Allocate a serial number to each unit in the population (1,
2, 3, …, N) Write serial numbers on paper slips and put them in bowl Pick the desired number of slips (n = sample size) without
personal choice
Random Number Table Allocate a serial number to each unit in the population (1,
2, 3, …, N) Select the desired number of random numbers (n =
sample size) from random number table
Computer Software Computer will automatically select the desired number of
units from the given population

20
Example for Selecting SRSSelect a SRS of size 10 (n) from a population of size
100 (N)• Allocate a serial number from 00 to 99 to each unit in
the population
• Select ten 2-digit numbers from random number table
09
15
36
39
31
89
74
25
3636
65
98

21
The Population Mean isX
$7 $7 $8 $8 $7 $8 $9μ $7.71
7
Sample EmployeesHourly Earnings Mean Sample Employees
Hourly Earnings Mean
1 A, B 7, 7 7.0 11 B, G 7, 9 8.02 A, C 7, 8 7.5 12 C, D 8, 8 8.03 A, D 7, 8 7.5 13 C, E 8, 7 7.54 A, E 7, 7 7.0 14 C, F 8, 8 8.05 A, F 7, 8 7.5 15 C, G 8, 9 8.56 A, G 7, 9 8.0 16 D, E 8, 7 7.57 B, C 7, 8 7.5 17 D, F 8, 8 8.08 B, D 7, 8 7.5 18 D, G 8, 9 8.59 B, E 7, 7 7.0 19 E, F 7, 8 7.5
10 B, F 7, 8 7.5 20 E, G 7, 9 8.0
21 F, G 8, 9 8.5
Sample Means for All Possible Samples of 2 Employees
Continued
Sampling Distribution of the Sample Mean (W.O.R)

22
The Mean of the sampling distribution of the sample mean is
Sample Mean
Number of Mean Probability
$7.0 3 0.14$7.5 9 0.43$8.0 6 0.29$8.5 3 0.14Total 21 1.00
Sampling Distribution of the Sample Mean for n=2
X
Sum of all sample means 7.0 7.0 7.0 7.5 8.5μ $7.71
Total number of samples 21
Sampling Distribution of the Sample Mean Continued

23
SYSTEMATIC RANDOM SAMPLE
Suitable whenSuitable when In case of large population, sometimes it is very tedious, time
consuming and highly expensive to draw a simple random sample
Provides better coverage than simple random sample
Systematic random sampleSystematic random sample
A sample of size n is called a systematic random sample if first unit is selected at random from first k (sampling interval) units and thereafter selecting every kth unit

24
Procedure for selecting Systematic Random Sampling
Allocate a serial number to each unit in the population 1,2,3 ,. . ., N
Determine the sampling interval which is an integer close to k=N/n
Select one unit at random from the first k units Select every k-th unit until the required sample size
Example Select a systematic sample of size 5 if N=100 k=100/5=20 Suppose the first selected unit is 12. Then the remaining units would be 32, 52, 72, and
92.

25
Systematic Random Sampling
UsesThe samples taken for statistical quality control, by taking item from the current
production stream at regular intervals
Advantages• Easy to carry out and not much costly• Sample spread over entire population as compare to SRS
Disadvantages Difficult for arranging the items in the large population if the population
covers an entire country or a large area Response bias occur if there exists some hidden periodicity to the
elements of the population, a cyclical or periodic movement of the data with length of the cycle tending to be close to the sampling interval (ratio)

26
Systematic Random Sampling
Disadvantages To estimate the average daily ticket sales of PIA, a
sample consisting of sales of every Saturday will not be representative
In a market survey, to estimate the average daily sales, a sample consisting of every 10th shop will not be representative if every 10th shop in that market is the corner shop
In a production stream every 20th item is produced by same machine and if the sampling interval is also 20 then every 20th item as a sample will not be true representative of the production of different machines
Under above conditions a systematic sample may result in a non-representative sample

27
Stratified Random Sample
Population consists of heterogeneous units If we want to study per capita income, it is sensible to
divide the population into subpopulations of different income groups
Precision and comparisonData of known precision/comparison were required for
certain subpopulations e.g different precision may be required for the male and female students in the department
Administrative convenienceIf a large population is divided into subpopulations then it
becomes convenient to survey the subpopulationsFor example, the organization conducting the survey may
have field officers each of which can supervise the survey for a subpopulation

28
Stratified Random Sampling
Elements in the population aren’t homogenous with respect to characteristic of interest
Divide the population into non-overlapping homogeneous subpopulations called strata on the basis of some variable called stratification variable
Sample of predetermined size is drawn separately from each stratum by simple random sampling

29
Stratified Random SamplingTotal Population Size = N=N1+N2+ …+ Nk
n1n2 nk
Total Sample Size = n = n1+ n2 +. . .+ nk
Stratum 1
N1
Stratum 2
N2
Stratum k
Nk
…

30
Allocation of Sample Size in Stratified Random Sampling
Decision for selecting a separate simple random sample from each stratum is called allocation of sample size in stratified random sampling.
MethodsMethods1. Equal Allocation
2. Proportional Allocation
3. Neyman Allocation
4. Optimum Allocation

31
Equal Allocation
Stratum 1
N1=30
Stratum 2
N2=20
Stratum 3
N3=50 Select a stratified random sample of size 10 from
1,2,3i
nn i
k
n1=10/3=3.33=3
n2=10/3=3.33=3
n3=10/3=3.33=4
Select equal number of units from each stratum regardless of the stratum size

32
Proportional Allocation
Stratum 1
N1=30
Stratum 2
N2=20
Stratum 3
N3=50 Select a stratified random sample of size 10 from
1,2,3ii
Nn n i
N
n1=10(30/100)=3
n2=10(20/100)=2
n3=10(50/100)=5
Select number of units from each stratum according to the size of the stratum i.e select large units from large stratum
Select large sample from stratum which has
•Large size i.e Ni is large
33
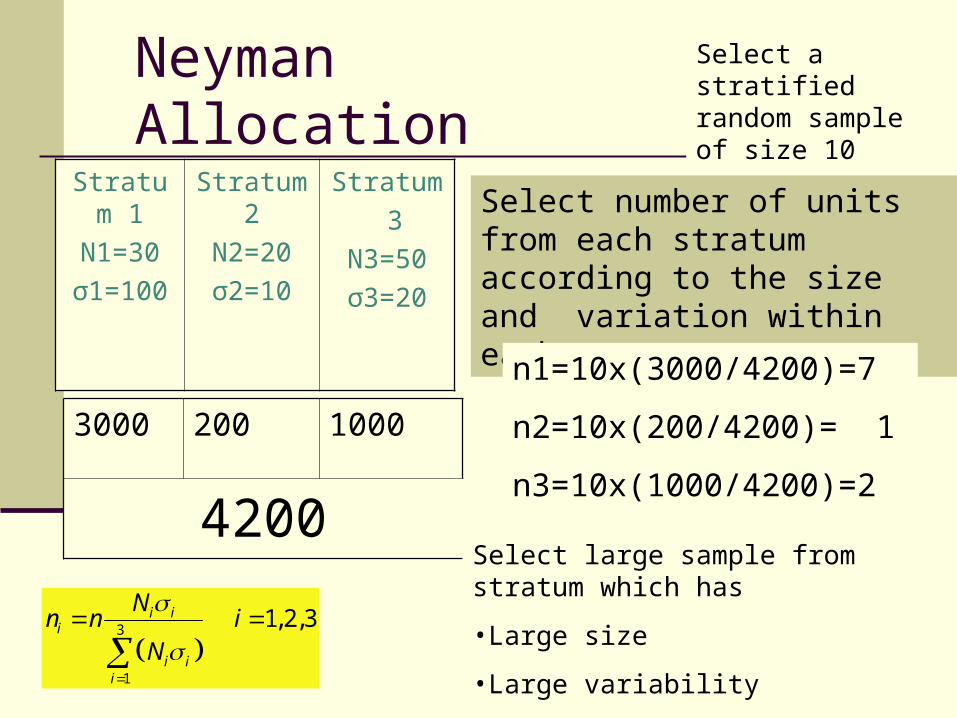
Neyman Allocation
Stratum 1
N1=30
σ1=100
Stratum 2
N2=20
σ2=10
Stratum
3
N3=50
σ3=20
3
1
1,2,3i ii
i ii
Nn n i
N
Select a stratified random sample of size 10
Select number of units from each stratum according to the size and variation within each stratum
n1=10x(3000/4200)=7
n2=10x(200/4200)= 1
n3=10x(1000/4200)=2
3000 200 1000
4200Select large sample from stratum which has
•Large size
•Large variability

34
Optimum Allocation
Stratum 1
N1=30
σ1=100
C1=100
Stratum 2
N2=20
σ2=10
C2=9
Stratum
3
N3=50
σ3=20
C3=25
3
1
1,2,3
i i
ii
i i
i i
NC
n n iN
C
Select a stratified random sample of size 10
Select number of units from each stratum according to the size, variation and cost of selecting a unit from each stratum
n1=10x(300/566.67)= 5
n2=10x(66.67/566.67)=1
n3=10x(200/566.67)= 4
300 66.67 200
566.67 Select large sample from stratum which has
•Large size
•Large variability
•Less unit cost

35
Cluster Sampling
Cluster sampling is a method of selecting a sample from a population which is divided into natural groups, such as households, agricultural farms, etc., which are called clusters, then taking these clusters as sampling units, a sample is drawn at random.
After clusters have been selected, all, or part of, the elements in each cluster are included in the sample. This sample is called cluster random sample.
The rule for choosing optimal clusters is the exact opposite of that for selecting strata in stratified sampling. Clusters should be selected such that there is little variability between, and high variability within, clusters.

36
Cluster Sampling
As an example, suppose information about attitudes on working conditions is desired for factory workers in Faisalabad. A list of the many thousands of workers isn’t available and would be costly to complete.
However, it is easy to complete the relatively small list of all factories. Each factory contains a cluster of workers. We may then select a simple random sample of factories (clusters) and interview a random sample of the workers in the selected factories.

37
Stages in Cluster Sampling
The first stage is selecting a sample of clusters. The second stage is selecting a sample of elements in each cluster. Alternately, of course, all the workers in the selected factories could be included in the sample. Then the procedure is called single-stage sampling.
Clusters are often referred to as the primary sampling units. If all the elementary units of selected clusters are included in the sample, the procedure is called single-stage sampling.
If a random sub-sample of elementary units is drawn from the selected clusters, the procedure is called two-stage sampling. If more than two stages arc involved in obtaining the overall sample, the procedure is called multi-stage sampling.

38
1st stage cluster sample
Primary unit
Secondary unit/sub unit
2nd

39
Use of Cluster Sampling
Cluster sampling is often used in statistical quality control. Firstly, ‘lots’ or ‘batches’ of output are selected at random as clusters. As a single-stage sampling, all units of the selected lots or batches may be tested.
Or, a sample may be taken from each lot for testing a two stage sampling.

40
Two Phase or Double SamplingA sample is said to be two phase sample when certain
items of information are collected from all the units in a sample (First Phase) and other items of usually more detailed information are collected from a sub sample of the units (Second Phase) composing the original sample When more phases are added, it becomes multi-
phase sampling In multi-phase, the same units are used at each phase In multi-stage, the units are different at different stages
of sampling
Sample at 1st Phase
Sample at 2nd PhasePopulation

41
Non-Probability Sampling
We can’t assign to an element of population the probability (chances) of its being included in the sample
Inferences are made about the population from arbitrary and informal samples
For example, a wheat dealer forms his opinion about a sack full of wheat by examining just a few grains

42
Non-probability Sampling Judgment sampling/ purposive : The interviewer decides who is
"typical" or "representative" using some type of stated criteria. Self-selected: Respondents decide for themselves whether to
participate. Convenience sampling: is that in which the study units that happen
to be available at the time of data collection are selected for purposes of convenience. Convenience sample – elements are included because they are convenient or easy to select
Quota Sampling: Interviewers are instructed to select respondents with the "right" combination of characteristics. Only a few characteristics can be simultaneously considered
Snowball sampling: refers to a variety of procedures in which initial respondents are selected by probability methods, but additional respondents are then obtained from information provided by the initial respondents. This technique is used to locate members of rare populations by referrals.

43
Probability vs. Nonprobability Sample Surveys
Advantages Probability Samples.1. Sampling error can be computed 2. Information from a representative
cross-section.3. Results are projectable to the total
population.
Nonprobability Samples1.Cost less than probability.2.Can be conducted more quickly.3.Produces samples that are reasonably
representative.
Disadvantages
Probability Samples.1. More expensive than non-
probability samples.2. Takes more time to design
and execute.Nonprobability Samples1.Sampling error cannot be
computed.2.Representativeness of the
sample is not known.3.Results cannot be projected to
the population.

44
The selection will depend on:• The objectives of the study• The availability of financial & human resources • Time • The nature of the problem
Selection of Sampling Methods

45
The main steps in a sample survey are to:
Clearly state the objectives of the survey Define the population we wish to study as clearly as possible Construct the sampling frame by clearly defining the sampling
units Choose an appropriate sample design and proper sample size Organize a reliable field work to achieve the objective of the
survey Try out the questionnaire on a small scale which helps in
improvements in the questionnaire. (Pretest) Summarize and analyze the data Identified the mistakes in the present survey to avoid in future
Assignment: Do all these ingredients in detail

46
Sampling Distribution of the Sample Mean A probability distribution of all possible sample
means of a given sample size
Example: XYZ industries has seven
production employees (considered the population). The hourly earnings of each employee are given:
EmployeeHourly Earnings
A $7B $7C $8D $8E $7F $8G $9

47
What is the population mean? What is the sampling distribution of the sample
mean for samples of size 2? What is the mean of the sampling distribution? What observations can be made about the
population and the sampling distribution?
Sampling Distribution of the Sample Mean Continued

48
These observations can be made: The Mean of the distribution of the sample mean is equal to the mean
of the population.
The spread in the distribution of the sample mean is less than the spread in the population values. The sample mean ranges from $7.0 to $8.5, while the population values vary from $7.0 up to $9.0.
In fact, the SD of the distribution of the sample mean is equal to the population SD divided by the square root of the sample size. Thus, as the sample size increases, the spread of the distribution of the sample mean becomes smaller.
The shape of the sampling distribution of the sample mean and the shape of the frequency distribution of the population values are different. The distribution of the sample mean tends to be more bell-shaped and to approximate the normal probability distribution.
Sampling Distribution of the Sample Mean (continued)

49
Hourly Earnings Frequency Probability
$7 3 0.43$8 3 0.43$9 1 0.14
Total 7 1.00
Distribution of Hourly Earnings
0.00
0.05
0.10
0.15
0.20
0.25
0.30
0.35
0.40
0.45
$7 $8 $9
Hourly Earning
Pro
babi
lity
Sample Mean
Number of Mean Probability
$7.0 3 0.14$7.5 9 0.43$8.0 6 0.29$8.5 3 0.14Total 21 1.00
Sampling Distribution of the Sample Mean for n=2
0.00
0.05
0.10
0.15
0.20
0.25
0.30
0.35
0.40
0.45
3 9 6 3
Sample Mean of Hourly Earnings
Prob
abili
ty
Sampling Distribution of the Sample Mean (continued)

50
Effect of Sample Size on Sampling Distribution

51
If all samples of a particular size are selected from any population, the sampling distribution of the sample mean is approximately a normal distribution. This approximation improves with larger samples.
The Central Limit Theorem
Population Distribution
Random Sample(x1, x2, …, xn)
X
),(
as n largeSampling Distribution of Sample Mean
x
),( nxx