1 2 tubes on piping -24,2 · the decrease of the solar thermal market in the european union in 2017...
TRANSCRIPT

sola
r t
her
ma
l a
nd
co
nc
entr
ated
so
lar
po
wer
ba
ro
met
ers
sola
r t
her
ma
l a
nd
co
nc
entr
ated
so
lar
po
wer
ba
ro
met
ers
21
SOLAR THERMAL AND CONCENTRATED SOLAR POWER BAROMETERS – EUROBSERV’ER – JUNE 2018 SOLAR THERMAL AND CONCENTRATED SOLAR POWER BAROMETERS – EUROBSERV’ER – JUNE 2018
-24,2 %The decrease of the solar thermal market
in the European Union in 2017
SOLAR THERMAL ANDCONCENTRATED SOLAR POWER
BAROMETERS
Solar thermal energy is no doubt the ultimate physical form for transferring heat to water without emitting greenhouse gases or pollutants. Yet in
2017 the sector struggled to survive in the hot water production and heating market. According to EurObserv’ER, the annual solar thermal collector surface area in the European Union dropped below the 2 million m2 mark, i.e. by 24.2% compared to the previous year’s installed surface area. The individual national market figures vary widely, with several countries showing encouraging signs.
Concentrated solar power is another way of harnessing direct sunlight. The technology consists of concentrating the sun’s rays using mirrors to
heat a fluid to high temperature, produce steam and thus produce electricity. The European Union’s installed base has remained at almost the same level since 2014 and stood at 2 314 MW at the end of 2017. The global market whose growth has been sluggish over the past two years (110 MW in 2016 and 100 MW in 2017) should pick up speed from 2018 onwards.
2 314 MWe
Total CSP capacity in operation
in the European Union in 2017
51,4 millions m2
The cumulated surfaces of solar thermal
in operation in the European Union in 2017
A study carried out by EurObserv’ER.
Est
if
Imposing of vacuum tubes on piping

sola
r t
her
ma
l a
nd
co
nc
entr
ated
so
lar
po
wer
ba
ro
met
ers
sola
r t
her
ma
l a
nd
co
nc
entr
ated
so
lar
po
wer
ba
ro
met
ers
43
SOLAR THERMAL AND CONCENTRATED SOLAR POWER BAROMETERS – EUROBSERV’ER – JUNE 2018 SOLAR THERMAL AND CONCENTRATED SOLAR POWER BAROMETERS – EUROBSERV’ER – JUNE 2018
While the worst is over, the Euro-
pean solar thermal sector is
still in deep water. At European
Union level, the market experienced
another significant drop in the installed
area devoted to hot water production
and heating in 2017 (graph 1), the ninth
in succession since 2009. EurObserv’ER
considers the contraction to be partic-
ularly sharp – 24.2% between 2016 and
2017, equating to 1 960 666 m2 of installed
surface with 1 372 MWth of thermal capac-
ity (2 585 023 m2 in 2016) (tables 2 and 3).
The activity’s declining trend can be
observed beyond the European Union’s
borders. Table 1 lists the main country
markets outside the EU and in 2017 all of
them registered a decrease in installed
capacity. Incidentally, once again we
note China’s might. Its 2017 market in
excess of 26 GWth is more than 20 times
the size of the sum of all Europe’s country
totals put together!
Looking at the technologies used, flat
plate collectors still account for the bulk
of all collectors installed in the European
Union (91.9%), followed by vacuum tube
collectors (6.4%) and unglazed collec-
tors (1.7%). The latter are mainly used
for heating pools. We should point out
that hybrid PVT collectors (see note) are
not included in these indicators because
only a handful of European Union niche
markets use them.
The individual market situations vary
inside the European Union. The Aus-
trian, Greek and Cypriot sectors are very
mature with high ownership rates and
are strongly geared to replacement. Ger-
many also has a relatively high installa-
tion level with 2.3 million systems in ser-
vice. Solar heat in Denmark is very widely
used in district heating. Until the end of
2016, the Danish market was helped by
an incentive system and legal obligations
that prompted operators to flock to solar
thermal in their droves to comply with
the environmental performance levels
imposed on them. Danish network man-
agers concentrated their investments.
As a result, 260 161 m2 of collectors went
on stream in 2015 followed by 478 297 m2
in 2016. However, the 2017 Danish solar
thermal market was badly hit by changes
to the regulations, and plummeted to
only 31 500 m2, including 5 000 m2 for the
individual residential market. This sharp
drop in the Danish market alone (of
almost 450 000 m2) puts a slightly differ-
ent slant on the European Union sector’s
2017 overall decline.
The markets also differ in their use of
technology. Southern Europe makes very
widespread use of thermosyphon sys-
tems, where the hot-water tank is directly
connected to roof-mounted collectors.
They are less dependent on incentives or
public aid. In the North, systems are more
complex as a circulating pump has to be
coupled to a separate hot-water tank.
They cost more to purchase and install,
and thus sales rely more on public aid.
Hard to find a place in tHe sun
All in all, the European solar thermal mar-
kets are either finding it hard to stabilize
(Spain, Austria, Poland) or are trapped
in a downward spiral (Germany, France,
Italy and Belgium). Solar thermal heat
struggles to survive in the heating and
domestic hot water production markets
despite its irrefutable energy efficiency
and CO2 balance advantages. This compe-
tition is especially rife in the renovation
segment and also in new build where
regulations are stifling solar thermal’s
efforts to establish a foothold.
In new build, political choices on whether
or not to impose renewable heating in
thermal regulations are crucial for the
health of the solar thermal business. It is
notably the case for Spain and Germany.
Additionally, the thermal regulation
requirement level is critical for this mar-
ket’s momentum, because in the absence
of any renewable obligation, minimum
adherence to building standards can
be simply achieved by progress made in
insulation materials or by incorporating
“fossil” or “electric” technologies that
are also becoming more energy-efficient.
In contrast, thermal regulations for new
build that enforce the use of renewable
technologies, or a minimum share of
renewable energy in building energy
consumption, do not necessarily advance
the cause of solar thermal solutions (see
the paragraphs on France and Italy). In
practice, each new build regulation subli-
minally has one or another heating or
domestic hot water production solution
in mind.
Furthermore, solar thermal has to fend off
stiff competition from other renewable
heating production technologies such
as air-source heat pumps and thermo-
dynamic water heaters. These sectors
enjoy strong growth momentum and also
benefit from the trend to electrify heat
and cooling production systems. Solar
thermal also has to contend with fratri-
cidal competition from solar photovol-
taic played off on the basis of available
roof space and also, more recently, on
the basis of usages. In many countries
and regions, achieving network parity
promotes self-consumption to meet elec-
tricity needs. So, increasingly, system
design is extended to cover domestic hot
Tabl. n° 1Main solar thermal markets outside European Union
Annual Installed capacity (in MWth)Total cumulative capacity
in operation (in MWth)
2016 2017 2016 2017
Turkey 1 467 1 348 14 900 16 248
Japan 50 43 2 500 2 543
USA 682 658 17 600 18 258
China 27 664 26 082 324 500 350 582
India 894 1 063 6 700 7 763
Rest of the world 5 903 5 806 105 160 110 966
Total of the world 36 660 35 000 471 360 506 360
Source: REN21, EurObserv’ER
water needs, directly linked to an immer-
sion tank or thermosyphon water heater.
Installers in the individual home renova-
tion sector compound this situation by
spurning solar thermal as they tend to
steer their customers towards less expen-
sive, easier to install systems (to avoid
working on the roof). The energy labelling
argument, which could have provided
the solar thermal sector with an advan-
tage (as solar thermal systems offer the
best scores) tends to be understated.
Nonetheless, efforts have been made to
encourage installers to consider energy
labelling through the LabelPack A+ pro-
ject coordinated by Solar Heat Europe
and financed by the European Union’s
Horizon 2020 Research and Innovation
Programme. The solar thermal sector has
also observed that consumers know little
or are unaware of energy labelling. They
more often than not replace their heating
system as a matter of urgency when their
old system breaks down in the winter. A
new EU-wide promotion campaign (called
“#CheckYourHeating”) was launched in
May 2018 as part of the LabelPackA+ pro-
ject, targeting owners directly to make
them more proactive prescribers when
they envisage replacing their heating or
hot water production systems.
The solar thermal market has also suffe-
red from public aid cuts in some countries
through budget restrictions, or from sup-
port systems that are geared to compe-
ting technologies. In Germany, the upgra-
ding of aid allocated to solar systems for
increased energy efficiency did not have
the expected effect on the market. The
sector blames the lack of information
given to the general public.
The expected growth drivers in the col-
lective sector, solar district heating and
industrial heat, are gradually emerging,
but they have been too weak to counter
the installation volume drop in the indi-
vidual home sector. Domestic hot water
production in the collective sector has
the most growth potential because it is
based on a huge pool of buildings ripe for
redevelopment in Europe and the needs
are enormous.
an installed base of 51.4 million m2 at tHe end of 2017
The European Union had a total collector
area of 51.4 million m2 (35 985 MWth)…
a year-on-year rise of 2.1% (table 4).
This estimate includes the three main
solar thermal technologies (flat glazed
collectors, vacuum tube collectors and
unglazed collectors) and factors in the
decommissioning assumptions provided
by the experts contacted during the
study and the previous year’s Eurostat
data. Whenever official data could not
be provided, EurObserv’ER based its esti-
mate on the market data collected and
applied a decommissioning assumption
of 20 years for glazed collectors and of
12 years for unglazed collectors. In 2017,
the combined area to date only increased
Solar thermal panels installed in Amsterdam
sola
r t
her
ma
l a
nd
co
nc
entr
ated
so
lar
po
wer
ba
ro
met
ers
sola
r t
her
ma
l a
nd
co
nc
entr
ated
so
lar
po
wer
ba
ro
met
ers
65
SOLAR THERMAL AND CONCENTRATED SOLAR POWER BAROMETERS – EUROBSERV’ER – JUNE 2018 SOLAR THERMAL AND CONCENTRATED SOLAR POWER BAROMETERS – EUROBSERV’ER – JUNE 2018
by 1.1 million m2, which equates to a
decommissioning figure of 0.9 million m2.
This trend will be heightened in the next
few years because of the market capac-
ity build-up in the 2000s which peaked
at almost 5 million m2 in 2008. Unless the
market rebounds significantly, this trend
will lead to difficulty maintaining the solar
heat input for the European Union’s tar-
gets in a few years’ time (see conclusion).
news from around tHe main european markets
The German market contracts sharplyThe German market held onto its Euro-
pean Union market leadership in 2017.
AGEE-Stat, the Working Group on Renew-
able Energy-Statistics for the German
Economics and Energy Ministry (BMWi),
claims that the country installed about
650 000 m2 of collectors in 2017 (equiv-
alent to 455 MWth of thermal capac-
ity), 573 000 m2 of flat glazed collectors,
57 000 m2 of vacuum tube collectors and
20 000 m2 of unglazed collectors. These
figures show that the installed area
contracted by 15.1% in the course of 12
months (766 000 m2). The drop also cor-
roborates the remarks made last year by
the sector’s players. The MAP incentive
programme which was upgraded in 2015,
and the new energy efficiency stimulation
programme “Anreizprogramm Energieef-
fizienz (APEE)” implemented on 1 January
2016, that aimed to help fund heating sys-
tem replacement or modernisation in the
interests of efficiency, were too weak to
reverse the solar thermal market’s down-
ward trend. They ascribe it to the cost of
gas-fired heating which is still very com-
petitive and also to increasing competi-
tion from other renewable energy heating
systems. Another grievance, observed in
other countries, is the installers’ grow-
ing disdain for solar thermal solutions, as
they prefer solutions that are faster and
therefore more profitable to install.
The market decline resulted in limiting
the contribution of solar inputs. Pri-
mary energy output increased by 2.2%
between 2016 and 2017 (from 670.7 to
685.5 ktoe). AGEE-Stat now puts the sur-
face area of decommissioned collectors
at more than half the newly-installed
area, i.e. 330 000 m2. Germany’s solar
thermal collector area to date is put at
19.4 million m2. The German solar energy
association’s breakdown is a little higher
with an estimated installed base of 20.6
million m2, comprising 2.3 million instal-
lations and annual CO2 savings of about 2
million tonnes.
The Greek market improvesThe Greek market’s sharp upturn con-
trasts with the difficulties of the other
main European markets. According to
Costas Travasores, the Executive Sec-
retary of EBHE (Greek Solar Industry
Association), the Greek market grew to
316 000 m2 in 2017 compared to 272 000 m2
in 2016 (16.2% growth). EBHE ascribes
this growth to a series of favourable ele-
ments, starting with the fall in system
prices due to keen competition between
the players. Other factors are the pro-
liferation of distribution grids as cyber-
commerce grew, the arrival of major DIY
chains onto the market such as Leroy Mer-
lin, the appearance of new private labels
working with OEM partners and slight
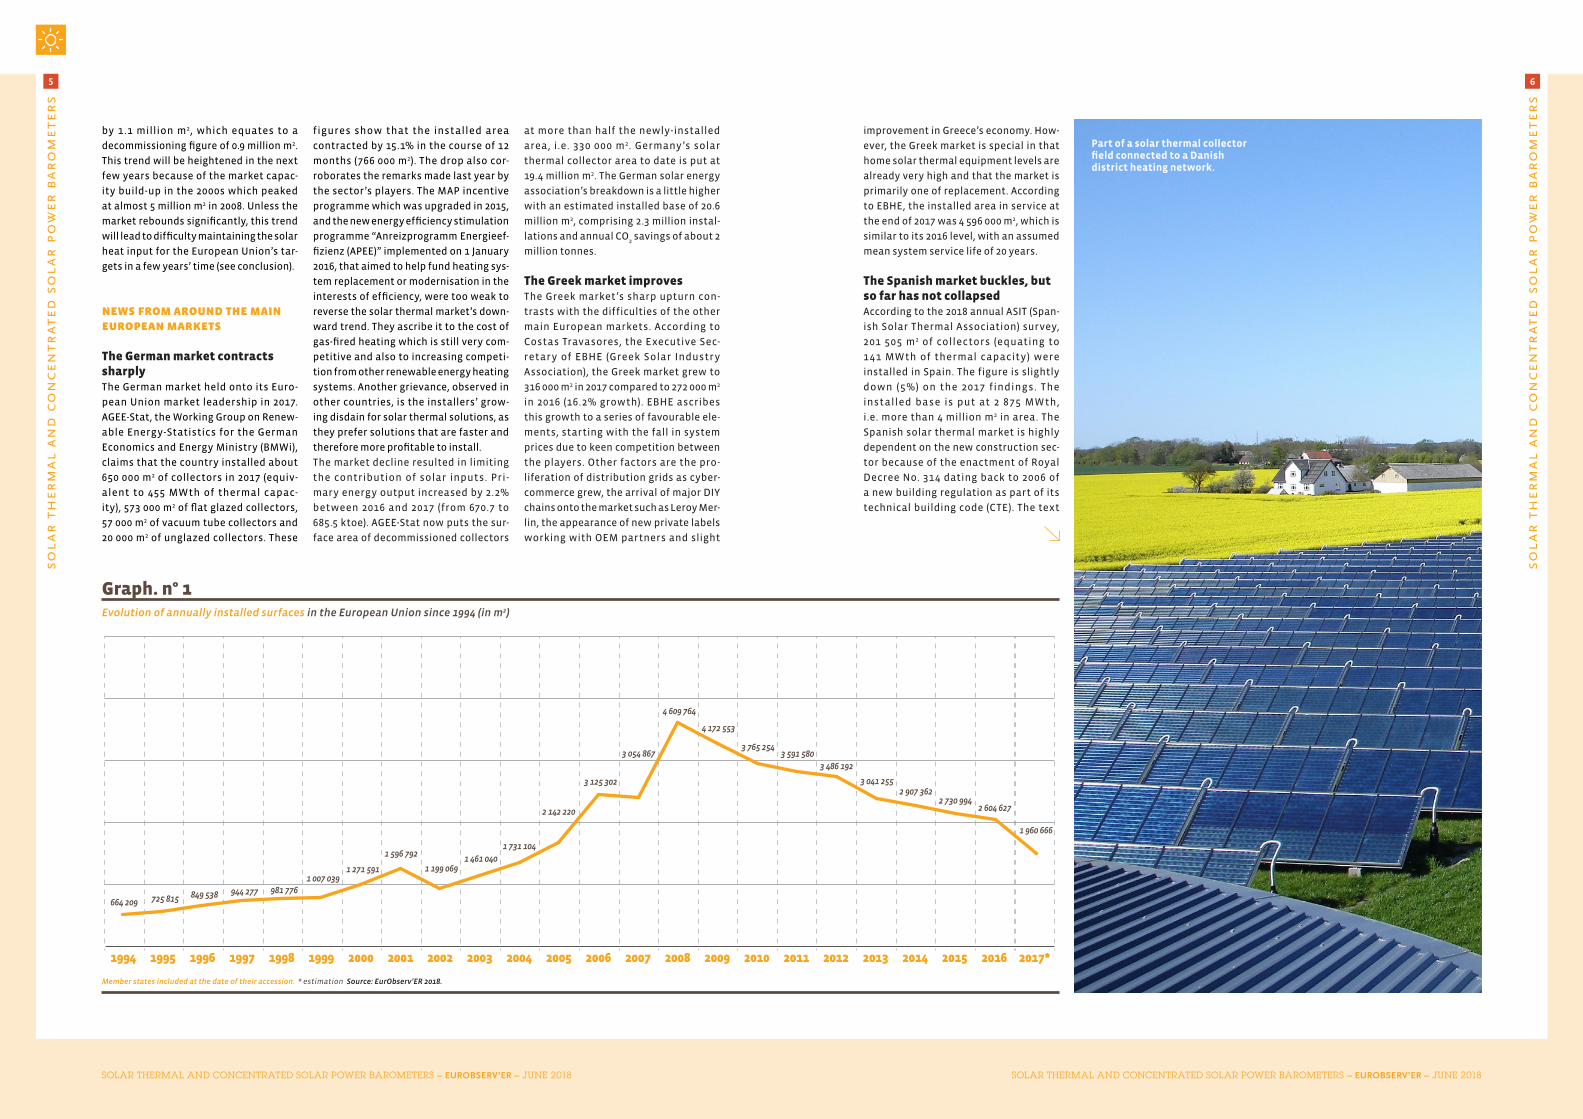
Graph. n° 1Evolution of annually installed surfaces in the European Union since 1994 (in m2)
1994 1995 1996 1997 1998 1999 2000 2001 2002 2003 2004 2005 2006 2007 2008 2009 2010 2011 2012 2013 2014 2015 2016 2017*
664 209 725 815 849 538 944 277 981 7761 007 039
1 271 591
1 596 792
1 199 0691 461 040
1 731 104
2 142 220
3 125 302
3 054 867
4 609 764
4 172 553
3 765 2543 591 580
3 486 192
3 041 2552 907 362
2 730 9942 604 627
1 960 666
Member states included at the date of their accession. * estimation Source: EurObserv’ER 2018.
improvement in Greece’s economy. How-
ever, the Greek market is special in that
home solar thermal equipment levels are
already very high and that the market is
primarily one of replacement. According
to EBHE, the installed area in service at
the end of 2017 was 4 596 000 m2, which is
similar to its 2016 level, with an assumed
mean system service life of 20 years.
The Spanish market buckles, but so far has not collapsedAccording to the 2018 annual ASIT (Span-
ish Solar Thermal Association) survey,
201 505 m2 of collectors (equating to
141 MWth of thermal capacity) were
installed in Spain. The figure is slightly
down (5%) on the 2017 findings. The
installed base is put at 2 875 MWth,
i.e. more than 4 million m2 in area. The
Spanish solar thermal market is highly
dependent on the new construction sec-
tor because of the enactment of Royal
Decree No. 314 dating back to 2006 of
a new building regulation as part of its
technical building code (CTE). The text
Part of a solar thermal collectorfield connected to a Danish district heating network.

sola
r t
her
ma
l a
nd
co
nc
entr
ated
so
lar
po
wer
ba
ro
met
ers
sola
r t
her
ma
l a
nd
co
nc
entr
ated
so
lar
po
wer
ba
ro
met
ers
87
SOLAR THERMAL AND CONCENTRATED SOLAR POWER BAROMETERS – EUROBSERV’ER – JUNE 2018 SOLAR THERMAL AND CONCENTRATED SOLAR POWER BAROMETERS – EUROBSERV’ER – JUNE 2018
introduced the obligation to install
renewable hot water production systems
in new buildings and for solar thermal, an
obligation to cover 30–70% of the build-
ing’s domestic hot water needs. This
framework rapidly led the sector to peak
in 2007 (when 641 419 dwellings were
built) and 2008 (615 072 dwellings) only
to plummet when the Spanish property
bubble burst, exacerbated by the global
financial crisis. However, the construc-
tion market made a turnaround in 2017
after slipping for 9 years in a row (45 289
dwellings were built in the first 10 months
of 2017), which mechanically triggered a
solar thermal market upturn in new build.
ASIT claims that the CTE-related market
segment grew by 15% between 2016 and
2017, rising from 150 665 to 173 294 m2. Yet
the pick-up in new-build activity could
not match the drop in unsubsidised sys-
tem sales (14 136 m2 in 2017 down from
44 680 m2 in 2016), or those subsidised
under regional programmes…10 075 m2
in 2017 (14 855 m2) in 2016. Industrial and
service sector systems accounted for a
total collector area of 4 000 m2 – twice
the 2016 figure. Hence the market decline
can only be attributed to the renovation
market, for the public aid reductions are
proving too much to withstand.
The ASIT survey has very precise details
on the types of collectors sold on the
Spanish market. Flat glazed collectors
accounted for 51% of the installed sur-
face (103 486 m2), prefabricated ther-
mosyphon systems accounted for 43%
(87 180 m2), vacuum tube collectors for 4%
(7 187 m2) and unglazed flexible collectors
for 2% (3 652 m2).
The Spanish industry believes it is resil-
ient enough to rebound but asks the
authorities to face up to their responsibil-
ities and introduce measures to meet its
2011–2010 Renewable Energies Plan (PER)
targets of a total of 10 million m2 installed
by the end of 2020. ASIT thinks that only
half of this target will be installed by then.
Tabl. n° 2Annual installed surfaces in 2016 per type of collectors (in m2) and power equivalent (in MWth)
Glazed collectors Equivalent power
(MWth)CountryFlat plate collectors
Vacuum collectors
Unglazed collectors
Total (m2)
Germany 677 000 67 000 22 000 766 000 536,2
Denmark 478 297 478 297 334,8
Greece 271 400 600 272 000 190,4
Spain 201 793 7 076 3 321 212 190 148,5
Italy 186 647 25 043 211 690 148,2
France** 114 894 5 500 120 100 84,1
Poland 111 700 3 700 115 400 80,8
Austria 109 600 1 440 760 111 800 78,3
Belgium 39 000 7 500 46 500 32,6
Portugal* 45 300 800 46 100 32,3
Czech Republic 22 000 9 000 31 000 21,7
Netherlands 20 137 5 179 2 621 27 937 19,6
Croatia* 19 000 2 500 21 500 15,1
Ireland 11 204 8 564 19 768 13,8
Hungary* 13 050 5 592 188 18 830 13,2
Cyprus* 18 000 600 18 600 13,0
Romania* 6 800 11 000 17 800 12,5
United Kingdom 10 900 3 010 13 910 9,7
Slovakia 8 000 1 600 9 600 6,7
Bulgaria* 5 100 500 5 600 3,9
Finland* 3 000 1 000 4 000 2,8
Luxembourg 3 759 3 759 2,6
Sweden 2 763 336 75 3 174 2,2
Slovenia 2 300 400 2 700 1,9
Lithuania* 800 1 400 2 200 1,5
Estonia* 1 000 1 000 2 000 1,4
Latvia* 1 500 300 1 800 1,3
Malta 614 154 768 0,5
Total EU 28 2 385 558 165 294 34 465 2 585 023 1 810
* no data available, Observ’ER estimation based on the 2015 Estif market figure. **included 48 994 m2 in overseas departments
Source: EurObserv’ER 2018.
Glazed collectors Equivalent power
(MWth) CountryFlat plate collectors
Vacuum collectors
Unglazed collectors
Total (m2)
Germany 573 000 57 000 20 000 650 000 455,0
Greece 312 840 3 160 316 000 221,2
Spain 190 666 7 187 3 652 201 505 141,1
Italy 151 000 151 000 105,7
France** 114 591 5 500 120 091 84,1
Poland 110 000 3 000 113 000 79,1
Austria 99 770 1 060 630 101 460 71,0
Portugal* 45 300 800 46 100 32,3
Belgium 30 200 5 200 0 35 400 24,8
Denmark 31 500 0 0 31 500 22,1
Netherlands 21 150 6 162 2 621 29 933 21,0
Czech Republic 16 500 7 500 24 000 16,8
Croatia* 19 000 2 500 21 500 15,1
Ireland 11 254 9 049 0 20 303 14,2
Cyprus* 18 000 600 18 600 13,0
Romania* 6 800 11 000 17 800 12,5
Hungary 12 000 5 000 180 17 180 12,0
United Kingdom 9 938 9 938 7,0
Slovakia 8 000 1 600 9 600 6,7
Bulgaria* 5 100 500 5 600 3,9
Finland* 3 000 1 000 4 000 2,8
Luxembourg 3 600 3 600 2,5
Sweden 2 867 341 3 208 2,2
Slovenia* 2 300 400 2 700 1,9
Lithuania* 800 1 400 2 200 1,5
Estonia* 1 000 1 000 2 000 1,4
Latvia* 1 500 300 1 800 1,3
Malta 518 130 648 0,5
Total EU 28 1 802 194 125 889 32 583 1 960 666 1 372
* * no data available, Observ’ER estimation based on the 2016 Estif market figure ** included 63 526 m2 in overseas departments.
Source: EurObserv’ER 2018 .
Tabl. n° 3Annual installed surfaces in 2017 per type of collectors (in m2) and power equivalent (in MWth)
The Italian market keeps slidingThe Italian market’s downward trend
was confirmed in 2017. Data released
by Assotermica (Association of manu-
facturers of equipment and compo -
nents for heating systems), the market
dropped to 151 000 m2 (167 000 m2 in 2016
and 186 000 m2 in 2015). The association
ascribes this drop to reasons that are
shared by many other European markets,
namely fierce competition from other
renewable technologies – primarily heat
pump and photovoltaic – and the lack
of visibility of energy labelling that is
unfair to solar thermal solutions. Another
reason, which comes as a paradox, is a
thermal regulation that is too stringent.
It claims that the requirement to cover
at least 50% of energy needs by using
renewable energies has led property
developers to favour heating solutions
such as heat pumps, biomass heating
appliances or connection to a heating
network, rather than installing an indi-
vidual solar water heater coupled to a
gas-fired boiler. Although this configu-
ration is relevant for producing domes-
tic hot water, it cannot single-handedly
meet the regulation’s demands to cover
all the building’s energy needs, including
its cooling needs.
Solar thermal burns off the Polish fogThe market analyses made by SPIUG (Asso-
ciation of Manufacturers and Importers
of Heating Appliances), show that Polish
municipal information campaigns and
incentive programmes to improve the
air quality and promote low-emission
heating appliances such as HPs and solar
thermal collectors are starting to pro-
duce results. These local programmes
are mainly financed by European funds
and were introduced to combat the “fog”
generated by coal-fired heating systems
that are still very prevalent in the coun-
try. According to information available

sola
r t
her
ma
l a
nd
co
nc
entr
ated
so
lar
po
wer
ba
ro
met
ers
sola
r t
her
ma
l a
nd
co
nc
entr
ated
so
lar
po
wer
ba
ro
met
ers
109
SOLAR THERMAL AND CONCENTRATED SOLAR POWER BAROMETERS – EUROBSERV’ER – JUNE 2018 SOLAR THERMAL AND CONCENTRATED SOLAR POWER BAROMETERS – EUROBSERV’ER – JUNE 2018
in April 2018, the market slipped very
slightly to about 113 000 m2 (115 400 m2
in 2016) after dropping sharply once the
NFOSiGW (National Fund for Environmen-
tal Protection and Water management)
funding for solar thermal dried up.
However, SPIUG notes that the available
statistics are not entirely in phase with
the more positive information provided
by the market players, which points to
improved sales in 2018. SPIUG feels that
there no broader incentive programme
that would kick-start solar thermal more
squarely. In 2017, the Polish heating mar-
ket was very buoyant as a whole, pri-
marily because of the increase in home
construction.
The Austrian market on the replacement thresholdAustria is like Greece in that its solar
thermal system equipment level is par-
ticularly high, so the Austrian market
is largely geared to old system replace-
ment. Data released by AEE Intec shows
that the Austrian market contracted
by 9.2% on its 2016 level, to 101 460 m2
(99 770 of flat glazed collectors, 1 060 m2
of vacuum tube collectors and 630 m2 of
unglazed collectors). Another 320 m2 of
solar thermal air collectors and 732 m2
hybrid PVT collectors should be added to
these figures. If we factor in the decom-
missioning assumptions, the in-service
surface of glazed collectors remained
generally stable at 4.8 million m2, in con-
trast to that of unglazed collectors which
fell by almost 40 000 m2 to 378 291 m2. The
decommissioning of unglazed collectors
reduced the total solar thermal surface
in service to below the 5.2 million m2
threshold, with the concomitant slip in
solar thermal heat’s contribution from
50 874 toe in 2016 to 50 659 toe in 2017.
In France, the overseas territories market outperformed the mainland market The solar thermal market on the French
mainland has contracted further. Accord-
ing to Observ’ER, the sector a shrank by
21% on its 2016 performance in mainland
France and struggled to make 51 065 m2 of
solar thermal collectors (25 900 m2 for the
collective sector, 21 450 m2 for individual
solar water heaters, 3 715 m2 combined
systems and 5 500 m2 for unglazed collec-
tors). The mainland market is now smaller
than the overseas territories market,
which in 2017, according to Observ’ER,
rose to 63 526 m2 (a 29.7% improvement
on 2016). According to the General Com-
mission on Sustainable Development,
solar thermal accounted for two-thirds of
the renewable energy used there to pro-
duce heat, compared to less than 1% on
the mainland. As a result of the Overseas
Territories market buoyancy, the French
market stabilized at 120 000 m2.
Panel manufacturers consider that
installers’ failure to recommend solar
systems in the renovation sector is curb-
ing market expansion. The tax credit
system (30% in 2018), introduced to
encourage home energy performance
improvements plays into the hands of
other electric and renewable technolo-
gies. Individual solar water heaters face
stiff competition from thermodynamic
water heaters as they do in many other
countries. Although photovoltaic power
is ineligible for tax credit, its installation
through self-consumption systems in
the South of France is gaining popularity
as a solution to meet the demand for hot
water.
Furthermore, individual solar water
heaters will not break into the new build
scenario despite the 2012 thermal regu-
lation obligation to incorporate a renew-
able energy, as the constructors tend to
turn to cheaper-to-install technologies
such as thermodynamic water heaters
(88 891 units sold in 2017, whose market
has grown by 10%) or the roof-mounted
installation of two solar photovoltaic
collectors working for self-consumption,
to comply with the minimum regulatory
obligation level.
Rollover of the RT 2012 waiver in the col-
lective sector, authorizing more energy
to be used for multi-occupancy dwell-
ings (57.5 kWh/m2 p.a. instead of 50 kWh/
m2 p.a.) and the lack of any obligation to
incorporate renewable technologies in
new build, have practically ousted renew-
able heat from this segment. The industry
players do not expect to rebound with the
introduction of the E+C- label, in prepa-
ration for the new thermal regulation.
They believe that as it stands, the label
promotes photovoltaic technology, be it
PVT takes hold in France
Another technology, using hybrid water or air collectors is gradually establishing a foothold in a few European markets,
primarily France and Switzerland. In France, PVT air and water technologies have taken a significant share of the market,
encouraged in renovation by their eligibility for a 30% tax credit (up to 400 euros per m2 for hybrid water collectors for
up to 10 m2, and up to 200 euros per m2 for hybrid air collectors for up to 20 m2). This solution should also make its way
into new build because it fully meets the requirements of the new E+C- label which is the precursor to the forthcoming
thermal regulation due to replace the current RT 2012. EurObserv’ER puts the PVT collector market for 2017 at 3 500 m2
(75% for PVT water installations and 25% for PVT air installations). In Austria, according to AEE Intec data, PVT collectors
have made their debut with 732 m2 installed in 2017 giving a 2 059 m2 area installed to date.
Hybrid PVT water collectors are photovoltaic panels equipped with a water heat exchanger that cools down the photo-
voltaic part while producing hot water. Hybrid collectors have the advantage over equivalent photovoltaic capacity and
individual solar water heater for the same 4-m2 shell of optimizing solar electricity production because they cool the
panels (by 5–10% more) but do not offer the same hot water savings (about 20% less) according to the www.photovol-
taique.info website.
N400 km
N 400 km
Estonia* n° 28111.4
Slovakia n° 211316.7
Romania* n° 1913412.5
Hungary n° 1721312.0
Croatia* n° 2015815.1
Finland* n° 2441
2.8
Sweden n° 153372.2
Bulgaria n° 221003.9
Greece n° 33 217221.2
Italy n° 52 829105.7
France*** n° 62 17484.1
United-Kingdom n° 115087.0
Spain n° 42 875141.1
Austria n° 23 621
71.0
Luxembourg n° 2344
2.5
51224.8
Belgium n° 12 TOTAL EU35 985
1372.0
Latvia* n° 26171.3
Germany n° 113 609
455
44513
Cyprus n° 14
1731.9
Slovenia* n° 18
Portugal n° 985532.3
Netherland n° 1345321.0
Denmark n° 8964
22.1
Malta n° 25490.5
Lithuania* n° 2714
1.5Poland n° 71 49079.1
Czech Rep. n° 1076516.8
Ireland n° 16244
14.2
Key
35 985 Total solar thermal capacity installed at
the end of 2017* (MWth)1 372.0 Solar thermal capacity installed during
the year 2017** (in MWth)
* No data available, estimation based on the 2015
ESTIF market figure. ** Estimate (latest available
information at the end of May 2018).
*** included 63 526m2 in overseas departments.
Source: EurObserv’ER 2018.
Solar thermal power capacity installed in the European Union at the end of 2017** (MWth)

sola
r t
her
ma
l a
nd
co
nc
entr
ated
so
lar
po
wer
ba
ro
met
ers
sola
r t
her
ma
l a
nd
co
nc
entr
ated
so
lar
po
wer
ba
ro
met
ers
1211
SOLAR THERMAL AND CONCENTRATED SOLAR POWER BAROMETERS – EUROBSERV’ER – JUNE 2018 SOLAR THERMAL AND CONCENTRATED SOLAR POWER BAROMETERS – EUROBSERV’ER – JUNE 2018
in individual homes or multi-occupancy
blocks, using all the roof area.
However, the sector’s prospects are
not entirely gloomy. In the renovation
segment, Uniclima hopes for an upturn
with the Climate-Energy contribution
and a more clement economic context.
The Climate-Energy Contribution (CCE),
introduced by the 2014 Finance Act, is
a tax measure intended to put a price
on carbon. It aims to limit the use of
high-carbon energies by making them
more expensive and thus encourage con-
sumers to adopt more efficient and envi-
ronmentally-friendly heating systems. In
2017, the CCE rose to € 30.5 excl. tax per
tonne of CO2 from € 22 in 2016. Heavy fuel
oil is obviously hard hit. The domestic
consumption tax has risen from € 6.88
per 100 kg in 2016 to € 9.54 in 2017 (a 38.7%
rise). The energy transition law for green
growth sets goals for the carbon compo-
nent of domestic taxes at € 56 per tonne
in 2020 and € 100 per tonne in 2030. Major
heat consumers (of industrial heat, dis-
trict heating) will also factor this sched-
uled increase into their calculations on
new projects and so these markets are
likely to open up to solar heat.
Another glimmer of hope, the govern-
ment launched on June 28, 2018 a mobi-
lization to accelerate the deployment of
solar energy “Place to the sun”. For the
solar thermal component, the govern-
ment plans in the individual to increase
aid from 2019 for hot water and heating
and prepare the requirement for a min-
imum renewable heat rate in all new
buildings, as well as to better take into
account the solar contributions in ther-
mal regulation.
tHe solar tHermal industry
China has taken solar thermal’s global top spotIn the space of two years, the solar ther-
mal market’s development has had an
impact on the competitive environment
of the panel producers. According to Sol-
rico, a research agency specialising in the
solar sector, the 2015 leader of the top 5
worldwide solar companies was Austrian
(GREENoneTEC), the second and fifth
were Chinese (Fivestar and Sunrain), the
third Brazilian (Soletrol) and the fourth
German (Bosch Thermotechnik). In 2017,
the top four players in the same ranking
are Chinese, with Bosch Thermotechnik
ranked fifth. Incidentally, while GREE-
NoneTEC is ranked second, it now flies the
flag of the Chinese company Haier, which
acquired a 51% stake in it in May 2018.
Haier is not only banking on establish-
ing a foothold in the European market
but also taking up GREENoneTEC’s large
glazed collector expertise. The buyout is
symbolic in more ways than one. Firstly,
as the individual home market is clearly
slowing down, it shows the interest now
required by solar companies in the abil-
ity to supply equipment for large-scale
projects if they are to enter the collec-
tive installation, industrial process and
district heat segments. Furthermore,
GREENoneTEC will act a s a commer-
cial intermediary for Haier products in
Europe, which include heat pumps and
air-conditioners. Thus, GREENoneTEC
could become a more generalist heating
and air-conditioning player, like its major
European competitors.
There are many European firms outside
this leading pack in the 2017 top 20 global
flat glazed collector producer ranks. The
Germans, such as Vaillant, Thermosolar,
Viessmann and even Bosch Thermotech-
nik have seen their activity slow down
because Germany, their main market, is
too sluggish. Other European companies
have bucked this trend and increased
production after entering new markets
essentially located outside the European
Union. Sales by the Greek company Dimas
Solar have increased 12% thanks to the
North African market. The Italian, Ariston
has pursued opportunities in the Carib-
bean and the Middle-East and enjoyed
14% growth. The pie chart by table no. 6
shows the 2017 distribution by output of
the top 10 European solar thermal firms.
Solrico has made this breakdown avail-
able through its research work. However,
it can only give estimated company rank-
ings because many of them were reticent
to disclose their production figures in
absolute terms.
It is becoming increasingly clear to the
industry players that the sector’s new
growth drivers are large-scale projects
such as solar thermal integrated into
industrial processes. Typically, solar
heat provides heat or steam that may
rise to temperatures in the hundreds of
degrees for industrial production lines.
A Solrico study based on the European
Solar Payback project findings, identi-
fied 110 solar thermal projects applied
to processes across the globe in 2017, i.e.
192 580 m2. The study came to total figure
of 635 installations applied to an indus-
trial process. In 2017, this segment was
boosted by Mexico, with 36 new instal-
lations, followed by India with 22 and
China with 19 installations. In Europe,
only 2 installations of this type were com-
pleted in France. This outlet, which is still
embryonic in Europe, is financially viable
yet requires direct subsidies to back it.
There are still many curbs in its way, the
first being industry’s unawareness of this
solution and excessively long ROI pay-
back times. An alternative to this barrier
could be third-party financing, whereby a
firm supplies the thermal installation and
bears the equipment installation cost. It
then sells on the heat to the industrial
concern at a competitive price through a
long-term contract.
Another growth opportunity is continu-
ing to expand – that of solar thermal
farms connected to heating networks. A
strong indication of this sector’s devel-
opment is that new farm size records
are made every year. The solar thermal
barometer for 2017 put the spotlight on
the 70 000-m2 Vojens farm in Denmark.
But since then the town of Silkeborg (also
in Denmark) has taken the record for the
2016 2017
m2 MWth m2 MWth
Germany 19 122 000 13 385 19 442 000 13 609
Austria 5 210 202 3 647 5 172 185 3 621
Greece 4 477 375 3 134 4 596 000 3 217
Spain 3 905 928 2 734 4 106 950 2 875
Italy 3 891 000 2 724 4 042 000 2 829
France*** 3 018 040 2 113 3 105 000 2 174
Poland 2 016 000 1 411 2 128 880 1 490
Denmark 1 369 000 958 1 376 750 964
Portugal 1 176 000 823 1 222 100 855
Czech Republic 1 137 542 796 1 093 443 765
United Kingdom 715 252 501 725 190 508
Belgium 705 000 494 731 700 512
Netherlands 652 205 457 646 575 453
Cyprus 647 824 453 636 424 445
Sweden 485 000 340 482 000 337
Ireland 331 891 232 348 196 244
Hungary 287 296 201 303 942 213
Slovenia 245 000 172 247 700 173
Romania 174 000 122 191 800 134
Croatia 204 500 143 225 500 158
Slovakia 177 000 124 186 600 131
Bulgaria 137 500 96 143 100 100
Luxembourg 59 550 42 63 150 44
Finland 55 000 39 58 200 41
Malta 69 856 49 70 504 49
Latvia 22 720 16 24 520 17
Lithuania 17 950 13 20 150 14
Estonia 14 120 10 16 120 11
Total EU 28 50 324 751 35 227 51 406 679 35 985
All technologies including unglazed collectors. ** Estimate. *** Overseas department included . Source: EurObserv’ER 2018.
Tabl. n°4Cumulated capacity of thermal solar collectors* installed in the European Union in 2016 and 2017**(in m2 and in MWth)
Country m2/inhab. kWth/inhab.
Cyprus 0,745 0,521
Austria 0,590 0,413
Greece 0,427 0,299
Denmark 0,239 0,168
Germany 0,235 0,164
Malta 0,160 0,112
Slovenia 0,120 0,084
Portugal 0,119 0,083
Luxembourg 0,107 0,075
Czech Republic 0,103 0,072
Spain 0,088 0,062
Ireland 0,073 0,051
Italy 0,067 0,047
Belgium 0,064 0,045
Poland 0,056 0,039
Croatia 0,054 0,038
Sweden 0,048 0,034
France*** 0,046 0,032
Netherlands 0,038 0,026
Slovakia 0,034 0,024
Hungary 0,031 0,022
Bulgaria 0,020 0,014
Latvia 0,013 0,009
Estonia 0,012 0,009
United Kingdom 0,011 0,008
Finland 0,011 0,007
Romania 0,010 0,007
Lithuania 0,007 0,005
Total EU 28 0,100 0,070
* All technologies included unglazed collectors. ** Estimate. *** Overseas departments included.
Source: EurObserv’ER 2018
Tabl. n° 5Solar thermal capacities* in operation per capita (m2/inhab. and kWh/inhab.) in 2017**

sola
r t
her
ma
l a
nd
co
nc
entr
ated
so
lar
po
wer
ba
ro
met
ers
sola
r t
her
ma
l a
nd
co
nc
entr
ated
so
lar
po
wer
ba
ro
met
ers
1413
SOLAR THERMAL AND CONCENTRATED SOLAR POWER BAROMETERS – EUROBSERV’ER – JUNE 2018 SOLAR THERMAL AND CONCENTRATED SOLAR POWER BAROMETERS – EUROBSERV’ER – JUNE 2018
Source: EurObserv’ER 2018
Curent Trend
NREAP Roadmap
1 9442 121 2 1742 058
2 336
20202015 2016 2017 2018 20192014
3 042
6 348
Graph. n° 3Comparison of the current trend against the NREAP (National Renewable Energy Action Plans) roadmap (in ktoe)
biggest farm hooked up to a heating net-
work, with 156 694 m2 connected. The
same company, Arcon-Sunmark of Den-
mark, developed both projects.
Doubt as to whether the solar heat contribution can be maintained The European market’s trend decline
has been unabated since 2009 and has
gradually widened the gap from the
National Renewable Energ y Ac tion
Plan (NRE AP) targets (graph 3). This
decline now throws doubt on whether
the contribution of solar heat inputs
to the European renewable energy tar-
gets can be maintained in the next few
years because of the decommissioning
of old installations. The market level is
now lower than it was in 2003 (2.1 million
m2). The capacity and area of decom-
missioned installations will increase
mechanically every year because of the
market surge twenty years ago. Once
out of service, the growth in solar heat’s
input will decline and could even plum-
met if the European market does not
14%Bosch
Thermotechnik
9%Viessmann
11%Dimas
9%Thermosolar
6%Vaillant
Group
7%Nobel
6%Delpaso Solar
5%Ariston
5%Cosmosolar
really recover.
However, on paper, the intentions are
there for all to see and likely to kick-start
the sector within the next decade. On
14 June 2018, a milestone was reached
on the forthcoming renewable energy
directive that will set the roadmap
through to 2030. The European Parlia-
ment and European Council represen-
tatives finally forged an agreement on
a 32% renewable target of total final
energy consumption, which is a great
improvement on the 27% initially pro-
posed by the European Commission.
Nevertheless, the clause has a built-in
provision to revise the target in 2023.
With regard to heating and cooling ,
the provisional agreement provides for
a sub-target of indicative increase of
1.3% per year for renewable energies
calculated over the 5-year period star-
ting from 2021. Another important text,
the directive amendment on building
energ y per formance is now a given
because it was adopted by the 28-mem-
ber countries on 14 May 2018. The basic
tenet of this directive is that buildings
account for 40% of energy consump-
tion and that three-quarters of them
are poorly insulated. The text obliges
the member countries to adopt a “long-
term national renovation strategy” for
their public and private residential and
non-residential building stock, with an
80–95% emission reduction target for
2050. The country strategies must define
goals for 2030, 2040 and 2050 to measure
their progress. The directive proposes
to back the quality of renovation work
and the efficiency of the energy savings
obtained with financial measures, which
is likely to state a strong case for solar
thermal solutions.
Sources: AGEE-Stat (Germany), AEE INTEC (Austria),
Assotermica (Italy), EBHE (Greece), SPIUG (Poland),
ASIT (Spain), Uniclima (France), Observ’ER (France),
PlanEnergi (Denmark), Ministry of Industry and
Trade (Czech Republic), Statistics Netherlands,
ATTB (Belgium), STA (United Kingdom), SEAI (Ireland
Republic), STATEC (Luxembourg), NSO (Malta), University
of Miskolc (Hungary), Solar Energy Association of
Sweden, REN 21, solarthermalworld.org, Solar Thermal
Federation of India, Observ’ER (Others).)
Company Country Activity
GREENoneTEC Austria Flat plate and vacuum tube collectors
Bosch Thermotechnik Germany Heating equipment supplier / Flat plate collector manufacturer
Viessmann Germany Heating equipment / solar thermal
Dimas Greece Flat plate collectors manufacturer
Thermosolar Germany Flat plate and vacuum tube collectors
Vaillant Group Germany Heating equipment supplier / solar thermal
Nobel Bulgaria Flat plate collectors manufacturer
Delpaso Solar Spain Flat plate collectors manufacturer
Ariston Italy Flat plate collectors manufacturer
Cosmosolar Greece Flat plate collectors manufacturer and heating equipment supplier
Wolf * Germany Flat plate and vacuum tube collectors manufacturer and heating equipment supplier
Cosmosolar * Greece Flat plate collectors manufacturer and heating equipment supplier
Source: EurObserv’ER 2018.
Tabl. n° 6Representative European solar thermal collector manufacturers
Graph. n° 2Production share as of 2017 among representative European solar thermalcollectors manufacturers
28%GREENone
TEC
Solar thermal plant in Dronninglund, Denmark A
rc
on
-Su
nm
ar
k

1615
sola
r t
her
ma
l a
nd
co
nc
entr
ated
so
lar
po
wer
ba
ro
met
ers
sola
r t
her
ma
l a
nd
co
nc
entr
ated
so
lar
po
wer
ba
ro
met
ers
SOLAR THERMAL AND CONCENTRATED SOLAR POWER BAROMETERS – EUROBSERV’ER – JUNE 2018 SOLAR THERMAL AND CONCENTRATED SOLAR POWER BAROMETERS – EUROBSERV’ER – JUNE 2018
Part 2: ConCentrated solar Power
Thermodynamic or concentrated
solar power plants (CSP) cover all
the technologies that convert the
energy of the sun’s rays into heat at very
high temperatures and harness it either
as electricity or heat. There are several
type of plants – tower plants with sta-
tionary heliostats that concentrate the
radiation onto a receiver at the top of
the tower, plants that use Fresnel collec-
tors where rows of flat mirrors concen-
trate the radiation onto a tube-shaped
receiver, parabolic trough collectors that
concentrate the rays onto a tube and
parabolic collectors where a parabolic-
shaped mirror reflects the sun’s rays onto
a convergence point.
4 845 MW of CSP capacity in the worldMost of the CSP development currently
takes place in those countries, such as
China, Australia, South Africa, the Gulf
states and North Africa, whose exposure
to the sun offers high potential. According
to the Spanish Association of Solar Ther-
mal Electricity Industry, Protermosolar,
website, global capacity of these plants
was put at 4 845 MW at the end of 2017.
Only one single commercial-sized instal-
lation was commissioned during the year,
namely the Xina Solar One (100 MW) plant
in South Africa. This additional capacity
should be viewed against that of 2016
when three plants were hooked up to the
grid – Bokport (50 MW) and Khi Solar One
(50 MW) in South Africa and SunCan Dun-
huang (10 MW) Phase I in China.
The number of plants currently under
construction is much higher – 22 scat-
tered across the globe for total capac-
ity of 1 625 MW – and should lead to a
significant increase in global installed
capacity from 2018 onwards. China, with
nine projects, is currently the most active
country on this front with: Qinghai Sup-
con Delingha 50MW, Dunhuang 100 MW,
Hami 50 MW, Gansu Akesai 50 MW, Chabei
Molten Salt Parabolic Trough 64 MW,
Yumen Town East 50 MW, Gansu Yumen
East town 50 MW, Urat Middle Banner
100 MW and Yumen Thermal Oil Parabolic
50 MW. Two projects have been identified
in Morocco (NOOR II 185 MW and NOOR III
150 MW), two in South Africa (Kathu Solar
Park 100 MW and Ilanga I 100 MW), two in
Israel (Ashalim1 CSP project, 121 MW and
Ashalim2 CSP project, 110 MW), two in
Saudi Arabia (ISCC Duba 1 50 MW, Waad Al
Shamal ISCC Plant 50 MW), one in Kuwait
(Shagaya CSP Project 50 MW), one in India
(Dadri ISCC Plant 14 MW), one in Mexico
(Agua Prieta II, 12 MW) and one in France
(Ello 9 MW). Another 18 longer-term proj-
ects will add 2 245 MW capacity (785 MW
in China, 700 MW in Dubai, 360 MW in
South Africa and 250 MW in India).
2 314 MW in the European UnionThe market slowed right down after the
flurry of installations concentrated in
Spain from 2007 to 2014. At the end of
2017, the grid connection of the Ottana
CSP plant (0.6 MW) in Sardinia moved
the European Union concentrated solar
power capacity tally slightly higher to
2 314.3 MW, includes pilot plants and
demonstrators (table 6 and graph 3). A
few projects are expected in 2018, includ-
ing a 9-MW project in France and a 1-MW
demonstrator in the Sicilian town of Mel-
lili. Four larger projects (Solecaldo 41 MW
at Aidone, Sicily; Reflex Solar Power
12.5 MW at Gela, Sicily; Lentini 55 MW Sic-
ily and the San Quirico 10-MW hybrid CSP
solar project in Sardinia) are likely to be
completed by 2020–2021, but their inves-
Graph. n° 4European Union concentrated solar power capacity trend (MWe)
10.0 60.0
281.4
738.4
1 158.7
1 961.2
2 312.5 2 313.7 2 313.7 2 313.7
2007 2008 2009 2010 2011 2012 2013 2014 2015 2016
2314.3
2017
Source: EurObserv’ER 2018
CSP projects to supply district heating networks
CSP technology can also produce heat for industry or district heating. We can only tentatively gauge this market’s
growth potential. Meanwhile, new innovative projects using concentrating mirror technology are emerging to supply
district heating networks, usually in conjunction with another renewable energy, namely biomass. In Northern Den-
mark, the Danish developer Aalborg CSP commissioned a project combining a CSP plant and an ORC biomass plant in
the municipality of Brønderslev on 18 March 2018. The installation with 16.6 MWth of thermal capacity can produce both
heat and electricity. The solar part uses 26 929 m2 of parabolic trough collectors. The project aims to demonstrate the
relevance of using this concentration technology in Northern Europe both to supply heating networks and as a backup
source for producing electricity. The same developer has already worked on projects in Denmark that combine flat gla-
zed collector technology with parabolic trough mirrors. An example of this is the town of Taars, which has a 4 039-m2
CSP plant with 5 972 m2 of ground-mounted flat glazed collectors. It supplies the district heating network with 31% of its
needs, delivering 6 082 MWh of heat.
In Spain, CSP, which is usually devoted to electricity production, has also extended its scope of application to supply dis-
trict heating networks. In February 2018, Alcalá Ecoenergías signed a contract for the construction of Spain’s first major
hybrid solar-biomass heating network at Alcalá de Henares. The installation will be equipped with a 30-MW biomass
boiler and a 12-MW CSP plant, which will supply heat to about 12 000 homes. The choice of which CSP technology will be
used is as yet undecided but will be made between parabolic trough mirrors or Fresnel linear collectors. The network,
which could be up and running by the end of 2019, will benefit from Proyectos Clima Agreement funding (which will
provide 10 euros in aid for each tonne of CO2 avoided), a 20% investment aid from the PAREER CRECE incentive system,
and contributions from the IDAE and the European Regional Development Fund. Alcalá Ecoenergías claims that the 38
million-euro project (€ 32 million for the biomass plant and € 6 million for the solar part) should be amortized within a
decade and reduce the users’ energy bill by 15–30%.
Certification of a concentrated solar plant by a TÜV SÜD agent
TÜ
V S
ÜD

1817
sola
r t
her
ma
l a
nd
co
nc
entr
ated
so
lar
po
wer
ba
ro
met
ers
sola
r t
her
ma
l a
nd
co
nc
entr
ated
so
lar
po
wer
ba
ro
met
ers
SOLAR THERMAL AND CONCENTRATED SOLAR POWER BAROMETERS – EUROBSERV’ER – JUNE 2018 SOLAR THERMAL AND CONCENTRATED SOLAR POWER BAROMETERS – EUROBSERV’ER – JUNE 2018
tors are waiting for publication of the new
decree that will set out the payment terms
(see § on Italy). For this reason, the com-
missioning dates are pending (table 7).
csp side-lined in spainConstruction of the CSP sector started in
Spain after publication of Royal Decree
436/2004 which introduced the pricing con-
ditions required for investments in this
type of plant. The first plant (PS 10) was
commissioned in 2007. The pricing condi-
tions were retroactively changed several
times through to 2014. Sector develop-
ment finally ground to a halt in 2012 when
the incumbent right-wing government
announced its moratorium, refusing to
maintain the subsidies granted to renew-
able installations. During the period from
2007–2013, Spain constructed 49 com-
mercially viable and one prototype plant
(Puerto Errado 1), with a combined capacity
of 2 303.9 MW.
Since 2014, Spain’s CSP plants have run
entirely on solar energy after the initial
option of using up to 15% natural gas as
top-up energy was discarded. This measure
has had no effect on their output for they
have run consistently above 5 TWh without
any operating difficulties. Red Eléctrica de
España says that output reached 5 348 GWh
in 2017, rising from 5 071 GWh in 2016 and
5 085 GWh in 2015. According to Protermo-
solar, the CSP plants currently in service
can cover electricity demand peaks of up
to 10% with an average contribution level
of 8% during the summer.
Spain’s situation is unlikely to alter in the
next few years despite the moratorium’s
end. The call for new “technologically neu-
tral” tenders since 2017 has forced CSP to
bow out for the time being in the face of
competing technologies such as solar pho-
tovoltaic.
tHe timing is wrong for plant commissioning in franceFrance will commission its first commer-
cially-sized CSP plant this summer at Llo
in the Eastern Pyrenees. The eLLO proj-
ect will be the first Fresnel plant to have
a storage system. It will have 9 MW of
capacity… enough to cover the electricity
needs of more than 6 000 homes, i.e. about
20 GWh p.a. The plant is built on a 36-hect-
are site and equipped with 95 200 mirrors
assembled in 23 800 collectors covering
153 000 m2. Its output will be stored in
nine 90 tonne, 120-m³ of steam accumula-
tors each at 80 bar to provide four hours
of storage. Construction, which kicked
off in October 2016, has taken almost two
years and required investment of about
€ 60 million. The plant will be eligible for
an “anachronistic” Feed-in Tariff of € 0.349
per kWh which was obtained when the
first CRE call for bidding was made in 2011.
SUNCNIM, the project designer, says that
the project’s capacity level and storage
technology are now unsuitable for the
global electricity market. The industrialist
now prefers to concentrate on the thermal
part of CSP plants with a view to supplying
heat to industry, primarily the oil sector, in
countries with high sunshine levels.
projects still at a standstill in italyEmilio Cont i , of A n e s t (t h e It a lia n
National Association of Thermodynamic
Solar Energy) says that the 2017 market
was more or less stagnant. The sector
is still waiting for payment term details
in a new decree for >5-MW plants that
should have been published at the end
of 2017. It should take up the elements
contained in the 23 June 2016 decree
and have kicked off the construction of
118.5 MW of capacity that has already
received authorisation. Three projects
in Sicily (55 MW at Carlentini, 41 MW at
Aidone and 12.5 MW at Gela) and one in
Sardinia (a 10-MW hybrid CSP/Biomass
plant at San Quirico) are now held up. Two
Tabl. n° 7Concentrated solar power plants in operation at the end of 2017. (Source: EurObserv’ER 2018)
Project Technology Capacity (MW) Commisionning date
Spain
Planta Solar 10 Central receiver 10 2007
Andasol-1 Parabolic trough 50 2008
Planta Solar 20 Central receiver 20 2009
Ibersol Ciudad Real (Puertollano) Parabolic trough 50 2009
Puerto Errado 1 (prototype) Linear Fresnel 1,4 2009
Alvarado I La Risca Parabolic trough 50 2009
Andasol-2 Parabolic trough 50 2009
Extresol-1 Parabolic trough 50 2009
Extresol-2 Parabolic trough 50 2010
Solnova 1 Parabolic trough 50 2010
Solnova 3 Parabolic trough 50 2010
Solnova 4 Parabolic trough 50 2010
La Florida Parabolic trough 50 2010
Majadas Parabolic trough 50 2010
La Dehesa Parabolic trough 50 2010
Palma del Río II Parabolic trough 50 2010
Manchasol 1 Parabolic trough 50 2010
Manchasol 2 Parabolic trough 50 2011
Gemasolar Central receiver 20 2011
Palma del Río I Parabolic trough 50 2011
Lebrija 1 Parabolic trough 50 2011
Andasol-3 Parabolic trough 50 2011
Helioenergy 1 Parabolic trough 50 2011
Astexol II Parabolic trough 50 2011
Arcosol-50 Parabolic trough 50 2011
Termesol-50 Parabolic trough 50 2011
Aste 1A Parabolic trough 50 2012
Aste 1B Parabolic trough 50 2012
Helioenergy 2 Parabolic trough 50 2012
Puerto Errado II Linear Fresnel 30 2012
Solacor 1 Parabolic trough 50 2012
Solacor 2 Parabolic trough 50 2012
Helios 1 Parabolic trough 50 2012
Moron Parabolic trough 50 2012
Solaben 3 Parabolic trough 50 2012
Guzman Parabolic trough 50 2012
La Africana Parabolic trough 50 2012
Olivenza 1 Parabolic trough 50 2012
Helios 2 Parabolic trough 50 2012
Orellana Parabolic trough 50 2012
Extresol-3 Parabolic trough 50 2012
Solaben 2 Parabolic trough 50 2012
Termosolar Borges Parabolic trough + HB 22.5 2012
Termosol 1 Parabolic trough 50 2013
Termosol 2 Parabolic trough 50 2013
Solaben 1 Parabolic trough 50 2013
Casablanca Parabolic trough 50 2013
Enerstar Parabolic trough 50 2013
Solaben 6 Parabolic trough 50 2013
Arenales Parabolic trough 50 2013
Total Spain 2 303.9
Italy
Archimede (prototype) Parabolic trough 5 2010
Archimede-Chiyoda Molten Salt Test Loop Parabolic trough 0.35 2013
Freesun Linear Fresnel 1 2013
Zasoli Linear Fresnel + HB 0.2 2014
Rende Linear Fresnel + HB 1 2014
Ottana Linear Fresnel 0,6 2017
Total Italy 8.15
Germany
Jülich Central receiver 1.5 2010
Total Germany 1.5
France
La Seyne-sur-Mer (prototype) Linear Fresnel 0.5 2010
Augustin Fresnel 1 (prototype) Linear Fresnel 0.25 2011
Total France 0.75
Total European Union 2314,3

2019
sola
r t
her
ma
l a
nd
co
nc
entr
ated
so
lar
po
wer
ba
ro
met
ers
sola
r t
her
ma
l a
nd
co
nc
entr
ated
so
lar
po
wer
ba
ro
met
ers
SOLAR THERMAL AND CONCENTRATED SOLAR POWER BAROMETERS – EUROBSERV’ER – JUNE 2018 SOLAR THERMAL AND CONCENTRATED SOLAR POWER BAROMETERS – EUROBSERV’ER – JUNE 2018
other plants are in the final authorisation
stage – the Flumini Mannu plant (55 MW)
in the Sardinian communities of Villasor
and Decimoputzu and the 10-MW 3QP
plant at San Severo in the Puglia.
Eight <5-MW plant projects have been
accepted by the Italian grid operator
(GSE) to cover an expected 20 MW. Seven
of them are in Sicily and one in Sardinia.
Anest suggests that Calliope PV Srl at
Trapani, Sicily (4 MW), Stromboli Solar
Srl also at Trapani (4 MW), Solin Par Srl
at Partanna (4.3 MW) and Bilancia PV Srl
at Mezzojuso (4 MW) near Palermo will
probably be the first to start.
In the meantime, the sector has had to
make do with connection of the small
600 -kW Fresnel-type plant at Ottana,
Sardinia (with 9 000 m2 of mirrors) on 5
Tabl. n° 8Concentrated solar power plants under developement at the beginning of the year 2018
Project Project's holders LocationCapacity
[MW]Technology
Commercial date of
operation expected
Italy
Flumini Mannu FLUMINI MANNU LTD Villasor (Sardinia) 55 Parabolic Through n.a
Lentini LENTINI LTDCarlentini. Melilli
(Sicily)55 Parabolic Through n.a
Solecaldo MF ENERGY Aidone (Sicily) 41 Linear Fresnel n.a
Reflex Solar Power REFLEX SOLAR POWER Gela (Sicily) 12,5 Parabolic Through n.a
CSP San QuiricoSAN QUIRICO SOLAR POWER
San Quirico(Sardinia)
10Parabolic Through
(hybride)n.a
San Severo 3SPSan Severo
(Puglia)10 Central receiver n.a
Not known SOL.IN.PAR Partanna (Sicily) 4,2 Not known n.a
Bilancia 1TRINACRIA SOLAR POWER
Palermo (Sicily) 4 Linear Fresnel n.a
CalliopeTRINACRIA SOLAR POWER
Trapani (Sicily) 4 Linear Fresnel n.a
Stromboli SolarTRINACRIA SOLAR POWER
Trapani (Sicily) 4 Linear Fresnel n.a
Not known Solar Energy SRL Belpasso (Sicily) 1,2 Not known n.a
Archimede ARCHIMEDE SRL Melilli (Sicily) 1 Parabolic Through 2018
Non connu / Not known
ESSECV S.R.L.Francofonte
(Sicily)1 Not known n.a
ENAS ENASNoragugume
(Sardinia)0,7 Not known n.a
Total Italy 203,6
France
eLLo Suncnim LIo, Pyrenees 9 Linear Fresnel 2018
Total France 9
Cyprus
Helios Power Infinia Larnaca 50,8 Dish Stirling n.a.
Total Cyprus 50,8
Greece
Maximus Dish project Infinia Florina 75 Dish Stirling n.a.
MINOS CSP tower Nur Energy Crete 50 Central receiver n.a.
Total Greece 125
Spain
PTC50 Alvarado Acciona EnergiaAlvarado.
Badajoz50
Central receiver (power tower) -
Hybriden.a.
Total Spain 50
Total European Union 438,4
Company in liquidation. Source: EurObserv’ER 2018.
Construction of the concentrated solar plant Andasol II, Spain
Pa
ul
La
ng
ro
ck

2221
sola
r t
her
ma
l a
nd
co
nc
entr
ated
so
lar
po
wer
ba
ro
met
ers
sola
r t
her
ma
l a
nd
co
nc
entr
ated
so
lar
po
wer
ba
ro
met
ers
SOLAR THERMAL AND CONCENTRATED SOLAR POWER BAROMETERS – EUROBSERV’ER – JUNE 2018 SOLAR THERMAL AND CONCENTRATED SOLAR POWER BAROMETERS – EUROBSERV’ER – JUNE 2018
October 2017 and the first to use an ORC
Organic Rankine Cycle. A second 1-MW
parabolic-trough demonstrator, also con-
nected to an ORC system is under con-
struction at Mellili, Sicily. The Feed-in
Tariff for 250 kW to 5 MW installations is
€ 296 per MWh. An “integration factor”
is added if the plant is equipped with a
storage system, which in the case of the
Mellili plant adds a further € 45 per MWh
(giving a total of € 341 per MWh).
The major CSP market players in Europe
are Spanish (see table 9), yet they are cur-
rently selling off their assets. In February
2018, Acciona started negotiating with
the British firm, ContourGlobal, to sell
five of its CSP projects in Spain. The sale
cost about 1.10 billion euros for 250 MW of
capacity. Acciona decided on this course
of action to reduce its 760 million-euro
debt. As a result of this disposal, it has no
CSP assets in Europe. Its only connection
to this technology will be indirect own-
ership of the 64-MW Nevada Solar One
CSP farm in the USA. Likewise, Iberdrola
announced that it wanted to sell off its
50-MW Puertollano farm in Spain’s Cas-
tilla-La Mancha region. The Spanish daily,
El Economista, puts the price of this asset
at € 100–150 million. The sale is part of
a general asset-shedding move to raise
three billion euros.
Full steam ahead for the industry’s R&D efforts While few projects are coming to fruition
in Europe, concentrated solar power still
stimulates companies through research
and development. The European Union
funds the Capture project launched in 2015
through its H2020 programme. Capture
aims to reduce CSP project costs, thereby
enhancing its competitiveness. It is a
technology-driven project, in which each
solar park component will be developed to
improve its efficiency and reduce the mean
cost of producing the energy. The challenge
is to construct a CSP installation in South-
ern Spain comprising several towers and
4 heliostat fields, three of which will be
based on Brayton cycles. The latter is a ther-
modynamic gas intercooled cycle. Thirteen
companies from six European countries are
taking part in the project, which shows that
CSP projects are not about to disappear in
Europe and that the sector can still supply
several GW to the Union. However, projects
of this type call for collaboration between
the member countries.
The future for European CSP is uncertain
The outlook for European sector growth
by 2020 will be much lower than the mem-
ber countries’ National Renewable Energy
Action Plan targets (graph 4). The next
three years are unclear because publica-
tion is pending of decrees offering better
payment terms that will give the green light
to the only confirmed projects, all in Italy.
On the eve of the new renewable energy
directive, new major Europe CSP projects
could still be implemented. The sector’s
representatives, such as Luis Crespo of
Protermosolar remind us that CSP could
play a major role in an increasingly inter-
dependent and interconnected grid. They
highlight the sector’s strengths stemming
from long-lasting storage capacities capa-
ble of securing part of the European coun-
tries supplied, primarily in Central Europe,
where only variable capacity technologies
such as wind energy and solar photovol-
taic are likely to be developed. Luis Cre-
spo also points out that the new European
Renewable Energy Directive will encour-
age cross-border exchanges. Investments
will be made where the best resources are.
He holds that CSP’s future role in the new
targets for 2030 will depend on countries’
ability to coordinate their investments
geographically on the basis of the comple-
mentary characteristics of all renewable
energies to provide Europe with a robust,
inexpensive and emission-free electricity
production system.
Sources: Protermosolar (Spain), REE (Spain), ANEST
(Italy).
The next barometer will cover biofuels.
This barometer was prepared by Observ’ER in the scope of the EurObserv’ER project, which groups together Observ’ER (FR), ECN (NL), RENAC (DE), Frankfurt School of Finance and Management (DE), Fraunhofer ISI (DE) and Statistics Netherlands (NL). The information and views set out in this publication are those of the author(s) and do not necessarily reflect the official opinion of the Commission. The Commission does not guarantee the accuracy of the data included in this study. Neither the Commission nor any person acting on the Commission’s behalf may be held responsible for the use which may be made of the information contained therein.
This project is funded by the European Union under
contract no ENER/C2/2016-487/SI2.742173
Source: EurObserv’ER 2018
Current Trend
NREAP Roadmaps
2 312.5 2 313.7 2 313.7 2 314.32 313.72 582,1
20202015 2016 2017 2018 20192013 2014
3 526
6 765
Graph. n° 4Comparison of the current trend against the NREAP (National Renewable Energy Action Plans) roadmap (in MW)
Tabl. n° 9Main European CSP project developers
Company Country ActivityMW developed or under
construction (2016)
Ibereolica Spain Engineering - EPC - O&M - Project developer 300
Magtel Renewables SpainPromoter - Project developer - EPC - O&M -
Engineering - Consultingn.c.
Abengoa SpainPromoter - Project developer - EPC -
Engineering - O&M - Components651
Cobra Spain Promoter - Project developer - EPC - Engineering - O&M 567
Acciona Energy Spain EPC - Project developer - Promoter 314
Torresol Energy Spain Promoter - Project developer - O&M - Engineering 67
Hyperion Spain Promoter - Project developer - O&M 103
FCC Energia /Enerstar Spain Promoter - Project developer 100
Samca Spain Promoter - Project developer - O&M 100
Source: EurObserv’ER 2018 (based on company information)
Concentrated solar plant Andasol III, in La Calahorra, Spain T
ÜV
NO
RD