1 ─ - 紀陽銀行 · 2017 2016 2017 profit ¥ 11,156 ¥ 17,158 $99,438 other comprehensive...
TRANSCRIPT

As of March 31, 2017 and 2016
2017 2016 2017
Assets:Cash and due from banks (Note 3) ¥ 671,707 ¥ 465,655 $ 5,987,227Monetary claims bought (Note 4) 799 799 7,121Trading account securities (Note 4) 123 243 1,096Securities (Notes 4, 7, 12, 23 and 24) 1,305,660 1,172,316 11,637,935Loans and bills discounted (Notes 5, 22, 23 and 26) 2,812,871 2,731,037 25,072,386Foreign exchange 2,156 2,872 19,217Other assets (Note 7) 39,140 31,623 348,872Tangible fixed assets (Note 6) 36,224 36,843 322,880Intangible fixed assets 5,262 5,295 46,902Net defined benefit asset (Note 11) 12,769 13,710 113,815Deferred tax assets (Note 19) 777 937 6,925Customers’ liabilities for acceptances and guarantees (Note 12) 9,062 10,062 80,773Reserve for possible loan losses (26,095) (25,062) (232,596) Total assets ¥ 4,870,459 ¥ 4,446,335 $ 43,412,594 Liabilities:Deposits (Notes 7, 8 and 23) ¥ 3,941,679 ¥ 3,919,081 $ 35,133,960Call money and bills sold (Note 23) 208,500 - 1,858,454Payables under securities lending transactions (Notes 7 and 23) 180,206 93,367 1,606,257Borrowed money (Notes 7, 9 and 23) 245,410 146,475 2,187,449Foreign exchange 25 22 222Bonds (Notes 10 and 23) 10,000 13,000 89,134Other liabilities 50,018 38,896 445,832Net defined benefit liability (Note 11) 20 22 178Accrued directors’ retirement benefits 32 32 285Reserve for reimbursement of deposits 1,133 1,121 10,098Provision for contingent losses 497 556 4,429Deferred tax liabilities (Note 19) 5,895 8,845 52,544Acceptances and guarantees (Note 12) 9,062 10,062 80,773 Total liabilities 4,652,481 4,231,483 41,469,658 Net assets (Notes 13 and 14):Common stock 80,096 80,096 713,931Capital surplus 2,311 6,941 20,598Retained earnings 100,802 92,260 898,493Treasury stock (881) (4,406) (7,852) Total shareholders’ equity 182,328 174,891 1,625,171Net unrealized gains on available-for-sale securities (Note 4) 27,186 30,995 242,321Net deferred gains (losses) on hedging instruments (46) - (410)Accumulated adjustments for retirement benefits 5,133 5,758 45,752 Total accumulated other comprehensive income 32,273 36,754 287,663Subscription rights to shares (Notes 14 and 15) 52 21 463Non-controlling interests 3,323 3,184 29,619 Total net assets 217,978 214,851 1,942,936 Total liabilities and net assets ¥ 4,870,459 ¥ 4,446,335 $ 43,412,594 See accompanying notes.
Consolidated Balance SheetsThe Kiyo Bank, Ltd. and its consolidated subsidiaries
Millions of yenThousands of U.S.
dollars (Note 1)
─ 1 ─

2017 2016 2017
IncomeInterest income: Interest on loans and bills discounted ¥ 34,179 ¥ 37,004 $ 304,652 Interest and dividends on securities 14,005 14,125 124,832 Other interest income 506 475 4,510Fees and commissions 13,023 12,356 116,079Other operating income 8,149 10,156 72,635Other income (Note 16) 5,638 7,518 50,254 Total income 75,502 81,636 672,983
ExpensesInterest expense: Interest on deposits 2,344 3,211 20,893 Interest on payables under securities lending transactions 947 479 8,441 Interest on borrowings 126 243 1,123 Other interest expense 86 315 766Fees and commissions 4,250 4,270 37,882Other operating expenses 8,655 5,447 77,145General and administrative expenses (Note 17) 39,482 40,228 351,920Provision for possible loan losses 2,022 471 18,022Other expenses (Note 18) 4,333 5,842 38,621 Total expenses 62,249 60,509 554,853
Profit before income taxes 13,252 21,126 118,121Income taxes (Note 19): Current 1,361 542 12,131 Deferred 734 3,425 6,542 Total income taxes 2,096 3,967 18,682Profit 11,156 17,158 99,438Profit attributable to non-controlling interests 127 135 1,132Profit attributable to owners of parent ¥ 11,028 ¥ 17,023 $ 98,297
U.S. dollars
Per share of common stock: Basic earnings per share (Note 21) ¥ 157.77 ¥ 239.62 $ 1.40 Diluted earnings per share (Note 21) 157.70 239.57 1.40 Dividends (Note 14) 35.00 35.00 0.31
See accompanying notes.
Yen
Consolidated Income StatementsThe Kiyo Bank, Ltd. and its consolidated subsidiaries
Millions of yen
Thousands ofU.S. dollars
(Note 1)
Years ended March 31, 2017 and 2016
─ 2 ─

2017 2016 2017
Profit ¥ 11,156 ¥ 17,158 $ 99,438Other comprehensive income (loss) (Note 20): Net unrealized gains (losses) on available-for-sale securities (3,792) (9,685) (33,799) Net deferred gains (losses) on hedging instruments (46) 410 (410) Adjustments for retirement benefits (624) (3,511) (5,561) Total other comprehensive income (loss) (4,464) (12,786) (39,789)Comprehensive income ¥ 6,692 ¥ 4,371 $ 59,648
Total comprehensive income attributable to: ¥ 6,692 ¥ 4,371 $ 59,648 Comprehensive income attributable to owners of parent 6,548 4,226 58,365 Comprehensive income attributable to non-controlling interests 143 144 1,274
See accompanying notes.
Consolidated Statements of Comprehensive IncomeThe Kiyo Bank, Ltd. and its consolidated subsidiaries
Thousands ofU.S. dollars
(Note 1)Millions of yen
Years ended March 31, 2017 and 2016
─ 3 ─

Mil
lion
s of
yen
N
et u
nre
aliz
ed
Net
def
erre
d ga
ins
Tot
al a
ccu
mu
late
d
Com
mon
Cap
ital
Ret
ain
edT
reas
ury
Tot
al s
har
ehol
ders
’ g
ain
s on
ava
ilab
le(l
osse
s) o
n h
edgi
ng
oth
er c
ompr
ehen
sive
Non
-con
trol
lin
gT
otal
stoc
ksu
rplu
sea
rnin
gsst
ock
equ
ity
-for
-sal
e se
curi
ties
inst
rum
ents
inco
me
inte
rest
sn
et a
sset
sB
alan
ce a
t A
pril
1, 2
015
80,0
96
¥
6,
941
¥
77,7
51
¥
(2,1
15)
¥
16
2,67
4
¥
40
,691
¥
(4
10)
¥
9,
270
¥
49
,550
¥
¥
-
3,04
4
¥
215,
269
¥
Cas
h d
ivid
ends
- -
(2,5
15)
- (2
,515
)-
- -
- -
- (2
,515
)P
rofi
t at
trib
uta
ble
to o
wn
ers
of p
aren
t-
- 17
,023
-
17,0
23
- -
- -
- -
17,0
23
Pu
rch
ase
of t
reas
ury
sto
ck-
- -
(2,4
82)
(2,4
82)
- -
- -
- -
(2,4
82)
Dis
posa
l of
trea
sury
sto
c k-
0 -
191
191
- -
- -
- -
191
Net
ch
ange
s in
item
s ot
her
th
ansh
areh
olde
rs’ e
quit
y-
- -
- -
(9,6
95)
410
(3,5
11)
(12,
796)
21
139
(12,
634)
Tot
al c
han
ges
duri
ng
the
year
-0
14,5
08
(2,2
91)
12,2
17
(9,6
95)
410
(3,5
11)
(12,
796)
21
139
(417
)B
alan
ce a
t M
arch
31,
201
680
,096
6,94
192
,260
(4,4
06)
174,
891
30,9
95-
5,
758
36,7
5421
3,18
421
4,85
1B
alan
ce a
t A
pril
1, 2
016
80,0
966,
941
92,2
60(4
,406
)17
4,89
130
,995
-
5,75
836
,754
213,
184
214,
851
Cas
h d
ivid
ends
- -
(2,4
86)
- (2
,486
)-
- -
- -
- (2
,486
)P
rofi
t at
trib
uta
ble
to o
wn
ers
of p
aren
t-
- 11
,028
-
11,0
28
- -
- -
- -
11,0
28
Pu
rch
ase
of t
reas
ury
sto
ck-
- -
(1,5
04)
(1,5
04)
- -
- -
- -
(1,5
04)
Dis
posa
l of
trea
sury
sto
c k-
0 -
398
399
- -
- -
- -
399
Ret
irem
ent
of t
reas
ury
sto
ck-
(4,6
30)
- 4,
630
- -
- -
- -
- -
Net
ch
ange
s in
item
s ot
her
th
ansh
areh
olde
rs’ e
quit
y-
- -
- -
(3,8
09)
(46)
(624
)(4
,480
)30
13
8 (4
,310
)
Tot
al c
han
ges
duri
ng
the
year
-(4
,630
)8,
541
3,52
5 7,
437
(3,8
09)
(46)
(624
)(4
,480
)30
13
8 3,
126
Bal
ance
at
Mar
ch 3
1, 2
017
80,0
96
¥
2,
311
¥
100,
802
¥
(881
)
¥
18
2,32
8
¥
27
,186
¥
(4
6)
¥
5,
133
¥
32
,273
¥
52
¥
3,32
3
¥
217,
978
¥
Th
ousa
nds
of
U.S
. dol
lars
(N
ote
1)
Net
un
real
ized
N
et d
efer
red
gain
sT
otal
acc
um
ula
ted
Com
mon
Cap
ital
Ret
ain
edT
reas
ury
Tot
al s
har
ehol
ders
’ g
ain
s on
ava
ilab
le(l
osse
s) o
n h
edgi
ng
oth
er c
ompr
ehen
sive
Non
-con
trol
lin
gT
otal
stoc
ksu
rplu
sea
rnin
gsst
ock
equ
ity
-for
-sal
e se
curi
ties
inst
rum
ents
inco
me
inte
rest
sn
et a
sset
sB
alan
ce a
t A
pril
1, 2
016
713,
931
$
61,8
68
$
822,
354
$
(3
9,27
2)
$
1,
558,
882
$
276,
272
$
$
-
51,3
23
$
32
7,60
4
$
18
7
$
28,3
80
$
1,
915,
063
$
C
ash
div
iden
ds-
- (2
2,15
8)-
(22,
158)
- -
- -
- -
(22,
158)
Pro
fit
attr
ibu
tabl
e to
ow
ner
s of
par
ent
- -
98,2
97
- 98
,297
-
- -
- -
- 98
,297
P
urc
has
e of
tre
asu
ry s
tock
- -
- (1
3,40
5)(1
3,40
5)-
- -
- -
- (1
3,40
5)D
ispo
sal o
f tr
easu
ry s
toc k
- 0
- 3,
547
3,55
6 -
- -
- -
- 3,
556
Ret
irem
ent
of t
reas
ury
sto
ck-
(41,
269)
- 41
,269
-
- -
- -
- -
- N
et c
han
ges
in it
ems
oth
er t
han
shar
ehol
ders
’ equ
ity
- -
- -
- (3
3,95
1)(4
10)
(5,5
61)
(39,
932)
267
1,23
0 (3
8,41
6)
Tot
al c
han
ges
duri
ng
the
year
-(4
1,26
9)76
,129
31
,419
66
,289
(3
3,95
1)(4
10)
(5,5
61)
(39,
932)
267
1,23
0 27
,863
B
alan
ce a
t M
arch
31,
201
771
3,93
1
$
20
,598
$
89
8,49
3
$
(7,8
52)
$
1,
625,
171
$
242,
321
$
(4
10)
$
45
,752
$
287,
663
$
463
$
29
,619
$
1,94
2,93
6
$
See
acco
mpa
nyin
g no
tes.
Su
bscr
ipti
onri
ghts
to
shar
es
Su
bscr
ipti
onri
ghts
to
shar
es
Sh
areh
olde
rs’ e
quit
yA
ccu
mu
late
d ot
her
com
preh
ensi
ve in
com
e
Acc
um
ula
ted
adju
stm
ents
for
reti
rem
ent
ben
efit
s
Con
soli
date
d S
tate
men
ts o
f C
han
ges
in N
et A
sset
sT
he
Kiy
o B
ank,
Ltd
. an
d it
s co
nso
lida
ted
subs
idia
ries
Yea
rs e
nde
d M
arch
31,
201
7 an
d 20
16
Sh
areh
olde
rs’ e
quit
yA
ccu
mu
late
d ot
her
com
preh
ensi
ve in
com
e
Acc
um
ula
ted
adju
stm
ents
for
reti
rem
ent
ben
efit
s
─ 4 ─
2017 2016 2017
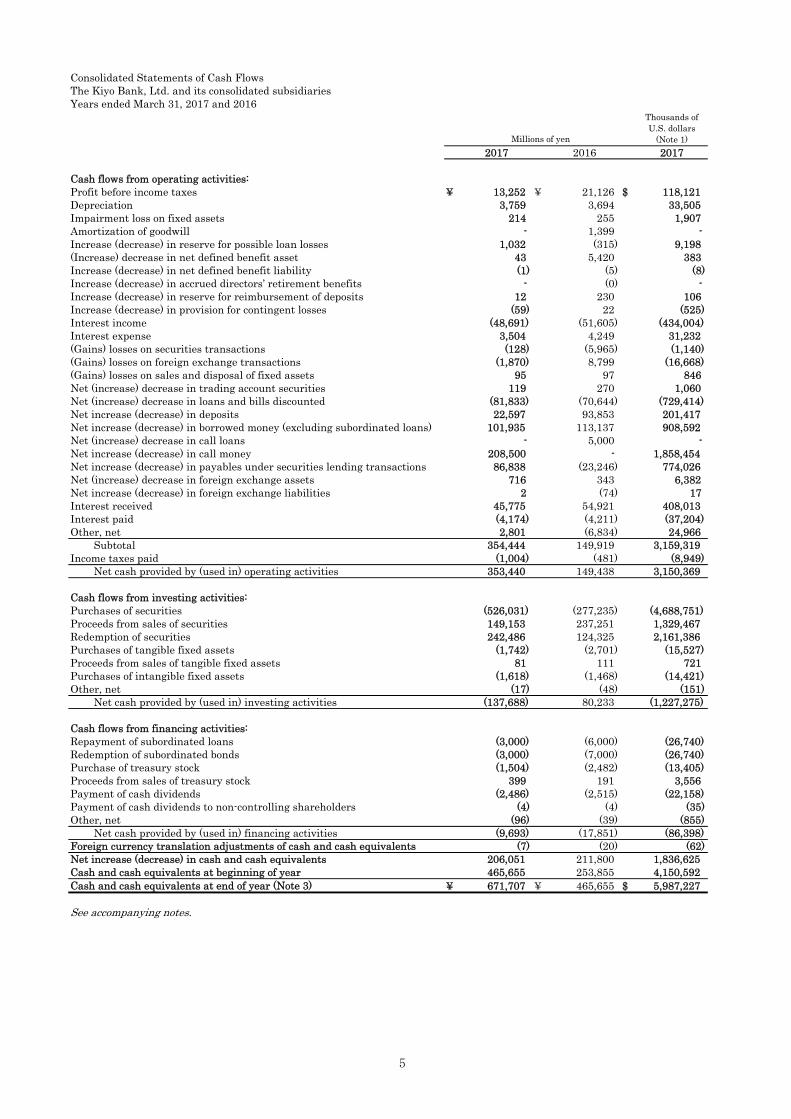
Cash flows from operating activities:Profit before income taxes ¥ 13,252 ¥ 21,126 $ 118,121Depreciation 3,759 3,694 33,505Impairment loss on fixed assets 214 255 1,907Amortization of goodwill - 1,399 - Increase (decrease) in reserve for possible loan losses 1,032 (315) 9,198(Increase) decrease in net defined benefit asset 43 5,420 383Increase (decrease) in net defined benefit liability (1) (5) (8)Increase (decrease) in accrued directors’ retirement benefits - (0) - Increase (decrease) in reserve for reimbursement of deposits 12 230 106Increase (decrease) in provision for contingent losses (59) 22 (525)Interest income (48,691) (51,605) (434,004)Interest expense 3,504 4,249 31,232(Gains) losses on securities transactions (128) (5,965) (1,140)(Gains) losses on foreign exchange transactions (1,870) 8,799 (16,668)(Gains) losses on sales and disposal of fixed assets 95 97 846Net (increase) decrease in trading account securities 119 270 1,060Net (increase) decrease in loans and bills discounted (81,833) (70,644) (729,414)Net increase (decrease) in deposits 22,597 93,853 201,417Net increase (decrease) in borrowed money (excluding subordinated loans) 101,935 113,137 908,592Net (increase) decrease in call loans - 5,000 - Net increase (decrease) in call money 208,500 - 1,858,454Net increase (decrease) in payables under securities lending transactions 86,838 (23,246) 774,026Net (increase) decrease in foreign exchange assets 716 343 6,382Net increase (decrease) in foreign exchange liabilities 2 (74) 17Interest received 45,775 54,921 408,013Interest paid (4,174) (4,211) (37,204)Other, net 2,801 (6,834) 24,966 Subtotal 354,444 149,919 3,159,319Income taxes paid (1,004) (481) (8,949) Net cash provided by (used in) operating activities 353,440 149,438 3,150,369
Cash flows from investing activities:Purchases of securities (526,031) (277,235) (4,688,751)Proceeds from sales of securities 149,153 237,251 1,329,467Redemption of securities 242,486 124,325 2,161,386Purchases of tangible fixed assets (1,742) (2,701) (15,527)Proceeds from sales of tangible fixed assets 81 111 721Purchases of intangible fixed assets (1,618) (1,468) (14,421)Other, net (17) (48) (151) Net cash provided by (used in) investing activities (137,688) 80,233 (1,227,275)
Cash flows from financing activities:Repayment of subordinated loans (3,000) (6,000) (26,740)Redemption of subordinated bonds (3,000) (7,000) (26,740)Purchase of treasury stock (1,504) (2,482) (13,405)Proceeds from sales of treasury stock 399 191 3,556Payment of cash dividends (2,486) (2,515) (22,158)Payment of cash dividends to non-controlling shareholders (4) (4) (35)Other, net (96) (39) (855) Net cash provided by (used in) financing activities (9,693) (17,851) (86,398)Foreign currency translation adjustments of cash and cash equivalents (7) (20) (62)Net increase (decrease) in cash and cash equivalents 206,051 211,800 1,836,625Cash and cash equivalents at beginning of year 465,655 253,855 4,150,592Cash and cash equivalents at end of year (Note 3) ¥ 671,707 ¥ 465,655 $ 5,987,227
See accompanying notes.
Millions of yen
Thousands ofU.S. dollars
(Note 1)
Consolidated Statements of Cash FlowsThe Kiyo Bank, Ltd. and its consolidated subsidiariesYears ended March 31, 2017 and 2016
─ 5 ─

Notes to Consolidated Financial Statements The Kiyo Bank, Ltd. and its consolidated subsidiaries Years ended March 31, 2017 and 2016 1. Basis of presenting consolidated financial statements
The Kiyo Bank, Ltd. (the “Bank”) and its consolidated subsidiaries (the “Group”) maintain their official accounting records in Japanese yen, in accordance with the provisions set forth in the Japanese Corporate Law and the Japanese Banking Law, in general conformity with the Japanese regulatory authorities and in conformity with accounting principles and practices generally accepted in Japan, which are different in certain respects from the application and disclosure requirements of International Financial Reporting Standards. The accompanying consolidated financial statements have been restructured and translated into English, with some expanded descriptions, from the consolidated financial statements of the Bank prepared in accordance with Japanese GAAP and filed with the appropriate Local Finance Bureau of the Ministry of Finance as required by the Financial Instruments and Exchange Law. Some supplementary information included in the statutory Japanese language consolidated financial statements, but not required for fair presentation, is not presented in the accompanying consolidated financial statements. In preparing these consolidated financial statements, certain reclassifications and rearrangements have been made in order to present them in a form which is more familiar to readers outside Japan.
Amounts of less than one million yen have been rounded down. As a result, the totals shown in the financial
statements (both in yen and U.S. dollars) do not necessarily agree with the sum of the individual amounts. The translations of the Japanese yen amounts into U.S. dollar amounts are included solely for the convenience of
the readers outside Japan, using the prevailing exchange rate at March 31, 2017, which was ¥112.19 to US $1.00. The translations should not be construed as representations that the Japanese yen amounts have been, could have been or could in the future be converted into U.S. dollars at this or any other rate of exchange. 2. Significant accounting policies (a) Consolidation — The consolidated financial statements include the accounts of the Bank and 6 subsidiaries for the years ended March 31, 2017 and 2016. All significant intercompany transactions and unrealized profits have been eliminated. In the elimination of investments in subsidiaries, the assets and liabilities of the subsidiaries, including the portion attributable to non-controlling interests, are evaluated using the fair value at the time the Bank acquired control of the respective subsidiary. (Unconsolidated company) There is one unconsolidated company. The company is excluded from the scope of consolidation because the results of the company’s operations have no material effect on the consolidated financial position and operating results of the Group in terms of total assets, net income (corresponding to the share), retained earnings (corresponding to the share) and accumulated other comprehensive income (corresponding to the share). The company is not accounted for by the equity method. (Affiliate) There is one affiliate. This company is excluded from the scope of application of the equity method because the results of the company’s operations have no material impact on the consolidated financial statements in terms of net income (corresponding to the share), retained earnings (corresponding to the share) and accumulated other comprehensive income (corresponding to the share). There is one company, of which the Bank owns the voting rights between 20% and 50% but which is not recognized as an affiliate, because it is held by unconsolidated subsidiary, which is engaged in investment business, for the purpose of incubating its investee, not for the purpose of controlling the company. The fiscal closing date of all the consolidated subsidiaries is March 31. (b) Trading account securities — Trading account securities are stated at fair market value. Gains and losses realized on the sale of such securities and unrealized gains and losses from market value fluctuations are recognized as gains and losses in the period of the change. Realized gains and losses on the sale of such securities are computed using the moving average cost. (c) Securities — The Bank and its consolidated subsidiaries classify securities as (1) debt securities intended to be held to maturity (“held-to-maturity debt securities”), (2) equity securities issued by subsidiaries and affiliated companies and (3) all other securities that are not classified in any of the above categories (“available-for-sale
─ 6 ─

securities”). Held-to-maturity debt securities are stated at amortized cost. Held-to-maturity debt securities with no available fair value are stated at amortized cost, net of the amount considered not collectible. In principle, available-for-sale securities are stated at fair value based on the market price as of the fiscal closing date. Available-for-sale securities for which it is extremely difficult to determine the fair value are stated at acquisition cost determined by the moving average method. Unrealized gains and unrealized losses on these securities are reported, net of applicable income taxes, as a separate component of shareholders’ equity. Realized gains and losses on the sale of such securities are computed using the moving average cost. (d) Derivatives and hedge accounting — Derivatives are stated at fair value, except when the derivatives are used for hedging purposes. If derivatives are used for hedging purposes and meet certain hedging criteria, recognition of gains and losses resulting from changes in fair value are deferred until the related losses and gains on the hedged items are recognized. The following hedge accounting is applied to derivatives: (Foreign exchange fluctuation risk hedge) To hedge foreign exchange fluctuation risk arising from foreign currency denominated assets and liabilities of the Bank, the Bank applies the deferral method in accordance with “Treatment of Accounting and Auditing Concerning Accounting for Foreign Currency Transactions in the Banking Industry” (JICPA Industry Audit Committee Report No. 25, July 29, 2002). Hedge effectiveness is assessed by ensuring the existence of the corresponding foreign currency positions as hedging instruments, such as currency swaps and foreign exchange swaps conducted to mitigate foreign currency exchange fluctuation risk arising from foreign currency denominated monetary receivables and payables, equivalent to foreign currency denominated monetary receivables and payables as hedged items. (Stock price fluctuation risk hedge) To hedge risk arising from changes in stock prices of certain available-for-sale securities held by the Bank, the Bank applies the fair value hedge accounting method and assesses the effectiveness of the relevant individual hedges. (e) Depreciation and amortization (Tangible fixed assets (excluding lease assets)) Depreciation of tangible fixed assets held by the Bank is generally computed by the declining balance method. However, buildings (excluding attached facilities) acquired on or after April 1, 1998 and facilities attached to buildings and structures acquired on or after April 1, 2016 are depreciated using the straight-line method. The useful life of tangible fixed assets ranges from 8 to 50 years for buildings and 5 to 20 years for equipment. Tangible fixed assets held by the consolidated subsidiaries are mainly depreciated using the declining balance method based on the estimated useful life of the asset. (Intangible fixed assets (excluding lease assets)) Intangible fixed assets are amortized by the straight-line method. Software developed or obtained for internal use is amortized by the straight-line method over an estimated useful life of 5 years. (Lease assets) Depreciation and amortization of lease assets, including both “Tangible fixed assets” and “Intangible fixed assets,” under leasing transactions that are not deemed to transfer ownership of the leased property to the lessee are computed by the straight-line method over the lease period with a residual value of zero. (f) Reserve for possible loan losses — Based on its own rules for self-assessment, the Bank makes provisions for possible loan losses. For loans to insolvent customers who are undergoing bankruptcy or other collection proceedings (“bankrupt borrowers”) or who are in a similar financial condition (“effectively bankrupt borrowers”), the reserve for possible loan losses is provided in the full amount of such loans, excluding the portion that is estimated to be recoverable due to any underlying collateral or guarantees. For the unsecured and unguaranteed portions of loans to customers not presently in the above circumstances but for whom there is a high probability of so becoming, the reserve for possible loan losses is provided for the estimated unrecoverable amounts determined after an evaluation of each customer’s overall financial condition. For other loans, the reserve for possible loan losses is provided based on the actual rate of loan losses in the past.
All loans are subject to asset assessment by the business related divisions based on the self-assessment standards
for assets. The assessment results are audited by the Asset Audit Department independent from the divisions concerned. Reserves for possible loan losses of the consolidated subsidiaries are provided for general claims in the amount deemed necessary based on the rate of losses in the past and for certain doubtful claims in the amount deemed uncollectible based on assessments of the respective claims. For claims against “bankrupt borrowers” and “effectively bankrupt borrowers,” the amount exceeding the estimated value of collateral and guarantees deemed uncollectible is deducted directly from those claims. At March 31, 2017 and 2016, the deducted amounts were ¥15,352 million
─ 7 ─

($136,839 thousand) and ¥17,740 million, respectively. (g) Accrued directors’ retirement benefits — On June 29, 2004, the Bank abolished the system for the payment of retirement allowances to retiring directors and auditors. Instead, a provision has been made for accrued retirement benefits of directors and auditors in an amount deemed necessary based on a formula stipulated in the internal regulations when the previous system was abolished. (h) Reserve for reimbursement of deposits — Provision is made for future losses from claims on dormant accounts based on historical refund records. (i) Provision for contingent losses — Provision is made for payment on loan-loss burden-sharing to credit guarantee corporations in an amount estimated to be paid in the future. (j) Accounting for employees’ severance and retirement benefits — In determining retirement benefit obligations, the estimated amount of retirement benefits is attributed to periods on a benefit formula basis.
Differences generated from changes in actuarial assumptions are charged or credited to income in an amount
allocated by the straight-line method over 9 years, which is shorter than the average remaining service period of the employees, beginning with the term following that when the differences are generated.
In calculating the net defined benefit liability and retirement benefit expenses, some consolidated subsidiaries have adopted a simplified method in which the amount required to be paid if all the employees retired voluntarily at the fiscal year end is regarded as retirement benefit obligations. (k) Foreign currency translation — Receivables and payables in foreign currencies are translated into Japanese yen at the year-end rates. (l) Income taxes — Income taxes comprise corporation, inhabitants and enterprise taxes. Deferred tax assets are recorded by the asset-liability approach based on loss carryforwards and the temporary differences between the financial statement bases and tax bases of assets and liabilities. (m) Finance leases — As lessor, revenues and costs of finance leases are recognized when lease payments are made. For finance lease transactions in which ownership of the lease assets is not transferred to the lessee and for which leasing contracts commenced prior to April 1, 2008, the theoretical value of the assets (after deduction of accumulated depreciation expenses) as of the previous term-end is used to determine the balance-sheet amounts of lease investment assets as of April 1, 2008 in accordance with stipulations stated in the “Guidance on Accounting Standard for Lease Transactions” (ASBJ Guidance No.16, issued on March 30, 2007). (n) Statements of cash flows — Cash and deposits with the Bank of Japan that are included in the consolidated balance sheets under cash and due from banks are considered to be cash and cash equivalents in the statements of cash flows. (o) Earnings per share — Basic earnings per share is computed by deducting dividends for preferred stock from profit attributable to owners of parent and dividing the balance by the weighted average number of shares of common stock, excluding treasury shares, outstanding during the reporting period. Diluted earnings per share reflect the potential dilution that could occur if preferred stock were converted into common stock. (p) Accounting changes (Adoption of “Practical Solution on a Change in Depreciation Method due to Tax Reform 2016”) The Bank and its consolidated subsidiaries have applied “Practical Solution on a Change in Depreciation Method due to Tax Reform 2016” (ASBJ Practical Issues Task Force (“PITF”) No. 32, June 17, 2016) from the fiscal year ended March 31, 2017 and changed the depreciation method for facilities attached to buildings and structures acquired on or after April 1, 2016 from the declining-balance method to the straight-line method. The impact on the consolidated financial statements for the year ended March 31, 2017 is immaterial. (q) Additional information (Adoption of “Revised Implementation Guidance on Recoverability of Deferred Tax Assets”) The Bank and its consolidated subsidiaries have applied “Revised Implementation Guidance on Recoverability of Deferred Tax Assets” (ASBJ Guidance No. 26, March 28, 2016) from the fiscal year ended March 31, 2017.
─ 8 ─

(Issuance of Treasury Stock to the Employees through the Trust) Since May 2015, the Bank has introduced “Trust-Type Employee Stock Incentive Plan” to fulfill welfare program for the Group employees and to improve business performances by granting incentives to the Group employees toward enhancement of medium and long-term corporate value and enhancing the employees’ awareness of participation in management. (1) Overview of transactions
The Plan is an incentive plan for all the employees that participate in either “Kiyo Financial Group Employee Stock Ownership Association” or “Kiyo Information System Employee Stock Ownership Association” (collectively “both Associations”).
The Bank has established “Kiyo Financial Group Employee Stock Ownership Association Trust” (hereinafter referred to as the “Trust”). The Trust will acquire in advance the Bank’s shares approximate to the number of shares both Associations may acquire over the next three and a half years. Subsequently, the Bank’s shares will be regularly transferred from the Trust to both Associations at market value. When the amounts corresponding to gains on sales of shares are accumulated within the Trust at the termination of the Trust, such amounts will be distributed to the qualified employees who satisfy the requirements as a beneficiary.
In addition, the Bank will assume the obligation to pay for the remaining loan balances pursuant to the
guarantee agreement since the Bank guarantees the loans for the Trust in purchasing the Bank’s shares. As such, when the amounts corresponding to losses on sales of shares due to decline in the Bank’s share value are accumulated in the Trust and such loan balances are remaining within the Trust upon termination of the Trust, the Bank will repay the remaining balance.
(2) The Bank’s shares remaining in the Trust
The Bank’s shares remaining in the Trust are recorded as “Treasury stock” under “Net assets” at the carrying amount (excluding incidental expenses) recorded at the Trust. The carrying amount and number of shares of treasury stock were ¥409 million ($3,645 thousand) and 224 thousand shares as of March 31, 2017 and ¥804 million and 440 thousand shares as of March 31, 2016, respectively.
(3) The carrying amount of the borrowed money recorded by applying the gross amount method as of March 31, 2017 and 2016 was ¥489 million ($4,358 thousand) and ¥832 million, respectively.
─ 9 ─

3. Cash and cash equivalents As of March 31, 2017 and 2016, the amounts of cash and cash equivalents at end of year in the consolidated statements of cash flows were in agreement with the amounts of cash and due from banks in the consolidated balance sheets. 4. Trading account securities and other securities Net valuation gains and losses from trading account securities for the years ended March 31, 2017 and 2016 amounted to ¥(2) million ($(17) thousand) and ¥(0) million, respectively. Investments in an unconsolidated subsidiary and an affiliate in the amounts of ¥166 million ($1,479 thousand) and ¥133 million are included in “Securities” as of March 31, 2017 and 2016, respectively. Among securities borrowed under unsecured securities lending agreements in which the Bank has the right to sell or re-pledge the securities without restrictions, the securities which were held without disposition as of March 31, 2017 and 2016 amounted to nil and ¥544 million, respectively. Fair values and unrealized gains and losses on held-to-maturity debt securities and available-for-sale securities with available fair values as of March 31, 2017 and 2016 were as follows: (a) Held-to-maturity debt securities Millions of yen 2017
Type Carrying amount Fair value Difference Held-to-maturity securities whose fair value exceeds the carrying amount: Bonds
Japanese government bonds ¥ 38,532 ¥ 38,589 ¥ 57
Subtotal ¥ 38,532 ¥ 38,589 ¥ 57
Held-to-maturity securities whose fair value does not exceed the carrying amount:
Bonds
Japanese government bonds ¥ 66,395 ¥ 65,880 ¥ (514)
Subtotal ¥ 66,395 ¥ 65,880 ¥ (514)
Total ¥ 104,927 ¥ 104,469 ¥ (457)
Millions of yen 2016 Type Carrying amount Fair value Difference Held-to-maturity securities whose fair value exceeds the carrying amount: Bonds
Japanese government bonds ¥ - ¥ - ¥ - Subtotal ¥ - ¥ - ¥ -
Held-to-maturity securities whose fair value does not exceed the carrying amount:
Bonds Japanese government bonds ¥ 131,585 ¥ 130,798 ¥ (787) Subtotal ¥ 131,585 ¥ 130,798 ¥ (787)
Total ¥ 131,585 ¥ 130,798 ¥ (787)
─ 10 ─

Thousands of U.S. dollars 2017
Type Carrying amount Fair value Difference Held-to-maturity securities whose fair value exceeds the carrying amount: Bonds
Japanese government bonds $ 343,453 $ 343,961 $ 508
Subtotal $ 343,453 $ 343,961 $ 508
Held-to-maturity securities whose fair value does not exceed the carrying amount:
Bonds
Japanese government bonds $ 591,808 $ 587,218 $ (4,581)
Subtotal $ 591,808 $ 587,218 $ (4,581)
Total $ 935,261 $ 931,179 $ (4,073)
(b) Available-for-sale securities with available fair values, including trading account securities and beneficial interests in trusts included in “Monetary claims bought,” were as follows: Millions of yen 2017
Type Carrying amount Acquisition cost Difference Available-for-sale securities whose carrying amount exceeds acquisition cost: Stocks ¥ 44,749 ¥ 23,191 ¥ 21,557
Bonds 555,220 543,933 11,286
Japanese government bonds 250,533 244,679 5,853
Local government bonds 142,319 139,830 2,488
Corporate bonds 162,367 159,423 2,944
Other 240,345 230,211 10,134
Foreign bonds 130,952 128,574 2,378
Other 109,393 101,637 7,756
Subtotal ¥ 840,315 ¥ 797,336 ¥ 42,978
Available-for-sale securities whose carrying amount does not exceed acquisition cost:
Stocks ¥ 1,985 ¥ 2,147 ¥ (162)
Bonds 192,309 195,113 (2,804)
Japanese government bonds 39,390 40,899 (1,508)
Local government bonds 108,437 109,381 (944)
Corporate bonds 44,481 44,832 (350)
Other 164,454 169,566 (5,112)
Foreign bonds 112,226 115,253 (3,027)
Other 52,228 54,312 (2,084)
Subtotal ¥ 358,749 ¥ 366,828 ¥ (8,078)
Total ¥ 1,199,064 ¥ 1,164,165 ¥ 34,899
─ 11 ─

Millions of yen 2016 Type Carrying amount Acquisition cost Difference Available-for-sale securities whose carrying amount exceeds acquisition cost: Stocks ¥ 29,814 ¥ 13,980 ¥ 15,834 Bonds 649,174 631,058 18,115
Japanese government bonds 301,330 291,309 10,020 Local government bonds 150,753 147,166 3,587 Corporate bonds 197,090 192,582 4,507
Other 253,622 241,350 12,272 Foreign bonds 187,171 181,565 5,606 Other 66,450 59,785 6,665
Subtotal ¥ 932,610 ¥ 886,389 ¥ 46,221 Available-for-sale securities whose carrying amount does not exceed acquisition cost:
Stocks ¥ 12,350 ¥ 13,875 ¥ (1,525) Bonds 26,531 26,624 (93) Japanese government bonds - - -
Local government bonds 22,181 22,258 (76) Corporate bonds 4,350 4,366 (16)
Other 67,780 71,095 (3,314) Foreign bonds 21,181 21,359 (178) Other 46,599 49,735 (3,136)
Subtotal ¥ 106,662 ¥ 111,596 ¥ (4,933) Total ¥ 1,039,273 ¥ 997,985 ¥ 41,287
Thousands of U.S. dollars 2017
Type Carrying amount Acquisition cost Difference Available-for-sale securities whose carrying amount exceeds acquisition cost: Stocks $ 398,867 $ 206,711 $ 192,147
Bonds 4,948,925 4,848,319 100,597
Japanese government bonds 2,233,113 2,180,934 52,170
Local government bonds 1,268,553 1,246,367 22,176
Corporate bonds 1,447,250 1,421,009 26,241
Other 2,142,303 2,051,974 90,328
Foreign bonds 1,167,234 1,146,037 21,196
Other 975,069 905,936 69,132
Subtotal $ 7,490,106 $ 7,107,014 $ 383,082
Available-for-sale securities whose carrying amount does not exceed acquisition cost:
Stocks $ 17,693 $ 19,137 $ (1,443)
Bonds 1,714,136 1,739,130 (24,993)
Japanese government bonds 351,100 364,551 (13,441)
Local government bonds 966,547 974,962 (8,414)
Corporate bonds 396,479 399,607 (3,119)
Other 1,465,852 1,511,418 (45,565)
Foreign bonds 1,000,320 1,027,301 (26,981)
Other 465,531 484,107 (18,575)
Subtotal $ 3,197,691 $ 3,269,703 $ (72,002)
Total $ 10,687,797 $ 10,376,726 $ 311,070
Available-for-sale securities with fair value that has declined significantly from the acquisition cost and for which there is deemed to be no likelihood of the fair value recovering to the acquisition cost level are recorded on the balance sheet at the fair value. In addition, the difference between acquisition cost and fair value is posted as a loss in the consolidated accounts for the fiscal year (this process is known as “impairment accounting”). The impairment loss recognized on corporate bonds for the years ended March 31, 2017 and 2016 was ¥1 million ($8 thousand) and ¥0 million, respectively.
─ 12 ─
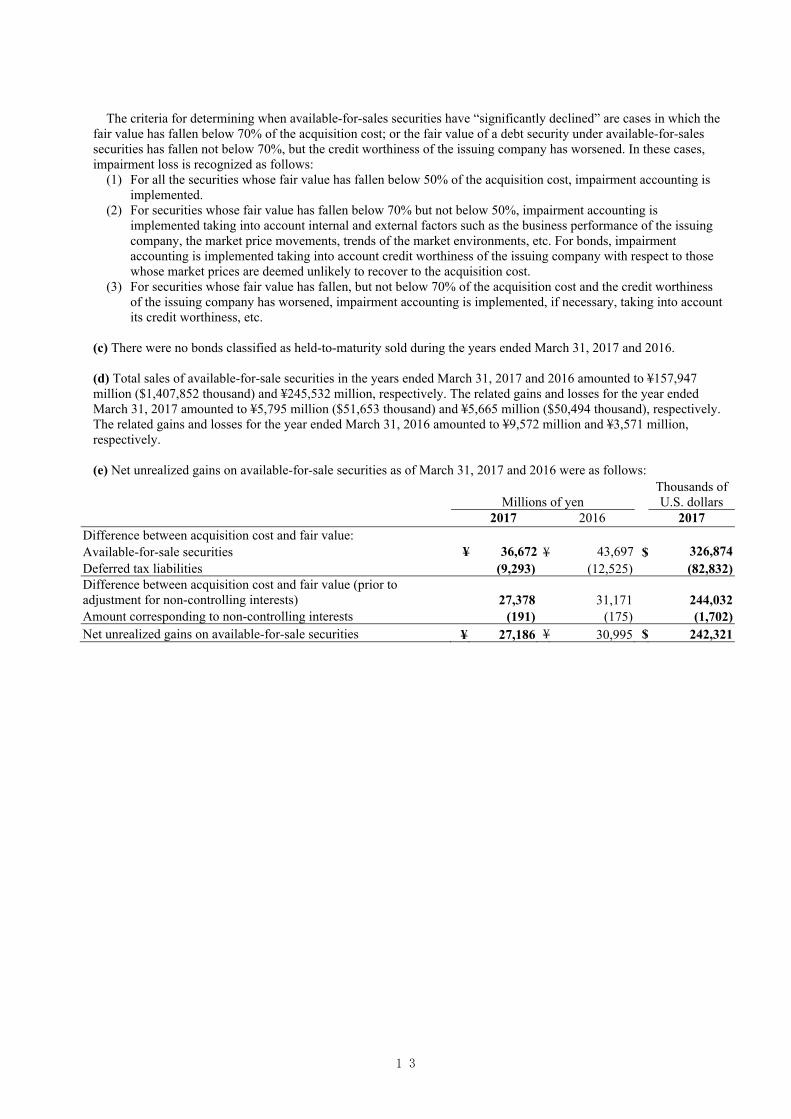
The criteria for determining when available-for-sales securities have “significantly declined” are cases in which the
fair value has fallen below 70% of the acquisition cost; or the fair value of a debt security under available-for-sales securities has fallen not below 70%, but the credit worthiness of the issuing company has worsened. In these cases, impairment loss is recognized as follows:
(1) For all the securities whose fair value has fallen below 50% of the acquisition cost, impairment accounting is implemented.
(2) For securities whose fair value has fallen below 70% but not below 50%, impairment accounting is implemented taking into account internal and external factors such as the business performance of the issuing company, the market price movements, trends of the market environments, etc. For bonds, impairment accounting is implemented taking into account credit worthiness of the issuing company with respect to those whose market prices are deemed unlikely to recover to the acquisition cost.
(3) For securities whose fair value has fallen, but not below 70% of the acquisition cost and the credit worthiness of the issuing company has worsened, impairment accounting is implemented, if necessary, taking into account its credit worthiness, etc.
(c) There were no bonds classified as held-to-maturity sold during the years ended March 31, 2017 and 2016. (d) Total sales of available-for-sale securities in the years ended March 31, 2017 and 2016 amounted to ¥157,947 million ($1,407,852 thousand) and ¥245,532 million, respectively. The related gains and losses for the year ended March 31, 2017 amounted to ¥5,795 million ($51,653 thousand) and ¥5,665 million ($50,494 thousand), respectively. The related gains and losses for the year ended March 31, 2016 amounted to ¥9,572 million and ¥3,571 million, respectively. (e) Net unrealized gains on available-for-sale securities as of March 31, 2017 and 2016 were as follows:
Millions of yen Thousands of U.S. dollars
2017 2016 2017 Difference between acquisition cost and fair value: Available-for-sale securities ¥ 36,672 ¥ 43,697 $
326,874
Deferred tax liabilities (9,293) (12,525) (82,832) Difference between acquisition cost and fair value (prior to adjustment for non-controlling interests) 27,378 31,171 244,032 Amount corresponding to non-controlling interests (191) (175) (1,702) Net unrealized gains on available-for-sale securities ¥ 27,186 ¥ 30,995 $ 242,321
─ 13 ─
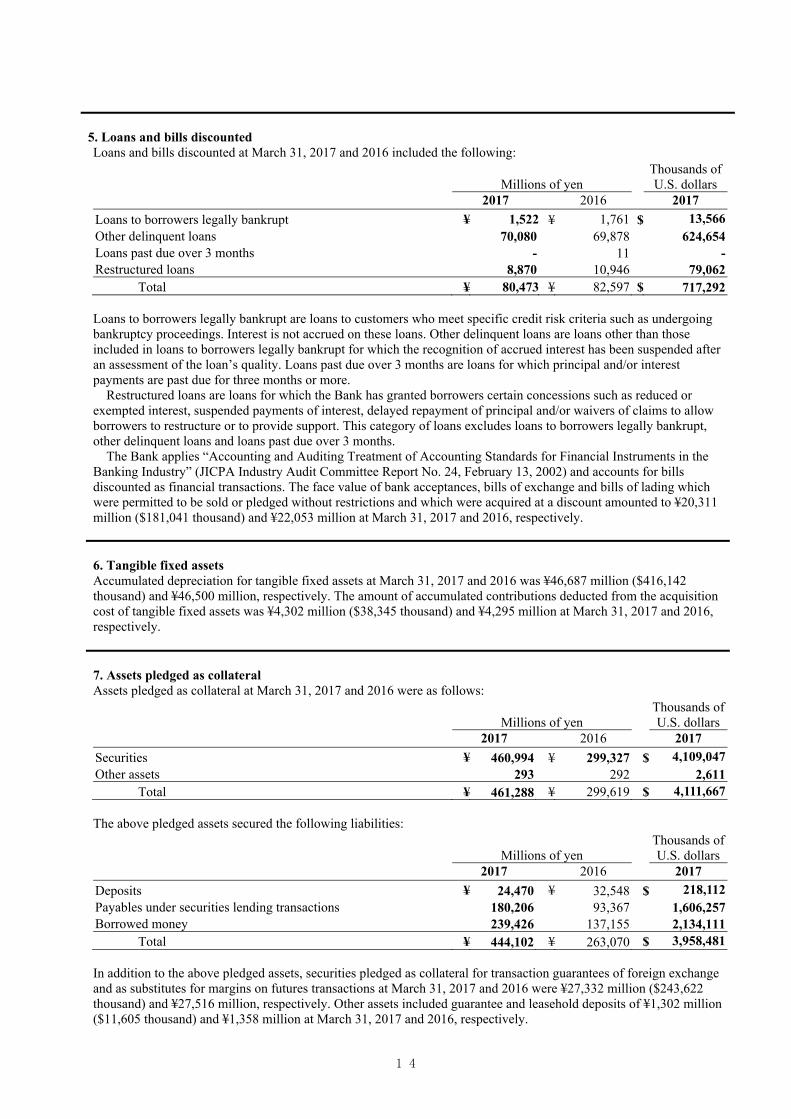
5. Loans and bills discounted Loans and bills discounted at March 31, 2017 and 2016 included the following:
Millions of yen Thousands of U.S. dollars
2017 2016 2017 Loans to borrowers legally bankrupt ¥ 1,522 ¥ 1,761 $ 13,566 Other delinquent loans 70,080 69,878 624,654 Loans past due over 3 months - 11 - Restructured loans 8,870 10,946 79,062
Total ¥ 80,473 ¥ 82,597 $ 717,292 Loans to borrowers legally bankrupt are loans to customers who meet specific credit risk criteria such as undergoing bankruptcy proceedings. Interest is not accrued on these loans. Other delinquent loans are loans other than those included in loans to borrowers legally bankrupt for which the recognition of accrued interest has been suspended after an assessment of the loan’s quality. Loans past due over 3 months are loans for which principal and/or interest payments are past due for three months or more.
Restructured loans are loans for which the Bank has granted borrowers certain concessions such as reduced or exempted interest, suspended payments of interest, delayed repayment of principal and/or waivers of claims to allow borrowers to restructure or to provide support. This category of loans excludes loans to borrowers legally bankrupt, other delinquent loans and loans past due over 3 months.
The Bank applies “Accounting and Auditing Treatment of Accounting Standards for Financial Instruments in the Banking Industry” (JICPA Industry Audit Committee Report No. 24, February 13, 2002) and accounts for bills discounted as financial transactions. The face value of bank acceptances, bills of exchange and bills of lading which were permitted to be sold or pledged without restrictions and which were acquired at a discount amounted to ¥20,311 million ($181,041 thousand) and ¥22,053 million at March 31, 2017 and 2016, respectively.
6. Tangible fixed assets Accumulated depreciation for tangible fixed assets at March 31, 2017 and 2016 was ¥46,687 million ($416,142 thousand) and ¥46,500 million, respectively. The amount of accumulated contributions deducted from the acquisition cost of tangible fixed assets was ¥4,302 million ($38,345 thousand) and ¥4,295 million at March 31, 2017 and 2016, respectively. 7. Assets pledged as collateral Assets pledged as collateral at March 31, 2017 and 2016 were as follows:
Millions of yen Thousands of U.S. dollars
2017 2016 2017 Securities ¥ 460,994 ¥ 299,327 $ 4,109,047 Other assets 293 292 2,611
Total ¥ 461,288 ¥ 299,619 $ 4,111,667 The above pledged assets secured the following liabilities:
Millions of yen Thousands of U.S. dollars
2017 2016 2017 Deposits ¥ 24,470 ¥ 32,548 $ 218,112 Payables under securities lending transactions 180,206 93,367 1,606,257 Borrowed money 239,426 137,155 2,134,111
Total ¥ 444,102 ¥ 263,070 $ 3,958,481 In addition to the above pledged assets, securities pledged as collateral for transaction guarantees of foreign exchange and as substitutes for margins on futures transactions at March 31, 2017 and 2016 were ¥27,332 million ($243,622 thousand) and ¥27,516 million, respectively. Other assets included guarantee and leasehold deposits of ¥1,302 million ($11,605 thousand) and ¥1,358 million at March 31, 2017 and 2016, respectively.
─ 14 ─

8. Deposits Deposits at March 31, 2017 and 2016 were as follows:
Millions of yen Thousands of U.S. dollars
2017 2016 2017 Liquid deposits ¥ 1,935,535 ¥ 1,818,101 $ 17,252,295 Fixed-term deposits 1,807,705 1,951,803 16,112,888 Other deposits 79,672 83,269 710,152 Negotiable certificates of deposit 118,766 65,907 1,058,614
Total ¥ 3,941,679 ¥ 3,919,081 $ 35,133,960 9. Borrowed money and lease obligations The weighted average interest rate on the term-end balance of borrowed money was 0.03%. Borrowed money consisted of loans from other financial institutions. As of March 31, 2017 and 2016, subordinated loans in the amount of ¥5,000 million ($44,567 thousand) and ¥8,000 million were included in borrowed money, respectively. Annual maturities of borrowed money and lease obligations as of March 31, 2017 were as follows:
Borrowed money Lease obligations
Years ending March 31 Millions of
yen Thousands of U.S. dollars
Millions of yen
Thousands of U.S. dollars
2018 ¥ 239,602 $ 2,135,680 ¥ 132 $ 1,176 2019 628 5,597 131 1,167 2020 100 891 126 1,123 2021 60 534 122 1,087 2022 20 178 113 1,007 2023 and thereafter 5,000 44,567 154 1,372
Total ¥ 245,410 $ 2,187,449 ¥ 780 $ 6,952
10. Bonds As of March 31, 2017, the Bank had issued unsecured subordinated bonds as follows:
Issued Due Rate Millions of yen Thousands of U.S. dollars
December 2013 December 2023 0.74% ¥ 10,000 $ 89,134 Total - - ¥ 10,000 $ 89,134
─ 15 ─

11. Employees’ severance and retirement benefits (a) Overview of the retirement benefit plans adopted by the Bank and its consolidated subsidiaries The Bank has defined benefit pension plans consisting of a corporate pension plan and a lump-sum payment plan. In addition, the Bank has set up a retirement benefit trust.
A consolidated subsidiary has adopted a defined contribution pension plan and participated in general
establishment type welfare pension funds and it is accounted for in the same manner as the defined contribution plan since the amount of plan assets corresponding to its contribution cannot be reasonably determined.
Other consolidated subsidiaries have adopted lump-sum payment plans, and net defined benefit liability and
severance and retirement benefit expenses are calculated using a simplified method. (b) Defined benefit plans, including the plans to which a simplified method is applied
1. The changes in projected benefit obligation for the years ended March 31, 2017 and 2016 were as follows:
Millions of yen Thousands of U.S. dollars
2017 2016 2017
Balance at beginning of year ¥ 31,844 ¥ 28,303 $ 283,839
Service cost 1,124 916 10,018
Interest cost 108 341 962
Actuarial differences 50 3,673 445
Benefits paid (1,690) (1,390) (15,063)
Balance at end of year ¥ 31,437 ¥ 31,844 $ 280,212
2. The changes in plan assets for the years ended March 31, 2017 and 2016 were as follows:
Millions of yen Thousands of U.S. dollars
2017 2016 2017
Balance at beginning of year ¥ 45,533 ¥ 47,406 $ 405,856
Expected return on plan assets 388 278 3,458
Actuarial differences (225) (768) (2,005)
Benefits paid (1,511) (1,383) (13,468)
Balance at end of year ¥ 44,185 ¥ 45,533 $ 393,840
─ 16 ─

3. Reconciliation between the net defined benefit liability recorded in the consolidated balance sheet and the
balances of defined benefit obligation and plan assets
Millions of yen Thousands of U.S. dollars
2017 2016 2017
Funded benefit obligation ¥ 31,416 ¥ 31,822 $ 280,024 Plan assets (44,185) (45,533) (393,840)
(12,769) (13,710) (113,815)Unfunded benefit obligation 20 22 178
Net liability (asset) ¥ (12,748) ¥ (13,688) $ (113,628)
Millions of yen
Thousands of U.S. dollars
2017 2016 2017
Net defined benefit liability ¥ 20 ¥ 22 $ 178 Net defined benefit asset (12,769) (13,710) (113,815)
Net liability (asset) ¥ (12,748) ¥ (13,688) $ (113,628)
4. The components of severance and retirement benefit expenses for the years ended March 31, 2017 and 2016
were as follows:
Millions of yen Thousands of U.S. dollars
2017 2016 2017
Service cost ¥ 1,124 ¥ 916 $ 10,018
Interest cost 108 341 962 Expected return on plan assets (388) (278) (3,458) Recognized actuarial differences (622) (923) (5,544)
Other 23 36 205
Severance and retirement benefit expenses ¥ 244 ¥ 93 $ 2,174
5. The components of adjustments for retirement benefits (before tax effect) for the years ended March 31, 2017 and 2016
Millions of yen
Thousands of U.S. dollars
2017 2016 2017
Actuarial differences ¥ (898) ¥ (5,364) $ (8,004)
Total ¥ (898) ¥ (5,364) $ (8,004)
6. The components of accumulated adjustments for retirement benefits (before tax effect) as of March 31, 2017
and 2016
Millions of yen Thousands of U.S. dollars
2017 2016 2017
Unrecognized actuarial differences ¥ 7,380 ¥ 8,278 $ 65,781
Total ¥ 7,380 ¥ 8,278 $ 65,781
─ 17 ─
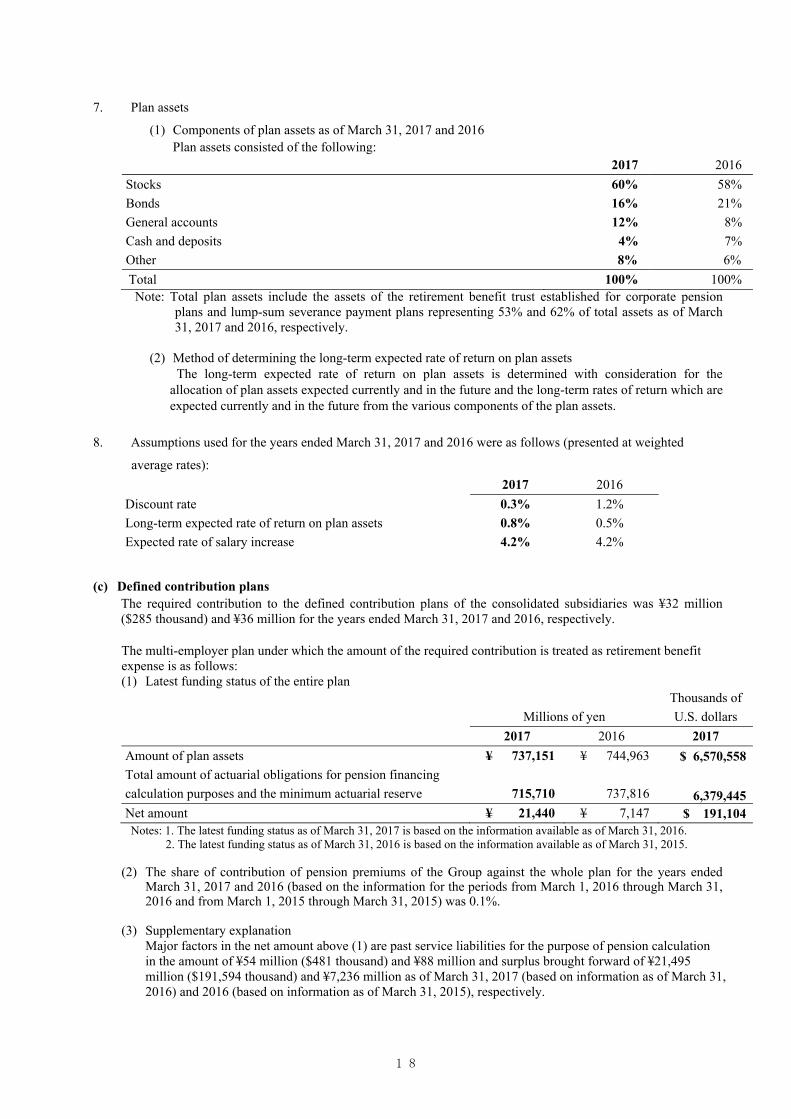
7. Plan assets
(1) Components of plan assets as of March 31, 2017 and 2016 Plan assets consisted of the following:
2017 2016 Stocks 60% 58% Bonds 16% 21% General accounts 12% 8% Cash and deposits 4% 7% Other 8% 6% Total 100% 100% Note: Total plan assets include the assets of the retirement benefit trust established for corporate pension
plans and lump-sum severance payment plans representing 53% and 62% of total assets as of March 31, 2017 and 2016, respectively.
(2) Method of determining the long-term expected rate of return on plan assets
The long-term expected rate of return on plan assets is determined with consideration for the allocation of plan assets expected currently and in the future and the long-term rates of return which are expected currently and in the future from the various components of the plan assets.
8. Assumptions used for the years ended March 31, 2017 and 2016 were as follows (presented at weighted
average rates): 2017 2016 Discount rate 0.3% 1.2% Long-term expected rate of return on plan assets 0.8% 0.5% Expected rate of salary increase 4.2% 4.2%
(c) Defined contribution plans The required contribution to the defined contribution plans of the consolidated subsidiaries was ¥32 million
($285 thousand) and ¥36 million for the years ended March 31, 2017 and 2016, respectively. The multi-employer plan under which the amount of the required contribution is treated as retirement benefit expense is as follows: (1) Latest funding status of the entire plan
Millions of yen Thousands of U.S. dollars
2017 2016 2017
Amount of plan assets ¥ 737,151 ¥ 744,963 $ 6,570,558
Total amount of actuarial obligations for pension financing calculation purposes and the minimum actuarial reserve
715,710
737,816 6,379,445
Net amount ¥ 21,440 ¥ 7,147 $ 191,104 Notes: 1. The latest funding status as of March 31, 2017 is based on the information available as of March 31, 2016.
2. The latest funding status as of March 31, 2016 is based on the information available as of March 31, 2015.
(2) The share of contribution of pension premiums of the Group against the whole plan for the years ended March 31, 2017 and 2016 (based on the information for the periods from March 1, 2016 through March 31, 2016 and from March 1, 2015 through March 31, 2015) was 0.1%.
(3) Supplementary explanation Major factors in the net amount above (1) are past service liabilities for the purpose of pension calculation in the amount of ¥54 million ($481 thousand) and ¥88 million and surplus brought forward of ¥21,495 million ($191,594 thousand) and ¥7,236 million as of March 31, 2017 (based on information as of March 31, 2016) and 2016 (based on information as of March 31, 2015), respectively.
─ 18 ─

12. Guarantee obligations for bonds Guarantee obligations for privately placed bonds (Article 2, Clause 3 of the Financial Instruments and Exchange Law) stood at ¥17,954 million ($160,032 thousand) and ¥11,384 million as of March 31, 2017 and 2016, respectively. 13. Shareholders’ equity (a) Capital stock The number of shares of the Bank’s capital stock as of March 31, 2017 and 2016 was as follows:
Thousands of shares 2017 2016
Authorized: Common 120,000 120,000 Total 120,000 120,000
(b) Retained earnings Japanese banks are subject to the Corporate Law of Japan (the “Law”) and the Banking Law. The Law requires that all shares of common stock be recorded with no par value and that at least 50% of the issue price of new shares be recorded as common stock and the remaining net proceeds as additional paid-in capital, which is included in capital surplus. The Law permits Japanese companies, upon approval of their Boards of Directors, to issue shares to existing shareholders without limitation. Such issuance of shares generally does not give rise to changes within the shareholders’ accounts.
The Law requires that an amount equal to 10% of dividends be appropriated as a legal reserve (a component of retained earnings) or as additional paid-in capital (a component of capital surplus), depending on the equity account charged upon the payment of such dividends, until the total of aggregate amount of legal reserve and additional paid-in capital equals 25% of the capital stock. Under the Law, the total amount of additional paid-in capital and legal reserve may be reserved without limitation. The Law also provides that capital stock, legal reserve, additional paid-in capital, other capital surplus and retained earnings can be transferred among the accounts under certain conditions upon resolution of the shareholders.
The Law allows Japanese companies to repurchase treasury stock and dispose of such treasury stock by resolution
of the Board of Directors. The repurchased amount of treasury stock cannot exceed the amount available for future dividends plus the amount of stated capital, additional paid-in capital or legal reserve to be reduced in cases in which a reduction was resolved at the shareholders’ meeting.
In addition to requiring an appropriation for a legal reserve in connection with cash payments, the Law imposes
certain limitations on the amount of retained earnings available for dividends. Dividends are approved by the shareholders at a meeting held subsequent to the fiscal year for which the dividends
are applicable. Semiannual interim dividends may also be paid upon resolution of the Board of Directors, subject to certain limitations imposed by the Law.
─ 19 ─
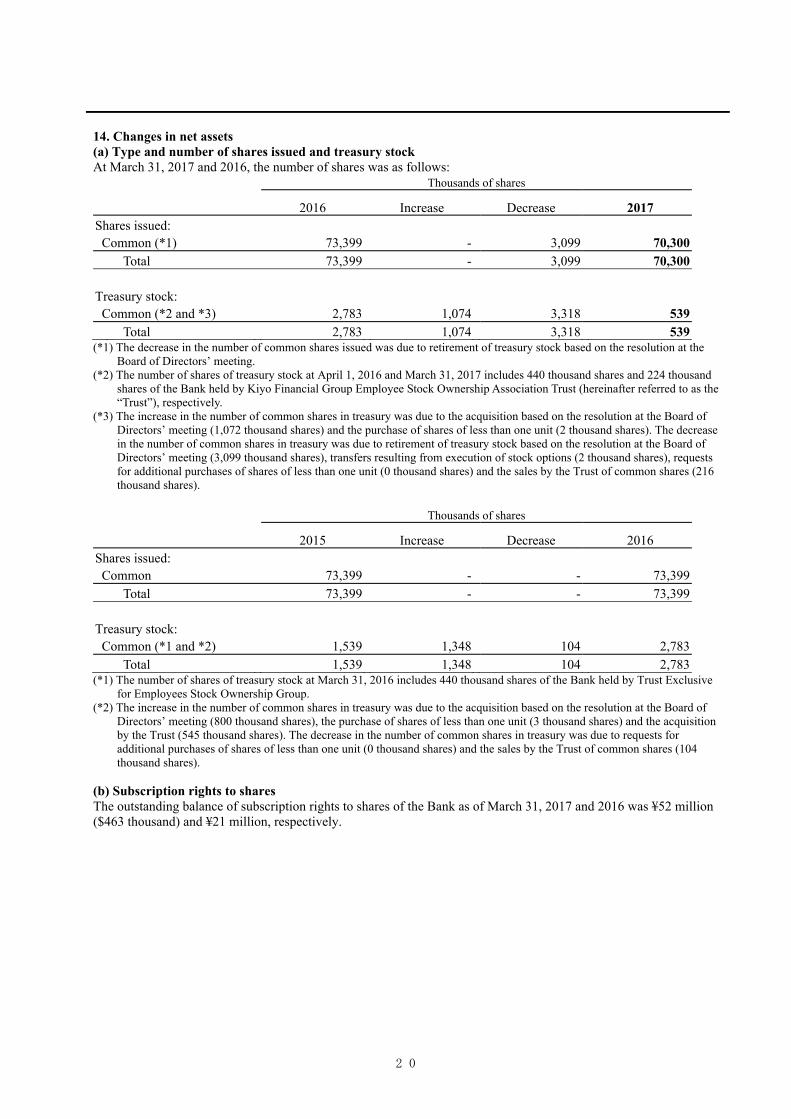
14. Changes in net assets (a) Type and number of shares issued and treasury stock At March 31, 2017 and 2016, the number of shares was as follows:
Thousands of shares
2016 Increase Decrease 2017 Shares issued:
Common (*1) 73,399 - 3,099 70,300 Total 73,399 - 3,099 70,300
Treasury stock:
Common (*2 and *3) 2,783 1,074 3,318 539 Total 2,783 1,074 3,318 539
(*1) The decrease in the number of common shares issued was due to retirement of treasury stock based on the resolution at the Board of Directors’ meeting.
(*2) The number of shares of treasury stock at April 1, 2016 and March 31, 2017 includes 440 thousand shares and 224 thousand shares of the Bank held by Kiyo Financial Group Employee Stock Ownership Association Trust (hereinafter referred to as the “Trust”), respectively.
(*3) The increase in the number of common shares in treasury was due to the acquisition based on the resolution at the Board of Directors’ meeting (1,072 thousand shares) and the purchase of shares of less than one unit (2 thousand shares). The decrease in the number of common shares in treasury was due to retirement of treasury stock based on the resolution at the Board of Directors’ meeting (3,099 thousand shares), transfers resulting from execution of stock options (2 thousand shares), requests for additional purchases of shares of less than one unit (0 thousand shares) and the sales by the Trust of common shares (216 thousand shares).
Thousands of shares
2015 Increase Decrease 2016 Shares issued:
Common 73,399 - - 73,399 Total 73,399 - - 73,399
Treasury stock:
Common (*1 and *2) 1,539 1,348 104 2,783 Total 1,539 1,348 104 2,783
(*1) The number of shares of treasury stock at March 31, 2016 includes 440 thousand shares of the Bank held by Trust Exclusive for Employees Stock Ownership Group.
(*2) The increase in the number of common shares in treasury was due to the acquisition based on the resolution at the Board of Directors’ meeting (800 thousand shares), the purchase of shares of less than one unit (3 thousand shares) and the acquisition by the Trust (545 thousand shares). The decrease in the number of common shares in treasury was due to requests for additional purchases of shares of less than one unit (0 thousand shares) and the sales by the Trust of common shares (104 thousand shares).
(b) Subscription rights to shares The outstanding balance of subscription rights to shares of the Bank as of March 31, 2017 and 2016 was ¥52 million ($463 thousand) and ¥21 million, respectively.
─ 20 ─
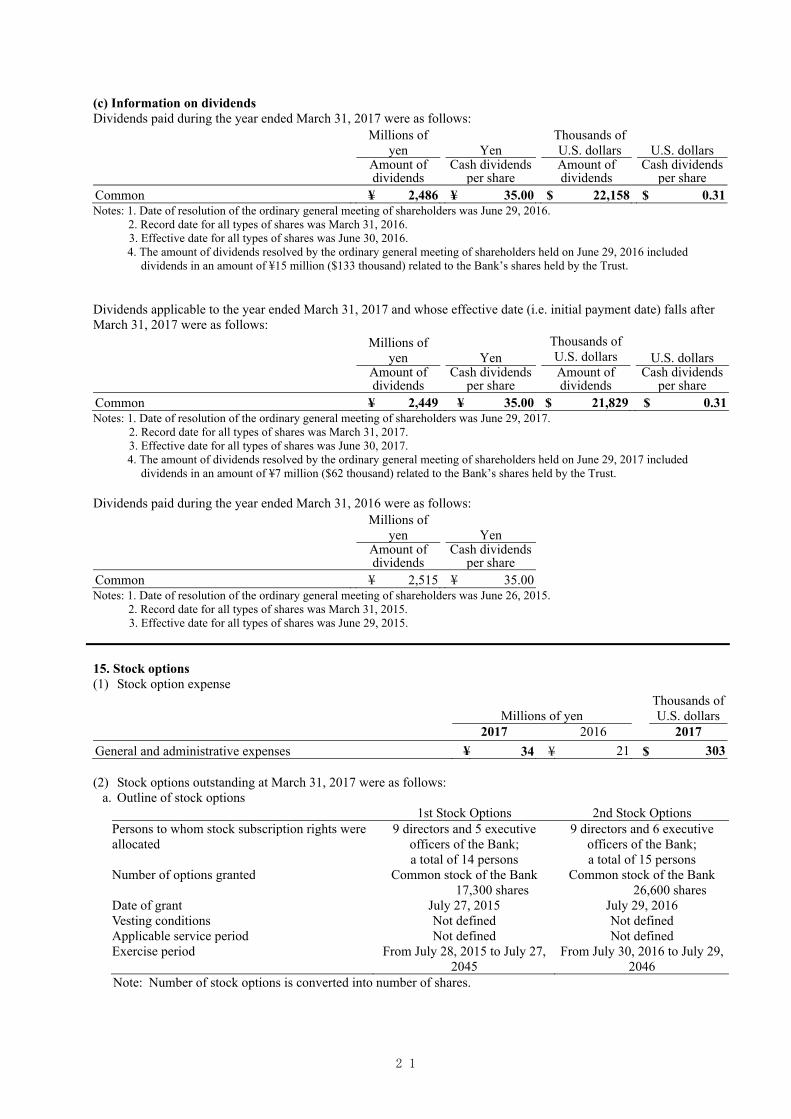
(c) Information on dividends Dividends paid during the year ended March 31, 2017 were as follows:
Millions of yen Yen
Thousands of U.S. dollars U.S. dollars
Amount of dividends
Cash dividends per share
Amount of dividends
Cash dividends per share
Common ¥ 2,486 ¥ 35.00 $ 22,158 $ 0.31 Notes: 1. Date of resolution of the ordinary general meeting of shareholders was June 29, 2016.
2. Record date for all types of shares was March 31, 2016. 3. Effective date for all types of shares was June 30, 2016. 4. The amount of dividends resolved by the ordinary general meeting of shareholders held on June 29, 2016 included
dividends in an amount of ¥15 million ($133 thousand) related to the Bank’s shares held by the Trust.
Dividends applicable to the year ended March 31, 2017 and whose effective date (i.e. initial payment date) falls after March 31, 2017 were as follows:
Millions of yen Yen
Thousands of U.S. dollars
U.S. dollars
Amount of dividends
Cash dividends per share
Amount of dividends
Cash dividends per share
Common ¥ 2,449 ¥ 35.00 $ 21,829 $ 0.31 Notes: 1. Date of resolution of the ordinary general meeting of shareholders was June 29, 2017.
2. Record date for all types of shares was March 31, 2017. 3. Effective date for all types of shares was June 30, 2017. 4. The amount of dividends resolved by the ordinary general meeting of shareholders held on June 29, 2017 included
dividends in an amount of ¥7 million ($62 thousand) related to the Bank’s shares held by the Trust.
Dividends paid during the year ended March 31, 2016 were as follows:
Millions of yen Yen
Amount of dividends
Cash dividends per share
Common ¥ 2,515 ¥ 35.00 Notes: 1. Date of resolution of the ordinary general meeting of shareholders was June 26, 2015.
2. Record date for all types of shares was March 31, 2015. 3. Effective date for all types of shares was June 29, 2015.
15. Stock options (1) Stock option expense
Millions of yen Thousands of U.S. dollars
2017 2016 2017 General and administrative expenses ¥ 34 ¥ 21 $ 303 (2) Stock options outstanding at March 31, 2017 were as follows:
a. Outline of stock options 1st Stock Options 2nd Stock Options Persons to whom stock subscription rights were allocated
9 directors and 5 executive officers of the Bank; a total of 14 persons
9 directors and 6 executive officers of the Bank; a total of 15 persons
Number of options granted Common stock of the Bank 17,300 shares
Common stock of the Bank 26,600 shares
Date of grant July 27, 2015 July 29, 2016 Vesting conditions Not defined Not defined Applicable service period Not defined Not defined Exercise period From July 28, 2015 to July 27,
2045 From July 30, 2016 to July 29,
2046 Note: Number of stock options is converted into number of shares.
─ 21 ─

b. Stock option activity
The following table summarizes the movement of stock options outstanding for the year ended March 31, 2017, in which the number of stock options is converted into the number of shares. (i) Number of stock options Number of shares 1st Stock Options 2nd Stock Options Non-vested: Outstanding as of March 31, 2016 - - Granted - 26,600 Forfeited - - Vested - 26,600 Outstanding as of March 31, 2017 - -Vested: Outstanding as of March 31, 2016 17,300 - Vested - 26,600 Exercised 2,500 - Forfeited - - Outstanding as of March 31, 2017 14,800 26,600
(ii) Price information
Yen 1st Stock Options 2nd Stock Options Exercise price ¥ 1 ¥ 1Average stock price at exercise 1,293 -Fair value at date of grant 1,678 1,382
U.S. Dollars 1st Stock Options 2nd Stock Options Exercise price $ 0.00 $ 0.00Average stock price at exercise 11.52 -Fair value at date of grant 14.95 12.31 Note: Above information is described after converting into per share data.
(3) Estimation method for fair values of stock options granted The 2nd subscription rights to shares granted during the year ended March 31, 2017 were valued using the Black-Scholes option pricing model with the following assumptions:
2nd Stock Options Volatility of stock price (*1) 32.588%Expected remaining service period (*2) 3.7 yearsExpected dividend (*3) ¥35 ($0.31) per shareRisk-free interest rate (*4) (0.359)%
(*1) Stock price volatility is computed based on actual stock prices during the period corresponding to the expected remaining service period (from November 16, 2012 to July 29, 2016). The Bank absorbed Kiyo Holdings, Inc. (hereinafter referred to as “Kiyo Holdings” on October 1, 2013 and allotted one share of common stock of the Bank for 10 shares of common stock of Kiyo Holdings. Accordingly, actual stock price prior to the merger is computed by regarding the stock price per 10 shares of common stock of Kiyo Holdings as the stock price per one share of common stock of the Bank. (*2) Expected remaining service period is estimated by the method of averaging the difference between the average retirement age and current age of each incumbent grantee. (*3) Expected dividend is based on actual dividend paid per common stock for the year ended March 31, 2016. (*4) Risk-free interest rate refers to the yield of government bonds for the period corresponding to the expected remaining service period.
(4) Estimation method for number of stock options vested The Bank uses the method to reflect the actual forfeited options, since it is difficult to reasonably estimate the number of stock options to be forfeited in the future.
─ 22 ─
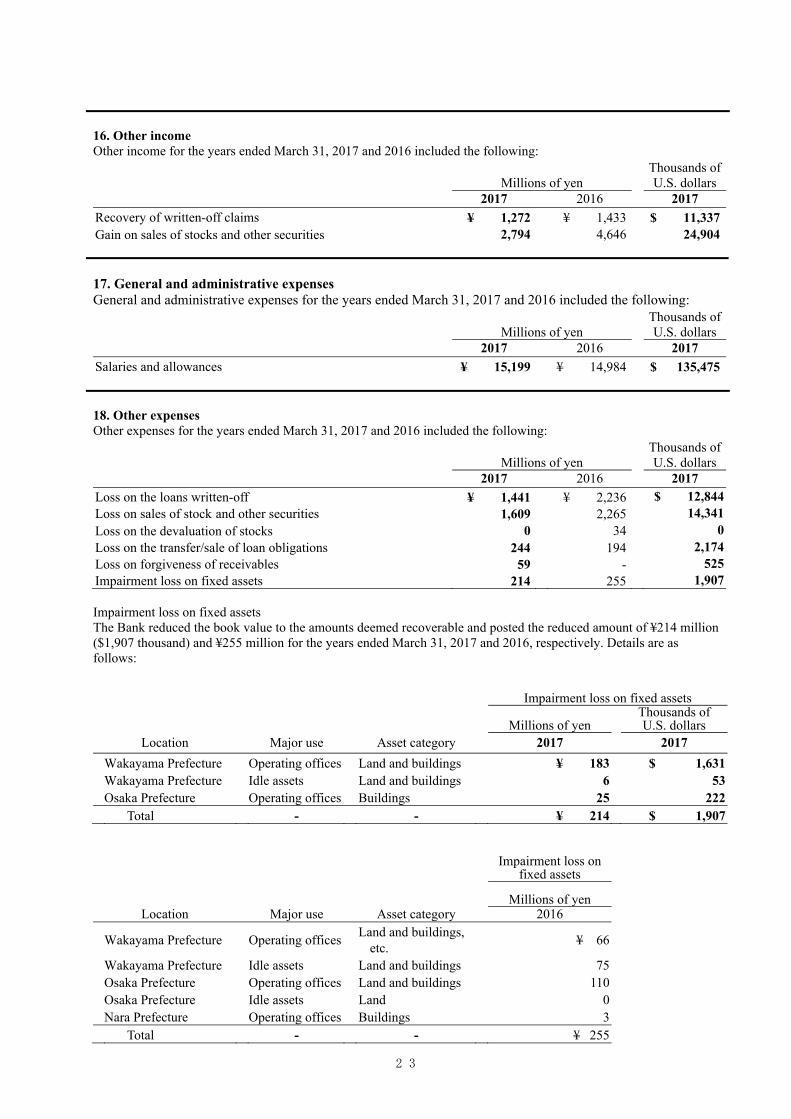
16. Other income Other income for the years ended March 31, 2017 and 2016 included the following:
Millions of yen Thousands of U.S. dollars
2017 2016 2017 Recovery of written-off claims ¥ 1,272 ¥ 1,433 $ 11,337 Gain on sales of stocks and other securities 2,794 4,646 24,904 17. General and administrative expenses General and administrative expenses for the years ended March 31, 2017 and 2016 included the following:
Millions of yen Thousands of U.S. dollars
2017 2016 2017 Salaries and allowances ¥ 15,199 ¥ 14,984 $ 135,475 18. Other expenses Other expenses for the years ended March 31, 2017 and 2016 included the following:
Millions of yen Thousands of U.S. dollars
2017 2016 2017 Loss on the loans written-off ¥ 1,441 ¥ 2,236 $ 12,844 Loss on sales of stock and other securities 1,609 2,265 14,341 Loss on the devaluation of stocks 0 34 0 Loss on the transfer/sale of loan obligations 244 194 2,174 Loss on forgiveness of receivables 59 - 525 Impairment loss on fixed assets 214 255 1,907 Impairment loss on fixed assets The Bank reduced the book value to the amounts deemed recoverable and posted the reduced amount of ¥214 million ($1,907 thousand) and ¥255 million for the years ended March 31, 2017 and 2016, respectively. Details are as follows:
Impairment loss on fixed assets
Millions of yen Thousands of U.S. dollars
Location Major use Asset category 2017 2017
Wakayama Prefecture Operating offices Land and buildings ¥ 183 $ 1,631 Wakayama Prefecture Idle assets Land and buildings 6 53 Osaka Prefecture Operating offices Buildings 25 222
Total - - ¥ 214 $ 1,907
Impairment loss on
fixed assets
Millions of yen Location Major use Asset category 2016
Wakayama Prefecture Operating offices Land and buildings, etc. ¥ 66
Wakayama Prefecture Idle assets Land and buildings 75 Osaka Prefecture Operating offices Land and buildings 110 Osaka Prefecture Idle assets Land 0 Nara Prefecture Operating offices Buildings 3
Total - - ¥ 255
─ 23 ─

With respect to the calculation of impairment loss on fixed assets, the minimum operational unit recognized for management accounting purposes by the Bank is the single bank branch. However, where a number of branches operate as a group at the managerial level, the accounting unit is the group rather than the individual branch. Each unit of idle assets (one “unit” is defined as one plot of land or one building) is treated as a separate and individual unit for accounting purposes. Because the head office, administration center and Bank provided housing and dormitories for the staff of the Bank do not independently generate any cash flows, they are treated as assets held in common by the Bank for accounting purposes. With respect to the consolidated subsidiaries, in principle, each company is treated as a separate and individual unit for impairment accounting purposes.
In calculating impairment loss on fixed assets for the reporting period, the amount deemed recoverable, i.e., the net proceeds from sale, was estimated by deducting the cost of disposal from the real estate appraisal value based on official appraisal standards. For immaterial assets, the recoverable value is determined by deducting the estimated cost of disposal from the appraisal value based on the roadside land prices, etc.
19. Income taxes The Bank is subject to a number of taxes based on income, which, in the aggregate, indicate a statutory rate in Japan of approximately 30.6% and 32.8% for the years ended March 31, 2017 and 2016, respectively. The table below summarizes the significant differences between the statutory tax rate and the Bank’s effective tax rate for financial statement purposes for the years ended March 31, 2017 and 2016.
2017 2016 Statutory tax rate 30.6% 32.8% Adjustments:
Change in valuation allowance (13.8) (17.1) Amortization of goodwill - 2.1 Reduction of deferred tax assets due to tax rate changes - 1.5 Dividend income that is not taxable for income tax purposes (2.6) (1.1) Other 1.6 0.5
Effective income tax rate 15.8% 18.7% Significant components of deferred tax assets and liabilities at March 31, 2017 and 2016 were as follows:
Millions of yen Thousands of U.S. dollars
2017 2016 2017 Deferred tax assets:
Nondeductible reserve for possible loan losses ¥ 8,938 ¥ 10,415 $ 79,668 Write-down of securities 2,394 2,822 21,338 Operating loss carryforwards 57 39 508 Other 4,576 4,902 40,787
Subtotal 15,967 18,179 142,321 Valuation allowance (9,453) (11,833) (84,258) Deferred tax assets 6,513 6,345 58,053 Deferred tax liabilities:
Net unrealized gains on available-for-sale securities (9,298) (12,597) (82,877) Net defined benefit asset (911) (206) (8,120) Gain on retirement benefit trust (440) (440) (3,921) Other (980) (1,008) (8,735)
Deferred tax liabilities (11,630) (14,253) (103,663) Net deferred tax assets ¥ (5,117) ¥ (7,908) $ (45,610) Net amounts recorded in the consolidated balance sheets after offsetting by each taxable entity at March 31, 2017 and 2016 were as follows:
Millions of yen Thousands of U.S. dollars
2017 2016 2017 Deferred tax assets ¥ 777 ¥ 937 $ 6,925 Deferred tax liabilities 5,895 8,845 52,544
─ 24 ─

20. Other comprehensive income (loss) Amounts reclassified to profit in the current period that were recognized in other comprehensive income (loss) in the current or previous periods and the tax effects for each component of other comprehensive income (loss) were as follows:
Millions of yen Thousands of U.S. dollars
2017 2016 2017 Net unrealized gains (losses) on available-for-sale securities:
Increase during the year ¥ (6,265) ¥ (6,782) $ (55,842) Reclassification adjustments (759) (6,714) (6,765) Subtotal before tax (7,024) (13,497) (62,608) Tax benefit (expense) 3,231 3,812 28,799 Net unrealized gains (losses) on available-for-sale
securities (3,792) (9,685) (33,799)
Net deferred gains (losses) on hedging instruments: Decrease during the year (67) (28) (597) Reclassification adjustments 0 631 0 Subtotal before tax (67) 603 (597) Tax benefit (expense) 20 (193) 178 Net deferred gains (losses) on hedging instruments (46) 410 (410) Adjustments for retirement benefits: Increase during the year (276) (4,441) (2,460) Reclassification adjustments (622) (923) (5,544) Subtotal before tax (898) (5,364) (8,004) Tax benefit (expense) 273 1,853 2,433 Adjustments for retirement benefits (624) (3,511) (5,561) Total other comprehensive income (loss) ¥ (4,464) ¥ (12,786) $ (39,789)
─ 25 ─

21. Per share information
Yen U.S. dollars 2017 2016 2017
Net assets per share ¥ 3,076.28 ¥ 2,997.11 $ 27.42 Basic earnings per share 157.77 239.62 1.40 Diluted earnings per share 157.70 239.57 1.40 (Note 1) The calculation of net assets per share as of March 31, 2017 and 2016 was as follows:
Millions of yen Thousands of U.S. dollars
2017 2016 2017 Total net assets ¥ 217,978 ¥ 214,851 $ 1,942,936 Amount to be deducted from total net assets: 3,375 3,205 30,082
Subscription rights to shares 52 21 463 Non-controlling interests 3,323 3,184 29,619
Net assets attributable to common stock 214,602 211,645 1,912,844 Number of shares of common stock as of the fiscal year end used
in computing net assets per share (thousands of shares) 69,760 70,616 - (Note 2) The calculation of earnings per share for the years ended March 31, 2017 and 2016 was as follows:
Millions of yen Thousands of U.S. dollars
2017 2016 2017 Basic earnings per share: Profit attributable to owners of parent ¥ 11,028 ¥ 17,023 $ 98,297 Amount not attributable to common shareholders - - - Profit attributable to common shareholders of parent 11,028 17,023 98,297 Average number of shares of common stock during the term
(thousands of shares) 69,905 71,045 -
Diluted earnings per share: Adjustment to profit attributable to owners of parent - - - Increase in number of shares of common stock (thousands of
shares) 31 12 - Subscription rights to shares (thousands of shares) 31 12 -
Overview of potential shares not included in computing diluted earnings per share due to having no dilutive effect - - -
(Note 3) In computing net assets per share, the Bank’s shares held by Kiyo Financial Group Employee Stock Ownership Association Trust, which are recorded as treasury stock under shareholders’ equity, are included in the number of treasury stock to be deducted from the total number of issued shares at the fiscal year end and are included in the number of treasury stock to be deducted from the average number of shares during the term in computing basic earnings per share and diluted earnings per share.
The number of shares of such treasury stock deducted in computing net assets per share as of March 31, 2017 and 2016 was 224 thousand shares and 440 thousand shares, respectively, and the average number of shares of treasury stock during the term deducted in computing basic earnings per share and diluted earnings per share for the years ended March 31, 2017 and 2016 was 311 thousand shares and 422 thousand shares, respectively.
─ 26 ─

22. Commitment lines Loan agreements and commitment line agreements are agreements which oblige the Bank to lend funds up to a certain limit agreed to in advance. The Bank makes the loans upon a borrower’s request to draw down funds under the agreements as long as there is no breach of the various terms and conditions stipulated in the agreements. The unused commitment balances related to these agreements at March 31, 2017 and 2016 amounted to ¥421,635 million ($3,758,222 thousand) and ¥364,163 million, respectively. Of this amount, the unused commitment balances related to agreements with terms of one year or less or that were unconditionally cancelable at any time totaled ¥387,494 million ($3,453,908 thousand) and ¥355,728 million, respectively.
In many cases, the term of the agreement runs its course without the loan ever being drawn down. Therefore, unused loan commitment balances will not necessarily affect future cash flows. Conditions are included in certain loan agreements which allow the Bank to decline a request to draw down funds or to reduce the agreed limit amount when there is a cause to do so, such as when there is a change in the financial condition of the borrower or when it is necessary to protect the Bank’s credit. The Bank makes various measures to protect its credit, including having the obligor pledge collateral in the form of real estate, securities, etc., on signing the loan agreement or confirming the obligor’s financial condition in accordance with the Bank’s established internal procedures.
23. Financial instruments and related disclosures 1. Disclosure about Financial Instruments (1) Policy on financial instruments
The Group provides comprehensive financial services such as deposit-taking and lending services, leasing operations, credit card business and others. Since the Group is exposed to the market risk of fluctuation in interest rates arising from deposit-taking, lending services and securities investment operations, the Group conducts comprehensive asset and liability management (ALM) and engages in derivative transactions.
(2) Nature and risk of financial instruments
Financial assets held by the Group consist mainly of loans to domestic customers that are exposed to credit risk arising from the customers’ nonperformance of contractual obligations and the risk of interest rate fluctuations. Securities held by the Group consist mainly of debt securities, equity securities and investment trusts, which are held for the purpose of holding to maturity, net investment, strategic investment and trading purposes. These securities are exposed to the credit risk of the issuers, interest rate fluctuation risk and price fluctuation risk.
Financial liabilities consist mainly of deposits, which are exposed to liquidity risk and interest rate fluctuation
risk, and other financial assets. Major risks inherent in derivative transactions include the market risk of fluctuation in interest rates, foreign
exchange, stock prices and other market instruments and the credit risk arising from customers’ nonperformance of contractual obligations. The Group employs derivative transactions mainly to hedge these risks, and the market risk of the hedged items is almost entirely offset by the derivatives. Hedging instruments to which hedge accounting is applied are currency swaps and forward agreements, etc. The corresponding hedged items are securities.
(3) Risk management system for financial instruments Credit risk management The Group has established a credit risk management system that includes the “Credit Risk Control Rule” and other various rules and defines the basic credit risk control policy and management system. Specifically, the Review Department conducts reviews according to the risk characteristics of the credit items by identifying the financial position, use of funds, repayment resources and other factors related to credit customers. The Credit Control Department sets up and controls limits to avoid the concentration of credit risk and identifies the quantitative level of credit risk. The Department is also responsible for the maintenance of the credit rating system and reports the measured volume of credit risk to the Board of Directors and risk management committee so that credit risk management may be discussed within the framework of integrated risk control. Market risk management The Group has established a market risk management system that includes the “Market Risk Control Rule” and other various rules and defines the basic market risk control policy and management system. (i) Interest rate risk management With respect to interest rate management, the Group regularly measures the volume of interest rate risk arising
─ 27 ─
from assets and liabilities such as securities, loans and deposits and conducts interest rate gap analysis and interest rate sensitivity analysis and reports the outcome to the ALM Strategy Committee and the Risk Control Committee. The Group also has established specific limits on the level of interest rate risk. (ii) Price fluctuation risk management With respect to price fluctuation risk, the Group controls the level of risk on a daily basis by measuring the risk volume and setting up limits on the level of risk. Securities held for net investment purposes are controlled by setting up additional limits on transactions and losses above those set up by the executive committee in addition to the risk volume control. With respect to shares held for strategic investment purposes, the Group tries to reduce the risk level by limiting the balance and hedge transactions, etc. (iii) Foreign exchange risk management The Group identifies the fluctuation risk associated with foreign currency denominated assets and liabilities, controls the risk within the limit determined by the executive committee and works to mitigate the risk using currency swaps, etc. (iv) Derivative transactions Derivatives transactions are employed principally and limitedly for hedging purposes. An internal control system has been established by segregating the functions of executing derivative transactions, evaluating hedge effectiveness and controlling operations. (v) Quantitative information on market risk Major financial instruments that are affected by interest rate risk that is regarded as major risk factors are call loans, other debt purchased, bonds and investment trusts included in securities, loans and bills discounted, deposits, call money, payables under securities lending transactions, borrowed money and bonds. Financial instruments that are affected by price fluctuation risk consist of stocks and investment trusts included in securities.
The Bank calculates Value at Risk (VaR) to capture the effects of income and economic value from interest rate fluctuation and price fluctuation. VaR is made available to internal management. To calculate VaR, the Bank applies the variance and covariance method, using 3 to 6 months as the holding period based on risk characteristics, 99% as the confidence interval and 1 to 5 years as the observation period based on risk characteristics. The amount of risk at March 31, 2017 and 2016 was ¥10,438 million ($93,038 thousand) and ¥2,922 million, respectively, for interest rate risk and ¥20,224 million ($180,265 thousand) and ¥27,758 million, respectively, for price fluctuation risk.
For the fiscal year ended March 31, 2017, VaR of strategic equity investment out of VaR of price fluctuation risk uses modified VaR that is VaR after deducting valuation gain or loss for the purpose of the internal control of the Bank and the above mentioned VaR of price fluctuation risk also uses modified VaR. (Since valuation gain or loss of strategic equity investment in the amount of ¥20,480 million ($182,547 thousand) exceeds VaR of the price fluctuation risk in the amount of ¥10,387 million ($92,584 thousand), the modified VaR of strategic equity investment is zero.)
In addition, the Bank verifies the effectiveness of risk measurement under the variance and covariance method by a back testing protocol that compares VaR to actual income.
In calculating VaR on interest rate risk, the core deposits of liquid deposits are adjusted. Core deposits do not have specified interest rates and are demand deposits that are expected to be held for the long term without demand for withdrawal. VaR is a statistical measure of market risk volume under a certain probability of occurrence based on the past market fluctuations. Accordingly, it may be impossible to capture the risk if the market fluctuates rapidly under extraordinary circumstances.
Liquidity risk management The Group has established a liquidity risk management system that includes the “Liquidity Risk Control Rule” and other various rules and defines the basic liquidity risk control policy and management system. The Group tries to control liquidity risk by maintaining stable cash management, securing highly liquid reserves and strengthening preliminary controls.
(4) Supplementary explanation about fair value of financial instruments In addition to value based on the market price, the fair values of financial instruments include valuations calculated on a reasonable basis if no market price is available. Since certain assumptions are used in calculating the values, the outcome of such calculations may vary if different assumptions are used.
─ 28 ─

2. Fair value of financial instruments
The carrying amount, the fair value and any difference as of March 31, 2017 and 2016 are set forth in the table below. Note that unlisted equity securities for which the fair value was extremely difficult to determine were not included in the following table (See Note 2). Also, insignificant items were omitted. Millions of yen 2017
Carrying amount Fair value Unrealized
gains (losses) Cash and due from banks ¥ 671,707 ¥ 671,707 ¥ - Securities: Held-to-maturity securities 104,927 104,469 (457) Available-for-sale securities 1,198,265 1,198,265 - Loans and bills discounted 2,812,871
Reserve for possible loan losses (*1) (25,910) 2,786,961 2,802,529 15,568 Total assets ¥ 4,761,862 ¥ 4,776,972 ¥ 15,110
Deposits ¥ 3,941,679 ¥ 3,941,846 ¥ 166 Call money and bills sold 208,500 208,500 - Payables under securities lending transactions 180,206 180,206 - Borrowed money 245,410 245,410 - Bonds 10,000 10,068 68
Total liabilities ¥ 4,585,796 ¥ 4,586,030 ¥ 234 Derivative transactions (*2) Hedge accounting not applied ¥ 1,513 ¥ 1,513 ¥ - Hedge accounting applied (59) (59) - Total derivative transactions ¥ 1,454 ¥ 1,454 ¥ -
(*1) General and specific reserves for possible loan losses corresponding to loans and bills discounted are deducted. (*2) Net receivables and payables incurred from derivative transactions are presented in net amounts, and net payables are presented in parentheses.
Millions of yen 2016
Carrying amount Fair value Unrealized
gains (losses) Cash and due from banks ¥ 465,655 ¥ 465,655 ¥ - Securities: Held-to-maturity securities 131,585 130,798 (787) Available-for-sale securities 1,038,474 1,038,474 - Loans and bills discounted 2,731,037
Reserve for possible loan losses (*1) (24,725) 2,706,312 2,727,922 21,610 Total assets ¥ 4,342,027 ¥ 4,362,850 ¥ 20,823
Deposits ¥ 3,919,081 ¥ 3,919,213 ¥ 131 Payables under securities lending transactions 93,367 93,367 - Borrowed money 146,475 146,475 - Bonds 13,000 13,182 182
Total liabilities ¥ 4,171,924 ¥ 4,172,238 ¥ 313 Derivative transactions (*2) Hedge accounting not applied ¥ 2,995 ¥ 2,995 ¥ - Hedge accounting applied - - - Total derivative transactions ¥ 2,995 ¥ 2,995 ¥ -
(*1) General and specific reserves for possible loan losses corresponding to loans and bills discounted are deducted. (*2) Net receivables and payables incurred from derivative transactions are presented in net amounts, and net payables are presented in parentheses.
─ 29 ─

Thousands of U.S. dollars 2017
Carrying amount Fair value Unrealized
gains (losses) Cash and due from banks $ 5,987,227 $ 5,987,227 $ - Securities:
Held-to-maturity securities 935,261 931,179 (4,073) Available-for-sale securities 10,680,675 10,680,675 - Loans and bills discounted 25,072,386
Reserve for possible loan losses (*1) (230,947)
24,841,438 24,980,203 138,764 Total assets $ 42,444,620 $ 42,579,302 $ 134,682
Deposits $ 35,133,960 $ 35,135,448 $ 1,479 Call money and bills sold 1,858,454 1,858,454 - Payables under securities lending transactions 1,606,257 1,606,257 - Borrowed money 2,187,449 2,187,449 - Bonds 89,134 89,740 606
Total liabilities $ 40,875,265 $ 40,877,350 $ 2,085 Derivative transactions (*2)
Hedge accounting not applied $ 13,486 $ 13,486 $ - Hedge accounting applied (525) (525) -
Total derivative transactions $ 12,960 $ 12,960 $ - (*1) General and specific reserves for possible loan losses corresponding to loans and bills discounted are deducted. (*2) Net receivables and payables incurred from derivative transactions are presented in net amounts, and net payables are presented in parentheses. (Note 1) Method of calculation for fair value of financial instruments Assets:
Cash and due from banks For deposits without maturity, the carrying amount is presented as the fair value since the fair value approximates the carrying amount. For deposits with maturity, the carrying amount is presented as the fair value since the fair value approximates the carrying amount because the maturity is short (less than one year). Securities The fair value of equity securities is determined using the quoted price on exchanges, and the fair value of debt securities is determined using the price published by the industry group or offered by the financial institutions with which they are transacted. The fair value of investment trusts is determined using the quoted price on exchanges or the price offered by the financial institution with which they are transacted. The fair value of non-publicly traded private placement bonds guaranteed by the Bank is determined using the same calculation method as that of loans. Loans and bills discounted For loans with variable interest rates which reflect short-term interest rates, the carrying amount is presented as the fair value since the fair value approximates the carrying amount as long as the creditworthiness of the borrower has not changed significantly from the time of the loan origination. For loans with fixed interest rates, the fair value is determined based on the aggregate value of principal and interest by categories of types of loans, internal ratings and maturities discounted using the interest rate assumed if the same loans were newly originated. For loans with short contractual terms (less than one year), the carrying amount is presented as the fair value since the fair value approximates the carrying amount.
For receivables from bankrupt, effectively bankrupt and likely to become bankrupt borrowers, loan losses
are estimated based on factors such as the present value of expected future cash flows or the expected amount to be collected from collateral and guarantees. Since the fair value of these items approximates the carrying amount, net of the expected loan losses, the carrying amount is presented as the fair value.
For loans which have non-defined repayment due dates because of restricting the amount of the loans to the
amount of the pledged assets, the carrying amount is presented as the fair value since the fair value approximates the carrying amount considering the expected repayment schedule and interest rate.
─ 30 ─

Liabilities:
Deposits For demand deposits, the amount payable on demand as of the balance sheet date (i.e., the carrying amount) is considered to be the fair value. The fair value of time deposits is determined using the discounted present value of future cash flows grouped by certain maturity lengths. The discount rate used is the interest rate that would be applied to newly accepted deposits. For deposits whose maturity is short (less than one year), the carrying amount is presented as the fair value since the fair value approximates the carrying amount. Call money and bills sold and payables under securities lending transactions For call money and bills sold and payables under securities lending transactions in which the trade term is short (less than one year), the carrying amount is presented as the fair value since the fair value approximates the carrying amount. Borrowed money and bonds For borrowed money and bonds, the fair value is calculated as the present value of expected future cash flows discounted using the interest rate that would apply to newly borrowed money. For borrowed money with variable interest rates linked to short-term market interest rates, the carrying amount is presented as the fair value since the fair value approximates the carrying amount because the creditworthiness of the Bank and its consolidated subsidiaries did not change significantly after it was executed.
Derivative transactions:
Derivative transactions consist mainly of currency related derivatives such as currency futures, currency options, currency swaps, etc. The fair value is determined using the value calculated by the quoted price on exchange, discounted present value, option pricing models, etc.
(Note 2) Financial instruments for which fair value is extremely difficult to determine are set forth in the table below. These securities are not included in “Available-for-sale securities” under “Assets” in the table “Fair value of financial instruments.”
Carrying amount
Millions of yen Thousands of U.S. dollars
2017 2016 2017 Unlisted equity securities (*1) (*2) ¥ 1,527 ¥ 1,514 $ 13,610 Investment in partnerships (*3) 939 742 8,369
Total ¥ 2,467 ¥ 2,256 $ 21,989 (*1) No market price is available for unlisted equity securities, and the fair value is not disclosed since it was extremely difficult to determine. (*2) The Bank recognized impairment loss in an amount of ¥0 million ($0 thousand) and ¥34 million on unlisted equity securities for the years ended March 31, 2017 and 2016, respectively. (*3) The fair value of investment in partnerships whose assets consisted of securities such as unlisted equity securities whose fair value is extremely difficult to identify is not disclosed.
─ 31 ─
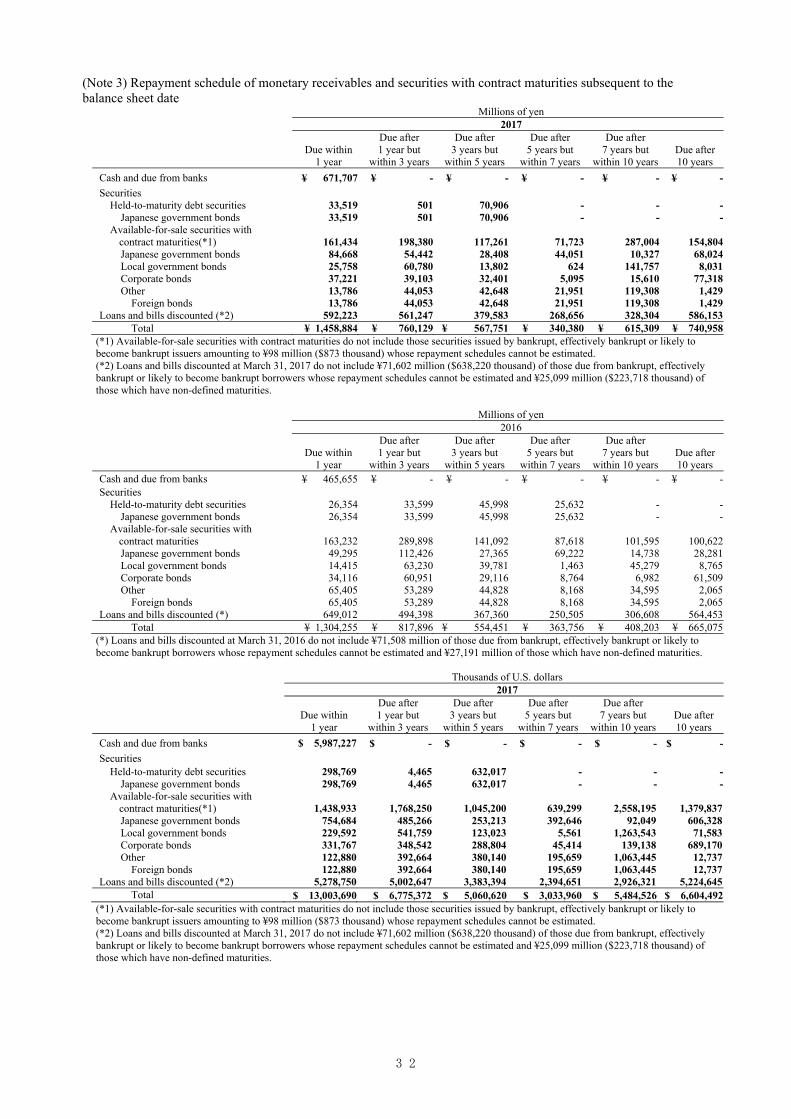
(Note 3) Repayment schedule of monetary receivables and securities with contract maturities subsequent to the balance sheet date
Millions of yen 2017
Due within 1 year
Due after 1 year but
within 3 years
Due after 3 years but
within 5 years
Due after 5 years but
within 7 years
Due after 7 years but
within 10 years Due after 10 years
Cash and due from banks ¥ 671,707 ¥ - ¥ - ¥ - ¥ - ¥ -
Securities Held-to-maturity debt securities 33,519 501 70,906 - - - Japanese government bonds 33,519 501 70,906 - - - Available-for-sale securities with
contract maturities(*1)
161,434
198,380
117,261
71,723
287,004
154,804 Japanese government bonds 84,668 54,442 28,408 44,051 10,327 68,024 Local government bonds 25,758 60,780 13,802 624 141,757 8,031 Corporate bonds 37,221 39,103 32,401 5,095 15,610 77,318 Other 13,786 44,053 42,648 21,951 119,308 1,429 Foreign bonds 13,786 44,053 42,648 21,951 119,308 1,429 Loans and bills discounted (*2) 592,223 561,247 379,583 268,656 328,304 586,153
Total ¥ 1,458,884 ¥ 760,129 ¥ 567,751 ¥ 340,380 ¥ 615,309 ¥ 740,958 (*1) Available-for-sale securities with contract maturities do not include those securities issued by bankrupt, effectively bankrupt or likely to become bankrupt issuers amounting to ¥98 million ($873 thousand) whose repayment schedules cannot be estimated. (*2) Loans and bills discounted at March 31, 2017 do not include ¥71,602 million ($638,220 thousand) of those due from bankrupt, effectively bankrupt or likely to become bankrupt borrowers whose repayment schedules cannot be estimated and ¥25,099 million ($223,718 thousand) of those which have non-defined maturities.
Millions of yen 2016
Due within 1 year
Due after 1 year but
within 3 years
Due after 3 years but
within 5 years
Due after 5 years but
within 7 years
Due after 7 years but
within 10 years Due after 10 years
Cash and due from banks ¥ 465,655 ¥ - ¥ - ¥ - ¥ - ¥ - Securities Held-to-maturity debt securities 26,354 33,599 45,998 25,632 - - Japanese government bonds 26,354 33,599 45,998 25,632 - - Available-for-sale securities with
contract maturities
163,232
289,898
141,092
87,618
101,595
100,622 Japanese government bonds 49,295 112,426 27,365 69,222 14,738 28,281 Local government bonds 14,415 63,230 39,781 1,463 45,279 8,765 Corporate bonds 34,116 60,951 29,116 8,764 6,982 61,509 Other 65,405 53,289 44,828 8,168 34,595 2,065 Foreign bonds 65,405 53,289 44,828 8,168 34,595 2,065 Loans and bills discounted (*) 649,012 494,398 367,360 250,505 306,608 564,453
Total ¥ 1,304,255 ¥ 817,896 ¥ 554,451 ¥ 363,756 ¥ 408,203 ¥ 665,075 (*) Loans and bills discounted at March 31, 2016 do not include ¥71,508 million of those due from bankrupt, effectively bankrupt or likely to become bankrupt borrowers whose repayment schedules cannot be estimated and ¥27,191 million of those which have non-defined maturities.
Thousands of U.S. dollars 2017
Due within 1 year
Due after 1 year but
within 3 years
Due after 3 years but
within 5 years
Due after 5 years but
within 7 years
Due after 7 years but
within 10 years Due after 10 years
Cash and due from banks $ 5,987,227 $ - $ - $ - $ - $ -
Securities Held-to-maturity debt securities 298,769 4,465 632,017 - - - Japanese government bonds 298,769 4,465 632,017 - - - Available-for-sale securities with
contract maturities(*1) 1,438,933 1,768,250 1,045,200 639,299 2,558,195 1,379,837 Japanese government bonds 754,684 485,266 253,213 392,646 92,049 606,328 Local government bonds 229,592 541,759 123,023 5,561 1,263,543 71,583 Corporate bonds 331,767 348,542 288,804 45,414 139,138 689,170 Other 122,880 392,664 380,140 195,659 1,063,445 12,737 Foreign bonds 122,880 392,664 380,140 195,659 1,063,445 12,737 Loans and bills discounted (*2) 5,278,750 5,002,647 3,383,394 2,394,651 2,926,321 5,224,645
Total $ 13,003,690 $ 6,775,372 $ 5,060,620 $ 3,033,960 $ 5,484,526 $ 6,604,492 (*1) Available-for-sale securities with contract maturities do not include those securities issued by bankrupt, effectively bankrupt or likely to become bankrupt issuers amounting to ¥98 million ($873 thousand) whose repayment schedules cannot be estimated. (*2) Loans and bills discounted at March 31, 2017 do not include ¥71,602 million ($638,220 thousand) of those due from bankrupt, effectively bankrupt or likely to become bankrupt borrowers whose repayment schedules cannot be estimated and ¥25,099 million ($223,718 thousand) of those which have non-defined maturities.
─ 32 ─

(Note 4) Repayment schedule of bonds, borrowed money and other interest bearing liabilities subsequent to the balance sheet date
Millions of yen 2017
Due within 1 year
Due after 1 year but
within 3 years
Due after 3 years but
within 5 years
Due after 5 years but
within 7 years
Due after 7 years but
within 10 years Due after 10 years
Deposits (*) ¥ 3,614,905 ¥ 269,908 ¥ 56,865 ¥ - ¥ - ¥ - Call money and bills sold 208,500 - - - - - Deposits received for securities lending
transactions
180,206
-
-
-
- - Borrowed money 239,602 728 80 - 5,000 - Bonds - - - 10,000 - - Total ¥ 4,243,214 ¥ 270,636 ¥ 56,945 ¥ 10,000 ¥ 5,000 ¥ -
(*) Demand deposits are shown under “Due within 1 year.”
Millions of yen 2016
Due within 1 year
Due after 1 year but
within 3 years
Due after 3 years but
within 5 years
Due after 5 years but
within 7 years
Due after 7 years but
within 10 years Due after 10 years
Deposits (*) ¥ 3,542,841 ¥ 309,321 ¥ 66,919 ¥ - ¥ - ¥ - Deposits received for securities lending
transactions
93,367
-
-
-
- - Borrowed money 137,328 1,066 80 3,000 5,000 - Bonds - - - 3,000 10,000 - Total ¥ 3,773,537 ¥ 310,387 ¥ 66,999 ¥ 6,000 ¥ 15,000 ¥ -
(*) Demand deposits are shown under “Due within 1 year.”
Thousands of U.S. dollars 2017
Due within 1 year
Due after 1 year but
within 3 years
Due after 3 years but
within 5 years
Due after 5 years but
within 7 years
Due after 7 years but
within 10 years Due after 10 years
Deposits (*) $ 32,221,276 $ 2,405,811 $ 506,863 $ - $ - $ - Call money and bills sold 1,858,454 - - - - - Deposits received for securities lending
transactions 1,606,257 - - - - - Borrowed money 2,135,680 6,488 713 - 44,567 - Bonds - - - 89,134 - - Total $ 37,821,677 $ 2,412,300 $ 507,576 $ 89,134 $ 44,567 $ -
(*) Demand deposits are shown under “Due within 1 year.”
─ 33 ─
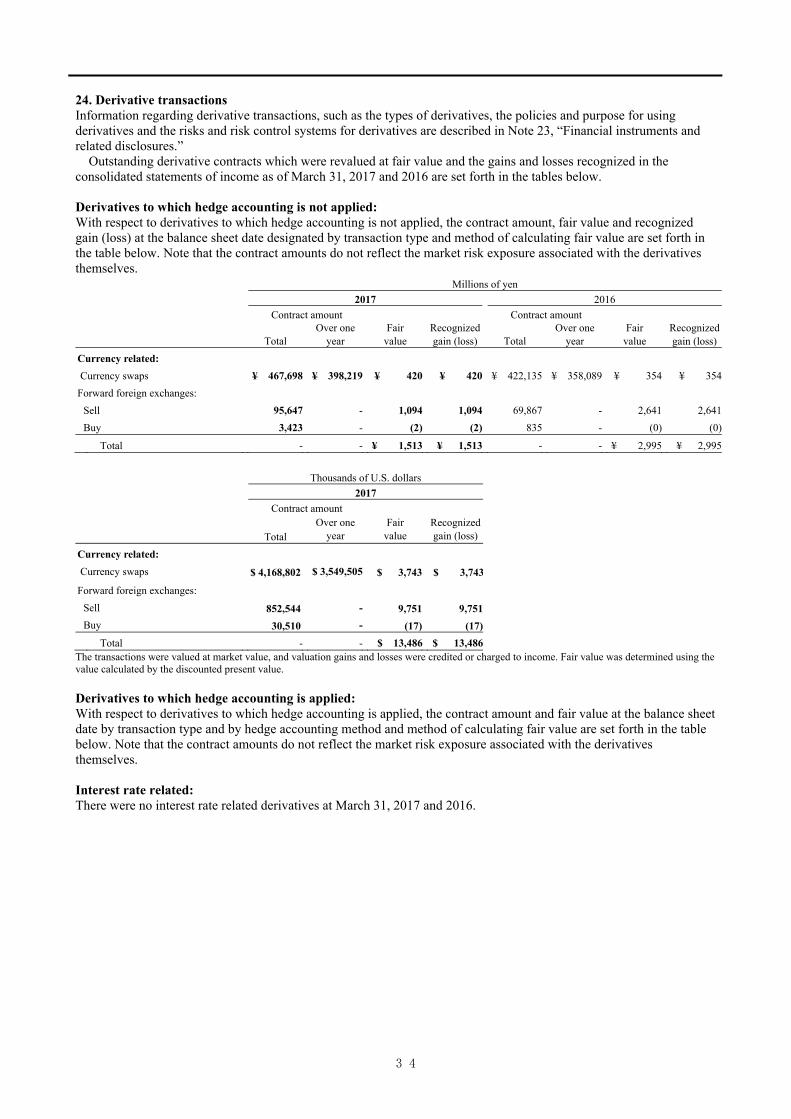
24. Derivative transactions Information regarding derivative transactions, such as the types of derivatives, the policies and purpose for using derivatives and the risks and risk control systems for derivatives are described in Note 23, “Financial instruments and related disclosures.”
Outstanding derivative contracts which were revalued at fair value and the gains and losses recognized in the consolidated statements of income as of March 31, 2017 and 2016 are set forth in the tables below. Derivatives to which hedge accounting is not applied: With respect to derivatives to which hedge accounting is not applied, the contract amount, fair value and recognized gain (loss) at the balance sheet date designated by transaction type and method of calculating fair value are set forth in the table below. Note that the contract amounts do not reflect the market risk exposure associated with the derivatives themselves.
Millions of yen
2017 2016 Contract amount Contract amount
Total
Over one year
Fair value Recognized
gain (loss)
Total Over one
year Fair
value Recognized gain (loss)
Currency related:
Currency swaps ¥ 467,698 ¥ 398,219 ¥ 420 ¥ 420 ¥ 422,135 ¥ 358,089 ¥ 354 ¥ 354Forward foreign exchanges:
Sell 95,647 - 1,094 1,094 69,867 - 2,641 2,641Buy 3,423 - (2) (2) 835 - (0) (0)
Total - - ¥ 1,513 ¥ 1,513 - - ¥ 2,995 ¥ 2,995
Thousands of U.S. dollars
2017
Contract amount
Total Over one
year Fair
value Recognized gain (loss)
Currency related:
Currency swaps $ 4,168,802 $ 3,549,505 $ 3,743 $ 3,743
Forward foreign exchanges:
Sell 852,544 - 9,751 9,751
Buy 30,510 - (17) (17)
Total - - $ 13,486 $ 13,486The transactions were valued at market value, and valuation gains and losses were credited or charged to income. Fair value was determined using the value calculated by the discounted present value. Derivatives to which hedge accounting is applied: With respect to derivatives to which hedge accounting is applied, the contract amount and fair value at the balance sheet date by transaction type and by hedge accounting method and method of calculating fair value are set forth in the table below. Note that the contract amounts do not reflect the market risk exposure associated with the derivatives themselves. Interest rate related: There were no interest rate related derivatives at March 31, 2017 and 2016.
─ 34 ─

Currency related: Millions of yen 2017 Contract amount Hedge accounting
method Type Major hedged items Total Over one year Fair value Fundamental method
Currency swaps:
Foreign currency denominated loans, securities
¥ 2,252 ¥ 2,252 ¥ (59)
Thousands of U.S. dollars 2017 Contract amount Hedge accounting
method Type Major hedged items Total Over one year Fair value Fundamental method
Currency swaps:
Foreign currency denominated loans, securities
$ 20,073 $ 20,073 $ (525)
Notes: 1. The above transactions are accounted for by deferral hedge accounting in accordance with “Treatment of Accounting and Auditing Concerning
Accounting for Foreign Currency Transactions in the Banking Industry” (JICPA Industry Audit Committee Report No. 25, July 29, 2002). 2. Fair value was determined using the value calculated by the discounted present value. There were no currency related derivatives at March 31, 2016. Stock or bond related: There were no stock or bond related derivatives at March 31, 2017 and 2016.
─ 35 ─

25. Segment information (a) General information about reportable segments The Group’s reportable segment is defined as an operating segment for which discrete financial information is available and examined by the Board of Directors meeting and the executive committee which is the supreme consultative organization for the directors and president regularly in order to make decisions about the allocation of resources and assess performance. The Group comprises of the Bank and the six consolidated subsidiaries, and engages mainly in the banking business, and financial information is controlled based on figures provided by the Bank, which operates the banking business. So, the Group defines the banking business as a reportable segment. (b) Basis of measurement for reportable segment profit and loss, segment assets, segment liabilities and other material items The accounting methods used for the reportable segments are the same as those used for the preparation of the consolidated financial statements. Profits for reportable segments are ordinary profit. Ordinary profit is profit derived from regular business activities, including wages, dividends and interest. Profits and transfer sums of intersegment transactions within the Group are based on market prices.
(c) Information about reportable segment profit or loss, segment assets, segment liabilities and other items Segment information as of and for the fiscal year ended March 31, 2017 was as follows:
Millions of yen
2017
Banking business
Other business Total Reconciliation Consolidated
Ordinary income: Outside customers ¥ 67,053 ¥ 8,432 ¥ 75,485 ¥ - ¥ 75,485
Intersegment 344 1,643 1,988 (1,988) -
Total 67,397 10,076 77,473 (1,988) 75,485
Segment profit 12,171 1,317 13,488 73 13,562
Segment assets 4,868,004 30,056 4,898,061 (27,601) 4,870,459
Segment liabilities 4,659,359 18,225 4,677,585 (25,103) 4,652,481
Others Depreciation ¥ 3,339 ¥ 420 ¥ 3,759 ¥ - ¥ 3,759
Interest income 48,676 95 48,771 (80) 48,691
Interest expense 3,504 78 3,582 (77) 3,504
Gain on disposal of fixed assets 16 - 16 - 16
Loss on disposal of fixed assets 111 1 112 - 112
Impairment loss on fixed assets 214 - 214 - 214
Income taxes 1,517 548 2,065 30 2,096
Increase in tangible and intangible fixed assets 3,243 278 3,522 (0) 3,521
Notes: 1. Ordinary income represents total income less certain specific income. 2. The “Other” category incorporates operations not included in any of the reportable segments reported, including the credit assurance
business, computing business, clerical work agency industry, leasing business, venture capital services, credit card services and electronic data processing related services.
3. (1) “Reconciliation” of “Intersegment” under “Ordinary income” in the amount of ¥(1,988) million represents intersegment elimination. (2) “Reconciliation” of “Segment profit” in the amount of ¥73 million represents intersegment elimination. (3) “Reconciliation” of “Segment assets” in the amount of ¥(27,601) million represents intersegment elimination. (4) “Reconciliation” of “Segment liabilities” in the amount of ¥(25,103) million represents intersegment elimination. (5) “Reconciliation” of “Interest income” in the amount of ¥(80) million represents intersegment elimination. (6) “Reconciliation” of “Interest expenses” in the amount of ¥(77) million represents intersegment elimination. (7) “Reconciliation” of “Income taxes” in the amount of ¥30 million represents intersegment elimination.
(8) “Reconciliation” of “Increase in tangible and intangible fixed assets” in the amount of ¥(0) million represents intersegment elimination. 4. Segment profit is reconciled to ordinary profit in the consolidated income statement.
─ 36 ─

Segment information as of and for the fiscal year ended March 31, 2016 was as follows: Millions of yen
2016
Banking business
Other business Total Reconciliation Consolidated
Ordinary income: Outside customers ¥ 73,036 ¥ 8,563 ¥ 81,599 ¥ - ¥ 81,599
Intersegment 375 2,006 2,382 (2,382) -
Total 73,411 10,569 83,981 (2,382) 81,599
Segment profit 20,268 1,156 21,425 54 21,479
Segment assets 4,443,722 28,911 4,472,633 (26,298) 4,446,335
Segment liabilities 4,237,368 17,869 4,255,238 (23,755) 4,231,483
Others Depreciation ¥ 3,300 ¥ 394 ¥ 3,694 ¥ - ¥ 3,694
Interest income 51,589 126 51,716 (110) 51,605
Interest expense 4,250 107 4,357 (108) 4,249 Gain on disposal of fixed
assets 36 0 37 - 37 Loss on disposal of fixed
assets 134 0 134 - 134 Impairment loss on fixed
assets 255 - 255 - 255
Income taxes 3,557 407 3,965 2 3,967 Increase in tangible and
intangible fixed assets 4,562 307 4,870 - 4,870 Notes: 1. Ordinary income represents total income less certain specific income. 2. The “Other” category incorporates operations not included in any of the reportable segments reported, including the credit assurance
business, computing business, clerical work agency industry, leasing business, venture capital services, credit card services and electronic data processing related services.
3. (1) “Reconciliation” of “Intersegment” under “Ordinary income” in the amount of ¥(2,382) million represents intersegment elimination. (2) “Reconciliation” of “Segment profit” in the amount of ¥54 million represents intersegment elimination. (3) “Reconciliation” of “Segment assets” in the amount of ¥(26,298) million represents intersegment elimination. (4) “Reconciliation” of “Segment liabilities” in the amount of ¥(23,755) million represents intersegment elimination. (5) “Reconciliation” of “Interest income” in the amount of ¥(110) million represents intersegment elimination. (6) “Reconciliation” of “Interest expenses” in the amount of ¥(108) million represents intersegment elimination. (7) “Reconciliation” of “Income taxes” in the amount of ¥2 million represents intersegment elimination. 4. Segment profit is reconciled to ordinary profit in the consolidated income statement.
─ 37 ─
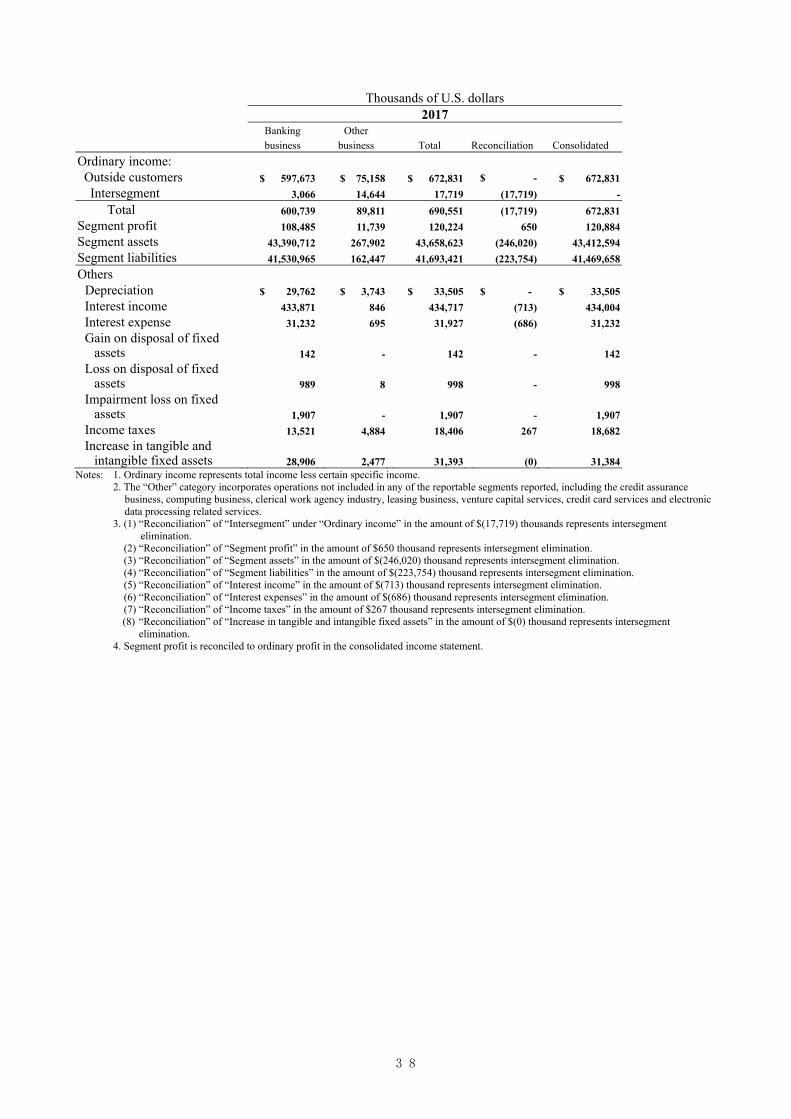
Thousands of U.S. dollars
2017
Banking business
Other business Total Reconciliation Consolidated
Ordinary income: Outside customers $ 597,673 $ 75,158 $ 672,831 $ - $ 672,831
Intersegment 3,066 14,644 17,719 (17,719) -
Total 600,739 89,811 690,551 (17,719) 672,831
Segment profit 108,485 11,739 120,224 650 120,884
Segment assets 43,390,712 267,902 43,658,623 (246,020) 43,412,594
Segment liabilities 41,530,965 162,447 41,693,421 (223,754) 41,469,658
Others Depreciation $ 29,762 $ 3,743 $ 33,505
$ - $ 33,505
Interest income 433,871 846 434,717 (713) 434,004
Interest expense 31,232 695 31,927 (686) 31,232
Gain on disposal of fixed assets 142 - 142 - 142
Loss on disposal of fixed assets 989 8 998 - 998
Impairment loss on fixed assets 1,907 - 1,907 - 1,907
Income taxes 13,521 4,884 18,406 267 18,682
Increase in tangible and intangible fixed assets 28,906 2,477 31,393 (0) 31,384
Notes: 1. Ordinary income represents total income less certain specific income. 2. The “Other” category incorporates operations not included in any of the reportable segments reported, including the credit assurance
business, computing business, clerical work agency industry, leasing business, venture capital services, credit card services and electronic data processing related services.
3. (1) “Reconciliation” of “Intersegment” under “Ordinary income” in the amount of $(17,719) thousands represents intersegment elimination.
(2) “Reconciliation” of “Segment profit” in the amount of $650 thousand represents intersegment elimination. (3) “Reconciliation” of “Segment assets” in the amount of $(246,020) thousand represents intersegment elimination. (4) “Reconciliation” of “Segment liabilities” in the amount of $(223,754) thousand represents intersegment elimination. (5) “Reconciliation” of “Interest income” in the amount of $(713) thousand represents intersegment elimination. (6) “Reconciliation” of “Interest expenses” in the amount of $(686) thousand represents intersegment elimination. (7) “Reconciliation” of “Income taxes” in the amount of $267 thousand represents intersegment elimination.
(8) “Reconciliation” of “Increase in tangible and intangible fixed assets” in the amount of $(0) thousand represents intersegment elimination.
4. Segment profit is reconciled to ordinary profit in the consolidated income statement.
─ 38 ─

(d) Information about services
Millions of yen
2017
Loan services Securities investment Other Total
Ordinary income:
Outside customers ¥ 35,708 ¥ 19,756 ¥ 20,020 ¥ 75,485
Millions of yen
2016
Loan services Securities investment Other Total
Ordinary income:
Outside customers ¥ 37,957 ¥ 23,720 ¥ 19,921 ¥ 81,599
Thousands of U.S. dollars
2017
Loan services Securities investment Other Total
Ordinary income: Outside customers $ 318,281 $ 176,094 $ 178,447 $ 672,831
Note: Ordinary income represents total income less certain specific income. (e) Information about geographic areas The information is not required to be disclosed because the amounts of ordinary income and tangible fixed assets in Japan exceeded 90% of the respective total amount for all segments. (f) Information about major customers The information is not required to be disclosed because ordinary income from any particular outside customer represented less than 10% of consolidated ordinary income. (g) Segment information for impairment loss on fixed assets by reportable segment
Millions of yen
2017
Banking business
Other business Total
Impairment loss on fixed assets ¥ 214 ¥ - ¥ 214
Millions of yen
2016
Banking business
Other business Total
Impairment loss on fixed assets ¥ 255 ¥ - ¥ 255
Thousands of U.S. dollars
2017
Banking business
Other business Total
Impairment loss on fixed assets $ 1,907 $ - $ 1,907
─ 39 ─
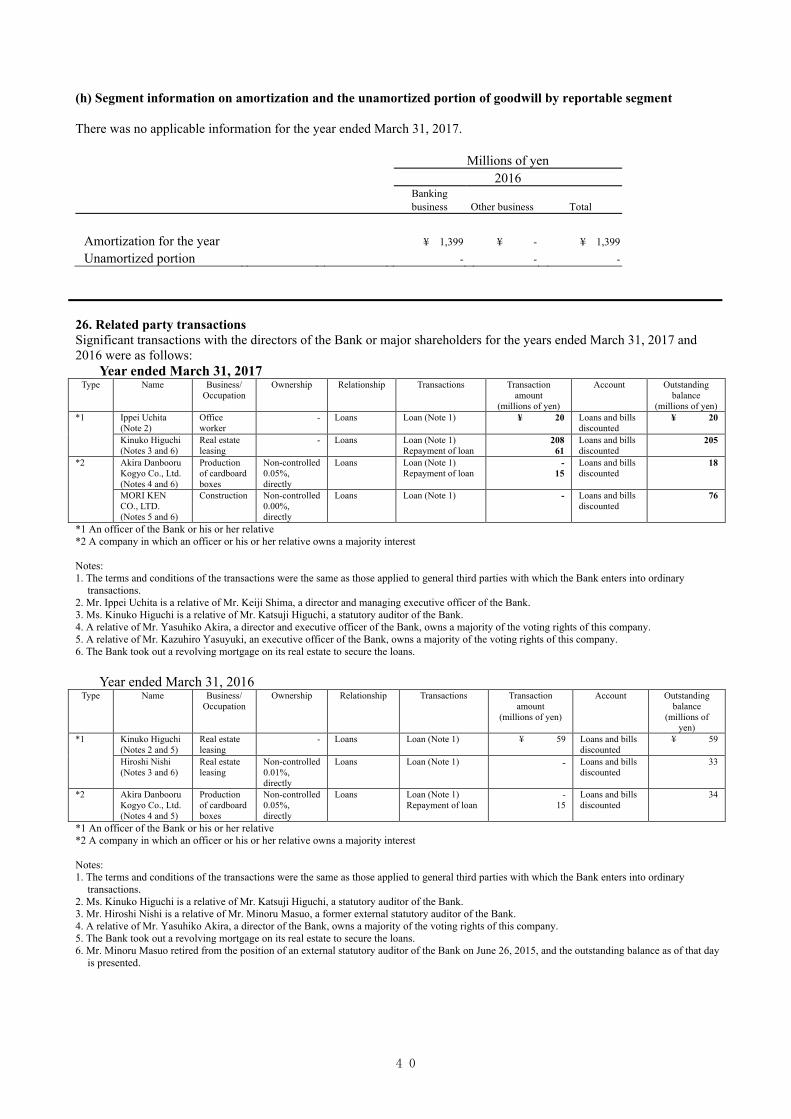
(h) Segment information on amortization and the unamortized portion of goodwill by reportable segment There was no applicable information for the year ended March 31, 2017.
Millions of yen
2016
Banking business Other business Total
Amortization for the year ¥ 1,399 ¥ - ¥ 1,399 Unamortized portion - - -
26. Related party transactions Significant transactions with the directors of the Bank or major shareholders for the years ended March 31, 2017 and 2016 were as follows:
Year ended March 31, 2017 Type Name Business/
Occupation Ownership Relationship Transactions Transaction
amount (millions of yen)
Account Outstanding balance
(millions of yen) *1 Ippei Uchita
(Note 2) Office worker
- Loans Loan (Note 1) ¥ 20 Loans and bills discounted
¥ 20
Kinuko Higuchi (Notes 3 and 6)
Real estate leasing
- Loans Loan (Note 1) Repayment of loan
208 61
Loans and bills discounted
205
*2 Akira Danbooru Kogyo Co., Ltd. (Notes 4 and 6)
Production of cardboard boxes
Non-controlled 0.05%, directly
Loans Loan (Note 1) Repayment of loan
- 15
Loans and bills discounted
18
MORI KEN CO., LTD. (Notes 5 and 6)
Construction Non-controlled 0.00%, directly
Loans Loan (Note 1) - Loans and bills discounted
76
*1 An officer of the Bank or his or her relative *2 A company in which an officer or his or her relative owns a majority interest Notes: 1. The terms and conditions of the transactions were the same as those applied to general third parties with which the Bank enters into ordinary
transactions. 2. Mr. Ippei Uchita is a relative of Mr. Keiji Shima, a director and managing executive officer of the Bank. 3. Ms. Kinuko Higuchi is a relative of Mr. Katsuji Higuchi, a statutory auditor of the Bank. 4. A relative of Mr. Yasuhiko Akira, a director and executive officer of the Bank, owns a majority of the voting rights of this company. 5. A relative of Mr. Kazuhiro Yasuyuki, an executive officer of the Bank, owns a majority of the voting rights of this company. 6. The Bank took out a revolving mortgage on its real estate to secure the loans.
Year ended March 31, 2016
Type Name Business/ Occupation
Ownership Relationship Transactions Transaction amount
(millions of yen)
Account Outstanding balance
(millions of yen)
*1 Kinuko Higuchi (Notes 2 and 5)
Real estate leasing
- Loans Loan (Note 1) ¥ 59 Loans and bills discounted
¥ 59
Hiroshi Nishi (Notes 3 and 6)
Real estate leasing
Non-controlled 0.01%, directly
Loans Loan (Note 1) - Loans and bills discounted
33
*2 Akira Danbooru Kogyo Co., Ltd. (Notes 4 and 5)
Production of cardboard boxes
Non-controlled 0.05%, directly
Loans Loan (Note 1) Repayment of loan
- 15
Loans and bills discounted
34
*1 An officer of the Bank or his or her relative *2 A company in which an officer or his or her relative owns a majority interest Notes: 1. The terms and conditions of the transactions were the same as those applied to general third parties with which the Bank enters into ordinary
transactions. 2. Ms. Kinuko Higuchi is a relative of Mr. Katsuji Higuchi, a statutory auditor of the Bank. 3. Mr. Hiroshi Nishi is a relative of Mr. Minoru Masuo, a former external statutory auditor of the Bank. 4. A relative of Mr. Yasuhiko Akira, a director of the Bank, owns a majority of the voting rights of this company. 5. The Bank took out a revolving mortgage on its real estate to secure the loans. 6. Mr. Minoru Masuo retired from the position of an external statutory auditor of the Bank on June 26, 2015, and the outstanding balance as of that day
is presented.
─ 40 ─

Year ended March 31, 2017
Type Name Business/ Occupation
Ownership Relationship Transactions Transaction amount
(thousands of U.S. dollars)
Account Outstanding balance
(thousands of U.S. dollars)
*1 Ippei Uchita (Note 2)
Office worker
- Loans Loan (Note 1) $ 178 Loans and bills discounted
$ 178
Kinuko Higuchi (Notes 3 and 6)
Real estate leasing
- Loans Loan (Note 1) Repayment of loan
1,853 543
Loans and bills discounted
1,827
*2 Akira Danbooru Kogyo Co., Ltd. (Notes 4 and 6)
Production of cardboard boxes
Non-controlled 0.05%, directly
Loans Loan (Note 1) Repayment of loan
- 133
Loans and bills discounted
160
MORI KEN CO., LTD. (Notes 5 and 6)
Construction Non-controlled 0.00%, directly
Loans Loan (Note 1) - Loans and bills discounted
677
*1 An officer of the Bank or his or her relative *2 A company in which an officer or his or her relative owns a majority interest Notes: 1. The terms and conditions of the transactions were the same as those applied to general third parties with which the Bank enters into ordinary
transactions. 2. Mr. Ippei Uchita is a relative of Mr. Keiji Shima, a director and managing executive officer of the Bank. 3. Ms. Kinuko Higuchi is a relative of Mr. Katsuji Higuchi, a statutory auditor of the Bank. 4. A relative of Mr. Yasuhiko Akira, a director and executive officer of the Bank, owns a majority of the voting rights of this company. 5. A relative of Mr. Kazuhiro Yasuyuki, an executive officer of the Bank, owns a majority of the voting rights of this company. 6. The Bank took out a revolving mortgage on its real estate to secure the loans. Information about parent company or significant affiliates
Years ended March 31, 2017 and 2016
Not applicable 27. Subsequent events There are no significant subsequent events to be noted.
─ 41 ─

─ 42 ─