1-3-1 as australian electricity market
DESCRIPTION
Sobre Mercado Australiano de EnergiaTRANSCRIPT
Experiences of the Australian Electricity Market under power disturbances and
financial stress
Dr Brian SpaldingChief Operating officer
2
Overview
Overview of Australia’s National Electricity Market (NEM)
Recent major events in the NEM Power System Financial
Recent Trends in Reform

3
Australia’s National Electricity Marketcovers the Eastern and Southern interconnected electricity system
Scale
0 1,000km
4
NEMMCO – Market and System Operator
NEMMCO is the Market and System Operator for the Eastern and Southern Australia (92% by energy)
NEMMCO• Operate the Market, determines prices and
settles the physical spot market • Operate the Power System, responsible for
power system integrity• Co-ordinates inter-regional transmission
planning• Facilitates the operation of the retail market

5
NEM – The Electricity Market
Gross pool (Compulsory)
Generator production levels and prices are set each 5 minutes by NEMMCO on the basis of offer prices from Generators within a constrained optimisation
30 minute trading interval (Spot) price in each of 6 regions
No physical delivery contracts as financial instruments (over the counter CFDs or hedging contracts, futures contracts) between participants manage the physical spot price risk
NEMMCO settles the cash spot market but does not settle the financial instruments
Annual spot market settlement transactions in 2006/2007 of about AU$11B (US$9.6B)
Settlement is weekly, 4 weeks in arrears (about 33 days accumulation)

6
Settlement for 100% of energy Consumed
Retailers
(hedging contracts)
Financial Market
Settlement for 100% of energy Generated
Generators
Spot Settlement(NEMMCO)
Physical (Spot) Market
NEM - Cash Overview
7
NEM - Market Pricing
The NEM is a constrained real time (5 minutes ex-ante) priced spot market During disturbances prices will be volatile Real time pricing generally aligns with dispatch of generation
Some aspects of NEM design have been developed to drive long term investment but in an emergency can break the linkage of pricing and dispatch When load is shed and cannot be all restored the Market Rules
have the price being set to the Value of Lost Load ($10,000/MWh) There are few reasons to direct generators that are not responding
to Power System needs but when generation is directed – the market is priced as if the direction had not been given
8
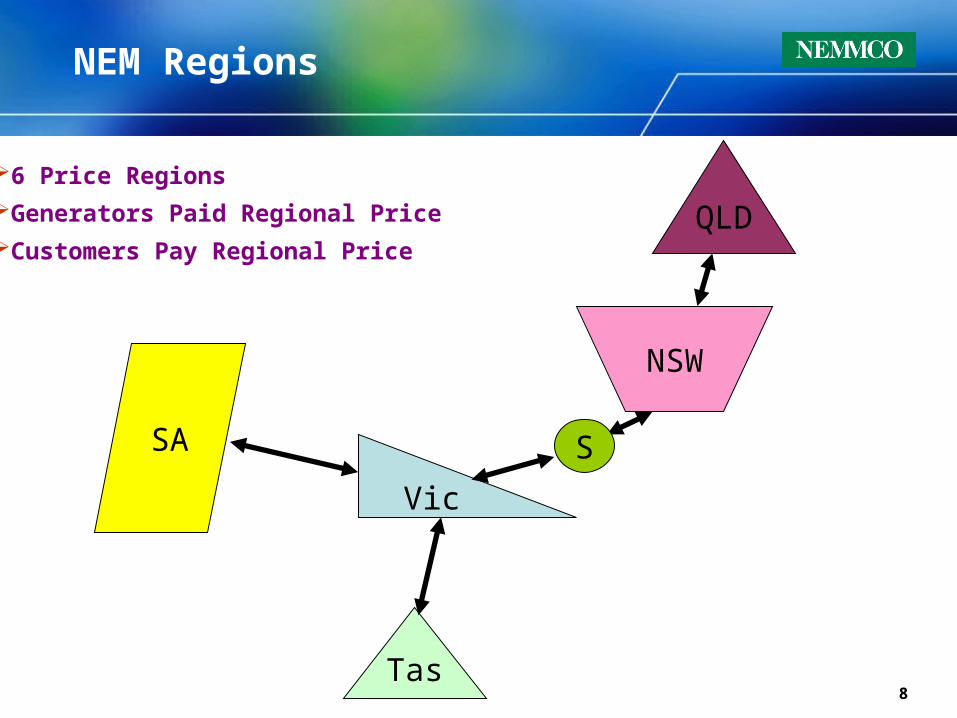
NEM Regions
Tas
Vic
NSW
SA
6 Price Regions
Generators Paid Regional Price
Customers Pay Regional PriceQLD
S

9
Recent NEM Events
NEM performance has been sound over last 9 years. Investment forthcoming Competitive wholesale prices Fierce retail competition
The IEA reported that the NEM is a competitive competitive and effective electricity market
Survived two significant events this year – but not without opportunities for improvement
16 January 2007 – 2,200 MW of customer load interrupted following bushfire transmission line faults
June 2007 – major increase in prices leading to the suspension of a retailer and the invocation of the Retailer of Last Resort process

10
16 January 2007 – Bushfire Event
Bushfires in Victoria for the previous 40 days
Maximum demand for year in Victoria – about 9,200 MW
All interconnectors were at maximum flow into Victoria
Generation reserves adequate
Power System operated to cover for any single contingency
Two single circuit 330kV lines (same easement) from NSW/Snowy to Victoria tripped and locked out of service
Six other transmission lines tripped out of service
System separated into three island systems
Victorian “island” had a major generation deficit
Automatic under-frequency relays interrupted 2,200MW of customer load in Victoria and averted a major disturbance
11
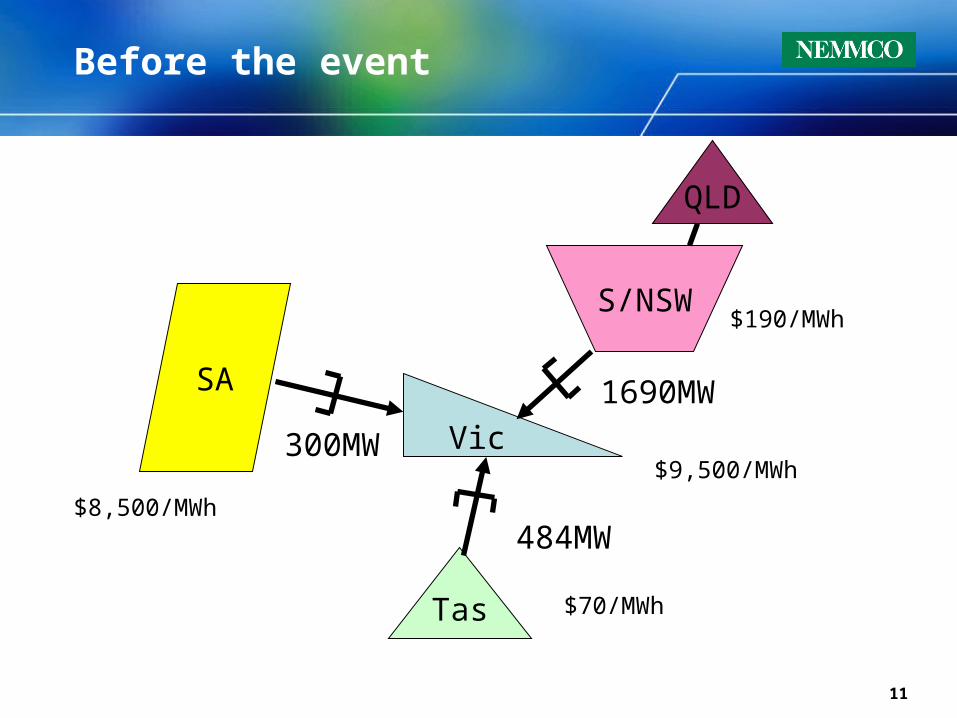
Before the event
Tas
Vic
S/NSW
SA
300MW
1690MW
484MW
$190/MWh
$70/MWh
$8,500/MWh
$9,500/MWh
QLD

12
After the event
Tas
Vic
S/NSW
SA 400MW
200MW
$90/MWh
$60/MWh
$8,500/MWh
$12/MWh2200MW shed
QLD

13
16 January 2007 – Outcomes – System
All transmission line protections operated as designed
The automatic under-frequency load shedding effectively controlled the Victorian low frequency and averted major Victorian collapse
Most power stations maintained capability and contributed to system management
There were no issues with the control of transmission voltages in Victoria during the stabilisation period
South Australia reconnected to Victoria in 40 minutes and all island systems were reconnected in 3 hours (delays as the fire authorities would not give clearance for lines to be restored for fire fighting and safety reasons)
All load restored in 4.5 hours
14
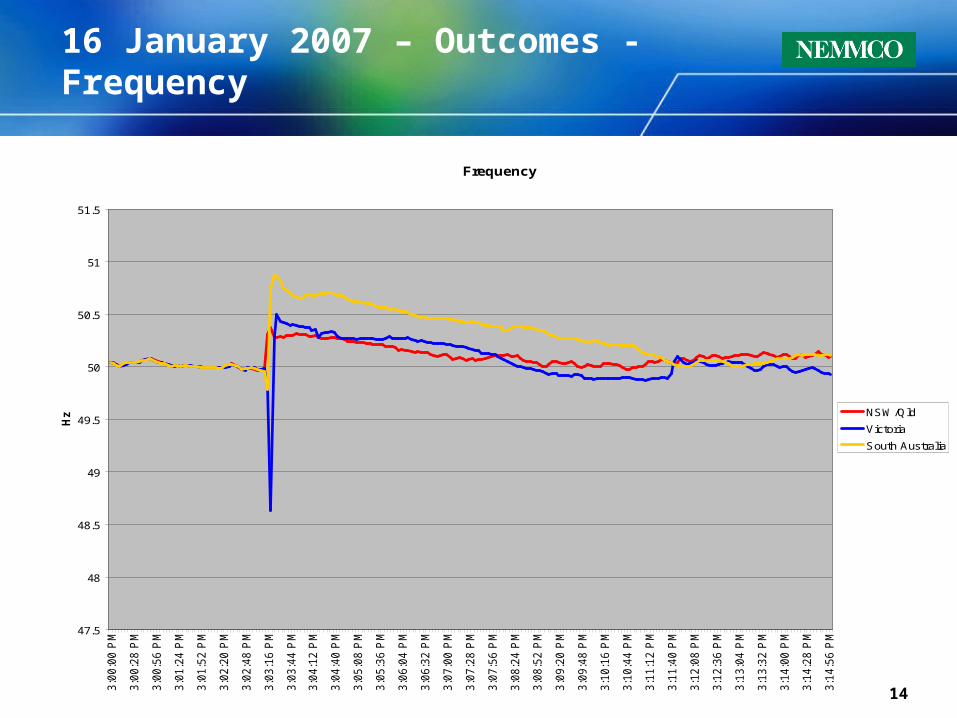
16 January 2007 – Outcomes - Frequency
Frequency
47.5
48
48.5
49
49.5
50
50.5
51
51.5
3:0
0:0
0 P
M
3:0
0:2
8 P
M
3:0
0:5
6 P
M
3:0
1:2
4 P
M
3:0
1:5
2 P
M
3:0
2:2
0 P
M
3:0
2:4
8 P
M
3:0
3:1
6 P
M
3:0
3:4
4 P
M
3:0
4:1
2 P
M
3:0
4:4
0 P
M
3:0
5:0
8 P
M
3:0
5:3
6 P
M
3:0
6:0
4 P
M
3:0
6:3
2 P
M
3:0
7:0
0 P
M
3:0
7:2
8 P
M
3:0
7:5
6 P
M
3:0
8:2
4 P
M
3:0
8:5
2 P
M
3:0
9:2
0 P
M
3:0
9:4
8 P
M
3:1
0:1
6 P
M
3:1
0:4
4 P
M
3:1
1:1
2 P
M
3:1
1:4
0 P
M
3:1
2:0
8 P
M
3:1
2:3
6 P
M
3:1
3:0
4 P
M
3:1
3:3
2 P
M
3:1
4:0
0 P
M
3:1
4:2
8 P
M
3:1
4:5
6 P
M
Hz NSW/Qld
Victoria
South Australia

15
16 January 2007 – Outcomes - Operation
Review the process to determine when to operate the Power System to withstand a multiple contingency event ie when to cover for the loss of two separate 330kV lines
Man machine interface – Challenge to provide Operators with rapid view 8 lines tripped across a wide geographic area 3 islands Took some minutes to be clear on system state
Need to control multiple separate frequency control areas Looking to more flexible systems
Market System flexibility Need to continue to function and dispatch appropriate generation in an
islanded environment
Simulate these events for further training

16
16 January 2007 – Outcomes - Market
Real Time Pricing in emergencies Simplify Rules in an emergency – do not require power
system operators to be considering market impacts during disturbances as they are focused on Power System security
Ensure incentives on generators align with Power System need. By artificially setting a price to the Value of Lost Load regardless of the generator offers can create complex incentives and market outcomes.

17
16 January 2007 – Outcomes
The power system responded well and the event was contained
Some processes can be improved
Some Market design issues need to be reconsidered

18
Financial Event – Drought
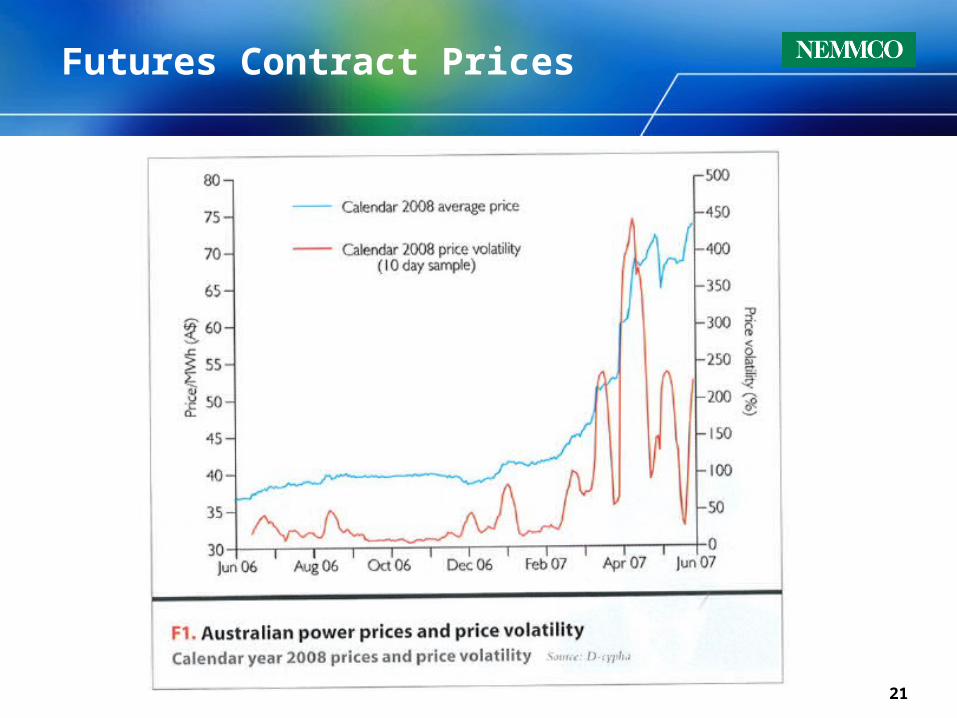
Drought conditions had been worsening over the last 12 months Some thermal generators put on standby to conserve cooling water Most hydro generators with limited water Greater gas fired generation Spot and contract prices up by 80% since January 2007 High volume in futures contract trading High wholesale prices made it difficult to source supply at
reasonable cost Retailer stress due to regulated retail tariffs
NEMMCO commences publishing projected energy assessments in addition to routine capacity (Supply/Demand) assessments
19
Financial Event – June 2007
June 2007 (Winter) was cold in South and East Australia Some record electricity demands but within capability of supply
Large Generator (13% of NEM, 35% of NSW region) bidding behaviour Pricing a substantial portion of its capacity at near VoLL just for
the peak period of the day
June 2007 prices in New South Wales $230/MWh for month (Jun 2006 was $31.47/MWh) 42 half hours greater than $5,000/MWh

20
NEM Market Outstandings
Market Outstanding / MCL since Jan 2007
$0
$500
$1,000
$1,500
$2,000
$2,500
$3,000
$3,500
$4,000
03/0
1/07
10/0
1/07
17/0
1/07
24/0
1/07
31/0
1/07
07/0
2/07
14/0
2/07
21/0
2/07
28/0
2/07
07/0
3/07
14/0
3/07
21/0
3/07
28/0
3/07
04/0
4/07
11/0
4/07
18/0
4/07
25/0
4/07
02/0
5/07
09/0
5/07
16/0
5/07
23/0
5/07
30/0
5/07
06/0
6/07
13/0
6/07
20/0
6/07
27/0
6/07
04/0
7/07
11/0
7/07
18/0
7/07
25/0
7/07
01/0
8/07
Date
Ou
tsta
nd
ing
in $
m
$0
$200
$400
$600
$800
$1,000
$1,200
Wei
gh
ed R
RP
Aggregate of Outstandings Aggregate of Guarantee Market Trading Limit Weighed RRP
Current guarantee $3,055m
Current outstanding $1,161m
21
Futures Contract Prices

22
June 2007 Event
Consequences Small retailer suspended from trading as it could not honour its
customer contracts Two other retailers in obvious financial stress Retailer of Last Resort (RoLR) enacted transferring 6,000
customers to a new retailer following suspension Suspended retailer was co-operative Smooth processes experienced
Opportunities More efficient cash and settlement processes Review length of Settlement cycle Review effectiveness of netting spot and contract settlement Test RoLR for very large customers numbers

23
Trends in Operation and Reform
Renewable Generation Increasing wind generation – greater need for increased
wind generation forecasting, more complex reliability assessment, and network management complexities
Increasing gas generation
Integration of Gas and Electricity Fuel balance implications under periods of heavy gas fired
electricity generation Emergency management of both gas and electricity
incidents Many Retailers involved with both fuels Trend to National market in both fuels Australian Energy Market Operator (AEMO) to be formed
from July 2009 to combine NEMMCO and Gas Markets
24
Trends in Operation and Reform
National Approach to Transmission Planning State planners have clear state reliability obligations No clear obligations to benefit National trading AEMO as a National Transmission Planner
Very large increases in data movement between the industry Interval meter role out Retail customer churn – 25-30% in Victoria and South
Australia B2B transactions

25
Overview
Overview of Australia’s National Electricity Market (NEM) Real time constrained gross market
Recent major events of the NEM Tested process and showed opportunities for improvement
Recent Trends in Reform Closer linkages between electricity and gas