1 a learning-based approach to confident event …gzhou/files/watchdog_tosn14.pdfa learning-based...
TRANSCRIPT

1
A Learning-based Approach to Confident Event Detection inHeterogeneous Sensor Networks
MATTHEW KEALLY, College of William and MaryGANG ZHOU, College of William and MaryGUOLIANG XING, Michigan State UniversityDAVID T. NGUYEN, College of William and MaryXIN QI, College of William and Mary
Wireless sensor network applications, such as those for natural disaster warning, vehicular traffic monitor-ing, and surveillance, have stringent accuracy requirements for detecting or classifying events and demandlong system lifetimes. Through quantitative study, we show that existing event detection approaches arechallenged to explore the sensing capability of a deployed system and choose the right sensors to meetuser-specified accuracy. Event detection systems are also challenged to provide a generic system that effi-ciently adapts to environmental dynamics and works easily with a range of applications, machine learningapproaches, and sensor modalities. Consequently, we propose Watchdog, a modality-agnostic event detec-tion framework that clusters the right sensors to meet user-specified detection accuracy during runtimewhile significantly reducing energy consumption. Watchdog can use different machine learning techniquesto learn the sensing capability of a heterogeneous sensor deployment and meet accuracy requirements. Toaddress environmental dynamics and ensure energy savings, Watchdog wakes up and puts to sleep sensorsas needed to meet user-specified accuracy. Through evaluation with real vehicle detection trace data anda building traffic monitoring testbed of IRIS motes, we demonstrate the superior performance of Watchdogover existing solutions in terms of meeting user specified detection accuracy, energy savings, and environ-mental adaptability.
Categories and Subject Descriptors: C.3 [Special Purpose and Application-based Systems]: Real-Timeand Embedded Systems
General Terms: Design, Algorithms, Performance
Additional Key Words and Phrases: Wireless sensor networks, sensing, event detection, classification, ma-chine learning
ACM Reference Format:Keally, M., Zhou, G., Xing, G., Nguyen, D. T., Qi, X. 2012. A Learning-based Approach to Confident EventDetection in Heterogeneous Sensor Networks. ACM Trans. Sensor Netw. 1, 1, Article 1 (January 2012), 28pages.DOI = 10.1145/0000000.0000000 http://doi.acm.org/10.1145/0000000.0000000
1. INTRODUCTIONWireless sensor network deployments have been widely used for event detection in mil-itary surveillance [He et al. 2006], environmental and wildlife monitoring [Mo et al.2009; Dyo et al. 2010], as well as vehicle tracking [Duarte and Hu 2004]. These event
A preliminary version of this work was published in IEEE RTAS 2010.This work was supported in part by NSF grants ECCS-0901437 and CNS-0916994.Author’s addresses: M. Keally, G. Zhou, D. T. Nguyen, and X. Qi, Computer Science Department, College ofWilliam and Mary; G. Xing, Department of Computer Science and Engineering, Michigan State University.Permission to make digital or hard copies of part or all of this work for personal or classroom use is grantedwithout fee provided that copies are not made or distributed for profit or commercial advantage and thatcopies show this notice on the first page or initial screen of a display along with the full citation. Copyrightsfor components of this work owned by others than ACM must be honored. Abstracting with credit is per-mitted. To copy otherwise, to republish, to post on servers, to redistribute to lists, or to use any componentof this work in other works requires prior specific permission and/or a fee. Permissions may be requestedfrom Publications Dept., ACM, Inc., 2 Penn Plaza, Suite 701, New York, NY 10121-0701 USA, fax +1 (212)869-0481, or [email protected]© 2012 ACM 1550-4859/2012/01-ART1 $10.00
DOI 10.1145/0000000.0000000 http://doi.acm.org/10.1145/0000000.0000000
ACM Transactions on Sensor Networks, Vol. 1, No. 1, Article 1, Publication date: January 2012.

1:2 M. Keally et al.
detection scenarios usually require high accuracy to achieve application goals. For ex-ample, urban planners may wish to monitor traffic flow at a troublesome intersection[Duarte and Hu 2004] with less than 5% false positive and false negative vehicle de-tection rates. A high false positive rate may precipitate a costly and unneeded roadexpansion. Similarly, a high false negative rate in detection may cause the plannersto cancel a proposed road expansion, leading to worsening traffic conditions. Such anevent detection application must meet a user’s event detection accuracy requirementswith a long deployment lifetime. When a framework makes event detection decisionsthat meet a user’s accuracy requirements in terms of desired false positive and falsenegative rates, we say it is confident. Several challenges exist to provide a confidentevent detection framework:
— How to find the most energy efficient sensor clusters that meet user accuracy re-quirements? Previous work [He et al. 2006] has shown that clustering sensors cansignificantly improve detection accuracy over individual sensors. How to explore thedetection capability of a specific deployment through clustering sensors and choosethe right sensor clusters to save energy and meet the user requirements?
— How to create a generic solution that can work easily and efficiently with a widerange of deployments, sensor modalities, and machine learning methods? Since manyreal deployments use multiple modalities, using different event detection solutionsfor each modality can be difficult. How to perform efficient collaboration among het-erogeneous sensors that works in a generic context?
— How to efficiently adapt to environmental dynamics? A small energy efficient clus-ter of sensors may be sufficient to meet user requirements most of the time. Some-times, however, more detection capability may be required, prompting collaborationbetween lower power and higher power clusters to meet user requirements and saveenergy. Clusters and machine learning detection models may also need to be updatedduring runtime.
Existing approaches for event detection do not provide a holistic solution with re-spect to addressing these challenges. Some approaches, such as sensing coverage [Yanet al. 2003; Hwang et al. 2007], ignore the sensing capability differences among differ-ent sensors and sensor clusters, and hence do not cluster the right sensors to meet userdetection requirements. Other approaches do not work in heterogeneous sensor deploy-ments, such as data fusion-based modality-specific sensing models [Chakrabarty et al.2002; Yuan et al. 2008]. Other sensing models [Rachlin et al. 2005; Wang et al. 2004]ignore different sensing modalities and event detection methods altogether by usingabstract fidelity functions. Other approaches, such as those that use machine learn-ing [Benbasat and Paradiso 2007] or aggregation [Deshpande et al. 2004], attempt tocapture the sensing capability differences among different sensors but do not provideconfidence.
In this paper, we first show that existing approaches have difficulty capturing thesensing capability of different sensors and clusters and demonstrate that the capabilityof a specific deployment must be fully explored to efficiently meet user requirements.Consequently, we propose Watchdog, an event detection framework which explores thedetection capability of a specific deployment and chooses the right sensors to meetaccuracy requirements. We investigate several machine learning methods that ourgeneric approach can use for event detection in heterogeneous sensor deployments.To adapt to environmental dynamics, Watchdog uses an energy efficient sentinel sen-sor cluster to make easy event detection decisions. When the sentinel cluster cannotmake a confident decision, a more capable reinforcement sensor cluster ensures theuser requirements are met. When persistent changes in the environment are detected
ACM Transactions on Sensor Networks, Vol. 1, No. 1, Article 1, Publication date: January 2012.
A Learning-based Approach to Confident Event Detection in Heterogeneous Sensor Networks 1:3
which significantly impact meeting user accuracy requirements, we update the detec-tion models during runtime and form new clusters. Our main contributions are:
— With trace data from a vehicle detection application, we show the drawbacks of ex-isting solutions and motivate the need for a confident event detection framework.
— We propose Watchdog, a generic event detection framework which clusters the rightsensors to enforce user-defined event detection accuracy during runtime.
— Watchdog efficiently adapts to environmental dynamics by requesting only the sens-ing capability needed to meet user requirements and updating clusters when userrequirements can no longer be met.
— We evaluate Watchdog in two scenarios: a vehicle detection application using realtrace data and a building traffic monitoring application using IRIS motes. Watchdogcan meet user-specified accuracy with reduced energy usage, while in many casesexisting solutions cannot.
The rest of this paper is organized as follows: We present related work in Section 2and motivate our Watchdog design in Section 3. We describe our detailed Watchdogdesign in Section 4 and present its performance evaluation in Section 5. Finally, wepresent conclusions in Section 6.
2. RELATED WORKMany sensing and event detection works ignore both user accuracy requirements aswell as the sensing capability differences among different sensors and sensor clusters.In sensing coverage approaches [Xing et al. 2005; Yan et al. 2003; Abrams et al. 2004;Hsin and Liu 2004; Kumar et al. 2005], energy savings is emphasized by ensuring atleast one node is awake to cover a detection location, leaving all other nodes asleep.Due to sensing irregularity [Hwang et al. 2007], these coverage approaches may un-derestimate or overestimate the coverage needed to provide confident event detection.Such coverage approaches may also assume each sensor exhibits a disc-shaped sens-ing radius [Ermis and Saligrama 2005; Wang et al. 2006; Shrivastava et al. 2006;Chakrabarty et al. 2002; Giusti et al. 2009]. Other works [Dutta et al. 2005; Mali-nowski et al. 2008] use thresholds per modality to perform detection. Modality in thecontext of this work represents a reference to sensor types. Finally, the recent work by[Faulkner et al. 2013] proposes a sparse coding based approach to accurately aggre-gate event detection decisions from sensors in large networks. In contrast, Watchdogaddresses the problems of how to select sensors for confident event detection and howto locally aggregate sensor readings to save transmission energy.
Other works attempt to meet user detection accuracy requirements throughmodality-specific sensing models and data fusion-based [Varshney 1996] collaborationapproaches. However, these models must train each sensor modality individually, mak-ing collaboration difficult in heterogeneous deployments. Signal attenuation modelsare used in [Yuan et al. 2008; Xing et al. 2009; Simon et al. 2004; Volgyesi et al. 2007;Bisnik et al. 2006; Yang et al. 2008], which give a false positive rate and false negativerate for a given modality and set of training data, allowing for data fusion betweenmultiple sensors. Other sensing models are used for cameras [Isler and Bajcsy 2005],accelerometers [Hackmann et al. 2008], as well as magnetic and PIR sensors [Gu et al.2005]. Other works [Rachlin et al. 2005; Wang et al. 2004; Zhao et al. 2002] provide anabstract sensing fidelity function which leaves out details on the sensing modalitiesused as well as how sensing and detection is performed.
Some approaches attempt to address sensing capability differences among differentsensors but do not provide sensing confidence. Some sensing models do not focus onevent detection or classification, instead facilitating sensor data querying [Deshpandeet al. 2004] or aggregation [Zhuang et al. 2007; Subramaniam et al. 2006] in a sensor
ACM Transactions on Sensor Networks, Vol. 1, No. 1, Article 1, Publication date: January 2012.

1:4 M. Keally et al.
network. Other works use machine learning, such as feature classification [Erikssonet al. 2008; Kang et al. 2008; Lorincz et al. 2008; Benbasat and Paradiso 2007; Green-stein et al. 2006], Hidden Markov Models [Ganti et al. 2006; Singh et al. 2008], or both[Zappi et al. 2008].
Lastly, in [Keally et al. 2010], we demonstrate that unlike other approaches, we canmeet user accuracy requirements by exploring sensing capability differences amongdifferent sensors and sensor clusters. The use of both generative and discriminativeevent detection techniques is demonstrated in [Hill et al. 2007; Hill et al. 2009; Lerner2002]. However, in this paper, we also explore the effect of different machine learningapproaches on meeting user requirements and energy usage, provide further adapt-ability to environmental dynamics, and present an additional energy saving approachby limiting radio transmissions. Unlike other works which provide high level systemsfor sensing and data routing [Deshpande et al. 2004; Zhuang et al. 2007; Zhao et al.2002], we focus exclusively on exploring and capturing sensing capability and cluster-ing the right sensors to meet user accuracy requirements. The recent work by [Krauseet al. 2011] studies the problem of optimal sensor placement, and we are aware that itmay assist accurate event classification, but our main goal in this paper is to clusterthe right sensors to perform confident event detection.
3. MOTIVATION
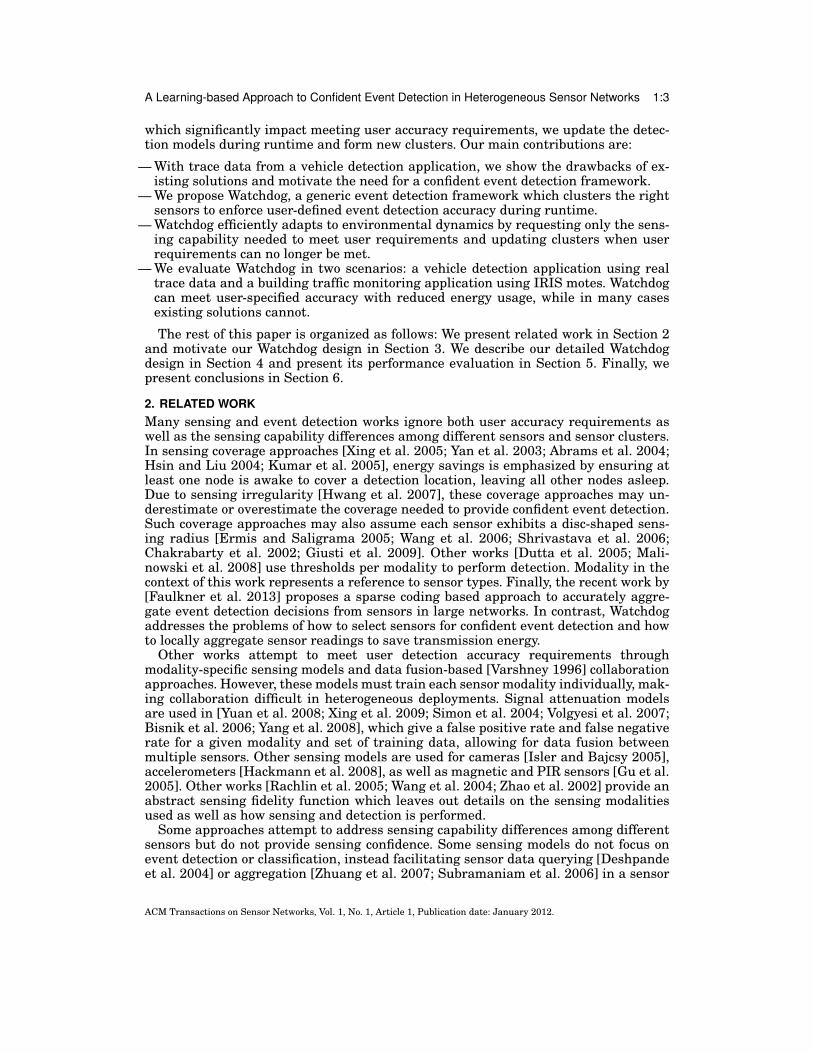
(a) Individual acoustic sensors, labeled by accuracy. (b) Sensor clusters: with 100% accuracy.
Fig. 1. Event detection performance with vehicle trace data. The target location is marked by the “X” onthe road.
In this section, we demonstrate the need for a new approach to confident event detec-tion with reduced energy consumption by showing that performance differences amongdifferent sensors and sensor clusters cannot be ignored. Our goal is to provide confidentevent detection at a critical point, such as monitoring vehiclular traffic flow, detectingsoldiers crossing a bridge, or detecting natural disasters, such as an earthquake. As anexample, we use the Wisconsin SensIT experiment [Duarte and Hu 2004] to performvehicle detection at a specific location. The SensIT experiment consists of a 23 nodenetwork with acoustic, seismic, and infrared sensors. Vehicles make 20 passes along aroad through the network with ground truth provided by a GPS trace. Trace data ofraw sensor energy is provided for each sensor at a raw sampling rate of 4960Hz. Weprovide this unmodified real sensor data and ground truth as input to a Java-basedtrace-driven wireless sensor network simulation run on a PC. While the sensor dataand ground truth is real, we simulate communication for low power mote class deviceswith 802.15.4 radios, such as the Crossbow IRIS [CROSSBOW ]. While we are awarethat radio communication can be lossy in wireless sensor networks, in this paper we
ACM Transactions on Sensor Networks, Vol. 1, No. 1, Article 1, Publication date: January 2012.

A Learning-based Approach to Confident Event Detection in Heterogeneous Sensor Networks 1:5
focus on sensing accuracy, not communication quality, and assume reliable communi-cation.
Using the trace data, we define a target location at the “X” along the road in Figure1. Data is aggregated into time intervals of 100ms length for a total length of 6763 in-tervals. At each interval, we classify sensor and sensor cluster data into events whenthe vehicle is present within 2 meters of the target location and non-events when thevehicle is farther away or not present. With this in mind, we determine vehicle detec-tion accuracy for individual sensors and sensor clusters using the method we presentin Section 4.3 and we plot the results in Figure 1, highlighting the impact on existingsolutions.
In Figure 1 (a), we first observe that sensors with the same distance to the targetlocation may exhibit different detection accuracies. For example, nodes 41 and 50 areboth 80m from the target location, but their detection accuracies are different, 93% and56%, respectively. This is because while accuracy generally decreases with distancefrom the target location, terrain changes and environmental conditions still produceirregularities in sensor performance, which is consistent with the findings in [Hwanget al. 2007]. This observed sensing irregularity can cause modality-specific sensingmodels to suffer, such as [Yuan et al. 2008]. For example, a signal attenuation modelfor acoustic sensors [Yuan et al. 2008] derives the same acoustic signal receiving powerfor sensors with the same distance to the target location. Therefore, the same detec-tion accuracy is statistically derived for nodes with the same distance (node 41 and 50in our example). This signal attenuation model cannot articulate the accuracy differ-ences among sensors, such as determining which sensor is 93% accurate and which is56% accurate in our example. For this reason, the system performance suffers and therequired detection accuracy can not always be met, which we further demonstrate inSection 5.3.
In Figure 1 (a), we also observe that not all sensors within the 25m sensing rangeprovide the same detection accuracy. For example, even though both node 60 and 54are within the 25m sensing range of the target location, they have different detec-tion accuracies, 93% and 86%, respectively. This observed sensing difference can causesensing coverage-based schemes to suffer. For example, in [He et al. 2006], only one ofmultiple sensors with the sensing range is enabled at a time to provide sensor coverage(or 1-coverage) for energy savings. For our example, this means that either node 60 or54 can be turned on to provide such 1-coverage. However, it is clear that using node60 will provide 7% points better accuracy than with node 54. Unfortunately, sensingcoverage schemes have no knowledge of such subtle but important detection accuracydifferences, and hence cannot provide confident event detection.
Figure 1 (b) illustrates that different sensor clusters are able to provide the samedetection accuracy. For example, clusters C1, C2, and C3 (consisting of different sensormodalities) can all provide 100% detection accuracy even though individual sensorscannot. As shown in [Xing et al. 2009], clustering sensors can produce a synergisticeffect, allowing sensors with complimentary detection strengths in different scenariosto collaborate. Exploring the detection capability of a deployment by evaluating theperformance of different sensor clusters allows the most energy efficient clusters to bechosen to confidently detect events. However, such exploration is not achieved by ex-isting works and thus user-defined accuracy requirements cannot be met with reducedenergy usage.
From the trace data analysis, it is very clear that existing approaches have difficultymeeting user required detection accuracy. This is due to lack of detailed detection accu-racy knowledge of individual sensors and sensor clusters. Therefore, it is imperative todesign a scheme that can provide confident event detection with user-defined accuracy,address in-situ sensing reality, and reduce energy usage.
ACM Transactions on Sensor Networks, Vol. 1, No. 1, Article 1, Publication date: January 2012.

1:6 M. Keally et al.
4. WATCHDOG DESIGN
Fig. 2. Watchdog design.
Before we elaborate the details of our Watchdog system, we provide a list of sensorterminology used in the text.
— Node: a sensing unit with limited computational capability— Aggregator: a unit with advanced computational capability that provides event de-
tection based on information from the nodes— Cluster: a group of sensor nodes— Sentinel Sensors: a cluster of low-power sensors that is used for simple event detec-
tion decisions— Reinforcement Sensors: a cluster of high-power sensors that is used for complex event
detection decisions
In our Watchdog architecture, depicted in Figure 2, computationally limited nodeswith sensors are connected through a wireless link to a more powerful aggregator, suchas a mobile phone. Nodes collect sensor data and return observations to the aggregatorwhich makes event detection decisions. Our architecture is structured to solve thechallenges that arise from providing confident event detection through the use of themodules we describe below and elaborate upon in the following subsections.
The Local Aggregation module, located on sensor nodes, is used to provide efficientcollaboration between heterogeneous sensors. Sensor data is aggregated such that ob-servations from different sensor modalities can be compared and easily fused at theaggregator to make cluster-level detection decisions.
In Cluster Generation, we explore the detection capability of a deployment by deter-mining the detection capabilities of individual sensors and sensor clusters within thedeployment. We use machine learning to perform event detection and determine train-ing accuracy of heterogenous sensor clusters. In Section 4.2, we apply several machinelearning techniques to our generic design which we also evaluate in Section 5.
In Sentinel and Reinforcement Selection, clusters are selected that meet user de-tection requirements and adapt to changes in environmental dynamics. Using the de-ployment detection capability determined by Cluster Generation, a subset of that ca-pability is selected such that the user requirements can be met. A cluster of low-powersentinel sensors is selected to meet the user detection requirements for many runtimeobservations, when event detection decisions are easy. For more difficult event detec-tion decisions where more detection capability is needed, a cluster of reinforcementsensors is selected to ensure the user detection requirements are met.
In Runtime Event Detection, the detection capability is adapted to runtime observa-tions using the clusters selected in Sentinel and Reinforcement Selection. Specifically,a low-power set of sentinel sensors make easy event detection decisions to meet user
ACM Transactions on Sensor Networks, Vol. 1, No. 1, Article 1, Publication date: January 2012.

A Learning-based Approach to Confident Event Detection in Heterogeneous Sensor Networks 1:7
accuracy requirements. When the sentinel sensors determine that more detection ca-pability is needed, a second set of reinforcement sensors are used to make a confidentdetection decision.
With Online Retraining, described in Section 4.7, Watchdog is able to detect signif-icant changes in environmental dynamics which cannot be captured by the existingsentinels and reinforcement clusters. When such changes are detected, new observa-tions are labeled with ground truth and new clusters are generated to ensure userrequirements are met. We now describe each design module in detail:
4.1. Local AggregationOn a sensor node, the Local Aggregation module allows nodes to aggregate data locallyat regular intervals, allowing for reduced radio communication and heterogeneous sen-sor fusion. The module is flexible to allow incorporation of different widely used aggre-gation algorithms. In our vehicle detection scenario, for each sensor, our aggregationmethod returns the normalized sample variance of the raw sensor data (sampled at4960 Hz) every 100ms. In this aggregation algorithm, presented in [Duarte and Hu2004], each raw sensor sample is represented as a 16-bit integer and divided by 32767(216 − 1) for the normalization. The normalized sample variance is the variance of allnormalized raw sensor samples. The normalized sample variance is returned becauseit amplifies the changes in the raw data samples that occur when a vehicle is nearby.The aggregation interval length is selected such that an event can be captured.
For sensor j, and aggregation interval t, aggregated sensor data is represented asobservation Oj,t. The aggregator fuses observations from each sensor j in a sensorcluster Ci to form an observation OCi,t for that cluster. The fused observations canthen be used by the aggregator to determine sensor cluster accuracy or make runtimedetection decisions. We describe how sensor observations are fused together in Section4.2, as different approaches are used for each detection algorithm.
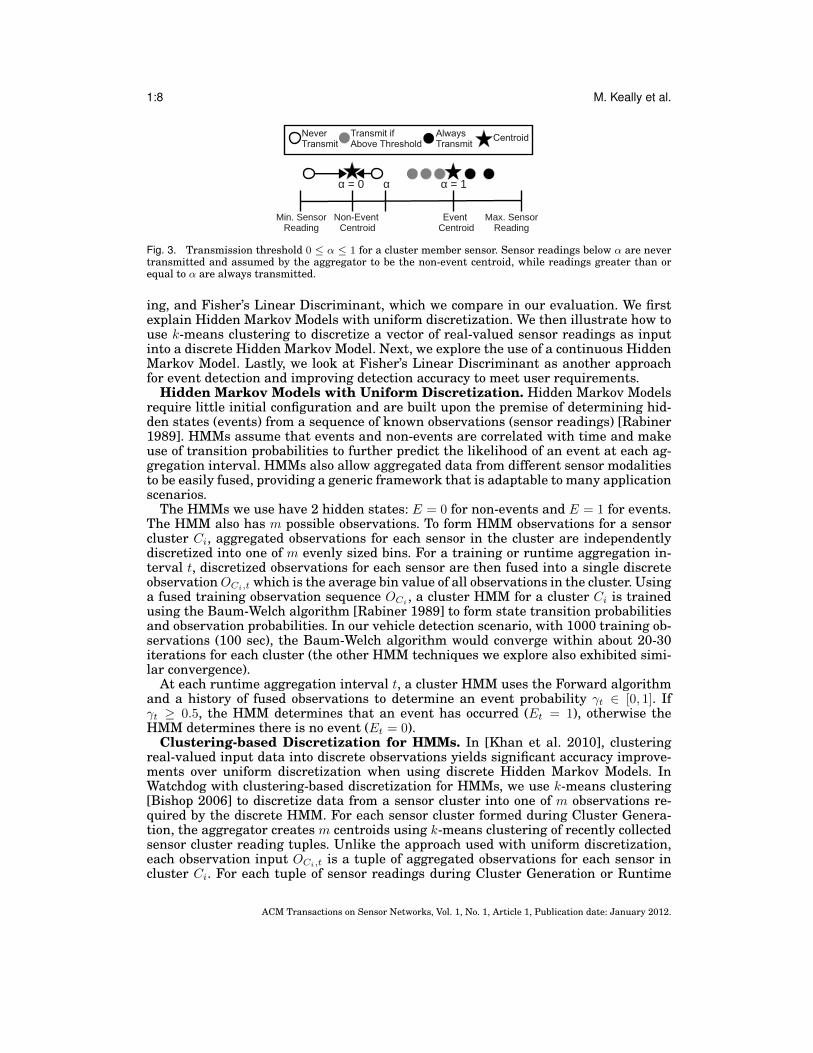
Transmission Energy Savings. From training observations, a default observa-tion value is determined for each sensor, which is associated with non-events. To saveenergy, a node only transmits observations when at least one of its sensors makes anon-default observation that is above the configured transmission threshold values.The aggregator is the receiver of non-default observations. At each aggregation inter-val, if the aggregator does not receive an observation from a sentinel or reinforcementsensor, it assumes the default observation value.
Since our original approach for transmission energy savings in [Keally et al. 2010]requires discrete sensor data, we expand on this to allow for machine learning methodsthat continuous data as input. We implement a bandwidth and energy saving approachvia a transmission threshold defined for each sensor. Using training observations andlabeled ground truth for each observation, each sensor computes a non-event and eventcentroid during initial training and when clusters are updated. The non-event centroidvalues are transmitted to the aggregator during the cluster generation process.
A system-defined transmission threshold, α, depicted in Figure 3, resides betweenthe non-event and event centroids for each cluster member sensor. If a member sen-sor reading falls below the threshold, the reading is not transmitted to the aggregator.Therefore, if the aggregator does not receive a data sample from a cluster member sen-sor, it assumes the non-event centroid reading for that sensor when forming a clusterobservation. We show the effectiveness of this threshold in our evaluation in terms ofenergy consumption and accuracy.
4.2. Machine Learning ExplorationTo discriminate events from non-events, Watchdog can make use of many machinelearning techniques, however, we focus on Hidden Markov Models, k-means cluster-
ACM Transactions on Sensor Networks, Vol. 1, No. 1, Article 1, Publication date: January 2012.
1:8 M. Keally et al.
Fig. 3. Transmission threshold 0 ≤ α ≤ 1 for a cluster member sensor. Sensor readings below α are nevertransmitted and assumed by the aggregator to be the non-event centroid, while readings greater than orequal to α are always transmitted.
ing, and Fisher’s Linear Discriminant, which we compare in our evaluation. We firstexplain Hidden Markov Models with uniform discretization. We then illustrate how touse k-means clustering to discretize a vector of real-valued sensor readings as inputinto a discrete Hidden Markov Model. Next, we explore the use of a continuous HiddenMarkov Model. Lastly, we look at Fisher’s Linear Discriminant as another approachfor event detection and improving detection accuracy to meet user requirements.
Hidden Markov Models with Uniform Discretization. Hidden Markov Modelsrequire little initial configuration and are built upon the premise of determining hid-den states (events) from a sequence of known observations (sensor readings) [Rabiner1989]. HMMs assume that events and non-events are correlated with time and makeuse of transition probabilities to further predict the likelihood of an event at each ag-gregation interval. HMMs also allow aggregated data from different sensor modalitiesto be easily fused, providing a generic framework that is adaptable to many applicationscenarios.
The HMMs we use have 2 hidden states: E = 0 for non-events and E = 1 for events.The HMM also has m possible observations. To form HMM observations for a sensorcluster Ci, aggregated observations for each sensor in the cluster are independentlydiscretized into one of m evenly sized bins. For a training or runtime aggregation in-terval t, discretized observations for each sensor are then fused into a single discreteobservationOCi,t which is the average bin value of all observations in the cluster. Usinga fused training observation sequence OCi , a cluster HMM for a cluster Ci is trainedusing the Baum-Welch algorithm [Rabiner 1989] to form state transition probabilitiesand observation probabilities. In our vehicle detection scenario, with 1000 training ob-servations (100 sec), the Baum-Welch algorithm would converge within about 20-30iterations for each cluster (the other HMM techniques we explore also exhibited simi-lar convergence).
At each runtime aggregation interval t, a cluster HMM uses the Forward algorithmand a history of fused observations to determine an event probability γt ∈ [0, 1]. Ifγt ≥ 0.5, the HMM determines that an event has occurred (Et = 1), otherwise theHMM determines there is no event (Et = 0).
Clustering-based Discretization for HMMs. In [Khan et al. 2010], clusteringreal-valued input data into discrete observations yields significant accuracy improve-ments over uniform discretization when using discrete Hidden Markov Models. InWatchdog with clustering-based discretization for HMMs, we use k-means clustering[Bishop 2006] to discretize data from a sensor cluster into one of m observations re-quired by the discrete HMM. For each sensor cluster formed during Cluster Genera-tion, the aggregator creates m centroids using k-means clustering of recently collectedsensor cluster reading tuples. Unlike the approach used with uniform discretization,each observation input OCi,t is a tuple of aggregated observations for each sensor incluster Ci. For each tuple of sensor readings during Cluster Generation or Runtime
ACM Transactions on Sensor Networks, Vol. 1, No. 1, Article 1, Publication date: January 2012.
A Learning-based Approach to Confident Event Detection in Heterogeneous Sensor Networks 1:9
Event Detection, the aggregator determines which of the m centroids is closest to thetuple. For a cluster Ci, the centroid index is used as the current observation input tothe Baum-Welch algorithm for HMM training or the Forward algorithm for RuntimeEvent Detection.
Continuous HMMs. In using a continuous Hidden Markov Model, we remove therequirement for discretization of sensor data. A cluster of sensors has a large numberof possible reading combinations which must be discretized into a small number ofobservations. Using continuous Hidden Markov Models [Rabiner 1989] with Gaussiandistributions, we can preserve the granularity of the original sensor readings whenproviding training and runtime observation input. As with the clustering-based HMM,raw sensor readings for each generated cluster are collected by the aggregator andthen fed as tuples into the Baum-Welch algorithm for HMM training or the Forwardalgorithm for detecting events in Runtime Event Detection. Also like the k-means ap-proach, each observation input OCi,t for a cluster Ci at aggregation interval t is a tuplerather than a single discrete value.
Algorithm 1 Cluster GenerationInput: Set of all sensors in network N , user-defined false positive rate ufp and neg-
ative rate ufn, training observations O = {OCi,t|Ci ⊂ N, 1 ≤ t ≤ T}, ground truthG = {Gt|1 ≤ t ≤ T}, number of clusters for each cluster size M
Output: Set of clusters C = {Ci|Ci ⊂ N}Randomly generate M clusters for each size k(1 ≤ k ≤ |N | − 1), add to Cfor all clusters Ci ∈ C do
Train event detection model for Ci using OCi
for Aggregation interval t(1 ≤ t ≤ T ) doDetermine event probability γt using Ci and OCi
if γt ≥ .5 then Et = 1 else Et = 0Compare system event decision Et with Gt
Update fn(Ci), fp(Ci), fn(Ci, γt), fn(Ci, γt)end for
end for
Fisher’s Linear Discriminant. While Hidden Markov Models can capture the cor-relation of events with time as well as the correlation of events with different clus-ter observations, HMMs cannot fully capture the data dependencies between differ-ent sensors in a cluster. To address this concern, we also implement Fisher’s LinearDiscriminant [Bishop 2006], which attempts to find a projection (i.e. linear combina-tion) of sensor cluster readings that maximizes the separation of event readings fromnon-event readings. As with clustering-based HMMs and continuous HMMs, the ag-gregator forms a tuple of aggregated observations from each sensor in a cluster to pro-vide input for training and runtime detection. However, like the uniform discretizationHMMs, each individual sensor reading in an observation tuple OCi,t is uniformly dis-cretized into one of m values. This discretization allows for the construction of discreteobservation distributions for each sensor which are then used to partition event andnon-event training data. We note that the model-driven scheme assumes Gaussian-distributed sensor readings, which we show in Section 3 and Section 5 does not workwell due to the properties of each specific sensor deployment, such as wind, terrain,differences in sensor hardware, sensor placement, and other background noise.
Once a partition is found during training that best separates the event observationsfrom the non-event observations, all training observations are projected onto the line
ACM Transactions on Sensor Networks, Vol. 1, No. 1, Article 1, Publication date: January 2012.
1:10 M. Keally et al.
perpendicular to the partition to determine event and non-event centroids. New ob-servations are then projected onto the same line and are classified by determining thenearest centroid. Like the other HMMs, we can also determine an event probability γfor an observation by comparing the distances between the projected observation andthe centroids.
4.3. Cluster GenerationIn Cluster Generation, we determine the detection capabilities of individual sensorsand different sensor clusters, exploring the detection capability of a specific deploy-ment. To do this, we generate sensor clusters of each possible size, ranging from size1 for individual sensors to a cluster consisting of all available sensors. Using machinelearning, we train a detection model and determine accuracy for each cluster usingsensor training data labeled with event ground truth. We explain the cluster genera-tion process in further detail using Algorithm 1.
With N sensors in a network, to completely explore the network detection capability,we ideally would generate all possible clusters from size 1 to |N |. However, since com-puting resources are limited, we compute M random clusters of each possible size fromwhich to choose sentinels and reinforcements. By computing a fixed number of clus-ters for each size, our exploration approach is comparable in computational efficiencyand effectiveness as more advanced feature selection approaches such as simulatedannealing [Kirkpatrick et al. 1983] [Cerny 1985].
For each generated cluster Ci in the set C of all generated clusters, we train a ma-chine learning detection model. A model for each cluster is trained using a sequence oftraining observations OCi and truth labels for each training observation G. Trainingobservations for each sensor as well as ground truth are collected before runtime or fora short period during a runtime update.
With a trained detection model for each cluster, we can determine a cluster’s eventdecision Et for each aggregation interval t. Et is derived from the cluster’s event prob-ability γt at each training aggregation interval t. As previously explained, the clus-ter determines an event occurred at interval t (Et = 1) if γt ≥ .5 and no event oc-curred (Et = 0) if γt < .5. We can then use the cluster’s event decision sequenceE = {Et|1 ≤ t ≤ T} to compare with known ground truth G = {Gt|1 ≤ t ≤ T} ateach aggregation interval to determine cluster training accuracy. If, at aggregation in-terval t, the event detection decision is equal to the ground truth (Et = Gt), then thecluster made a correct decision at t. Otherwise, the decision was a false positive orfalse negative.
Event Probability Discussion. We can compute the overall accuracy for each clus-ter Ci by comparing all event detection decisions Et to ground truth Gt to determinethe overall false negative rate fn(Ci) and the overall false positive rate fp(Ci). How-ever, a cluster with an overall low false positive or false negative rate may have allits incorrect decisions result from event probabilities that hover near .5. During run-time detection, it is likely that an event probability near .5 will result in an incorrectdecision. Consequently, it is beneficial to differentiate the accuracies between eventprobabilities. During runtime detection, possible bad decisions made by sentinels dueto middle-range event probabilities can be caught and reinforcements can be used tomeet the user requirements.
To study the correlation between event probability and detection accuracy, for eachcluster Ci, we break down each training event probability γt into p ranges of size1/p. For each range we compute false positive rates fp(Ci, γ) and false negative ratesfn(Ci, γ). Figure 4 shows an event probability breakdown of a cluster Ci from the Wis-consin vehicle trace data with 97% overall accuracy with p = 10 probability ranges.From the figure, it is clear that all negative event decisions have an event probabil-
ACM Transactions on Sensor Networks, Vol. 1, No. 1, Article 1, Publication date: January 2012.

A Learning-based Approach to Confident Event Detection in Heterogeneous Sensor Networks 1:11
Fig. 4. Event probability breakdown for a cluster Ci with a 6% overall false positive rate and no overallfalse negative rate. For each .1 event probability range, the associated false positive rate fp(Ci, γ) and falsenegative rate fn(Ci, γ) are shown as bars. All ranges that have no observations yield a false positive or falsenegative rate of 1, since no accuracy can be determined for that range and hence we assume the worst.
ity in the [0, .1) and [.2, .3), ranges, while all event decisions have a probability in the[.9, 1] range. During runtime detection, the event probability breakdown for the sen-tinel cluster is used to determine if an event probability γt does not meet user falsepositive and false negative requirements and that reinforcement observations shouldbe collected to make a confident decision. Since the scenarios we evaluate only return afinite and discrete number of event prediction probabilities (refer to Section 5.1), usingbins does not significantly impact the error analysis.
Algorithm 2 Sentinel and Reinforcement SelectionInput: Set of all sensors in network N , set of trained clusters C, user-defined false
positive rate ufp and negative rate ufnOutput: Sentinel sensors s, Reinforcement sensors r
/*Sentinel Selection*/fn(s) = 1; s.numNodes=|N |; s = N ;for all clusters Ci ∈ C do
/*Meet user FN with least energy*/if fn(Ci)≤ufn and Ci.numNodes≤s.numNodes thens = Ci
s.numNodes = Ci.numNodesend if
end for/*Reinforcement Selection*/fp(r)=1;fn(r)=1; r.numNodes=|N |; r = N ;for all clusters Ci ∈ (C − s) do
/*Meet user FP and FN with least energy*/if (s ∪ Ci).numNodes≤r.numNodes and fp(Ci)≤ufp and fn(Ci)≤ufn thenr = Ci
r.numNodes = Ci.numNodesend if
end for
ACM Transactions on Sensor Networks, Vol. 1, No. 1, Article 1, Publication date: January 2012.

1:12 M. Keally et al.
4.4. Sentinel and Reinforcement SelectionWith the deployment detection capability explored by determining accuracy for all gen-erated clusters, we choose a subset of the deployment to remain awake during runtimedetection as sentinels and reinforcements to make confident detection decisions. Wechoose sentinels such that all negative event decisions can be made with confidence:that the user’s false negative requirement is met by sentinels. Since communicationis the most energy intensive operation in wireless sensor networks [Shnayder et al.2004], we minimize energy usage by selecting a sentinel cluster with sensors on thefewest number of nodes, for only one radio transmission is needed to report observa-tions from multiple sensors on the same node in one aggregation interval.
Since sentinels are only concerned with determining the lack of an event with confi-dence, we leave more difficult observations to the more powerful reinforcements whennegative event decisions cannot be confidently made by sentinels. Therefore we choosereinforcements so that both the user’s false positive and false negative requirementsare met. We also ensure that the combined sentinel and reinforcement clusters arelocated on the fewest number of nodes to save energy. The reinforcement cluster hasat least one sensor that is not in the sentinel cluster in order to ensure there is someadded benefit from sampling reinforcement data. The sentinel and reinforcement se-lection algorithm is given in Algorithm 2. We note that false positive and false negativerates are calculated over Ci, since reinforcements are trained as a separate cluster, andtheir runtime decisions are independent of the sentinels.
Algorithm 3 Runtime Event DetectionInput: Sentinels s, reinforcements r, runtime observation for s for the current aggre-
gation interval Os,t, may also receive runtime observations for r for the previous andcurrrent aggregation intervals Or,t−1, Or,t
Output: Event detection decision for the current aggregation interval Et and for theprevious interval Et−1 if Et−1=UNDECIDEDif Et−1=UNDECIDED then
/*Make a confident decision at t− 1 using r*/Determine γt−1 using detection model from r and Or,t−1
if γt−1 ≥ .5 then Et−1 = 1 else Et−1 = 0end ifDetermine γt using detection model from s and Os,t
if γt < .5 thenEt = 0 /*s confidently determines no event at t*/
else if γt ≥ .5 and fp(s, γ) ≤ fp(u) thenEt = 1 /*s confidently determines an event at t*/
else if γt ≥ .5 and requested Or,t has been received then/*Make a confident decision at t using r*/Determine γt using detection model from r and Or,t
if γt ≥ .5 then Et = 1 else Et = 0else
/*A confident decision cannot be made at t using s*/Et=UNDECIDED; request Or,t and Or,t+1
end if
4.5. Cluster Generation AlternativesSince randomly generating clusters for sensor selection creates performance concerns,we present two cluster generation and sensor selection alternatives. We first describe
ACM Transactions on Sensor Networks, Vol. 1, No. 1, Article 1, Publication date: January 2012.
A Learning-based Approach to Confident Event Detection in Heterogeneous Sensor Networks 1:13
selecting sensors based on distance to the target location and then illustrate selectingsensors based on correlation of event detection decisions. However, in our evaluationin Section 5, we demonstrate that the sparseness of the sensor deployment as well asrestricting cluster generation to sensors within 100m of each target location mitigatesboth the efficiency and accuracy concerns for random cluster generation. Specifically,due to the fusion range constraing and sleeping nodes, the number of available nodesis bounded between 3 and 5 for all locations.
Distance-based Cluster Generation. Sensors are ranked by distance to the targetlocation, with the closest sensors ordered first. Sentinels are selected by adding onesensor at a time in order of distance, until the user’s false negative requirement ismet. Reinforcements are selected by adding one sensor at a time in order of distance,until both the false positive and false negative requirement are met.
Correlation-based Cluster Generation. A classifier is trained for each individualsensor using training data. Sensors are then ranked by either false negative rate if weare choosing sentinels, or by total accuracy if we are choosing reinforcements. The firstsensor chosen, for either the sentinel or reinforcement cluster, is the sensor with thehighest rank. Then, we compute the decision correlation between the current clusterand all other remaining individual sensor classifiers as in [Keally et al. 2011]. Thedecision correlation defines the correlation between sensor and sensor cluster classifierdecisions. To compute the decision correlation for a classifier, each correct decision isrecorded as one and each incorrect decision is recorded as zero. The sensor with thedecision correlation closest to zero is the sensor we add to the cluster. Sensors areadded one at a time to the cluster, until the false negative requirement is met if we arechoosing sentinels, or until both the false positive and false negative requirements aremet if we are choosing reinforcements.
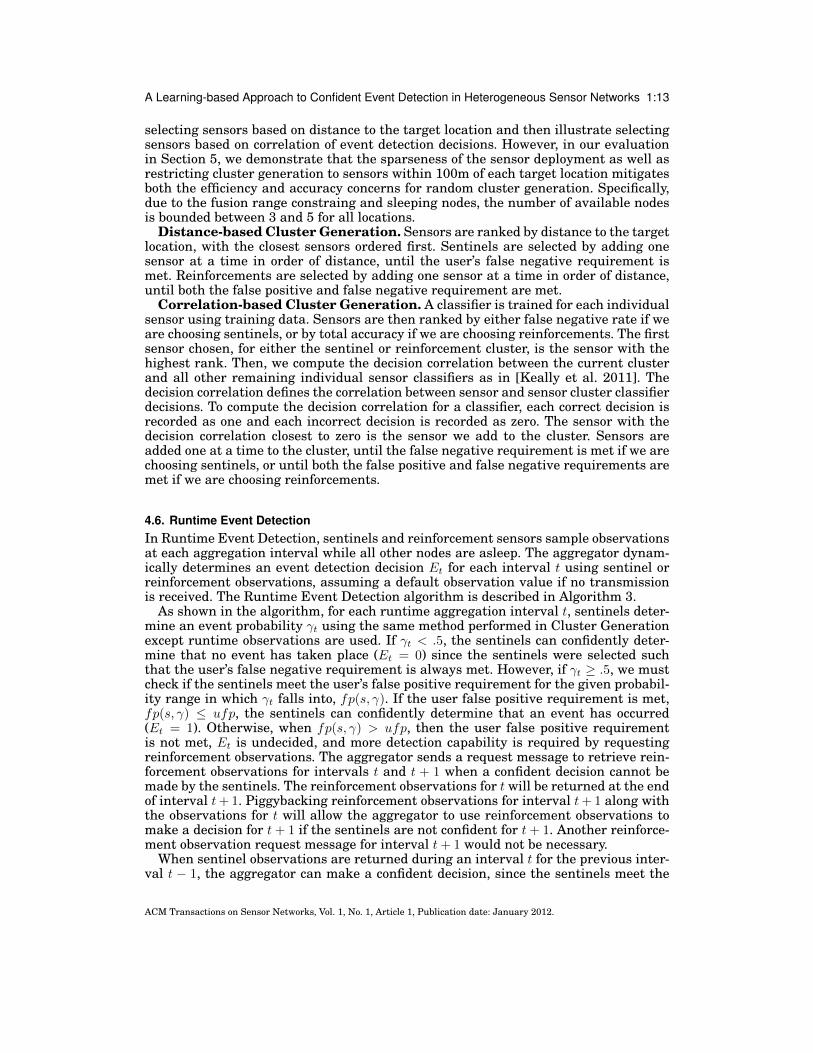
4.6. Runtime Event DetectionIn Runtime Event Detection, sentinels and reinforcement sensors sample observationsat each aggregation interval while all other nodes are asleep. The aggregator dynam-ically determines an event detection decision Et for each interval t using sentinel orreinforcement observations, assuming a default observation value if no transmissionis received. The Runtime Event Detection algorithm is described in Algorithm 3.
As shown in the algorithm, for each runtime aggregation interval t, sentinels deter-mine an event probability γt using the same method performed in Cluster Generationexcept runtime observations are used. If γt < .5, the sentinels can confidently deter-mine that no event has taken place (Et = 0) since the sentinels were selected suchthat the user’s false negative requirement is always met. However, if γt ≥ .5, we mustcheck if the sentinels meet the user’s false positive requirement for the given probabil-ity range in which γt falls into, fp(s, γ). If the user false positive requirement is met,fp(s, γ) ≤ ufp, the sentinels can confidently determine that an event has occurred(Et = 1). Otherwise, when fp(s, γ) > ufp, then the user false positive requirementis not met, Et is undecided, and more detection capability is required by requestingreinforcement observations. The aggregator sends a request message to retrieve rein-forcement observations for intervals t and t + 1 when a confident decision cannot bemade by the sentinels. The reinforcement observations for t will be returned at the endof interval t+ 1. Piggybacking reinforcement observations for interval t+ 1 along withthe observations for t will allow the aggregator to use reinforcement observations tomake a decision for t+ 1 if the sentinels are not confident for t+ 1. Another reinforce-ment observation request message for interval t+ 1 would not be necessary.
When sentinel observations are returned during an interval t for the previous inter-val t − 1, the aggregator can make a confident decision, since the sentinels meet the
ACM Transactions on Sensor Networks, Vol. 1, No. 1, Article 1, Publication date: January 2012.

1:14 M. Keally et al.
user accuracy requirements. γt is determined using the reinforcement observationsand an event, Et−1 = 1, is confidently determined if γt ≥ .5. Otherwise, Et−1 = 0.
Fig. 5. Runtime detection timeline with sentinel and reinforcement event decisions, where ufn = ufp =0.5. Gray areas indicate sensor readings that trigger non-default observations that are above the configuredtransmission threshold values. Aggregator-determined event probabilities are indicated by γt and eventdecisions are indicated by Et. Radio transmissions due to non-default observations are indicated by thearrows.
To illustrate Runtime Event Detection, an example is presented in Figure 5. In thefigure, the sensors on node 1 are sentinels while the other two sensors on nodes 60and 61 are reinforcements. During the first interval t = 1, no sensors report non-default observations, so the base station determines an event probability of .02. Sincethe sentinels have been determined to meet the overall false negative requirement,fn(s) ≤ ufn = .05, the decision is confident. A similar decision also occurs at t = 3.At t = 2, the sentinels capture an event and report their observations via radio, yield-ing an event probability of .98. The false positive rate for sentinels when γt = .98 wasdetermined during training as .02, so this is a confident decision (.02 ≤ ufp = .05).At t = 4 the seismic sentinel sensor does not capture the event, and the sentinel falsepositive rate for the current observation and event probability was determined fromtraining as .45. Since .45 is greater than ufp = .05, the aggregator could not make aconfident decision and more detection capability is needed. Therefore, reinforcementsare signaled to return their data for t = 4 at the end of interval t = 5. At t = 5, the rein-forcement data yields a confident event decision for t = 4 since sentinels always meetthe user requirements and the sentinel data determines that no event has occurred.
4.7. Online RetrainingDuring runtime, a sentinel or reinforcement cluster may experience a drop in detectionperformance, running the risk of not meeting the user detection requirements. Such aperformance drop may be due to changes in background noise or to the properties ofthe event. In these cases, the sentinel and reinforcement clusters are disbanded andnew, more accurate, sentinel and reinforcement clusters are regenerated. With OnlineRetraining, the aggregator receives periodic feedback as to the accuracy of detectiondecisions. This feedback can be provided in a manner similar to [Keally et al. 2011],where K-L divergence is used to compare training data to current runtime data ateach aggregation interval, determining that an update is needed when runtime datais significantly different than training data for each active sensor.
ACM Transactions on Sensor Networks, Vol. 1, No. 1, Article 1, Publication date: January 2012.
A Learning-based Approach to Confident Event Detection in Heterogeneous Sensor Networks 1:15
When an update is triggered, the aggregator broadcasts an update message to notifyall sensor nodes. Each awake node maintains a cache of the most recent readings foreach sensor and upon receipt of an update message, these readings are transmittedback to the aggregator. The aggregator then collects new ground truth for the recentobservations and selects new sentinel and reinforcement sensors through the ClusterGeneration and Sentinel and Reinforcement Selection processes described in Section4.3 and Section 4.4, respectively. Candidate sensors are kept awake to be considered asfuture sentinels or reinforcements. These are chosen randomly after each update usingthe set of available sensors. We ensure at least two nodes are awake as candidates inthe evaluation. Runtime Event Detection then proceeds with the new sentinels and re-inforcements as in Section 4.6. Ground truth is obtained via user feedback in a fashionsimilar to V-SAM [Hwang et al. 2007], where a video camera is utilized. Particularly,a user plays back the most recent activity to see what happened, and records groundtruth for retraining.
A new, updated cluster may change with respect to the old cluster in three ways.First, the new cluster may consist of the same exact sensors as the old cluster onlywith a new detection model at the aggregator. Second, a newly formed cluster mayalso reside on the same nodes as the old but contain different sensors. Third, a newcluster may also reside on different nodes than the previous cluster. In future work,we will predict how a cluster changes during an update in order to reduce overhead ingenerating new clusters as well as to ensure energy fairness through load balancingamong clusters.
After sentinel and reinforcement sensors are selected during initial training or anupdate, a subset of nodes is selected as candidate nodes from among all non-sentineland non-reinforcement sensor nodes. Such candidate nodes remain awake and sampledata so that during an update candidates may be selected to become sentinel or rein-forcement sensor nodes if the current sentinel or reinforcement nodes cannot meet theuser requirements.
5. EVALUATIONWatchdog is designed as a generic framework, so we evaluate its performance in twodifferent application scenarios using a PC-based Java simulation: vehicle detectionusing trace data and a building traffic monitoring application using IRIS motes. Forthe vehicle detection trace, we use the same simulation methodology described in Sec-tion 3. We use one pass of the vehicle (70s) as training data and the remaining tracewith 10 more passes as runtime data. In the building traffic monitor experiment, weplace five IRIS motes with attached MTS310 sensorboards (2-axis accelerometer, 2-axis magnetometer, acoustic, light sensors) [CROSSBOW ] on the main entrance doorof an academic building to monitor the traffic pattern of when people are most oftenentering and leaving the building. We define an event and measure the ground truthas the time period during which someone opens the door and walks through (eitherentering or exiting), with the door automatically closing behind. We obtained groundtruth via video recording of the building entrance and sampled data at 20ms intervalsusing the heterogeneous sensors on the mote sensorboards. We also use a 4s aggrega-tion interval and 2 minutes of data for training. Additionally, 40 observations are usedfor periodic retraining.
We compare against a sensing coverage-based framework and a modality-specificsensing model using data fusion. The sensing coverage approach, V-SAM [Hwanget al. 2007], is a state of the art scheme which in contrast to conventional coverageapproaches, attempts to keep awake sensors that sample similar data. Similarity rep-resents virtual sensing relationship among sensor nodes, and is calculated based onthe similarity equation from [Hwang et al. 2007]. We also force k-coverage on V-SAM,
ACM Transactions on Sensor Networks, Vol. 1, No. 1, Article 1, Publication date: January 2012.

1:16 M. Keally et al.
where 1 to 3 nodes are awake to cover an event; only 1 node must detect an event forV-SAM to detect an event. We also compare Watchdog with a classical model-drivenevent detection solution [Yuan et al. 2008] that uses a modality-specific sensing model.In [Yuan et al. 2008], a signal attenuation model is used to estimate signal energy fortargets of different distances with a Gaussian noise distribution model. Given user-defined false positive rate, the model-driven approach can derive an event detectionthreshold for the average energy readings of all sensors in a cluster.
In Section 5.1, we first demonstrate that Watchdog is able to explore the detectioncapability of a specific deployment and cluster the right sensors to meet user detec-tion requirements. Next, in Section 5.2, we compare against a sensing coverage-basedframework and illustrate that Watchdog achieves a significantly higher performance.In Section 5.3, we compare against a data fusion-based modality-specific sensing modeland show that Watchdog can adapt the detection capability to runtime observationsand meet user detection requirements while the model-driven approach cannot. Weexplore the effects of different machine learning approaches in Section 5.4, and inves-tigate in Section 5.5 how Watchdog can create new clusters when the existing sentineland reinforcement clusters are unable to handle a significant environmental change.Lastly, we demonstrate the benefits of our transmission energy saving approach inSection 5.6 and demonstrate in Section 5.7 that randomly choosing sensors does notimpact performance. In the experiments, for Watchdog, we generate M = 15 clustersfor each possible size. By default, we use HMMs with uniform discretization and On-line Retraining disabled. We also set user requirements to 5% for false positives andfalse negatives.
0
0.1
0.2
0.3
0.4
0.5
0.6
0.7
0.8
0.9
0 2 4 6 8 10 12 14
Tra
inin
g F
P R
ate
Cluster Size
14 13 9 10 9 15 15 15 15 15 15 15 14 15
3 3 2
2 1
2
1
2 1 1 2
1
(a) Training False Positive Rate
0
0.1
0.2
0.3
0.4
0.5
0.6
0.7
0.8
0.9
0 2 4 6 8 10 12 14
Tra
inin
g F
N R
ate
Cluster Size
10 12 13 14 15 13 15 14 13 14 14 15 15 15
1
2 2
1
2 1
2 1 1 2 1 1
1
(b) Training False Negative Rate
-0.05
0
0.05
0.1
0.15
0.2
0 0.1 0.2 0.3 0.4 0.5 0.6 0.7 0.8 0.9
Ru
ntim
e F
P R
ate
Training FP Rate
483490
5317 3 2 1 5
1 1
(c) Training vs. Runtime Detection False PositiveRate
-0.05
0
0.05
0.1
0.15
0.2
0 0.1 0.2 0.3 0.4 0.5 0.6 0.7 0.8 0.9
Ru
ntim
e F
N R
ate
Training FN Rate
182
10
1 4 1 3 81
(d) Training vs. Runtime Detection False NegativeRate
Fig. 6. Cluster Training and Runtime Detection. An integer besides the “x” denotes the number of clustersthat give the corresponding FP or FN rate.
ACM Transactions on Sensor Networks, Vol. 1, No. 1, Article 1, Publication date: January 2012.
A Learning-based Approach to Confident Event Detection in Heterogeneous Sensor Networks 1:17
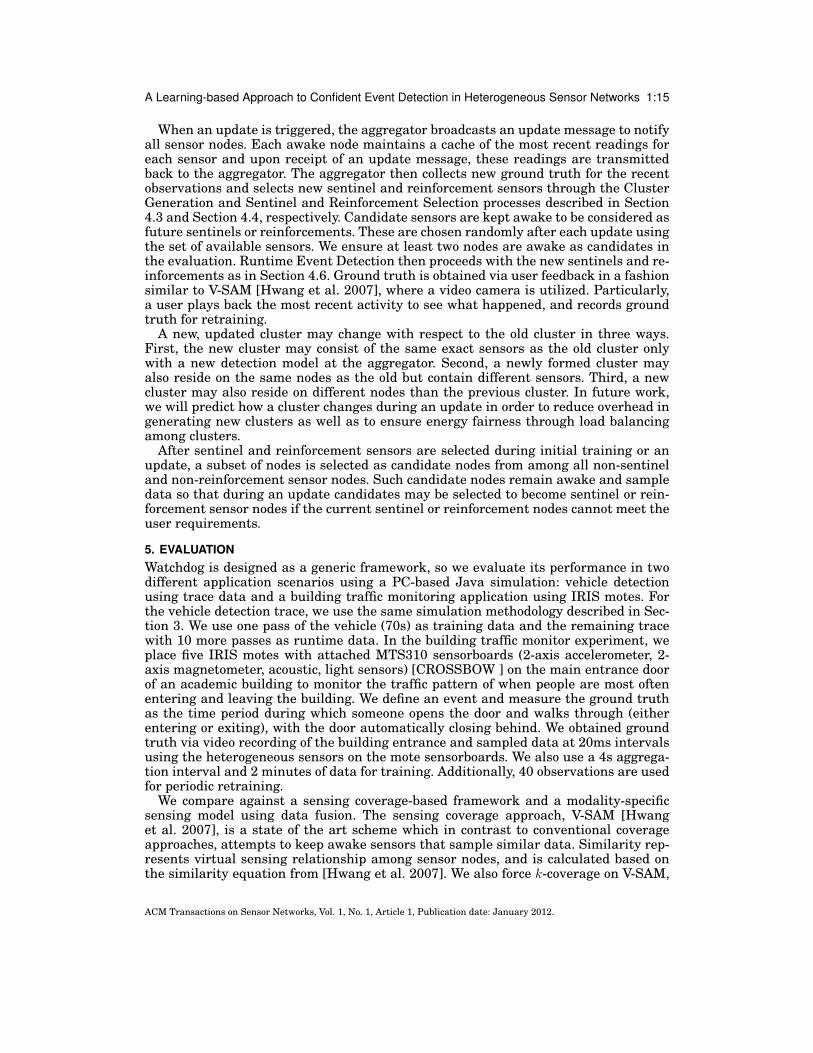
5.1. Exploring Detection Capability and Meeting RequirementsUsing the building traffic monitor trace, we show that by exploring the detection capa-bility of a specific deployment, Watchdog can choose the right sensor clusters to meetuser-defined false positive and false negative rates. In Figure 6 (a) (b), we plot thenumber of clusters for each cluster size that achieve the same training false positive orfalse negative rate. In Figure 6 (c) (d), we plot cluster training performance comparedwith runtime performance. In this subsection, we use half of the data (and events) fortraining and the remaining half for testing.
In Figure 6 (a) (b), there are only a limited and discrete number of false positive andfalse negative rates that the deployed system can support. To that end, a user can onlyrequire a false positive or false negative rate that can be supported by the system. Forexample, most sensors and sensor clusters have false positive and false negative ratesnear zero, while only a few experience false positive rates greater than 70% or falsenegative rates greater than 45%. This set of cluster performances is determined bythe sensor hardware and local sensing reality where the system is deployed. Differentscenarios may produce different false positive and false negative rates for each cluster.
0.55
0.6
0.65
0.7
0.75
0.8
0.85
0.9
0.95
1
All Accel Mag Acoustic
Accura
cy
Modality
WatchdogV-SAM (Sim)
V-SAM (1)V-SAM (2)V-SAM (3)V-SAM (4)V-SAM (5)V-SAM (6)
(a) Accuracy Comparison
0
0.1
0.2
0.3
0.4
0.5
0.6
0.7
0.8
All Accel Mag Acoustic
Fals
e N
egative R
ate
Modality
WatchdogV-SAM (Sim)
V-SAM (1)V-SAM (2)V-SAM (3)V-SAM (4)V-SAM (5)V-SAM (6)
(b) False Negative Comparison
0
0.0005
0.001
0.0015
0.002
0.0025
All Accel Mag Acoustic
Energ
y (
J)
Modality
WatchdogV-SAM (Sim)
V-SAM (1)V-SAM (2)V-SAM (3)V-SAM (4)V-SAM (5)V-SAM (6)
(c) Energy Comparison
0.4
0.5
0.6
0.7
0.8
0.9
1
20 40 60 80 100 120 140 160 180 200 220 240
Accura
cy
Training Length (sec)
WatchdogV-SAM
(d) Training Length Accuracy
Fig. 7. Watchdog and V-SAM comparison for different modalities, levels of V-SAM coverage, and traininglengths.
In Figure 6 (a) (b), we also observe that even in a small deployment with “5 IRIS× 6 sensors each = 30 sensors”, there are a large number of sensor clusters availableto meet user specified false positive or false negative rate. As shown in Figure 6 (a),there are exactly 3+3+2=8 sensor clusters that demonstrate a 5% false positive rate inthe training data and there are 189 sensor clusters in Figure 6 (a) that demonstratesmaller than a 5% false positive rate. So, in total, 8+189=197 different sensor clusterscan be chosen to meet the user-specified 5% false positive rate.
ACM Transactions on Sensor Networks, Vol. 1, No. 1, Article 1, Publication date: January 2012.

1:18 M. Keally et al.
In Figure 6 (c) (d), we observe that during runtime detection, Watchdog is able tomeet the false positive or false negative rate explored during training. For example,Figure 6 (c) shows that 48 clusters with a training false positive rate of 0% achievethis performance during runtime; Figure 6 (d) shows that 182 clusters with a falsenegative rate of 0% also demonstrate no false negatives during runtime. In Figure 6(c) (d), we also observe that clusters with higher training false positive or false negativerates achieve significantly better runtime performance: 6 clusters with a training falsepositive rate of 72% achieve a runtime false positive rate of 10%, and 13 clusters witha training false negative rate greater than 20% achieve a runtime false negative rateof 5% or less.
To summarize, these data illustrate that Watchdog is able to cluster the right sensorsto meet user requirements during runtime. Plus, many clusters of different sizes existto meet user-required accuracy. This allows for freedom in sentinel and reinforcementselection to adapt the detection capability to environmental dynamics and maximizeenergy savings.
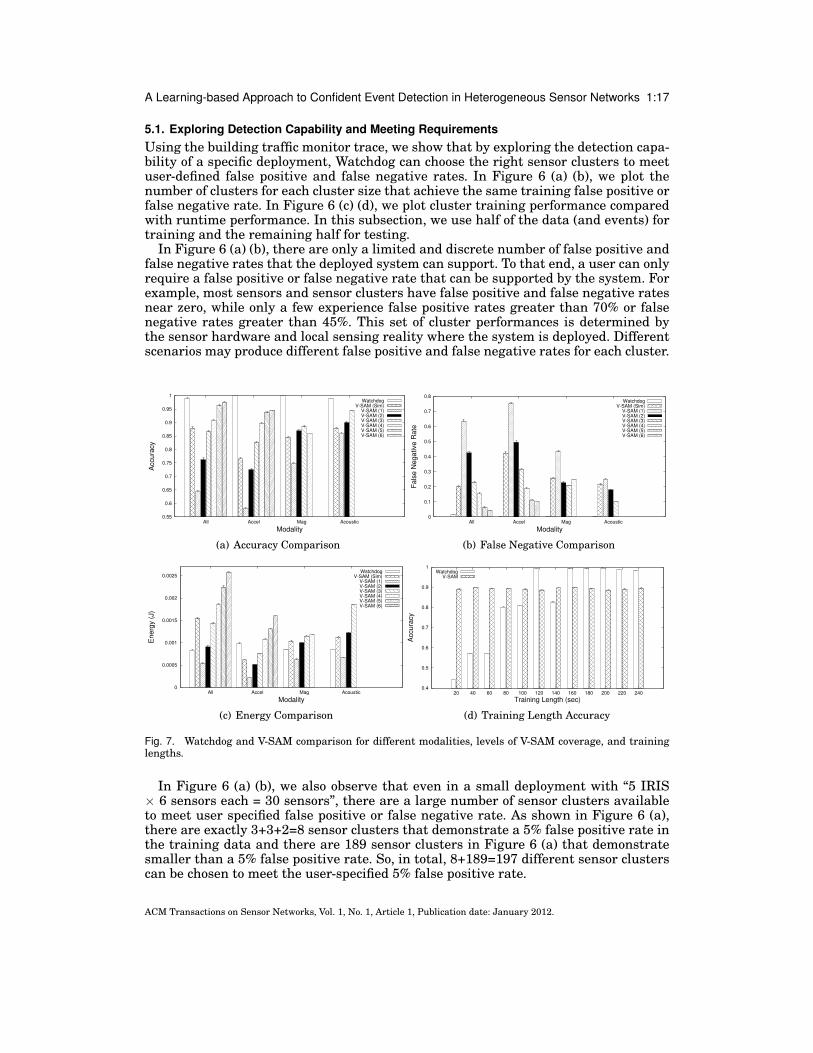
5.2. Comparison with V-SAMUsing the building traffic monitor trace, we compare Watchdog to a state of the artsensing coverage framework that addresses sensing irregularity, V-SAM [Hwang et al.2007]. Though V-SAM cannot provide guaranteed accuracy, we set the Watchdog userrequirements to the lowest false positive and false negative rates determined fromtraining. Evaluation results are presented in Figure 7 with 95% confidence intervalsover 20 runs.
In Figure 7 (a) (b), We observe that Watchdog outperforms V-SAM in every config-uration: all modalities, individual modalities, and varying levels of V-SAM coverage.Although using higher k-coverage and similarity-based coverage helps improve V-SAMperformance, it is always outperformed by Watchdog, which consistently demonstratesclose to 100% detection accuracy in Figure 7 (a) and close to zero false negatives inFigure 7 (b). None of the Watchdog or V-SAM configurations experience statisticallynoticeable false positives, so false positive rates are not illustrated. Watchdog can con-sistently outperform V-SAM because Watchdog samples subsets of potential sensorclusters to explore the detection capability of individual sensors and sensor clustersin a deployed system in order to meet user requirements. However, V-SAM has no de-tailed knowledge of detection accuracy, so the most accurate sensors may be excludedwhile poor performing sensors may become involved in detection decisions.
In Figure 7 (c), we observe that Watchdog is much more energy efficient than V-SAM.We compute energy to transmit or receive each byte of a 802.15.4 packet on CC2420radios [ChipconCC2420 ] using a TDMA-based scheme. We use the default payloadof 28 bytes for each payload which is more than sufficient to carry aggregated datafor all sensors on the transmitting node. As shown in Figure 7 (c), Watchdog energyconsumption is relatively constant for all modalities and for each modality, hoveringaround 9× 10⁻⁴ J, since typically only 1-2 nodes are used in forming both sentinel andreinforcement clusters. However, V-SAM energy consumption (when achieving goodperformance) is much more varied: 10 × 10−4 ∼ 26 × 10−4 J. While Watchdog may usemore energy than 1 or 2-coverage V-SAM, Watchdog achieves about 35% points betteraccuracy compared with those V-SAM configurations. Watchdog is significantly moreenergy efficient than V-SAM since Watchdog fully explores the detection capabilityof individual sensors and sensor clusters. Hence, Watchdog can use this knowledgeto adapt sensing capability to runtime observations while making confident detectiondecisions, but V-SAM cannot.
Training Length. In Figure 7 (d), we observe that for Watchdog to achieve theaforementioned superior detection accuracy and energy efficiency compared with V-
ACM Transactions on Sensor Networks, Vol. 1, No. 1, Article 1, Publication date: January 2012.

A Learning-based Approach to Confident Event Detection in Heterogeneous Sensor Networks 1:19
SAM, only a short training length is needed. As shown in Figure 7 (d), when thetraining length increases, Watchdog performance improves quickly, surpasses V-SAMperformance, and converges to near perfect accuracy after about 2 minutes, which isreasonably short for real applications. Even though V-SAM requires little training,which is invisible in Figure 7 (d), it demonstrates much lower detection accuracy andmuch higher energy usage than Watchdog. Since the training length is short, the useof periodic retraining can handle environmental changes.
5.3. Comparison with a Modality-Specific Sensing Model
0
0.2
0.4
0.6
0.8
1
0.05 0.2 0.4
Accura
cy
Desired False Positive RateWatchdog (<25m)Watchdog (>40m)
Model (<25m)Model (>40m)
(a) Accuracy Comparison
0
0.1
0.2
0.3
0.4
0.5
0.05 0.2 0.4
Fa
lse
Po
sitiv
e R
ate
Desired False Positive RateWatchdog (<25m)Watchdog (>40m)
Model (<25m)Model (>40m)
(b) False Positive Comparison
0
0.2
0.4
0.6
0.8
1
0.05 0.2 0.4
Fa
lse
Ne
ga
tive
Ra
te
Desired False Positive RateWatchdog (<25m)Watchdog (>40m)
Model (<25m)Model (>40m)
(c) False Negative Comparison
0
0.01
0.02
0.03
0.04
0.05
0.05 0.2 0.4
En
erg
y (
J)
Desired False Positive RateWatchdog (<25m)Watchdog (>40m)
Model (<25m)Model (>40m)
(d) Energy Comparison
Fig. 8. Watchdog and modality-specific sensing model comparison with sensors located within 25m of, ormore than 40m from, the target location.
In this section, we compare Watchdog with a classical model-driven event detec-tion solution [Yuan et al. 2008] that uses a data fusion-based modality-specific sensingmodel. For fair comparison, we use the same Wisconsin SensIT experiment trace data[Abrams et al. 2004] used in [Yuan et al. 2008] and make use of acoustic sensors todetect vehicles passing a static target location. Our evaluation is conducted in two sce-narios: when the target location is well within the sensing range of all sensors, andwhen the sensors are located at the fringe of the detection range. In the first scenario,we use 5 acoustic sensors < 25m to the target location; in the second, we use 7 acous-tic sensors with distances > 40m from the target location. The results are plotted inFigure 8.
For the<25m scenario, we observe from Figure 8 (b) that Watchdog always meets theuser false positive requirement while the model-driven scheme cannot. For instance,in Figure 8 (b), the model-driven scheme has a 28% false positive rate when 20% isrequired, and gives a 42% false positive rate when 40% is required. We also observe
ACM Transactions on Sensor Networks, Vol. 1, No. 1, Article 1, Publication date: January 2012.

1:20 M. Keally et al.
from Figure 8 (a) that Watchdog yields perfect accuracy, while model-driven accuracydrops when the desired false positive rate increases. Watchdog performs better thanthe model-driven scheme because Watchdog always chooses sentinels and reinforce-ments that meet user requirements for confident event detection. The model-drivenscheme does not exploit such subtle but important information.
For the >40m scenario, we also observe that Watchdog always meets user require-ments but the model-driven scheme performs poorly or even fails. For example, whenuser requires a 5% false positive rate, the model-driven approach experiences very lowaccuracy, 67% in Figure 8 (a), and a very high false negative rate, 100% in Figure 8 (c).This is because for a low desired false positive rate, the model-driven detection thresh-old is set too high to detect any events. We also find in Figure 8 (c) that requestinghigher false positive rates does not help much. The poor performance of the model-driven scheme and the good performance of Watchdog can be explained with the samereasons attributed to the <25m scenario.
Using the transmission energy model from Section 5.2, in both scenarios, Watchdogis found to consume significantly less energy than the model-driven scheme as shownin Figure 8 (d). This is because the model-driven scheme in [Yuan et al. 2008] has avery simple energy saving scheme: nodes within the 25m “fusion range” are awakeand nodes beyond the range all sleep. On the contrary, Watchdog adapts the detectioncapability to runtime observations through the use of sentinels and reinforcements formore aggressive energy savings. In Figure 8 (d), we also observe that the model-drivenscheme consumes more energy in the >40m scenario than the <25m scenario. This isbecause 7 nodes are used instead of 5.
Table I. Adapting detection capability with reinforcements.
Sentinel FP/FN (%) Reinforc. FP/FN (%) Reinforc. Requests (%)9.5/0.0 0.0/0.0 21
Adapting Detection Capability. Using the <25m scenario we illustrate in TableI how Watchdog adapts the detection capability to environmental dynamics. With de-sired false positive and false negative rates of 0%, a sentinel cluster is selected witha 9.5% false positive rate and 0% false negative rate. A more powerful reinforcementcluster is selected with a 0% false positive and false negative rate. During runtime,79% observations are comparatively easy and hence confident decisions are entirelymade by sentinels. When the sentinels make a decision that does not meet user re-quirements (for the 21% more difficult observations), reinforcements are used to makea confident decision. The reduction in radio transmissions made by using only the sen-sors necessary to meet user requirements ensures significant energy savings.
5.4. Machine Learning ComparisonUsing the vehicle detection trace, we choose 79 target locations along the road andcluster sensors within a 100m range. Each event location is treated as an independentapplication instance for Watchdog, and then the results are averaged across the 79instances. We plot standard deviation error bars for accuracy, false positive rates, andfalse negative rates. More target locations increases the environmental dynamics andallows us to better investigate the effects of different machine learning algorithms aswell as Online Retraining in Section 5.5. Figure 9 a) shows that Watchdog without On-line Retraining using Fisher’s Linear Discriminant can meet the user requirements for95% of the target locations, while the modality-specific sensing model and V-SAM meetthe user requirements for 63% and 85% of the target locations, respectively. The per-centage of target locations meeting user requirements changes significantly between
ACM Transactions on Sensor Networks, Vol. 1, No. 1, Article 1, Publication date: January 2012.

A Learning-based Approach to Confident Event Detection in Heterogeneous Sensor Networks 1:21
0.3
0.4
0.5
0.6
0.7
0.8
0.9
1
Fisher’s
Even HM
M
Cluster H
MM
Cont. H
MM
Model
Sim-cov.
1-cov.
2-cov.
3-cov.
4-cov.
Perc
enta
ge o
f R
eqs. M
et
ORNo OR
Model V-SAM
(a) Locations Met
0.8
0.85
0.9
0.95
1
1.05
Fisher’s
Even HM
M
Cluster H
MM
Cont. H
MM
Model
Sim-cov.
1-cov.
2-cov.
3-cov.
4-cov.
Avera
ge A
ccura
cy
ORNo OR
Model V-SAM
(b) Accuracy Comparison
Fig. 9. Multiple location performance with Watchdog, modality-specific sensing model, and V-SAM.
continuous-HMMs with Online Retraining and without Online Retraining due to over-fitting. The events change during runtime, so the model must be updated more oftensince it is overfitting the training data. A similar trend can be seen when comparingaverage accuracy for all target locations in Figure 9 b). With respect to the differ-ent machine learning methods, Watchdog with Fisher’s Linear Discriminant exhibitsthe best performance since it can determine the data dependencies between differentsensors in a cluster and use the strengths of each sensor to maximize detection perfor-mance. Watchdog with a clustering-based discretization HMM is also able to improveon the default uniform discretization HMM since k-means clustering aids the HMMin separating events from non-events. The continuous HMM meets many fewer tar-get locations compared with other Watchdog implementations since it requires a muchlonger training dataset to train accurately.
Figure 9 b) shows that a slight accuracy increase allows Watchdog to meet user ac-curacy requirements for many more locations, making Fisher’s Linear Discriminantespecially valuable. For example, the continuous HMM without Online Retraining hasover 90% average accuracy for all locations, yet only meets user requirements for 34%of these locations. However, with 98% average accuracy, Watchdog with Fisher’s Lin-ear Discriminant and no Online Retraining meets user requirements for 95% of loca-tions. Similarly, increasing coverage for V-SAM increases its detection accuracy andthe number of locations that meet the user requirements, but even 4-coverage V-SAMmeets the user requirements for only 85% of locations. Nearly all of the detection er-rors for Watchdog, the modality-specific sensing model, and V-SAM are false negativesas shown in Figure 10 a); the average false positive rates for all approaches are lessthan 1% except the continuous HMM, which has an average false positive rate of 14%.
In Figure 10 b), we show the average energy consumption for each approach acrossall target locations. We extend energy usage to include not only radio energy but alsoenergy consumed by motes while awake and sensing, with details given in [Shnay-der et al. 2004]. Watchdog consistently experiences the lowest energy consumption,ranging from just over 0.2J with the uniform discretization HMM without Online Re-training to 0.4J for the continuous HMM with Online Retraining. Watchdog is able toreduce energy usage compared with other approaches since it chooses only the sensorsand nodes needed to meet user requirements. V-SAM has much higher energy con-sumption, ranging from 0.5J for similarity coverage to 0.6J for 4-coverage. As coveragelevels increase, more nodes are awake, increasing V-SAM energy usage. Furthermore,
ACM Transactions on Sensor Networks, Vol. 1, No. 1, Article 1, Publication date: January 2012.

1:22 M. Keally et al.
0
0.05
0.1
0.15
0.2
0.25
0.3
Fisher’s
Even HM
M
Cluster H
MM
Cont. H
MM
Model
Sim-cov.
1-cov.
2-cov.
3-cov.
4-cov.
Avera
ge F
N R
ate
ORNo OR
Model V-SAM
(a) False Negative Comparison
0
0.2
0.4
0.6
0.8
1
1.2
1.4
1.6
1.8
2
2.2
Fisher’s
Even HM
M
Cluster H
MM
Cont. H
MM
Model
Sim-cov.
1-cov.
2-cov.
3-cov.
4-cov.
Avera
ge E
nerg
y (
J)
ORNo OR
Model V-SAM
(b) Energy Usage
Fig. 10. False negatives and energy usage comparison for multiple locations.
the standard deviation is higher than Watchdog, for when events are detected, V-SAMawakens all nodes to monitor the event until it is no longer detected. The modality-specific sensing model keeps all nodes awake at all times and has very high energyusage, 1.4J. Its standard deviation is also much higher since some locations have manynodes within the 100m fusion range, while other locations have few nodes.
5.5. Online RetrainingDuring runtime, Watchdog with Online retraining is able to handle significant en-vironmental changes by retraining sentinel and reinforcement clusters. The 79 dif-ferent detection locations we choose in the vehicle detection trace provide significantenvironmental dynamics, as the vehicle path varies widely with each pass. Watchdogconfigurations with Online Retraining have 2 candidate nodes awake at each time in-terval and the machine learning approaches that use a transmission threshold havethe threshold set to α = 0.5. In Figure 9 a), Online Retraining is able to increase thenumber of locations which meet user requirements for each machine learning method,ranging from 3% points for Fisher’s Linear Discriminant to over 30% points for the con-tinuous HMM. Similar increases in accuracy are also observed in Figure 9 b). Figure10 a) shows that Online Retraining requires slightly more energy due to communica-tion overhead in forming new clusters and awake candidate nodes, but performance isstill significantly better than the modality-specific sensing model and V-SAM.
In Figure 11, we show that more powerful reinforcements are requested sparingly,regardless of the machine learning approach or the use of Online Retraining. UsingFisher’s Linear Discriminant, some locations request reinforcement data more than10% of the time. Fisher’s Linear Discriminant requests reinforcements slightly morethan the other configurations for it can closely capture the data dependencies amongsensors in a cluster and better determine when the sentinel cluster cannot make aconfident detection decision. This adaptation in detection between clusters of differingsensing capability demonstrates the ability of Watchdog to reduce energy consumptionin comparison with other approaches.
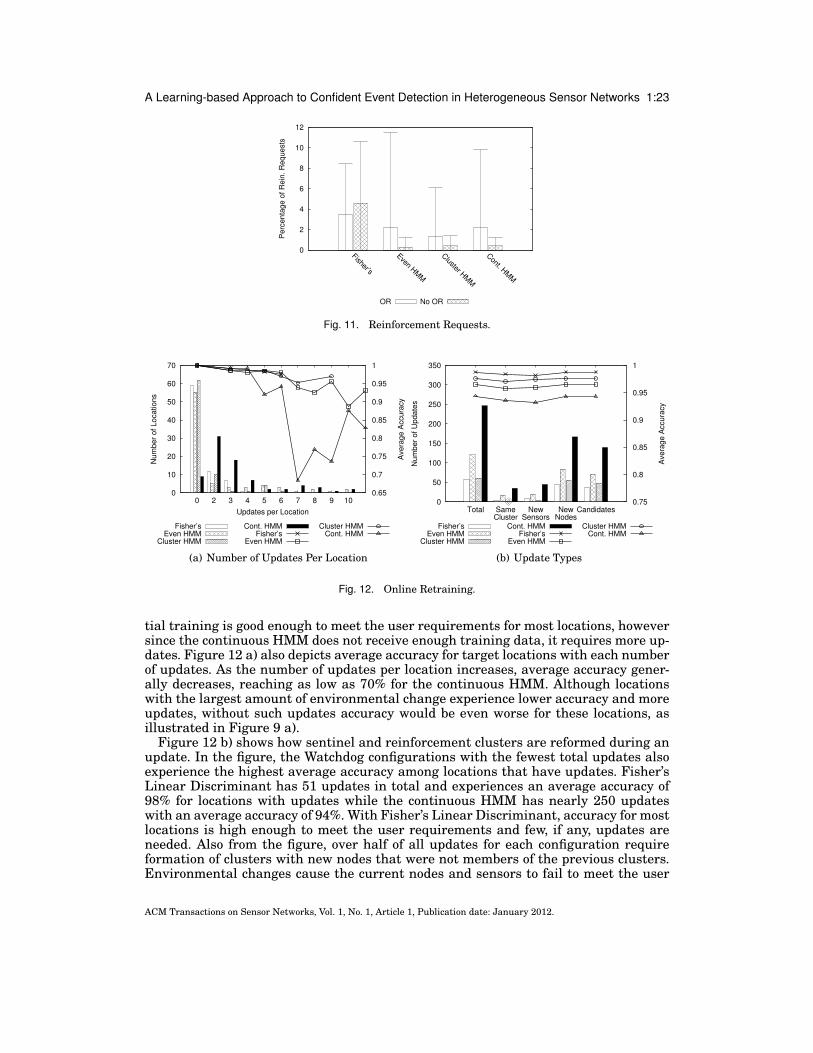
Using Online Retraining, Figure 12 a) illustrates the total number of updates foreach target location and each Watchdog machine learning configuration. The figureshows that a small number of updates allows Watchdog to maintain its high detectionaccuracy and meet the user requirements. Most target locations require no updateswith all but the continuous Hidden Markov Model, for which most locations require2, 3, or 4 updates. For Fisher’s Linear Discriminant and the discrete HMMs, the ini-
ACM Transactions on Sensor Networks, Vol. 1, No. 1, Article 1, Publication date: January 2012.
A Learning-based Approach to Confident Event Detection in Heterogeneous Sensor Networks 1:23
0
2
4
6
8
10
12
Fisher’s
Even HM
M
Cluster H
MM
Cont. H
MM
Perc
enta
ge o
f R
ein
. R
equests
OR No OR
Fig. 11. Reinforcement Requests.
0
10
20
30
40
50
60
70
0 2 3 4 5 6 7 8 9 10 0.65
0.7
0.75
0.8
0.85
0.9
0.95
1
Num
ber
of Locations
Avera
ge A
ccura
cy
Updates per Location
Fisher’sEven HMM
Cluster HMM
Cont. HMMFisher’s
Even HMM
Cluster HMMCont. HMM
(a) Number of Updates Per Location
0
50
100
150
200
250
300
350
Total SameCluster
NewSensors
NewNodes
Candidates 0.75
0.8
0.85
0.9
0.95
1
Num
ber
of U
pdate
s
Avera
ge A
ccura
cy
Fisher’sEven HMM
Cluster HMM
Cont. HMMFisher’s
Even HMM
Cluster HMMCont. HMM
(b) Update Types
Fig. 12. Online Retraining.
tial training is good enough to meet the user requirements for most locations, howeversince the continuous HMM does not receive enough training data, it requires more up-dates. Figure 12 a) also depicts average accuracy for target locations with each numberof updates. As the number of updates per location increases, average accuracy gener-ally decreases, reaching as low as 70% for the continuous HMM. Although locationswith the largest amount of environmental change experience lower accuracy and moreupdates, without such updates accuracy would be even worse for these locations, asillustrated in Figure 9 a).
Figure 12 b) shows how sentinel and reinforcement clusters are reformed during anupdate. In the figure, the Watchdog configurations with the fewest total updates alsoexperience the highest average accuracy among locations that have updates. Fisher’sLinear Discriminant has 51 updates in total and experiences an average accuracy of98% for locations with updates while the continuous HMM has nearly 250 updateswith an average accuracy of 94%. With Fisher’s Linear Discriminant, accuracy for mostlocations is high enough to meet the user requirements and few, if any, updates areneeded. Also from the figure, over half of all updates for each configuration requireformation of clusters with new nodes that were not members of the previous clusters.Environmental changes cause the current nodes and sensors to fail to meet the user
ACM Transactions on Sensor Networks, Vol. 1, No. 1, Article 1, Publication date: January 2012.
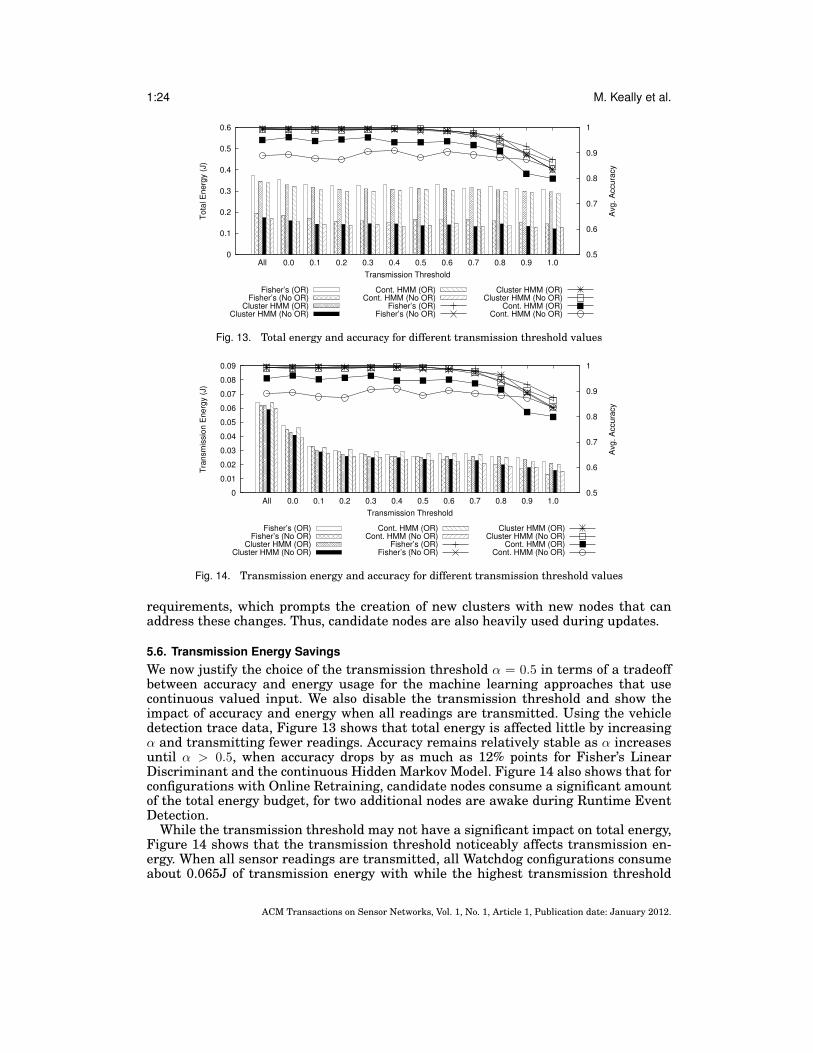
1:24 M. Keally et al.
0
0.1
0.2
0.3
0.4
0.5
0.6
All 0.0 0.1 0.2 0.3 0.4 0.5 0.6 0.7 0.8 0.9 1.0 0.5
0.6
0.7
0.8
0.9
1
Tota
l E
nerg
y (
J)
Avg. A
ccura
cy
Transmission Threshold
Fisher’s (OR)Fisher’s (No OR)
Cluster HMM (OR)Cluster HMM (No OR)
Cont. HMM (OR)Cont. HMM (No OR)
Fisher’s (OR)Fisher’s (No OR)
Cluster HMM (OR)Cluster HMM (No OR)
Cont. HMM (OR)Cont. HMM (No OR)
Fig. 13. Total energy and accuracy for different transmission threshold values
0
0.01
0.02
0.03
0.04
0.05
0.06
0.07
0.08
0.09
All 0.0 0.1 0.2 0.3 0.4 0.5 0.6 0.7 0.8 0.9 1.0 0.5
0.6
0.7
0.8
0.9
1
Tra
nsm
issio
n E
nerg
y (
J)
Avg. A
ccura
cy
Transmission Threshold
Fisher’s (OR)Fisher’s (No OR)
Cluster HMM (OR)Cluster HMM (No OR)
Cont. HMM (OR)Cont. HMM (No OR)
Fisher’s (OR)Fisher’s (No OR)
Cluster HMM (OR)Cluster HMM (No OR)
Cont. HMM (OR)Cont. HMM (No OR)
Fig. 14. Transmission energy and accuracy for different transmission threshold values
requirements, which prompts the creation of new clusters with new nodes that canaddress these changes. Thus, candidate nodes are also heavily used during updates.
5.6. Transmission Energy SavingsWe now justify the choice of the transmission threshold α = 0.5 in terms of a tradeoffbetween accuracy and energy usage for the machine learning approaches that usecontinuous valued input. We also disable the transmission threshold and show theimpact of accuracy and energy when all readings are transmitted. Using the vehicledetection trace data, Figure 13 shows that total energy is affected little by increasingα and transmitting fewer readings. Accuracy remains relatively stable as α increasesuntil α > 0.5, when accuracy drops by as much as 12% points for Fisher’s LinearDiscriminant and the continuous Hidden Markov Model. Figure 14 also shows that forconfigurations with Online Retraining, candidate nodes consume a significant amountof the total energy budget, for two additional nodes are awake during Runtime EventDetection.
While the transmission threshold may not have a significant impact on total energy,Figure 14 shows that the transmission threshold noticeably affects transmission en-ergy. When all sensor readings are transmitted, all Watchdog configurations consumeabout 0.065J of transmission energy with while the highest transmission threshold
ACM Transactions on Sensor Networks, Vol. 1, No. 1, Article 1, Publication date: January 2012.

A Learning-based Approach to Confident Event Detection in Heterogeneous Sensor Networks 1:25
setting all configurations consume about 0.2J. Energy decreases noticeably for onlysmall and large α, indicating that most sensor readings are closest to the event andnon-event centroids and that most detection decisions can be easily made by the sen-tinel cluster, as is illustrated in Figure 12 a).
5.7. Cluster Generation Alternatives Performance
0.75
0.8
0.85
0.9
0.95
1
1.05
Random Distance Correlation
Avera
ge A
ccura
cy
Fisher’sEven HMM
Cluster HMMCont. HMM
(a) Impact on accuracy
0.1
0.2
0.3
0.4
0.5
0.6
0.7
0.8
0.9
1
Random Distance CorrelationP
erc
enta
ge o
f R
eqs. M
et
Fisher’sEven HMM
Cluster HMMCont. HMM
(b) Impact on meeting user requirements
Fig. 15. Cluster Generation Alternatives Performance.
To evaluate cluster generation algorithms, we compare the random cluster selec-tion with the aforementioned alternative approaches (distance-based and correlation-based). The results show that the alternative schemes have negligible impact on ac-curacy and the percentage of user requirements met. ). In these experiments, onlineretraining is enabled. Figure 15 a) shows that the alternative methods have little im-pact on accuracy, and Figure 15 b) shows that the alternative methods also have littleimpact on meeting user requirements. Therefore, we conclude that choosing sensorsand generating clusters randomly has little impact on overall performance.
6. CONCLUSIONExisting works do not provide a holistic solution with respect to clustering the rightsensors for confident event detection, heterogeneous deployments, and adaptation toenvironmental dynamics. Consequently, we present Watchdog, a generic event detec-tion framework which can function in a wide array of applications and deployments.Unlike existing approaches, Watchdog can obtain the detection capability of a specificdeployment and use this knowledge to cluster the right sensors to perform confidentevent detection. With a short training length, Watchdog chooses sentinel and rein-forcement sensors which adapt the detection capability to confidently detect eventswhile saving energy. We propose several different machine learning techniques withwhich Watchdog can use to perform confident event detection and allow these meth-ods to adapt to environmental changes over time. Our evaluation demonstrates thatWatchdog largely exceeds the detection accuracy of existing approaches with reducedenergy consumption. Our evaluation also demonstrates that Watchdog always meetsuser detection requirements when in many cases existing approaches cannot.
ACM Transactions on Sensor Networks, Vol. 1, No. 1, Article 1, Publication date: January 2012.
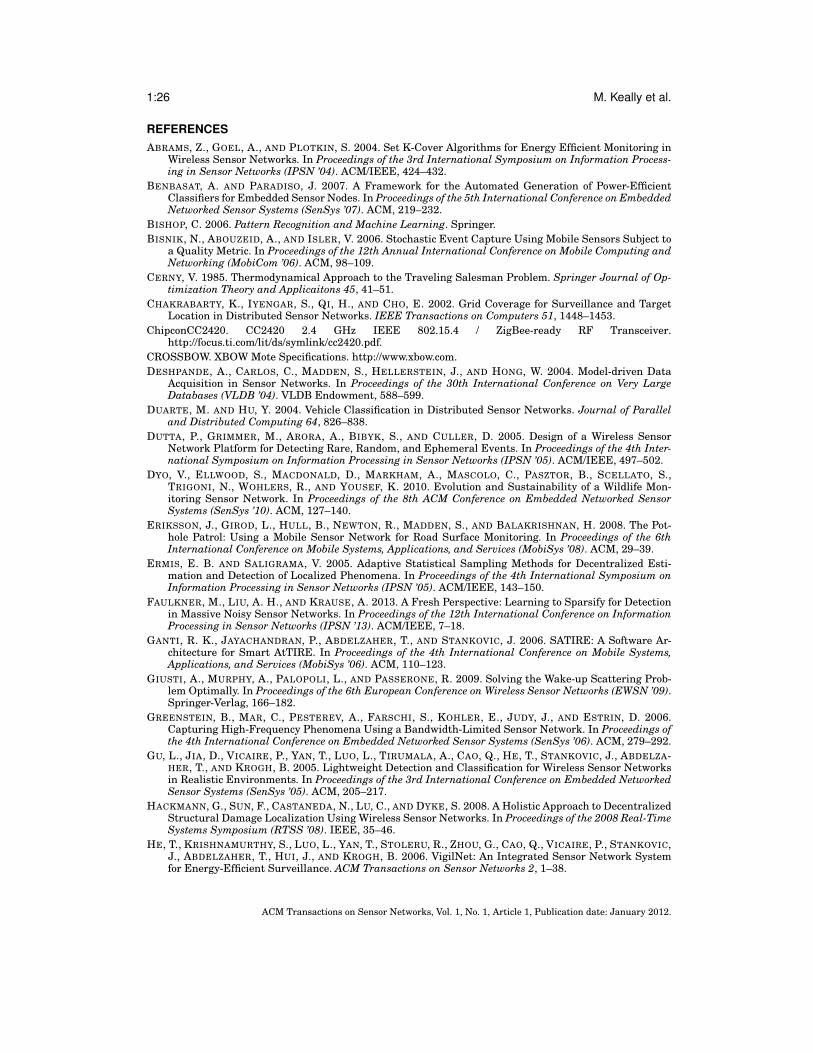
1:26 M. Keally et al.
REFERENCESABRAMS, Z., GOEL, A., AND PLOTKIN, S. 2004. Set K-Cover Algorithms for Energy Efficient Monitoring in
Wireless Sensor Networks. In Proceedings of the 3rd International Symposium on Information Process-ing in Sensor Networks (IPSN ’04). ACM/IEEE, 424–432.
BENBASAT, A. AND PARADISO, J. 2007. A Framework for the Automated Generation of Power-EfficientClassifiers for Embedded Sensor Nodes. In Proceedings of the 5th International Conference on EmbeddedNetworked Sensor Systems (SenSys ’07). ACM, 219–232.
BISHOP, C. 2006. Pattern Recognition and Machine Learning. Springer.BISNIK, N., ABOUZEID, A., AND ISLER, V. 2006. Stochastic Event Capture Using Mobile Sensors Subject to
a Quality Metric. In Proceedings of the 12th Annual International Conference on Mobile Computing andNetworking (MobiCom ’06). ACM, 98–109.
CERNY, V. 1985. Thermodynamical Approach to the Traveling Salesman Problem. Springer Journal of Op-timization Theory and Applicaitons 45, 41–51.
CHAKRABARTY, K., IYENGAR, S., QI, H., AND CHO, E. 2002. Grid Coverage for Surveillance and TargetLocation in Distributed Sensor Networks. IEEE Transactions on Computers 51, 1448–1453.
ChipconCC2420. CC2420 2.4 GHz IEEE 802.15.4 / ZigBee-ready RF Transceiver.http://focus.ti.com/lit/ds/symlink/cc2420.pdf.
CROSSBOW. XBOW Mote Specifications. http://www.xbow.com.DESHPANDE, A., CARLOS, C., MADDEN, S., HELLERSTEIN, J., AND HONG, W. 2004. Model-driven Data
Acquisition in Sensor Networks. In Proceedings of the 30th International Conference on Very LargeDatabases (VLDB ’04). VLDB Endowment, 588–599.
DUARTE, M. AND HU, Y. 2004. Vehicle Classification in Distributed Sensor Networks. Journal of Paralleland Distributed Computing 64, 826–838.
DUTTA, P., GRIMMER, M., ARORA, A., BIBYK, S., AND CULLER, D. 2005. Design of a Wireless SensorNetwork Platform for Detecting Rare, Random, and Ephemeral Events. In Proceedings of the 4th Inter-national Symposium on Information Processing in Sensor Networks (IPSN ’05). ACM/IEEE, 497–502.
DYO, V., ELLWOOD, S., MACDONALD, D., MARKHAM, A., MASCOLO, C., PASZTOR, B., SCELLATO, S.,TRIGONI, N., WOHLERS, R., AND YOUSEF, K. 2010. Evolution and Sustainability of a Wildlife Mon-itoring Sensor Network. In Proceedings of the 8th ACM Conference on Embedded Networked SensorSystems (SenSys ’10). ACM, 127–140.
ERIKSSON, J., GIROD, L., HULL, B., NEWTON, R., MADDEN, S., AND BALAKRISHNAN, H. 2008. The Pot-hole Patrol: Using a Mobile Sensor Network for Road Surface Monitoring. In Proceedings of the 6thInternational Conference on Mobile Systems, Applications, and Services (MobiSys ’08). ACM, 29–39.
ERMIS, E. B. AND SALIGRAMA, V. 2005. Adaptive Statistical Sampling Methods for Decentralized Esti-mation and Detection of Localized Phenomena. In Proceedings of the 4th International Symposium onInformation Processing in Sensor Networks (IPSN ’05). ACM/IEEE, 143–150.
FAULKNER, M., LIU, A. H., AND KRAUSE, A. 2013. A Fresh Perspective: Learning to Sparsify for Detectionin Massive Noisy Sensor Networks. In Proceedings of the 12th International Conference on InformationProcessing in Sensor Networks (IPSN ’13). ACM/IEEE, 7–18.
GANTI, R. K., JAYACHANDRAN, P., ABDELZAHER, T., AND STANKOVIC, J. 2006. SATIRE: A Software Ar-chitecture for Smart AtTIRE. In Proceedings of the 4th International Conference on Mobile Systems,Applications, and Services (MobiSys ’06). ACM, 110–123.
GIUSTI, A., MURPHY, A., PALOPOLI, L., AND PASSERONE, R. 2009. Solving the Wake-up Scattering Prob-lem Optimally. In Proceedings of the 6th European Conference on Wireless Sensor Networks (EWSN ’09).Springer-Verlag, 166–182.
GREENSTEIN, B., MAR, C., PESTEREV, A., FARSCHI, S., KOHLER, E., JUDY, J., AND ESTRIN, D. 2006.Capturing High-Frequency Phenomena Using a Bandwidth-Limited Sensor Network. In Proceedings ofthe 4th International Conference on Embedded Networked Sensor Systems (SenSys ’06). ACM, 279–292.
GU, L., JIA, D., VICAIRE, P., YAN, T., LUO, L., TIRUMALA, A., CAO, Q., HE, T., STANKOVIC, J., ABDELZA-HER, T., AND KROGH, B. 2005. Lightweight Detection and Classification for Wireless Sensor Networksin Realistic Environments. In Proceedings of the 3rd International Conference on Embedded NetworkedSensor Systems (SenSys ’05). ACM, 205–217.
HACKMANN, G., SUN, F., CASTANEDA, N., LU, C., AND DYKE, S. 2008. A Holistic Approach to DecentralizedStructural Damage Localization Using Wireless Sensor Networks. In Proceedings of the 2008 Real-TimeSystems Symposium (RTSS ’08). IEEE, 35–46.
HE, T., KRISHNAMURTHY, S., LUO, L., YAN, T., STOLERU, R., ZHOU, G., CAO, Q., VICAIRE, P., STANKOVIC,J., ABDELZAHER, T., HUI, J., AND KROGH, B. 2006. VigilNet: An Integrated Sensor Network Systemfor Energy-Efficient Surveillance. ACM Transactions on Sensor Networks 2, 1–38.
ACM Transactions on Sensor Networks, Vol. 1, No. 1, Article 1, Publication date: January 2012.

A Learning-based Approach to Confident Event Detection in Heterogeneous Sensor Networks 1:27
HILL, D. J., MINSKER, B. S., AND AMIR, E. 2007. Real-time bayesian anomaly detection for environmentalsensor data. In Proceedings of the 32nd conference of IAHR. International Association of HydraulicEngineering and Research, IAHR, Venice, Italy.
HILL, D. J., MINSKER, B. S., AND AMIR, E. 2009. Real-time Bayesian anomaly detection in streamingenvironmental data. Water Resources Research 45, W00D28, 1–16.
HSIN, C. AND LIU, M. 2004. Network Coverage using Low Duty-Cycled Sensors; Random and CoordinatedSleep Algorithms. In Proceedings of the 3rd International Symposium on Information Processing inSensor Networks (IPSN ’04). ACM/IEEE, 433–442.
HWANG, J., HE, T., AND KIM, Y. 2007. Exploring In-Situ Sensing Irregularity in Wireless Sensor Networks.In Proceedings of the 5th International Conference on Embedded Networked Sensor Systems (SenSys’07). ACM, 289–303.
ISLER, V. AND BAJCSY, R. 2005. The Sensor Selection Problem for Bounded Uncertainty Sensing Models. InProceedings of the 4th International Symposium on Sensor Networks (IPSN ’05). ACM/IEEE, 151–158.
KANG, S., LEE, J., JANG, H., LEE, H., LEE, Y., PARK, S., PARK, T., AND SONG, J. 2008. SeeMon: Scal-able and Energy-efficient Context Monitoring Framework for Sensor-right Mobile Environments. InProceedings of the 6th International Conference on Mobile Systems, Applications, and Services (MobiSys’08). ACM, 267–280.
KEALLY, M., ZHOU, G., AND XING, G. 2010. Watchdog: Confident Event Detection in Heterogeneous SensorNetworks. In Proceedings of the 16th IEEE Real-Time and Embedded Technology and ApplicationsSymposium (RTAS ’10). IEEE, 279–288.
KEALLY, M., ZHOU, G., XING, G., WU, J., AND PYLES, A. 2011. PBN: Towards Practical Activity Recog-nition Using Smartphone-Based Body Sensor Networks. In Proceedings of the 9th ACM Conference onEmbedded Networked Sensor Systems (SenSys ’11). ACM, 246–259.
KHAN, M., LE, H., LEMAY, M., MOINZADEH, P., WANG, L., YANG, Y., NOH, D., ABDELZAHER, T., GUNTER,C., HAN, J., AND JIN., X. 2010. Diagnostic Powertracing for Sensor Node Failure Analysis. In Proceed-ings of the 9th ACM/IEEE International Conference on Information Processing in Sensor Networks(IPSN ’10). ACM/IEEE, 117–128.
KIRKPATRICK, S., GELATT, C., AND VECCHI, M. 1983. Optimization by Simulated Annealing. Science 220,671–680.
KRAUSE, A., GUESTRIN, C., GUPTA, A., AND KLEINBERG, J. 2011. Robust sensor placements at informativeand communication-efficient locations. ACM Transactions on Sensor Networks 7, 4, 31:1–31:33.
KUMAR, S., LAI, T., AND ARORA, A. 2005. Barrier Coverage With Wireless Sensors. In Proceedings of the11th Annual International Conference on Mobile Computing and Networking (MobiCom ’05). ACM, 284–298.
LERNER, U. 2002. Hybrid bayesian networks for reasoning about complex systems. Ph.D. thesis, StanfordUniversity, Palo Alto, California.
LORINCZ, K., CHEN, B., WATERMAN, J., WERNER-ALLEN, G., AND WELSH, M. 2008. Resource AwareProgramming in the Pixie OS. In Proceedings of the 6th ACM Conference on Embedded NetworkedSensor Systems (SenSys ’08). ACM, 211–224.
MALINOWSKI, M., MOSKWA, M., FELDMEIERA, M., LAIBOWITZ, M., AND PARADISO, J. 2008. CargoNet:A Low-Cost MicroPower Sensor Node Exploiting Quasi-Passive Wakeup for Adaptive AsynchronousMonitoring of Exceptional Events. In Proceedings of the 5th International Conference on EmbeddedNetworked Sensor Systems (SenSys ’08). ACM, 145–159.
MO, L., HE, Y., LIU, Y., ZHAO, J., TANG, S., LI, X., AND DAI, G. 2009. Canopy Closure Estimates withGreenOrbs: Sustainable Sensing in the Forest. In Proceedings of the 7th ACM Conference on EmbeddedNetworked Sensor Systems (SenSys ’09). ACM, 99–112.
RABINER, L. 1989. A Tutorial on Hidden Markov Models and Selected Applications in Speech Recognition.In Proceedings of the IEEE. IEEE, 257–286.
RACHLIN, Y., NEGI, R., AND KHOSLA, P. 2005. Sensing Capacity for Discrete Sensor Network Applications.In Proceedings of the 4th International Symposium on Information Processing in Sensor Networks (IPSN’05). IEEE/ACM, 126–132.
SHNAYDER, V., HEMPSTEAD, M., CHEN, B., ALLEN, G. W., AND WELSH, M. 2004. Simulating the PowerConsumption of Large-Scale Sensor Network Applications. In Proceedings of the 2nd International Con-ference on Embedded Networked Sensor Systems (SenSys ’04). ACM, 188–200.
SHRIVASTAVA, N., MUDUMBAI, R., MADHOW, U., AND SURI, S. 2006. Target Tracking with Binary Prox-imity Sensors: Fundamental Limits, Minimal Descriptions, and Algorithms. In Proceedings of the 4thInternational Conference on Embedded Networked Sensor Systems (SenSys ’06). ACM, 251–264.
ACM Transactions on Sensor Networks, Vol. 1, No. 1, Article 1, Publication date: January 2012.

1:28 M. Keally et al.
SIMON, G., MAROTI, M., LEDECZI, A., BALOGH, G., KUSY, B., NADAS, A., PAP, G., SALLAI, J., AND FRAMP-TON, K. 2004. Sensor Network-Based Countersniper System. In Proceedings of the 2nd InternationalConference on Embedded Networked Sensor Systems (SenSys ’04). ACM, 1–12.
SINGH, A., RAMAKRISHNAN, C., RAMAKRISHNAN, I., AND WARREN, D. 2008. A Methodology for In-Network Evaluation of Integrated Logical-Statistical Models. In Proceedings of the 6th ACM Conferenceon Embedded Networked Sensor Systems (SenSys ’08). ACM, 211–224.
SUBRAMANIAM, S., KALOGERAKI, V., AND PALPANAS, T. 2006. Distributed Real-Time Detection and Track-ing of Homogeneous Regions in Sensor Networks. In Proceedings of the 27th International Real-TimeSystems Symposium (RTSS ’06). IEEE, 401–411.
VARSHNEY, P. 1996. Distributed Detection and Data Fusion. Springer.VOLGYESI, P., BALOGH, G., NADAS, A., NASH, C., AND LEDECZI, A. 2007. Shooter Localization and Weapon
Classification with Soldier-Wearable Networked Sensors. In Proceedings of the 5th International Con-ference on Mobile Systems, Applications, and Services (MobiSys ’07). ACM, 113–126.
WANG, H., YAO, K., POTTIE, G., AND ESTRIN, D. 2004. Entropy-based Sensor Selection Heuristic for TargetLocalization. In Proceedings of the 3rd International Symposium on Information Processing in SensorNetworks (IPSN ’04). ACM/IEEE, 36–45.
WANG, W., SRINIVASAN, V., WANG, B., AND CHUA, K. 2006. Coverage for Target Localization in Wire-less Sensor Networks. In Proceedings of the 5th International Conference on Information Processing inSensor Networks (IPSN ’06). ACM/IEEE, 118–125.
XING, G., TAN, R., LIU, B., WANG, J., JIA, X., AND WEI, C. 2009. Data Fusion Improves the Coverageof Wireless Sensor Networks. In Proceedings of the 15th Annual Conference on Mobile Computing andNetworking (MobiCom ’09). ACM, 157–168.
XING, G., WANG, X., ZHANG, Y., LU, C., PLESS, R., AND GILL, C. 2005. Integrated Coverage and Connec-tivity Configuration for Energy Conservation in Sensor Networks. ACM Transactions on Sensor Net-works 1, 36–72.
YAN, T., HE, T., AND STANKOVIC, J. 2003. Differentiated Surveillance for Sensor Networks. In Proceedingsof the 1st International Conference on Embedded Networked Sensor Systems (SenSys ’03). ACM, 51–62.
YANG, G., SHUKLA, V., AND QIAO, D. 2008. A Novel On-Demand Framework for Collaborative Object De-tection in Sensor Networks. In The 27th Conference on Computer Communications (INFOCOM ’08).IEEE, 2020–2028.
YUAN, Z., TAN, R., XING, G., LU, C., CHEN, Y., AND WANG, J. 2008. Fast Sensor Placement Algorithms forFusion-based Target Detection. In Proceedings of the 2008 Real-Time Systems Symposilum (RTSS ’08).IEEE, 103–112.
ZAPPI, P., LOMBRISER, C., STEIFMEIER, T., FARELLA, E., ROGGEN, D., BENINI, L., AND TROSTER, G.2008. Activity Recognition from On-Body Sensors: Accuracy-Power Trade-Off by Dynamic Sensor Selec-tion. In Proceedings of the 5th European Conference on Wireless Sensor Networks (EWSN ’08). 17–33.
ZHAO, F., SHIN, J., AND REICH, J. 2002. Information-Driven Dynamic Sensor Collaboration for TrackingApplications. IEEE Signal Processing 19, 61–72.
ZHUANG, Y., CHEN, L., WANG, X., AND LIAN, J. 2007. A Weighted Moving Average-Based Approach forCleaning Sensor Data. In Proceedings of the 27th International Conference on Distributed ComputingSystems (ICDCS ’07). IEEE, 38–.
ACM Transactions on Sensor Networks, Vol. 1, No. 1, Article 1, Publication date: January 2012.