1. · able t 1. ades hy c aby photometry id hic/hd note v v b y by hk hk n obs av g; n sur 1 15304...
TRANSCRIPT
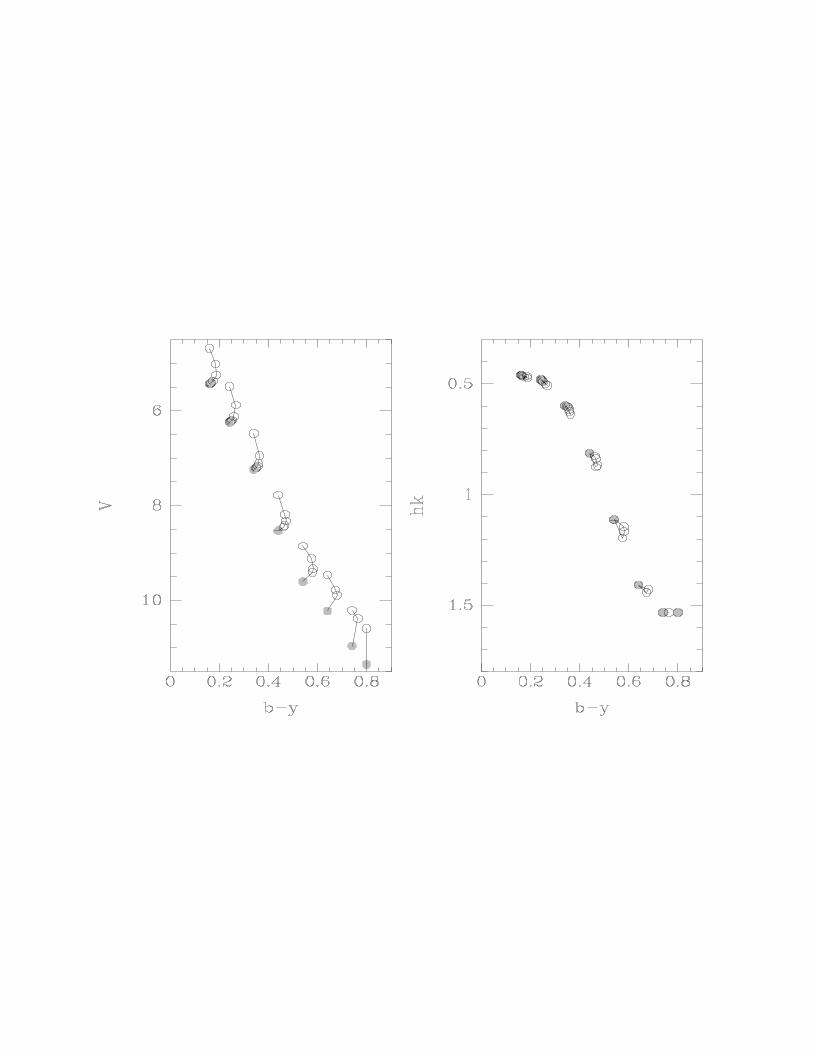

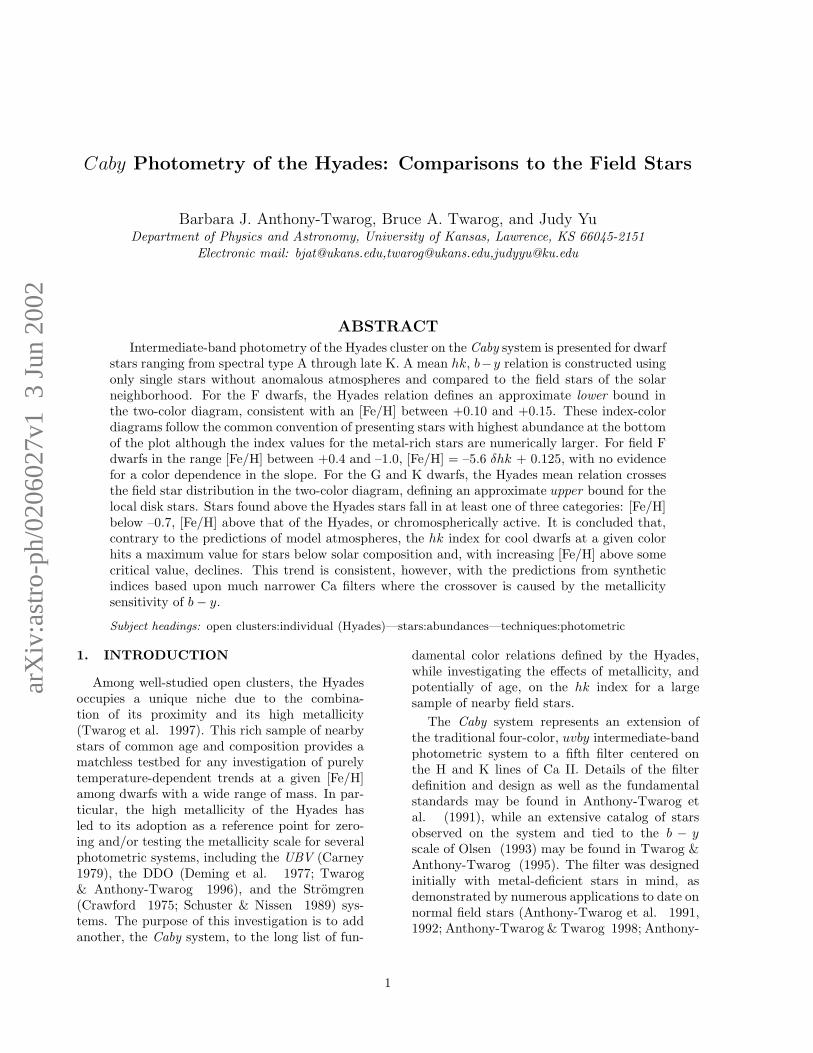
Table 1. Hyades Caby Photometry
ID HIC/HD Note V �
V
b� y �
by
hk �
hk
N
obs
V
avg
b� y
avg
N
V
; N
by
N
sur
1 15304 B 7.388 0.005 0.364 0.002 0.690 0.003 5 7.388 0.364 5 1
2 15310 B 7.774 0.008 0.394 0.006 0.727 0.007 6 7.773 0.396 9 3
4 16529 8.873 0.013 0.505 0.009 0.977 0.001 4 8.873 0.505 4 1
5 16908 B 9.332 0.002 0.533 0.009 1.086 0.014 3 9.332 0.533 3 1
7 18327 8.969 0.019 0.523 0.004 1.027 0.013 7 8.976 0.523 10 2
9 18719 NM 8.673 0.025 0.439 0.009 0.769 0.016 3 8.673 0.439 3 1
10 19148 7.839 0.013 0.381 0.013 0.676 0.010 3 7.842 0.384 9,14 6
13 19504 6.598 0.011 0.270 0.009 0.529 0.010 1 6.602 0.281 3,6 4
15 19793 8.040 0.014 0.421 0.006 0.733 0.010 4 8.042 0.420 6 3
16 19789 7.061 0.011 0.282 0.009 0.531 0.010 1 7.060 0.283 3,6 4
17 19781 B 8.459 0.010 0.436 0.007 0.774 0.009 13 8.458 0.434 19 3
18 19786 8.037 0.015 0.412 0.005 0.723 0.004 11 8.039 0.410 15 3
19 19796 7.108 0.007 0.335 0.006 0.599 0.007 5 7.104 0.338 12,16 6
21 19934 9.149 0.018 0.491 0.004 0.916 0.001 4 9.142 0.487 7 2
22 20019 B 8.320 0.013 0.467 0.008 0.809 0.001 5 8.317 0.466 10 3
23 20056 B 7.533 0.010 0.427 0.009 0.755 0.007 4 7.539 0.426 12 4
25 20082 9.559 0.012 0.558 0.005 1.188 0.011 6 9.561 0.555 14 3
26 20130 8.616 0.021 0.455 0.001 0.840 0.007 4 8.611 0.455 5 2
27 20146 8.472 0.013 0.447 0.002 0.820 0.008 6 8.469 0.444 13,15 5
29 20215 B 6.869 0.010 0.354 0.004 0.634 0.013 5 6.862 0.357 33,37 6
30 20219 B 5.587 0.008 0.171 0.005 0.467 0.006 14 5.586 0.175 15,19 3
31 20237 7.458 0.006 0.366 0.006 0.635 0.003 4 7.458 0.367 7,10 5
37 20357 6.607 0.006 0.274 0.003 0.494 0.006 16 6.604 0.276 19,24 5
39 20441 B 7.840 0.011 0.417 0.008 0.756 0.009 2 7.849 0.420 7 3
40 20440 B 6.982 0.015 0.367 0.002 0.665 0.017 3 6.978 0.370 6,9 4
42 20480 8.833 0.007 0.455 0.007 0.853 0.012 3 8.833 0.457 7 3
43 20482 B 9.386 0.021 0.529 0.006 1.022 0.009 3 9.386 0.529 3 1
46 20492 9.111 0.007 0.502 0.006 0.974 0.009 15 9.107 0.502 26 4
48 20557 7.136 0.011 0.347 0.009 0.597 0.013 2 7.132 0.346 8,12 6
49 HD 27835 8.220 0.009 0.382 0.002 0.701 0.004 7 8.222 0.382 12,17 4
50 20553 B 7.586 0.011 0.397 0.006 0.671 0.011 6 7.576 0.392 62,65 7
51 20567 6.984 0.010 0.300 0.001 0.551 0.001 2 6.969 0.300 7,11 5
52 20577 B 7.800 0.003 0.390 0.005 0.670 0.014 12 7.798 0.390 18,23 6
57 20661 B 6.459 0.006 0.320 0.007 0.575 0.004 13 6.448 0.323 17,21 3
58 20686 B 7.512 0.013 0.431 0.010 0.766 0.009 4 7.516 0.430 7 3
59 HD 28034 B 7.475 0.008 0.359 0.003 0.650 0.007 16 7.473 0.358 63,70 7
62 20712 B 7.374 0.021 0.347 0.001 0.657 0.003 3 7.369 0.348 8,12 5
63 20719 B 8.040 0.012 0.414 0.003 0.720 0.013 11 8.040 0.411 21,22 6
64 20741 8.130 0.006 0.419 0.005 0.754 0.011 13 8.114 0.417 25,27 7
65 20815 7.415 0.009 0.353 0.007 0.628 0.007 14 7.417 0.352 21,27 6

Table 1. (continued)
ID HIC/HD Note V �
V
b� y �
by
hk �
hk
N
obs
V
avg
b� y
avg
N
V
; N
by
N
sur
66 20826 7.508 0.006 0.359 0.002 0.635 0.002 4 7.505 0.364 7,10 4
68 20873 B 5.917 0.005 0.209 0.005 0.450 0.009 14 5.916 0.212 15,19 3
69 20890 B 8.610 0.009 0.447 0.004 0.834 0.013 3 8.609 0.448 4 2
73 20899 7.841 0.011 0.384 0.002 0.700 0.004 6 7.840 0.387 13,15 5
75 20916 B 6.560 0.003 0.346 0.001 0.612 0.002 3 6.568 0.349 15,19 7
77 20935 B 7.025 0.012 0.323 0.003 0.573 0.009 4 7.024 0.329 10,13 5
78 20948 B 6.898 0.006 0.304 0.006 0.543 0.004 4 6.901 0.304 10,15 6
79 20951 B 8.935 0.010 0.488 0.002 0.947 0.005 4 8.939 0.487 15,17 5
81 21008 B 7.072 0.022 0.310 0.006 0.544 0.004 2 7.085 0.317 5,8 5
86 21066 7.027 0.001 0.311 0.003 0.552 0.005 4 7.029 0.314 10,13 5
87 21099 8.592 0.006 0.454 0.005 0.841 0.017 5 8.591 0.455 6 2
88 21112 7.778 0.013 0.354 0.001 0.633 0.008 8 7.773 0.355 13,16 5
90 21152 6.372 0.004 0.275 0.010 0.522 0.007 10 6.372 0.278 10,14 2
91 HD 28783 B 8.923 0.012 0.520 0.002 0.956 0.008 3 8.923 0.520 3 1
92 HD 28805 8.670 0.021 0.455 0.010 0.843 0.008 5 8.663 0.454 11 3
93 HD 28878 9.401 0.002 0.519 0.001 1.015 0.006 3 9.389 0.517 7 3
94 21267 6.625 0.010 0.289 0.008 0.501 0.009 1 6.620 0.290 4,7 4
96 21280 B 8.497 0.024 0.499 0.011 0.932 0.010 3 8.497 0.499 3 1
97 21317 7.923 0.005 0.395 0.008 0.710 0.010 3 7.919 0.396 8 3
99 HD 29159 9.396 0.011 0.506 0.012 0.991 0.023 3 9.382 0.506 7 3
102 21543 B 7.532 0.012 0.383 0.004 0.682 0.008 4 7.531 0.390 7,12 4
103 21588 B 5.797 0.004 0.193 0.005 0.456 0.006 12 5.791 0.195 17,20 4
105 21637 7.517 0.012 0.362 0.008 0.676 0.009 2 7.517 0.360 2,5 2
106 21654 B 7.967 0.006 0.414 0.005 0.749 0.006 5 7.968 0.412 9 3
109 21741 9.399 0.011 0.479 0.013 0.909 0.021 3 9.399 0.479 3 1
113 22221 B 7.246 0.003 0.359 0.001 0.642 0.003 4 7.242 0.365 7,11 4
114 22265 B 8.533 0.008 0.435 0.002 0.831 0.007 2 8.530 0.444 6 3
115 22350 B 9.065 0.015 0.498 0.004 0.965 0.003 3 9.065 0.498 3 1
116 22380 8.966 0.003 0.496 0.008 0.936 0.010 3 8.968 0.496 4 2
118 22422 7.741 0.002 0.367 0.004 0.682 0.005 4 7.734 0.372 9,12 5
119 22496 B 7.089 0.006 0.360 0.004 0.623 0.016 3 7.094 0.364 5,8 4
120 22505 B 7.721 0.006 0.446 0.001 0.819 0.003 6 7.713 0.448 10 2
121 22524 B 7.294 0.009 0.323 0.002 0.600 0.005 6 7.288 0.329 13,16 5
122 22550 B 6.746 0.004 0.348 0.003 0.622 0.009 4 6.740 0.355 11,14 5
124 22607 B 6.252 0.010 0.319 0.001 0.551 0.005 3 6.245 0.328 10,15 5
127 23069 8.892 0.004 0.447 0.005 0.846 0.004 5 8.888 0.447 8 3
140 20601 B 8.928 0.011 0.465 0.001 0.845 0.001 4 8.927 0.465 9 3
142 22203 B 8.314 0.009 0.419 0.003 0.753 0.002 5 8.313 0.418 9 3
143 22566 7.895 0.006 0.339 0.008 0.624 0.010 4 7.896 0.342 7 3
162 19870 B 7.823 0.013 0.435 0.007 0.798 0.003 4 7.826 0.436 7 3

Table 1. (continued)
ID HIC/HD Note V �
V
b� y �
by
hk �
hk
N
obs
V
avg
b� y
avg
N
V
; N
by
N
sur
170 18018 B 10.176 0.010 0.670 0.008 1.443 0.021 2 10.176 0.670 2 1
172 HD 285762 NM 10.203 0.010 0.401 0.008 0.724 0.009 1 10.178 0.404 5 2
174 20563 9.975 0.017 0.602 0.005 1.314 0.020 3 9.984 0.600 10 3
177 HD 285828 B 10.281 0.020 0.613 0.011 1.335 0.046 2 10.300 0.619 8 3
178 20850 9.024 0.013 0.496 0.001 0.945 0.001 4 9.024 0.500 14 4
179 20827 B 9.480 0.008 0.537 0.004 1.097 0.009 6 9.475 0.536 9 2
180 20978 9.079 0.004 0.502 0.003 0.984 0.007 2 9.077 0.503 6 3
181 HD 285805 10.308 0.010 0.647 0.008 1.441 0.015 3 10.305 0.655 9 2
182 HD 28545 B 8.916 0.012 0.506 0.009 0.917 0.014 3 8.909 0.502 7 3
183 HD 28977 9.671 0.011 0.527 0.005 1.060 0.014 3 9.665 0.531 10 3
185 21762 B 9.430 0.005 0.621 0.008 1.253 0.018 3 9.434 0.627 6 2
187 23498 B 8.978 0.005 0.458 0.004 0.870 0.005 6 8.981 0.458 11 3
1068 19808 10.683 0.009 0.679 0.002 1.747 0.007 2 10.684 0.694 6 2
1135 20086 B 9.978 0.010 0.628 0.009 1.348 0.015 2 9.972 0.626 5 2
1407 20762 10.456 0.010 0.653 0.008 1.517 0.009 1 10.462 0.661 3 2
1627 21123 B 9.526 0.016 0.553 0.009 1.175 0.011 2 9.532 0.557 4 2
2010 19098 9.269 0.017 0.521 0.009 1.012 0.015 3 9.283 0.518 6 2
2011 18946 10.106 0.015 0.613 0.005 1.317 0.010 4 10.106 0.614 4 1
2014 19316 11.240 0.005 0.780 0.008 1.468 0.017 3 11.240 0.780 3 1
2015 19207 10.481 0.010 0.672 0.001 1.479 0.040 5 10.481 0.672 5 1
2016 19263 9.898 0.012 0.587 0.009 1.228 0.021 3 9.902 0.584 5 2
2018 HD 284785 9.430 0.014 0.533 0.005 1.077 0.002 4 9.430 0.533 4 1
2020 19591 B 9.385 0.008 0.643 0.007 1.077 0.007 3 9.385 0.643 3 1
2033 20419 B 9.774 0.004 0.672 0.005 1.504 0.031 4 9.775 0.672 6 2
2059 20751 B 9.434 0.002 0.599 0.001 1.213 0.006 3 9.429 0.596 6 2
2080 21723 9.990 0.016 0.605 0.006 1.363 0.028 3 9.999 0.606 5 2
2083 B 10.131 0.015 0.658 0.008 1.454 0.023 2 10.131 0.658 2 1
2090 HD 29896 B 9.815 0.007 0.570 0.007 1.215 0.017 3 9.820 0.571 6 2
2098 22654 10.268 0.002 0.616 0.002 1.341 0.002 3 10.268 0.616 3 1
2119 22177 10.873 0.016 0.725 0.013 1.525 0.036 3 10.873 0.725 3 1
7015 17766 10.805 0.017 0.781 0.018 1.569 0.029 2 10.805 0.781 2 1
HG 7-034 18322 10.103 0.019 0.619 0.009 1.338 0.021 3 10.103 0.619 3 1
HG 7-115 19441 10.053 0.012 0.683 0.005 1.526 0.027 4 10.053 0.683 4 1
8064 HD 284785 9.807 0.005 0.590 0.005 1.295 0.011 3 9.807 0.590 3 1

arX
iv:a
stro
-ph/
0206
027v
1 3
Jun
200
2
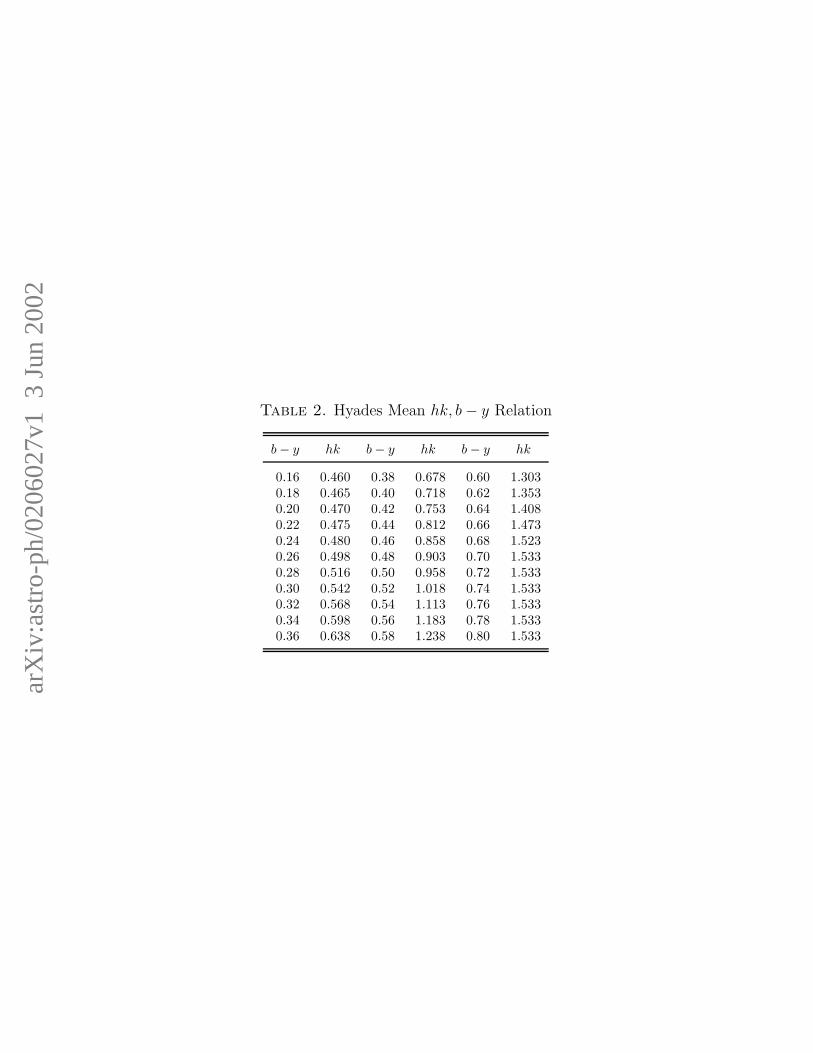
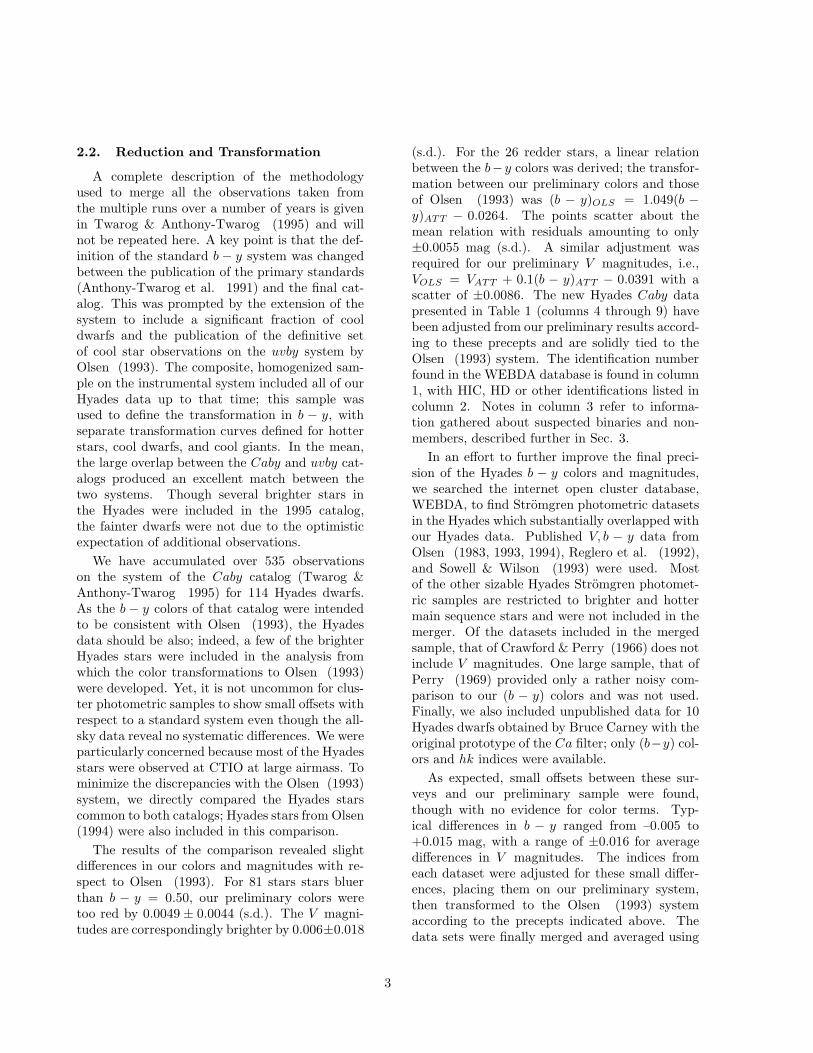
Table 2. Hyades Mean hk, b− y Relation
b− y hk b− y hk b− y hk
0.16 0.460 0.38 0.678 0.60 1.3030.18 0.465 0.40 0.718 0.62 1.3530.20 0.470 0.42 0.753 0.64 1.4080.22 0.475 0.44 0.812 0.66 1.4730.24 0.480 0.46 0.858 0.68 1.5230.26 0.498 0.48 0.903 0.70 1.5330.28 0.516 0.50 0.958 0.72 1.5330.30 0.542 0.52 1.018 0.74 1.5330.32 0.568 0.54 1.113 0.76 1.5330.34 0.598 0.56 1.183 0.78 1.5330.36 0.638 0.58 1.238 0.80 1.533


arX
iv:a
stro
-ph/
0206
027v
1 3
Jun
200
2
Caby Photometry of the Hyades: Comparisons to the Field Stars
Barbara J. Anthony-Twarog, Bruce A. Twarog, and Judy YuDepartment of Physics and Astronomy, University of Kansas, Lawrence, KS 66045-2151
Electronic mail: [email protected],[email protected],[email protected]
ABSTRACT
Intermediate-band photometry of the Hyades cluster on the Caby system is presented for dwarfstars ranging from spectral type A through late K. A mean hk, b−y relation is constructed usingonly single stars without anomalous atmospheres and compared to the field stars of the solarneighborhood. For the F dwarfs, the Hyades relation defines an approximate lower bound inthe two-color diagram, consistent with an [Fe/H] between +0.10 and +0.15. These index-colordiagrams follow the common convention of presenting stars with highest abundance at the bottomof the plot although the index values for the metal-rich stars are numerically larger. For field Fdwarfs in the range [Fe/H] between +0.4 and –1.0, [Fe/H] = –5.6 δhk + 0.125, with no evidencefor a color dependence in the slope. For the G and K dwarfs, the Hyades mean relation crossesthe field star distribution in the two-color diagram, defining an approximate upper bound for thelocal disk stars. Stars found above the Hyades stars fall in at least one of three categories: [Fe/H]below –0.7, [Fe/H] above that of the Hyades, or chromospherically active. It is concluded that,contrary to the predictions of model atmospheres, the hk index for cool dwarfs at a given colorhits a maximum value for stars below solar composition and, with increasing [Fe/H] above somecritical value, declines. This trend is consistent, however, with the predictions from syntheticindices based upon much narrower Ca filters where the crossover is caused by the metallicitysensitivity of b− y.
Subject headings: open clusters:individual (Hyades)—stars:abundances—techniques:photometric
1. INTRODUCTION
Among well-studied open clusters, the Hyadesoccupies a unique niche due to the combina-tion of its proximity and its high metallicity(Twarog et al. 1997). This rich sample of nearbystars of common age and composition provides amatchless testbed for any investigation of purelytemperature-dependent trends at a given [Fe/H]among dwarfs with a wide range of mass. In par-ticular, the high metallicity of the Hyades hasled to its adoption as a reference point for zero-ing and/or testing the metallicity scale for severalphotometric systems, including the UBV (Carney1979), the DDO (Deming et al. 1977; Twarog& Anthony-Twarog 1996), and the Stromgren(Crawford 1975; Schuster & Nissen 1989) sys-tems. The purpose of this investigation is to addanother, the Caby system, to the long list of fun-
damental color relations defined by the Hyades,while investigating the effects of metallicity, andpotentially of age, on the hk index for a largesample of nearby field stars.
The Caby system represents an extension ofthe traditional four-color, uvby intermediate-bandphotometric system to a fifth filter centered onthe H and K lines of Ca II. Details of the filterdefinition and design as well as the fundamentalstandards may be found in Anthony-Twarog etal. (1991), while an extensive catalog of starsobserved on the system and tied to the b − yscale of Olsen (1993) may be found in Twarog &Anthony-Twarog (1995). The filter was designedinitially with metal-deficient stars in mind, asdemonstrated by numerous applications to date onnormal field stars (Anthony-Twarog et al. 1991,1992; Anthony-Twarog & Twarog 1998; Anthony-
1

Twarog et al. 2000), clusters (Anthony-Twarog etal. 1995; Rey et al. 2000), and variables (Baird1996; Hintz et al. 1998). Metallicity calibrationshave been produced for both the metal-deficientgiants (Anthony-Twarog & Twarog 1998) andmetal-deficient dwarfs (Anthony-Twarog et al.2000), but preliminary analysis indicated that fordwarfs hotter than the sun, the hk index, definedas (Ca-b)-(b-y), remains metallicity sensitive forstars of solar abundance or higher (Twarog &Anthony-Twarog 1995), a result consistent withthe theoretical models of Soon et al. (1993).Because of the high metallicity of the Hyades rel-ative to the typical star in the field of the solarneighborhood, it provides an ideal test of this pre-diction, as well as a means of probing the limitsof its sensitivity.
A second issue of particular relevance for metal-rich stars is the role of chromospheric emissionon the apparent strength of the hk index. Asone moves toward lower temperature, the expecta-tion is that the absorption features will saturate,leaving an index which is almost exclusively de-pendent upon temperature. That the sensitivityof the hk index to metallicity should decline near[Fe/H] = 0.0 for (b − y) redder than 0.5 is read-ily apparent in the synthetic indices of Soon et al.(1993), though the models imply that even G andK dwarfs with abundances well above solar shouldexhibit larger hk indices at a given color. However,line reversals triggered by chromospheric activity(see, e.g., Vaughan 1980) may fill in the cores ofthe absorption features, making the star appearmore metal-deficient than it actually is. More-over, the strength of this line reversal has longbeen known to be age-dependent (Wilson 1963).Since the Hyades is moderately young (less than 1Gyr) compared to the average cool dwarf near thesun and contains some stars with an anomalousdegree of chromospheric activity, it may providesome insight into this question. Finally, the ma-jority of the stars known to be Hyades membershave been studied in detail, thereby allowing us tolook for additional photometric anomalies not tiedto the metallicity of the stars.
Section 2 contains the details of the observa-tions, their transformation to the standard Cabysystem, and the merger of our V , b−y data with anextensive array of published data on the Hyadesdwarfs in an effort to minimize the potential ef-
fects of internal photometric scatter on the meanrelations. In Sec. 3 we derive the Hyades meanrelation in the hk, (b-y) diagram and discuss thepotential sources of intrinsic scatter in the two-color diagram. Sec. 4 compares the single-starHyades relation to a large sample of nearby fieldstars, providing some insight into possible sourcesof the differences between expectation and real-ity, particularly at cooler temperatures. Sec. 5contains a summary of our conclusions and sug-gestions for further work on the system in light ofthe Hyades anomalies.
2. The Data
2.1. Observations
The data discussed here were obtained as partof the wide-ranging program of observations on theCaby system started in Dec. 1983 and continuedon through 1994. The Caby work since then hasfocused on more specialized applications, but someHyades stars were included from the beginning ofthe program with calibration and standardizationpurposes in mind. The preliminary sample wasselected from the well-known, brighter membersidentified by Van Bueren (1952), but the morecomprehensive database detailed here is tied tothe compilation of Griffin et al. (1988). The ob-servations were made on a variety of telescopesincluding the 0.9 m and 1.2 m at KPNO and, pri-marily, the 0.6 m, 0.9 m, 1.0 m, and 1.5 m atCTIO. All the telescopes at the national observa-tories were equipped with pulse-counting, single-channel photometers mounted with S-20 photo-multipliers. In addition, a modest number of ob-servations were obtained using a pulse-countingphotometer equipped with a 1P21 photomultiplieron the 0.4 m telescope at Braeside Observatory inArizona. The filter sets used have changed overthe years, but extreme care has been taken to en-sure transformation to the standard system and nosignificant problems have been encountered. Ob-servations of the fainter stars in this study wereall made with the 1.0 m and 1.5 m telescopes atCTIO equipped with the same filter set. For moreinformation regarding the design of the Ca filterand the observing procedure, the reader is referredto Anthony-Twarog et al. (1991).
2
2.2. Reduction and Transformation
A complete description of the methodologyused to merge all the observations taken fromthe multiple runs over a number of years is givenin Twarog & Anthony-Twarog (1995) and willnot be repeated here. A key point is that the def-inition of the standard b − y system was changedbetween the publication of the primary standards(Anthony-Twarog et al. 1991) and the final cat-alog. This was prompted by the extension of thesystem to include a significant fraction of cooldwarfs and the publication of the definitive setof cool star observations on the uvby system byOlsen (1993). The composite, homogenized sam-ple on the instrumental system included all of ourHyades data up to that time; this sample wasused to define the transformation in b − y, withseparate transformation curves defined for hotterstars, cool dwarfs, and cool giants. In the mean,the large overlap between the Caby and uvby cat-alogs produced an excellent match between thetwo systems. Though several brighter stars inthe Hyades were included in the 1995 catalog,the fainter dwarfs were not due to the optimisticexpectation of additional observations.
We have accumulated over 535 observationson the system of the Caby catalog (Twarog &Anthony-Twarog 1995) for 114 Hyades dwarfs.As the b − y colors of that catalog were intendedto be consistent with Olsen (1993), the Hyadesdata should be also; indeed, a few of the brighterHyades stars were included in the analysis fromwhich the color transformations to Olsen (1993)were developed. Yet, it is not uncommon for clus-ter photometric samples to show small offsets withrespect to a standard system even though the all-sky data reveal no systematic differences. We wereparticularly concerned because most of the Hyadesstars were observed at CTIO at large airmass. Tominimize the discrepancies with the Olsen (1993)system, we directly compared the Hyades starscommon to both catalogs; Hyades stars from Olsen(1994) were also included in this comparison.
The results of the comparison revealed slightdifferences in our colors and magnitudes with re-spect to Olsen (1993). For 81 stars stars bluerthan b − y = 0.50, our preliminary colors weretoo red by 0.0049 ± 0.0044 (s.d.). The V magni-tudes are correspondingly brighter by 0.006±0.018
(s.d.). For the 26 redder stars, a linear relationbetween the b− y colors was derived; the transfor-mation between our preliminary colors and thoseof Olsen (1993) was (b − y)OLS = 1.049(b −
y)ATT − 0.0264. The points scatter about themean relation with residuals amounting to only±0.0055 mag (s.d.). A similar adjustment wasrequired for our preliminary V magnitudes, i.e.,VOLS = VATT + 0.1(b − y)ATT − 0.0391 with ascatter of ±0.0086. The new Hyades Caby datapresented in Table 1 (columns 4 through 9) havebeen adjusted from our preliminary results accord-ing to these precepts and are solidly tied to theOlsen (1993) system. The identification numberfound in the WEBDA database is found in column1, with HIC, HD or other identifications listed incolumn 2. Notes in column 3 refer to informa-tion gathered about suspected binaries and non-members, described further in Sec. 3.
In an effort to further improve the final preci-sion of the Hyades b − y colors and magnitudes,we searched the internet open cluster database,WEBDA, to find Stromgren photometric datasetsin the Hyades which substantially overlapped withour Hyades data. Published V, b − y data fromOlsen (1983, 1993, 1994), Reglero et al. (1992),and Sowell & Wilson (1993) were used. Mostof the other sizable Hyades Stromgren photomet-ric samples are restricted to brighter and hottermain sequence stars and were not included in themerger. Of the datasets included in the mergedsample, that of Crawford & Perry (1966) does notinclude V magnitudes. One large sample, that ofPerry (1969) provided only a rather noisy com-parison to our (b − y) colors and was not used.Finally, we also included unpublished data for 10Hyades dwarfs obtained by Bruce Carney with theoriginal prototype of the Ca filter; only (b−y) col-ors and hk indices were available.
As expected, small offsets between these sur-veys and our preliminary sample were found,though with no evidence for color terms. Typ-ical differences in b − y ranged from –0.005 to+0.015 mag, with a range of ±0.016 for averagedifferences in V magnitudes. The indices fromeach dataset were adjusted for these small differ-ences, placing them on our preliminary system,then transformed to the Olsen (1993) systemaccording to the precepts indicated above. Thedata sets were finally merged and averaged using
3
weights based upon the consistency between eachdataset and our preliminary Hyades dataset. Thefinal averaged V magnitudes and b − y colors arefound in columns 11 and 12 of Table 1, followed bythe number of V and b − y observations incorpo-rated in the average and the number of datasetsincluded. The standard errors of the mean forthe final magnitudes and indices were quite smalland are not included in Table 1. Typical values of±0.004 (s.e.m.) and ±0.003 (s.e.m.) were foundfor V and b− y, respectively.
Finally, the b−y colors for Hyades stars in com-mon with Olsen (1993) were checked to verify thatthe color system is consistent with that sample.From 81 stars in common, the mean difference in(b− y) for the merged sample is −0.0010± 0.0037(s.d.) in the sense (OLS - Table 1).
3. The Hyades hk − (b− y) Relation
In defining any two-color relation, one ideallywants to exclude stars affected by anomalies whichmight distort the relation beyond normal photo-metric scatter. In the case of a cluster sample,a fundamental requirement is that stars be clas-sified as cluster members. Since the time of theoriginal compilation of the Hyades stars for ob-servation, based primarily upon the discussion inGriffin et al. (1988), additional parallax, radial-velocity, and proper-motion observations, particu-larly those by Hipparcos (Perryman et al. 1998),have clarified and eliminated the membership of afew stars in Table 1. Star VB/WEBDA 9, despitepositions in the color-magnitude diagram (CMD)and hk, b− y diagram consistent with the Hyades,is now classed as a kinematic non-member. Asecond, more obvious interloper is VB/WEBDA172. Originally classed as a Hyades subdwarf, itlies well below the main sequence in the HyadesCMD. This class of stars is now known to be aproduct of more distant nonmembers whose spacevelocities conspire to produce proper motions com-patible with those of the Hyades members (Han-son & Vasilevskis 1983). These two stars will beremoved from further discussion. The remaining112 stars are classed as probable members by Per-ryman et al. (1998) or, if not included in theHipparcos survey, have been tagged as probablemembers by Griffin et al. (1988).
The next obvious exclusion to make is the elimi-
nation of all stars which are multiple systems. Thepresence of one or more companions may distortthe colors of the composite system directly via thecombined colors of the stars or indirectly throughan alteration of the structure and/or evolution-ary state of the star and its atmosphere, as inthe case of chromospherically active stars createdthrough tidal interaction. Following de Bruijne etal. (2001), in deriving the mean relation we haveeliminated any star which has been tagged as apotential binary through direct observation fromthe ground or from data obtained fromHipparcos;see Table A.1 of de Bruijne et al. (2001). Theseclassifications have been supplemented by the reg-ularly updated information on the Hyades fromWEBDA, in particular the interferometric surveyof Hyades multiplicity by Patience et al. (1998).In many cases, the binary nature of the systemmay be expected to have little or no impact onthe observed colors; the angular separation of thestars might be too large for both stars to be ob-served simultaneously with a standard photome-ter or the mass, temperature, and luminosity ratiobetween the stars may be too large to affect thecolors of the primary star. With a reasonably ex-tensive photometric sample, we have chosen to bevery conservative in selecting stars to define themean relations which can be definitively classedas single. Of the 112 members in Table 1, 54 starshave some indication of multiplicity and are notedwith a “B” in column 3, leaving 58 single stars.
Before compiling the final relation, as a precau-tion in case some binaries have been included inthe derivation due to inadequate information, onecan construct artificial binary systems and esti-mate what impact they might have on the two-color relation. Use has been made of the finalrelation in constructing the composite pairs bychoosing a star of a given color on the main se-quence, then sequentially combining the fluxes ineach bandpass for a series of stars at decreasingmass/luminosity along the main sequence. The lo-cations of the composite systems in the CMD areillustrated in Fig. 1a, while the composite colorsproduce the pattern shown in Fig. 1b. In Fig. 1a,the curves at each location along the CMD startwith two stars of identical color, then illustratethe effect of altering the composite system usinga secondary which resembles the next sequentialpoint down on the main sequence. The trend in
4
the CMD is well-known and essentially the samefor all photometric systems. Composites of identi-cal stars are located at the same color as the singlestars, but 0.75 mag above the main sequence. Asthe secondary star is replaced with a cooler, lessluminous star farther down the main sequence,the color difference initially shifts the compositeincreasingly to the red but at a smaller distanceabove the main sequence. Eventually, the decreas-ing luminosity of the secondary creates a smallerimpact on the primary system; the color and ab-solute magnitude of the composite move closer tothat of the primary star alone.
For the two-color diagram, the pattern ofchanges is slightly more complex because of thechanging slope of the mean relation. For the starshotter than the sun (b − y ≤ 0.4), the compositesystems are always redder in b− y than the singlestars, with the size of the shift larger for com-posites with the smaller difference in luminosity.The combined change in both indices moves thestars approximately parallel to the mean relation,implying that binaries should not be a signifi-cant source of scatter among hotter dwarfs in thehk, b − y relation. The steepening slope for thelate G through K dwarfs adds a twist to this pat-tern comparable to what is seen in the CMD. Thecomposite system is always redder than the singleprimary, but the pattern in b − y is to grow red-der initially as the secondary is shifted down themain sequence, hit a maximum difference, thenshift blueward toward the color of the primarystar. Moreover, the combined effect of changingb−y and hk places the composite star increasinglyabove the mean relation before finally approach-ing the values of the single primary. We concludethen that if composite systems are present withinthe sample, they should have little to no impactamong the hotter stars. Among the K dwarfs,companions should shift the system above themean relation, i.e., toward smaller hk, with thesize of the shift depending upon the exact colorsof the two stars. Maximal shifts between 0.05 and0.10 mag are expected in the b − y range of 0.45to 0.65.
Using the 58 single Hyades members, a pre-liminary two-color relation was derived by sortingthe sample in b− y and, starting at the blue end,constructing a five-point, weighted average whichthen shifted redward by one point before repeating
the process. This was continued until a runningaverage was available over the entire color rangeof the sample. This mean relation was checked fordeviant points whose inclusion produced signifi-cant changes in slope over small changes in b− y;one point was removed. The averaging processwas repeated, producing a mean relation whichshowed a smooth and continuous change in slopeover the entire color range. Finally, residuals werecalculated by comparing the data points to themean relation and tested to ensure that the scat-ter about the mean curve averaged 0.0 with nocolor dependence. The final Hyades hk, b − y re-lation is listed in Table 2 and shown as the solidline in Fig. 2. The open circles of Fig. 2 arethe 57 single, non-deviant stars used to define therelation, while the crosses are the stars tagged aspossible binaries. The two weakest parts of the re-lation are the extreme ends of the color range. Forb− y below 0.27 and greater than 0.7, the numberof points available to define the curve is small andmay be affected by possible binaries. At the coolend, the small numbers were set by the apparentfaintness of the stars while at the blue end, hotterstars were too bright (V ≤ 5.5) for even the small-est telescope accessible to this project. In bothof these color ranges, it has been assumed thatthe Hyades relation has the same relative shape asthat found for the field stars of comparable color.The Hyades members have been used essentiallyas a means of fixing the location of the curve inthese regions, not defining the shape of the curve.In short, the extreme ends of the relation shouldonly be used with caution.
Excluding the one deviant star, the 57 singlestars scatter about the mean two-color relationwith average residuals in hk, in the sense (OBS-REL), of +0.001 ± 0.019 mag (s.d.). If binarystars are considered together with single stars,and if two additional deviant stars are excluded,the remaining 109 stars show average residuals of−0.003±0.022, indicating, as predicted, that bina-rity moves a star toward lower observed hk relativeto the mean relation. The three stars which ex-hibit the largest deviation from the mean relationare the binary stars HIC 19591 and VB/WEBDA185 (filled squares in Fig. 2), while the deviantsingle star is HIC 19808 (HG7-135; filled circle inFig. 2). The single star is peculiar in that its col-ors imply that the absorption in the region of Ca II
5

H and K is anomalously large. Since the two-colorrelation flattens out in the b−y region occupied bythis star (∼0.7), one cannot construct the indicesdemonstrated by this star through combinations ofany stars on the standard relation. Moreover, aswill become apparent in the next section, no fieldstar has been observed which occupies a compa-rable region of the hk, b − y diagram. Since onewould expect that most forms of stellar interactionwould enhance chromospheric emission leading toline filling, the source of the anomaly remains amystery. The simplest solution may be that theobservations are in error, though the star was ob-served twice and the agreement between the ob-servations was quite good.
In contrast, the position of HIC 19591 (BD+23◦ 635), over 0.3 mag above the mean rela-tion is readily explained. It is known to be ashort-period, tidally-locked triple system that ex-hibits high levels of chromospheric activity (Grif-fin & Gunn 1981; Bopp et al. 1986) and ananomalous Li abundance (Thorburn et al. 1993).VB/WEBDA 185 is a composite composed of aK3 and a K7 dwarf, separated in absolute mag-nitude by only 1.6 mag (Griffin & Gunn 1981).The system does not show significant evidence foranomalous chromospheric emission (Stauffer et al.1991). The deviation from the mean relation re-flects the optimum difference in color and intrin-sic luminosity required to shift the location of thesystem relative to that of the mean relation. Theintrinsic colors of the stars place them in the idealb− y regime for shifts between 0.05 and 0.10 magin hk relative to the mean relation, as observed.
4. The Field Star Comparison
With the Hyades hk, b− y relation established,the next task is to determine what, if anything,distinguishes the Hyades relation from the typicalfield star in the solar neighborhood. As stated ear-lier, expectations are that the Hyades will estab-lish an approximate lower bound for hotter fieldstars due to its high [Fe/H], but remain typical ofmost stars at lower temperatures due to the sat-uration of the Ca II lines. To ensure that anyanomalies between the Hyades and the field starsare not a product of zero-point offsets within thephotometry, one additional check has been made.In Sec. 2 it was demonstrated that our merged V
and b − y data are consistent with the system ofOlsen (1993). If we compare the hk, b− y indicesfor Hyades stars to field dwarfs from the Twarog& Anthony-Twarog (1995) catalog, can we be cer-tain that the dwarfs in that catalog are indeed ona color system consistent with Olsen (1993)?
A set of 401 dwarfs was compiled representingthe overlap between the catalogs of Olsen (1993)and Twarog & Anthony-Twarog (1995). Thestars cover a brightness range from V = 4.8 toV = 11.6, and a color range from (b − y) = 0.08to 1.1; the great majority of these stars have col-ors between (b − y) of 0.2 and 0.7. No giantswere included in this overlap set, and a numberof stars with discrepant V magnitudes were ex-cluded. The mean differences in the sense (OLS93- ATT95) are 0.0007± 0.0006 (s.e.m.) for V and−0.0007±0.0003 (s.e.m.) for (b−y). There are nodiscernible trends with respect to color or magni-tude for ∆V or ∆(b − y), confirming the compar-ison made during the construction of the originalcatalog (Twarog & Anthony-Twarog 1995).
4.1. The Hotter Dwarfs
To illustrate the trends in the two-color dia-gram at reasonable resolution, we divided the sam-ple in two color ranges with the break point at b−y= 0.45. For the hotter stars not classified as giants,Fig. 3 shows the field star sample from Twarog &Anthony-Twarog (1995) with the Hyades meanrelation superposed as a solid line. Over the F-star spectral range, b− y between 0.2 and 0.4, themean relation defines an approximate lower boundto the field star sample. This is expected if the hkindex is predominantly a metallicity indicator andthe scatter of stars below the Hyades is, in fact,composed mostly of stars more metal rich thanthe Hyades. The few stars that fall well below theHyades relation and below virtually all the fieldstars are supergiants and not relevant to the dis-cussion.
We wished to probe the metallicity sensitivityof the hk index as well as investigate the possi-bility that it might saturate, or even reverse, as ametallicity indicator for [Fe/H] values greater thanthe Hyades. One relatively straight-forward wayto do this is to construct an index, δhk, that de-scribes the difference, in the sense (Hyades - star),of a star’s hk index from the Hyades hk, b− y se-quence, and then compare δhk to photometric or
6
spectroscopic determinations of [Fe/H].
Overlap of the hk catalog (Twarog & Anthony-Twarog 1995) with catalogs of high dispersionspectroscopic abundances is not tremendouslylarge, consisting of 50 non-binary stars from thecatalogs of Edvardsson et al. (1993) and Chenet al. (2000) that fall within the b − y limits of0.22 and 0.38, a color range for which we mayalso utilize the photometric metallicity calibra-tion for F stars of Schuster & Nissen (1989).Chen et al. (2000) demonstrate effectively thatthe [Fe/H] values in these two spectroscopic cat-alogs are mutually consistent; Fig. 4 illustratesthe relationship between [Fe/H]SPEC and δhkfor 50 F dwarfs. The form of the relationship is[Fe/H]= −5.60δhk+0.065, where the intercept im-plies the [Fe/H] value for δhk = 0.0, i.e., Hyadesabundance. The dispersion of points about themean line, 0.08 dex, makes this result formallyconsistent with a presumed abundance for theHyades of [Fe/H] = 0.125.
We compared the performance of δhk relativeto photometric metallicity indicators as well, aconsiderably less straightforward task but one thatrecovers the advantages of several large Stromgrencatalogs. The F star calibration of Schuster &Nissen (1989) is ideal for this temperature rangeand is constrained by limits on applicable b − y,m1 and c1. A few features deserve note: sev-eral Hyades stars were included in the develop-ment of the calibration, but it was not primarilyintended for use at near-solar abundances, an is-sue that can be addressed by small additive cor-rections to the [Fe/H] scale. Small differences thatexist between large catalogs on the Stromgren sys-tem can lead to slightly different results as well.The Schuster & Nissen (1989) calibration is con-sistent with their photometry; other catalogs maybe transformed to their catalog system using pub-lished precepts. For example, 37 Hyades F dwarfsare included in the photometric catalog of Olsen(1983). If the abundance calibration of Schuster& Nissen (1989) is used, an abundance [Fe/H]= −0.01 ± 0.09 is obtained. A slightly differentphotometric catalog, Olsen (1993) also contains20 Hyades F dwarfs. The photometric calibrationprovides an estimate of [Fe/H] = −0.06 ± 0.07for these indices. This estimate is raised if theStromgren indices of the Olsen (1993) catalog aremapped to the system of the calibration, Schus-
ter & Nissen (1989). These precepts are pro-vided by Olsen (1993) and produce an estimate of[Fe/H] for the Hyades stars of 0.04 ± 0.09, about0.1 dex higher than untransformed indices im-ply. Thus, slight differences between photometricscales can lead to modest differences in calculatedabundances which may be adjusted by zero pointcorrections. There are also concerns about thescale of the photometric estimators of [Fe/H] forF stars. Alonso et al. (1996) suggest an adjust-ment to abundances determined using the Schus-ter & Nissen (1989) F star calibration of the form:[Fe/H]SPEC = 1.22[Fe/H ]PHOT + 0.125, wherethe intercept is fixed to ensure a Hyades abun-dance of +0.125.
With these points in mind, we constructed acomparison of δhk to photometric abundances, us-ing the two largest, high-precision, F-star cata-logs on the uvby system with the greatest overlapwith the hk catalog (Twarog & Anthony-Twarog1995), those of Grønbech & Olsen (1976) forthe brightest stars and Olsen (1983) for stars atfainter magnitudes. For each star between b − y= 0.22 and 0.38 common to the uvby and hk sys-tems, δhk is calculated while uvby data for eachstar was processed through the F-star metallicitycalibration of Schuster & Nissen (1989), using thelimits on the range of indices for which the cali-bration is applicable to further restrict the sam-ple. If the indices from Grønbech & Olsen (1976)and Olsen (1983) are mutually consistent, stars ofHyades abundance should have δhk values of 0.0.Without the adjustment to slope or zero point, thephotometric calibration for Hyades stars yielded avalue of [Fe/H] = 0.0, which is increased to 0.125by the linear adjusted scale.
With these assumptions in mind, Fig. 5 pro-vides a comparison of photometric estimates of[Fe/H] to δhk values for 324 stars. The circlesrepresent stars from Olsen (1983), the crossesdata from Grønbech & Olsen (1976). A numberof conclusions can be derived from this diagram.First, there is no inconsistency of slope or zeropoint to indicate that the two photometric sam-ples are anything other than mutually consistent.As hoped, at δhk = 0.0, i.e., Hyades abundanceby definition, the implied [Fe/H] value lies between+0.05 and +0.15, demonstrating that the Hyadesmetallicity scale is consistent with that defined bythe field stars. A line fitted through the points
7
has a slope of -5.8, an intercept of +0.10, and adispersion of ±0.12 dex, expected from photomet-ric errors alone and in spite of no applied correc-tions for reddening or any inhomogeneities withinthe samples of stars. The value of the slope isclose enough to that derived from data presentedin Fig. 4 to validate the amplification of the pho-tometric abundance scale advocated by Alonso etal. (1996). It is concluded that for F dwarfs, theHyades mean relation defines a reliable isometal-licity line at [Fe/H] = +0.125.
4.2. The Cooler Dwarfs
Fig. 6 shows the unevolved cooler field starsfrom Twarog & Anthony-Twarog (1995) relativeto the Hyades mean relation. Surprisingly, theHyades relation crosses over the color-color banddefined by the field stars and becomes an approx-imate upper bound to the sample, rather than alower limit. This pattern extends from b − y ∼
0.5 to 0.65, where the flattening of the Hyadesrelation, coupled with the small number of pointsdefining the mean relation, makes it difficult to pindown exactly where the Hyades is located relativeto the field stars.
If the peculiar location of the Hyades relation isnot the product of photometric error, what mightbe its cause? Three possibilities come to mind:
1)The location of the two-color relation is linkedto the Hyades anomaly. The Hyades anomalyrefers to observation that the unevolved F stars inthe Hyades have c1 indices that place them abovethe unevolved field stars at the same temperature(Crawford & Barnes 1969). Since c1 is an indi-cator of surface gravity through the Balmer dis-continuity, the higher c1 values at a given b − yor Hβ imply that the F dwarfs in the Hyades aremore luminous/evolved than the field stars of com-parable age. Over the last 15 years, numeroussolutions have been proposed and questioned, in-cluding filter errors (Eggen 1994; Joner & Tay-lor 1995), starspots triggered by chromosphericactivity (Rose 1984; Soderblom 1989), some formof abundance anomaly, including overall metallic-ity (Barry 1974; Alexander 1986), CN variations(Eggen 1982; Brown & Twarog 1983), and helium(Stromgren et al. 1982; Alexander 1986). Oth-ers have questioned the reality of the phenomenon,though the work of Dobson (1990) indicates thatsomething that is not predicted by simple, stan-
dard models is happening. Finally, Nissen (1988)would appear to confirm that the Hyades cluster isnot alone in this peculiarity, while demonstratingthat the anomaly is not a simple age or metallicityeffect.
There are two reasons to discount the relevanceof the Hyades anomaly in the current discussion.First, if a star has a higher c1 index at a givencolor, this indicates that the star is fainter thanexpected in the ultraviolet region of the spectrum.The cooler Hyades dwarfs look metal-deficient,i.e., their energy distribution is skewed to higherultraviolet flux, though one could claim that overthe narrow bandpass of the Ca filter alone, theflux is higher than expected. Second, photoelectricobservations of the cooler stars by Reglero et al.(1992) demonstrate that the Hyades dwarfs havec1 indices consistent with the mean relation forfield stars and show no evidence for the anomalyidentified among the hotter stars.
2) The stars in the Hyades are younger than theaverage field star, so the increased chromosphericactivity compensates for the higher metallicity byfilling in the Ca II H and K lines and making thestar appear metal-deficient. If correct, stars thatlie above the Hyades relation in the two-color di-agram must be metal-poor and/or chromospher-ically active, the latter due to a younger age orenvironmentally-induced activity. The fact thatthe observed stars known to be chromosphericallyactive to an anomalous degree sit well above theHyades relation is consistent with this option.
3) Though the metallicity effect on the Ca IIlines should increase the value of hk at a givenb − y as [Fe/H] increases, above a critical valueof [Fe/H] the index hits a maximum and then de-creases with increasing [Fe/H]. Among the mostmetal-rich stars in the solar neighborhood, Hyadesmembers are positioned above stars of lowermetallicity in the two-color diagram. Therefore,stars even more metal rich than the Hyades shouldfall above the mean relation in Fig. 6.
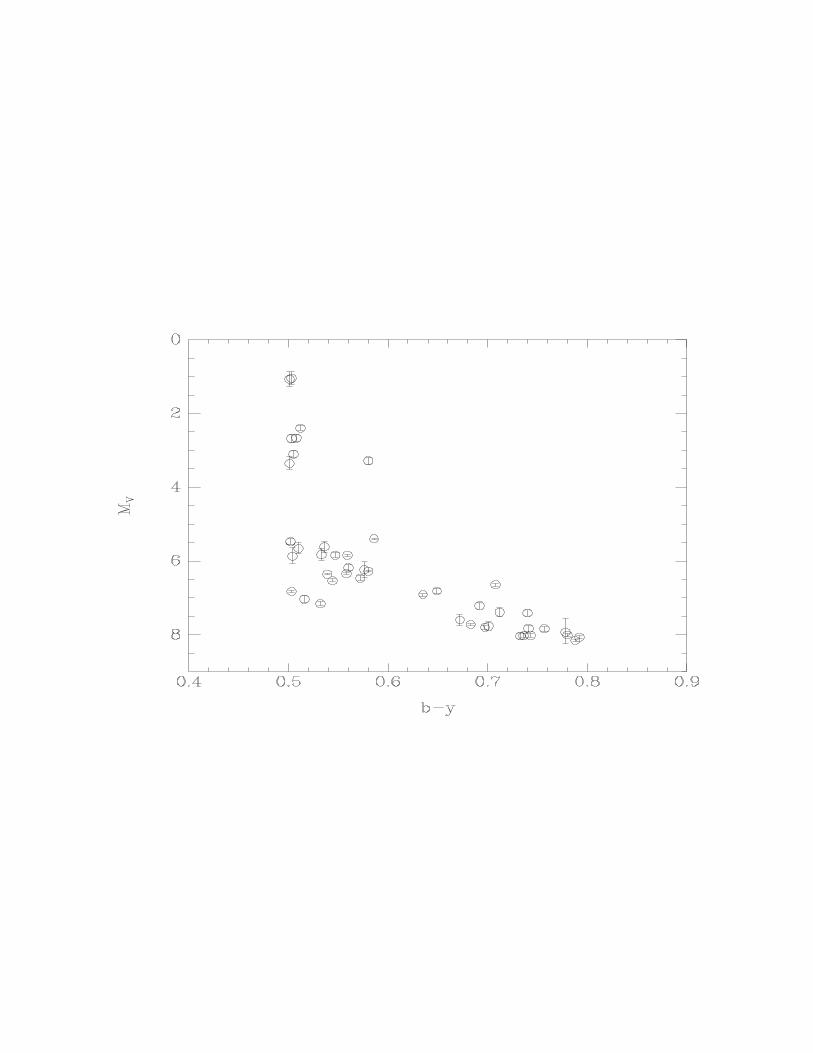
To sort through the possibilities, we have iden-tified 59 stars that lie above the Hyades mean re-lation between b − y = 0.50 and 0.8. As a firststep, the Hipparcos catalog was searched and allbut 5 stars had a measured parallax. Of the re-maining 54, all but 8 had σ/π of 0.16 or less,implying that reliable absolute magnitudes werepossible. The CMD for the remaining 46 stars is
8

shown in Fig. 7 where the error bars drawn arebased upon the one sigma uncertainty in the par-allax. What is immediately apparent is that thesample contains a number of stars that should le-gitimately be classified as subgiants/giants, i.e.,any star with MV below 5.0. To this sampleof 8 stars can be added 3 stars that have mea-sured parallaxes with reasonable errors, but abso-lute parallaxes so small the stars must be at largedistance and therefore must be intrinsically moreluminous than a dwarf. The misclassification ofthese stars as dwarfs explains their anomalous lo-cation in the two-color diagram because the meanrelation for solar-metallicity giants is shifted ap-proximately 0.1 mag above that for the dwarfs dueto surface gravity effects. Though these stars willbe excluded from further discussion, we note thattwo of the stars are of interest because they areanomalous even for giants. HD 13435 is the red-dest star at the base of the giant branch, occupyinga position that is undoubtedly heavily dependentupon its exceptionally high [Fe/H] (Favata et al.1997). HD 89499 sits well above the mean rela-tion due to classification as both a subgiant anda chromospherically-active, short-period, tidally-locked binary (Ryan & Deliyannis 1995).
The next step in sorting through the remain-ing 48 stars is to estimate their metallicity anddetermine if they fall into either extreme end ofthe abundance range or cover the entire spread.As one might expect, the information available forthe stars is mixed. The spectroscopic abundancecatalog of Cayrel de Strobel et al. (2001) includeshigh dispersion results for 10 of the stars, 11 if oneincludes the value for HD 61606A as representativeof HD 61606B. For stars with multiple abundanceestimates, an unweighted average has been taken.Beyond spectroscopy, we can appeal to photome-try for abundances. A survey of the uvby catalogof Hauck & Mermilliod (1998) identifies 18 addi-tional stars with a full set of uvby indices, of which11 fall within the calibration limits of the G-starcalibration of Schuster & Nissen (1989). For starswith [Fe/H] below –0.4, the abundances derivedfrom the calibration were adopted as is withoutany adjustment to the zero-points of the photom-etry or the metallicity scale. For stars with [Fe/H]above this limit, the photometry was also uncor-rected for any zero-point differences with Schuster& Nissen (1988), but the photometric abundances
were derived by comparison to the photometricabundance derived for Hyades stars at the samecolor using the Schuster & Nissen (1989) calibra-tion. The reason for this change is discussed indetail in Twarog et al. (2002) and arises froma flaw in the photometric abundance calibrationthat leads to a severe underestimate of [Fe/H] forcooler G and early K dwarfs at solar abundanceand above. For derivation of the final abundances,it has been assumed that [Fe/H] for the Hyadesis +0.125. Finally, Alonso et al. (1996) havederived a photometric abundance of –1.5 for HD4967, while Laird et al. (1988) obtain +0.32 forHD 95741.
Of the 24 stars with some semblance of an abun-dance estimate, 9 were below [Fe/H] = –0.70, im-plying that their position in the two-color diagramis the product of low [Fe/H]. Of the remaining15 stars, none were found between [Fe/H] = –0.20 and –0.70. The abundance distribution forthese stars is plotted in Fig. 8 and clearly showsthat, despite the lack of homogeneity in the sam-ple abundances, the stars are heavily weighted to-ward Hyades abundance or higher, as predicted ifthe shift of the mean relation is due to a metal-licity effect. All stars with [Fe/H] below –0.70 arecontained in the lowest bin.
The final classification property to check is thatof chromospheric activity. Seven of the stars arenotable for their unusual degree of chromosphericactivity, in many cases leading to classification asBY Dra stars. HD 89499 is a subgiant and hasbeen noted earlier. BD −0◦ 4234 is a metal-poordwarf in a tidally-locked binary system (Ryan &Deliyannis 1995) and was included in the metal-poor classification above. Thus, the presence of5 additional stars above the Hyades in the two-color relation can now be clarified, leaving 19 withinsufficient information to determine their status.An attempt has been made to discover if there isany general trend with chromospheric activity be-yond the obvious effect for stars of extreme activ-ity. The stellar sample with measurements of thechromospheric index, R′
HDcompiled by Rocha-
Pinto et al. (2000) has been matched with theCaby catalog, producing an overlap of 189 stars.Unfortunately, only 14 stars lie within the criticalcolor range redder than b − y = 0.50. For eachof these stars, a residual δR′
HKwas calculated by
subtracting the observed index from a linear lower
9

limit drawn through the sample as a function ofcolor. No correlation was found between this chro-mospheric index and the position of the star rela-tive to the Hyades in the hk, b− y diagram at thesame color though, again, the sample is small.
We note that in some cases, stars have been cat-egorized in a way that might indicate anomalouslyhigh [Fe/H], e.g., inclusion in a metal-rich mov-ing group, but such a designation was not deemedreliable enough to justify the assumption of high[Fe/H]. Moreover, among the coolest dwarfs, manywere selected because of their specification as be-ing within such a group, making the sample lessthan random.
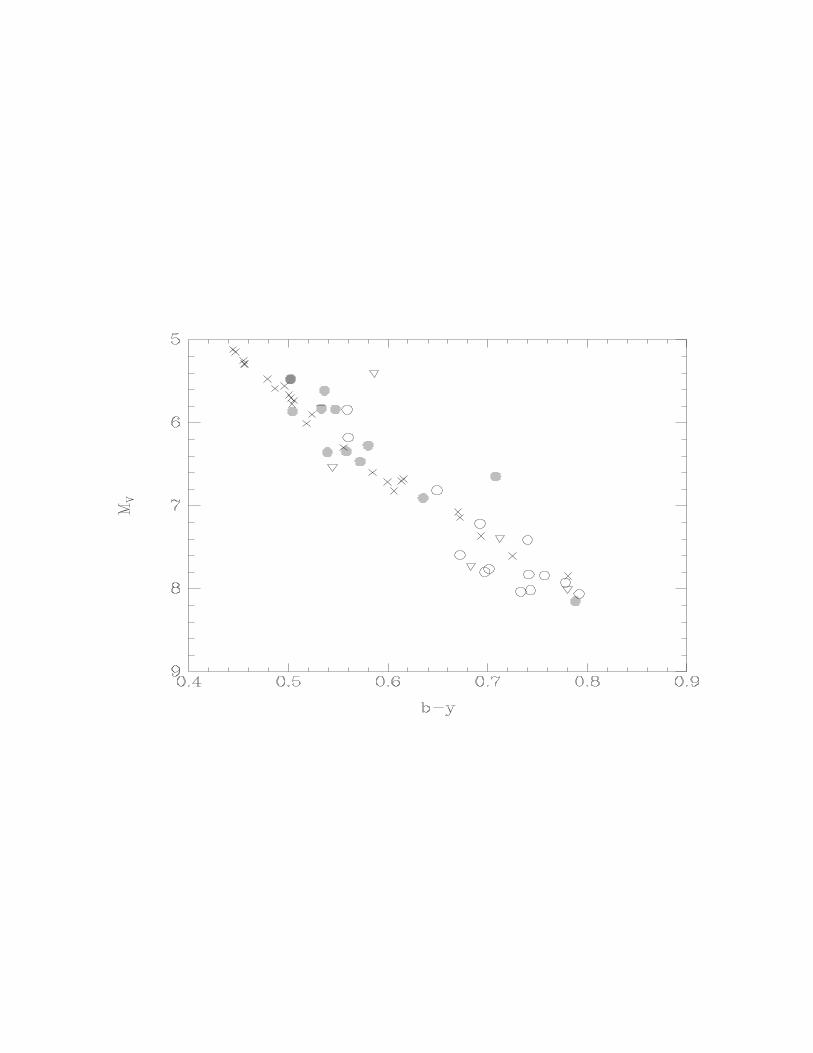
In Fig. 9, we repeat Fig. 7 with the errorbars removed. Stars classed as metal-poor havebeen removed. Filled circles identify all stars with[Fe/H] above –0.20, triangles identify stars thatare chromospherically active, open circles are starswith no definitive information, and the crossesshow the location of stars within the Hyades ascompiled in Twarog et al. (2002). In the rangefrom b − y = 0.50 to 0.65, the majority of thesample is tagged as metal-rich and occupies a po-sition in the CMD consistent with that designa-tion, i.e., on or above the Hyades main sequence.Three stars bluer than b− y = 0.66 that occupy aposition consistent with high [Fe/H] but have nospectroscopic abundance determinations are HD57095, HD 76378, and HD 219495.
Among the stars classed as chromosphericallyactive, there is no apparent trend relative to themain sequence, with stars scattering above andbelow the Hyades, as expected if this sample orig-inates from a population with a broader range in[Fe/H]. The majority of stars for which no in-formation is available fall in the redder half ofthe distribution where spectroscopic data are fewand far between; these stars scatter both aboveand below the Hyades. While it is possible thatthese stars represent a mixture of both metal-richand chromospherically-active stars, we emphasizeagain the uncertainty in the definition of the meanHyades relation among the coolest dwarfs. It maywell be that with a larger array of cool Hyades andfield star photometry, the position of the mean re-lation will shift or the samples for all metallicitieswill converge to a common relation insensitive to[Fe/H], as originally expected for the K dwarfs.
5. Summary and Conclusions
An extensive sample of Caby photometry ofHyades dwarfs from A through early M has beencompiled and analyzed. For single stars and sim-ple, composite, binary systems, the mean relationis well-defined over the color range from b − y =0.25 to 0.65. For the hotter portion of the colorrange, the effect of binarity on the two-color dia-gram is minimal. Among cooler dwarfs, the pres-ence of a fainter, secondary star tends to shift thesystem above the mean relation, i.e., to lower hkat a given b − y, simulating a lower [Fe/H], witha maximum offset between 0.05 and 0.10 mag.Stars with extreme degrees of chromospheric ac-tivity, particularly BY Dra stars, appear anoma-lously metal-poor due to line-filling by emissionwithin the Ca II H and K lines.
Among the F dwarfs, the Hyades relation de-fines a reliable lower bound to the distribution offield stars for a fixed [Fe/H] of +0.125. By com-parison to the spectroscopic metallicity scale ofEdvardsson et al. (1993), it is found that the hkindex is linearly correlated with [Fe/H] over therange from +0.5 to –1.0, with almost twice thesensitivity to abundance changes compared to m1.A simple test of the utility of hk at super-metal-rich levels is provided by the sample of stars re-cently identified as having planets as compiled bythe University of California Planet Search Team(http://exoplanets.org). Of the 76 systems listed,16 are in the hk Catalog (Twarog & Anthony-Twarog 1995). Of these, 6 are within the F-starcolor limits and have [Fe/H] between +0.17 and+0.34, with a mean of +0.23 ± 0.08. Line satu-ration does not appear to be a problem for thehotter stars.
In sharp contrast, as one extends the Hyadesdata toward cooler temperatures, the mean two-color relation crosses the distribution of nearbyfield stars, producing an approximate upperbound to the sample for stars in the color rangefrom b− y = 0.50 to 0.65. From an analysis of thestars that lie even higher than this relation in thehk, b− y diagram, the primary source of the effectappears to be the high metallicity of the Hyadescluster. The implication is that the index doessaturate at a given color for stars near solar abun-dance, but additional increases in [Fe/H] lower theindex, placing super-metal-rich stars in the same
10

region of the diagram as stars with [Fe/H] near–0.7 or lower.
An alternative explanation may be provided bythe synthetic indices developed from model atmo-spheres by Soon et al. (1993). While the modelsimply that hk should remain metallicity sensitiveto [Fe/H] = +0.5 for all colors, a pattern almostidentical to that found for hk is generated for CRV ,the photospheric narrow-band index constructedfrom the data collected for the Mt. Wilson surveyof stellar chromospheric emission (Vaughan et al.1978). Soon et al. (1993) explain the crossoverof CRV at cooler temperatures as primarily a re-sult of the metallicity sensitivity of b− y, an effectthat disappears with the use of V −K. Why thistrend exists for an index based upon a filter overfour times wider than those used in CRV remainsa mystery, but it may be more of an indication ofthe model shortcomings than of a serious problemwith the observed indices. In any case, the hk in-dex for cooler stars clearly succeeds in achievingthe goal for which it was designed, the identifi-cation and calibration of stars of intermediate toextremely low [Fe/H]. This investigation adds twooptions to the list of uses, identification of starswith high levels of chromospheric activity, as ex-pected, and the totally unexpected ability to iso-late stars of Hyades abundance and higher. Threestars likely to occupy the last category and deserv-ing of closer study are HD 57095, HD 76378, andHD 219495.
The question of the impact of modest, age-dependent variations in chromospheric emissionremains unresolved, though indications from thevery limited sample available to date are that theeffect on hk is small to negligible. Observationsof the G and K dwarfs in nearby open clusters ofcomparable age but lower [Fe/H] than the Hyadescould help to resolve this issue.
It is a pleasure to thank Dr. Rocha-Pinto forsupplying us with a copy of the sample used in thestudy of the age-metallicity-relation from chromo-spheric emission. Although our thanks must reachback many years, we are indebted to the staffs ofboth NOAO observatories. We made extensive useof the WEBDA and SIMBAD databases, and arehappy to acknowledge our appreciation to theircreators and contributors. We are also indebted tothe very helpful comments and constructive criti-
cisms of the referee.
REFERENCES
Alexander, J. B. 1986, MNRAS, 220, 473
Alonso, A., Arribas, S., & Martinez-Rogers, C.1996, A&AS, 117, 227
Anthony-Twarog, B. J., Laird, J. B., Payne, D.,& Twarog, B. A. 1991, AJ, 101, 1902
Anthony-Twarog, B. J., Sarajedini, A., Twarog,B. A., & Beers, T. C. 2000, AJ, 119, 2882
Anthony-Twarog, B. J., Shawl, S. J., & Twarog,B. A. 1992, AJ, 104, 2229
Anthony-Twarog, B. J., & Twarog, B. A., 1998,AJ, 116, 1902
Anthony-Twarog, B. J., Twarog, B. A., & Craig,J. 1995, PASP, 107, 32
Baird, S. R. 1996, AJ112, 2132
Barry, D. C. 1974, AJ, 79, 616
Bopp, B. W., Africano, J. L., & Goodrich, B. D.1986, PASP, 98, 457
Brown, J. A., 1983, AJ, 88, 678
Carney, B. W. 1979, ApJ, 233, 211
Cayrel de Strobel, G., Soubiran, C., & Ralite, N.2001, A&A, 373, 159
Chen, Y.Q. et al., 2000, A&AS141, 491
Crawford, D. L. 1975, AJ, 80, 955
Crawford, D. L., & Barnes, J. V. 1969, AJ, 74, 407
Crawford, D. L. & Perry, C. L. 1966, AJ, 71, 206
de Bruijne, J. H. J., Hoogerwerf, R., & de Zeeuw,P. T. 2001, A&A, 367, 111
Deming, D., Olson, E. C., & Yoss, K. M. 1977,A&A, 57, 417
Dobson, A. K. 1990, PASP, 102, 88
Edvardsson, et al., 1993, A&AS, 275, 101
Eggen, O. J. 1982, ApJS, 50, 22
Eggen, O. J. 1994, AJ, 107, 594
11

Favata, F., Micela, G., & Sciortino, S. 1997, A&A,323, 809
Griffin, R. F., Gunn, J. E., Zimmerman, B. A., &Griffin, R. E. M. 1988, AJ, 96, 172
Griffin, R. F., & Gunn, J. E. 1981, AJ, 86, 588
Grønbech, B., & Olsen, E. H. 1976, A&AS, 25,213
Hanson, R. B. & Vasilevskis, S. 1983, AJ, 88, 844
Hauck, B., & Mermilliod, M. 1998, A&AS, 129,431
Hintz, M. L., Joner, M. D., & Hintz, E. G. 1998,AJ, 116, 2993
Joner, M. D., & Taylor, B. J. 1995, PASP, 107,124
Laird, J. B., Carney, B. W., & Latham, D. W.1988, AJ, 95, 1843
Meusinger, H., Reimann, H. -C., & Stecklum, B.1991, A&A, 245, 57
Nissen, P. E. 1988, A&A, 199, 146
Olsen, E. H. 1983, A&AS, 54, 55
Olsen, E. H. 1993, A&AS, 102, 89
Olsen, E. H. 1994, A&AS, 106, 257
Patience, J., Ghez, A. M., Reid, I. N., Weinberger,A. J., & Matthews, K. 1998, AJ, 115, 1972
Perry, C. L. 1969, AJ, 74. 705
Perryman, M. A. C., Brown, A. G. A., Lebre-ton, Y., Gomez, A., Turon, C., Cayrel de Stro-bel, G., Mermilliod, J. -C., Robichon, N., Ko-valevsky, J., & Crifo, F. 1998, A&A, 331, 81
Reglero, V., Fabregat, J., Suso, J. 1992, A&AS,92, 565
Rey, S. -C., Lee, Y. -W., Joo, J. -M., Walker, A.,& Baird, S. 2000, AJ, 119, 1824
Rocha-Pinto, H. J., Maciel, W. J., Scalo, J., &Flynn, C. 2000, A&A, 358, 850
Rose, J. A. 1984, AJ, 89, 1238
Ryan, S. G., & Deliyannis, C. P. 1995, ApJ, 453,819
Schuster, W. J., & Nissen, P. E. 1988, A&AS, 73,225
Schuster, W. J., & Nissen, P. E. 1989, A&A, 221,65
Soderblom, D. R. 1989, ApJ, 342, 823
Soon, W. H., Zhang, Q., Baliunas, S. L., Kurucz,R. L. 1993, ApJ, 416, 787
Sowell, J.R. & Wilson, J. W. 1993, PASP, 105, 36
Stauffer, J. R., Giampapa, M. S., Herbst, W., Vin-cent, J. M., Hartmann, L. W., & Stern, R. A.1991, ApJ, 374, 142
Stromgren, B., Gustafsson, B., & Olsen, E. H.1982, PASP, 94, 5
Taylor, B. J. & Joner, M. D. 1992, PASP, 104 911
Thorburn, J. A., Hobbs, L. M., Deliyannis, C. P.,& Pinsonneault, M. H. 1993, ApJ, 415, 150
Twarog, B. A. 1980, ApJ, 242, 242
Twarog, B. A., & Anthony-Twarog, B. J. 1995,AJ, 109, 2828
Twarog, B. A., & Anthony-Twarog, B. J. 1996,AJ, 112, 1500
Twarog, B. A., Anthony-Twarog, B. J., & Tanner,D. 2002, AJ, submitted
Twarog, B. A., Ashman, K. M., & Anthony-Twarog, B. A. 1997, AJ, 114, 2556
Van Bueren, H. G. 1952, Bull. Astr. Inst. Neth.,11, 385
Vaughan, A. H. 1980, PASP, 92, 392
Vaughan, A. H., Preston, G. W., & Wilson, O. C.1978, PASP, 90, 267
Wilson, O. C. 1963, ApJ, 138, 832
This 2-column preprint was prepared with the AAS LATEX
macros v5.0.
12
Fig. 1.— The effects of binarity on the hk, b−y ob-servations of cluster stars. (a) The CMD for starscombined with companions of decreasing temper-ature on the main sequence. (b) The hk, b − ydiagram for stars combined with companions ofdecreasing temperature on the main sequence.
Fig. 2.— The hk, b − y diagram for the Hyadesmembers. Open circles are single stars, crosses areprobable multiple systems, and filled symbols areanomalous points excluded from the derivation ofthe mean relation, given by the solid curve.
Fig. 3.— hk, b− y data for hotter field stars withthe Hyades relation superposed.
Fig. 4.— Comparison of spectroscopic abundancesfrom the catalogs of Edvardsson et al. (1993) andChen et al. (2000), to the metallicity index, δhk.Solid line is a linear fit through the points.
Fig. 5.— Comparison of photometric abundancesfrom the uvby photometry of Grønbech & Olsen(1976) (crosses) and Olsen (1983)(circles) to themetallicity index, δhk.
Fig. 6.— Same as Fig. 3 for the cooler field dwarfs.
Fig. 7.— CMD of stars located above the Hyadesin the hk, b − y diagram using Hipparcos paral-laxes. Error bars show the uncertainty based uponthe one sigma error in the parallax.
Fig. 8.— Abundance distribution for stars abovethe Hyades relation. Abundances represent a mix-ture of spectroscopic and photometric data. Allstars with [Fe/H] below –0.70 are contained in thelowest bin.
Fig. 9.— Same as Fig. 7 with evolved stars andmetal-poor stars removed. Filled circles are thestars with [Fe/H] above –0.2, triangles are starsthat are chromospherically active, open stars aredata points without any clarifying information,and crosses are observed single stars within theHyades.
13