1 advancing supercomputer performance through interconnection topology synthesis yi zhu, michael...
TRANSCRIPT
1
Advancing Supercomputer Performance Through Interconnection Topology Synthesis
Yi Zhu, Michael Taylor, Scott B. Baden and Chung-Kuan Cheng
Department of Computer Science and EngineeringUniversity of California, San Diego
2
Outline
Introduction Design Flow, Formulation & Algorithms Example: Blue Gene/L Packaging
Overview Models & Constraints
Experiments Benchmark Instances Generated Instances
Conclusion & Future Work
3
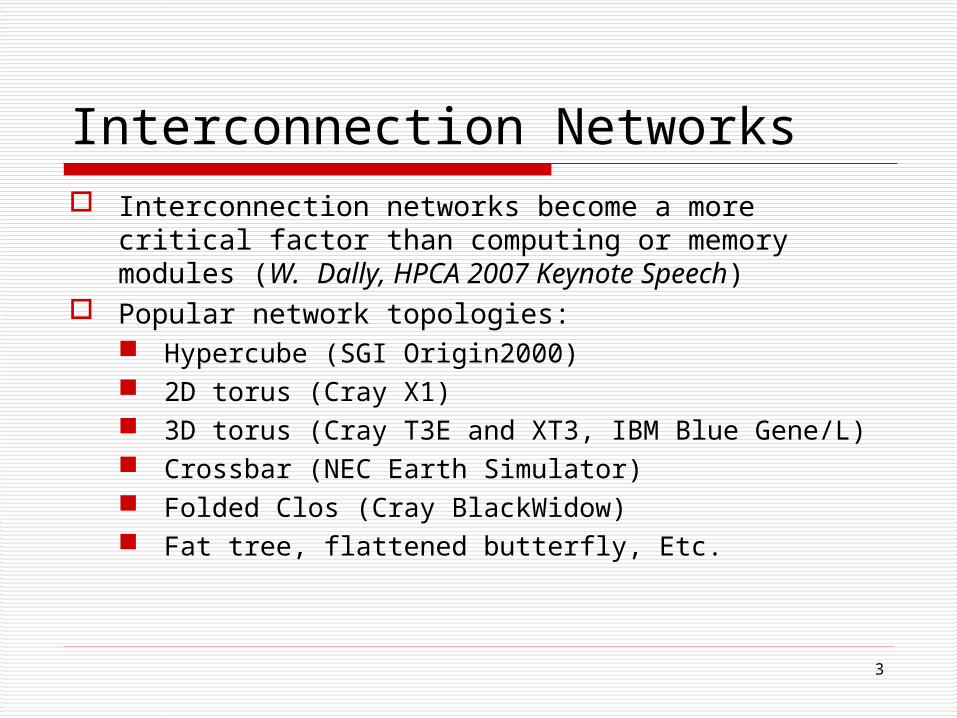
Interconnection Networks Interconnection networks become a more critical
factor than computing or memory modules (W. Dally, HPCA 2007 Keynote Speech)
Popular network topologies: Hypercube (SGI Origin2000) 2D torus (Cray X1) 3D torus (Cray T3E and XT3, IBM Blue Gene/L) Crossbar (NEC Earth Simulator) Folded Clos (Cray BlackWidow) Fat tree, flattened butterfly, Etc.
4
Our Work We propose a design methodology to
select the best topology to minimize the average latency Design flow is fully automated Physical constraints can be specified by
users Efficient multi-commodity flow algorithm
to evaluate Demonstrate the efficiency using Blue
Gene/L packaging framework
5
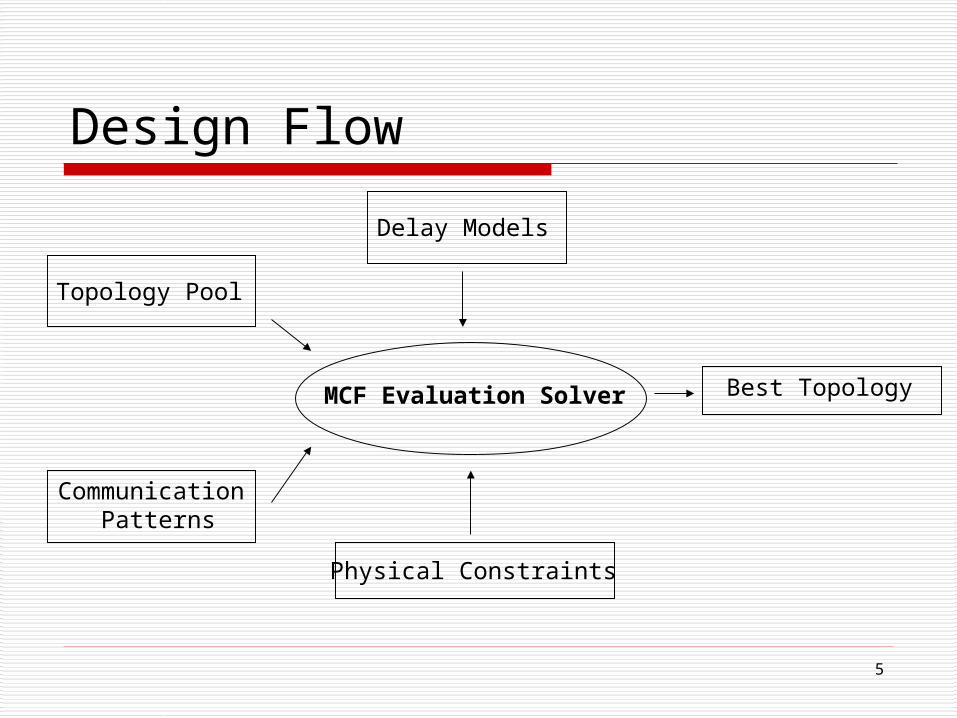
Design Flow
MCF Evaluation Solver
Delay Models
Topology Pool
Communication Patterns
Physical Constraints
Best Topology
6
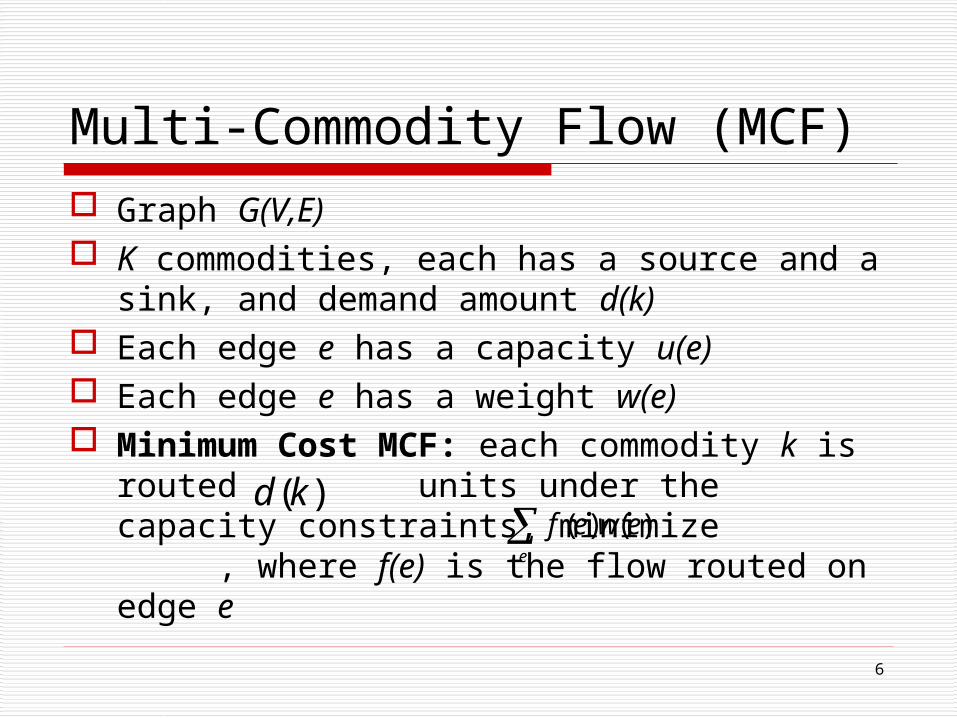
Multi-Commodity Flow (MCF) Graph G(V,E) K commodities, each has a source and a
sink, and demand amount d(k) Each edge e has a capacity u(e) Each edge e has a weight w(e) Minimum Cost MCF: each commodity k is
routed units under the capacity constraints, minimize , where f(e) is the flow routed on edge e
( )d k( ) ( )
e
f e w e
7
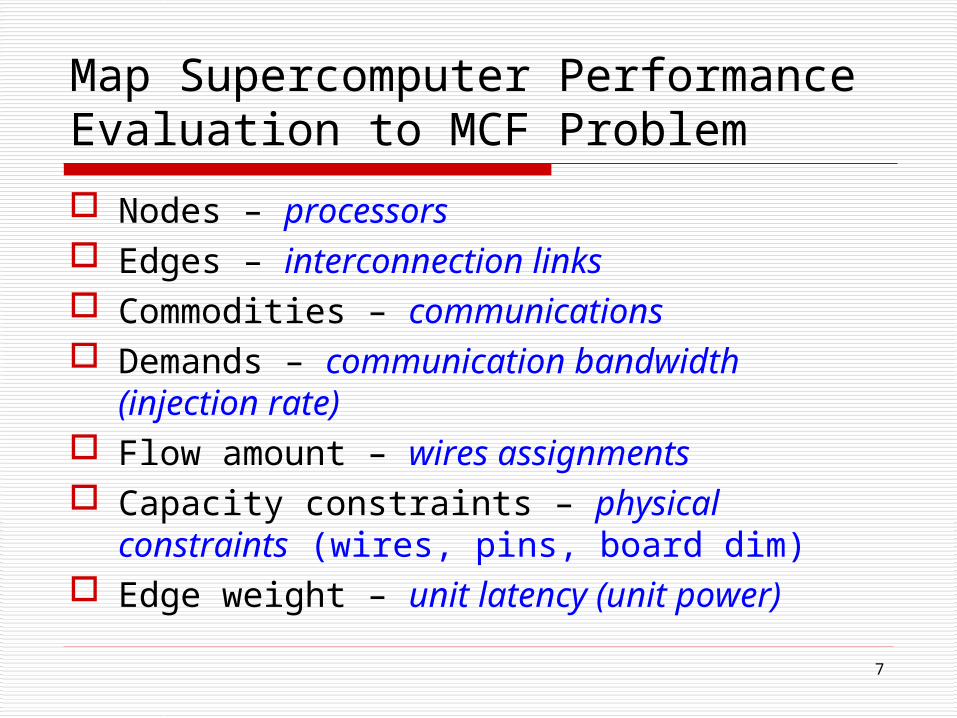
Map Supercomputer Performance Evaluation to MCF Problem
Nodes – processors Edges – interconnection links Commodities – communications Demands – communication bandwidth
(injection rate) Flow amount – wires assignments Capacity constraints – physical constraints
(wires, pins, board dim) Edge weight – unit latency (unit power)
8
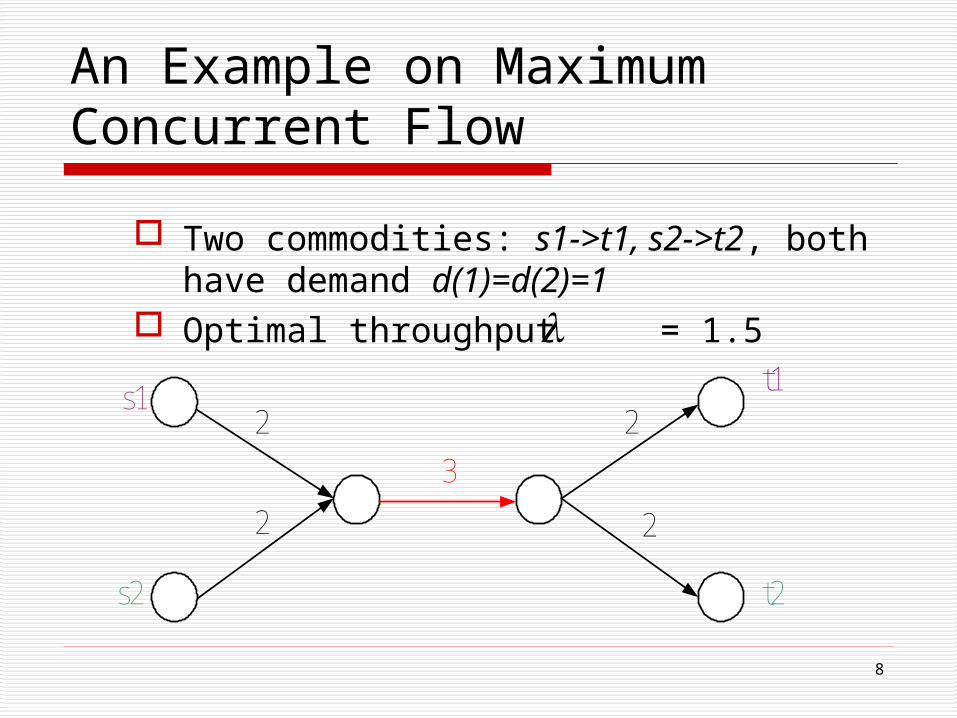
An Example on Maximum Concurrent Flow
Two commodities: s1->t1, s2->t2, both have demand d(1)=d(2)=1
Optimal throughput = 1.5
s2
s1t1
t2
2
2
3
2
2
9
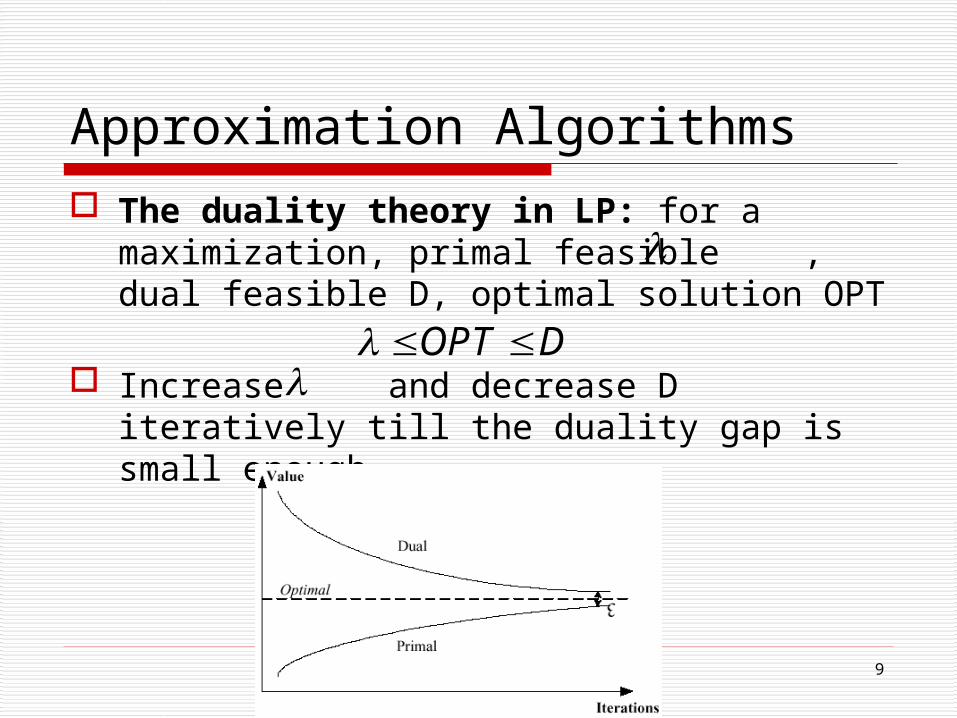
Approximation Algorithms The duality theory in LP: for a
maximization, primal feasible , dual feasible D, optimal solution OPT
Increase and decrease D iteratively till the duality gap is small enough
OPT D
10
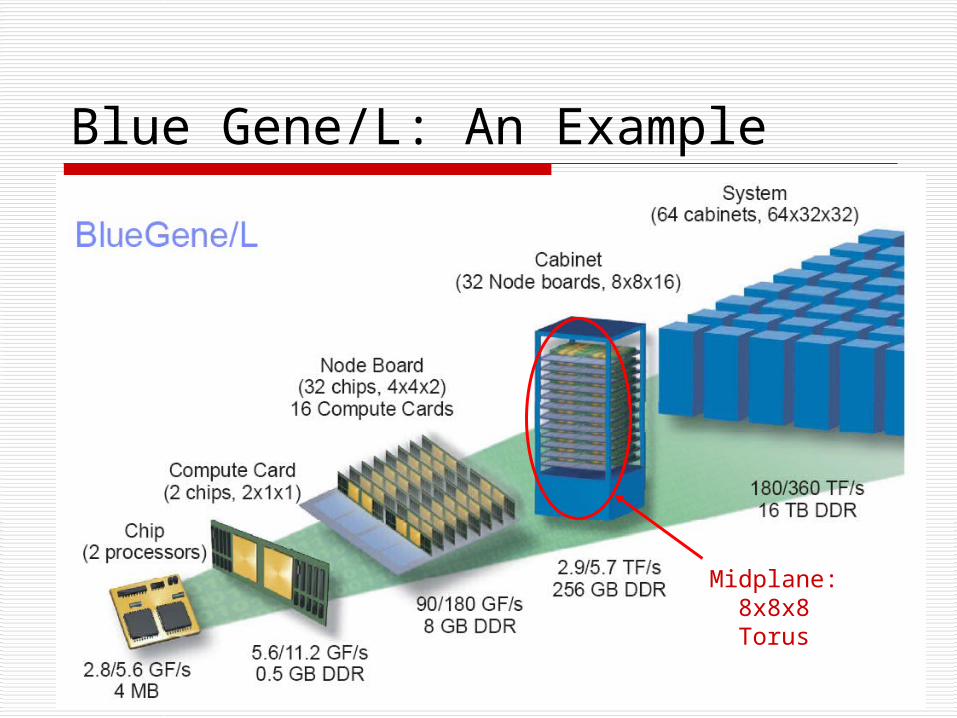
Blue Gene/L: An Example
Midplane: 8x8x8 Torus
11
Assumptions
We follow the same hierarchical structure: midplane – node card – compute card
The properties of boards (dimensions, # layers, dielectric) keep unchanged
We seek better topologies than the existing 3D torus to implement the networks in the midplane
12
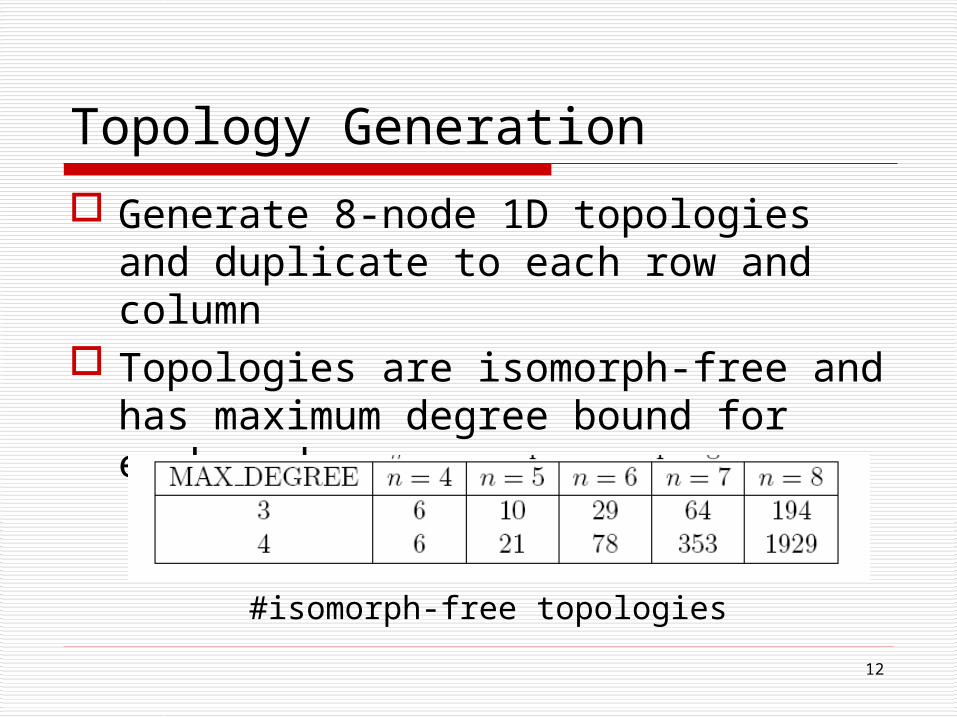
Topology Generation
Generate 8-node 1D topologies and duplicate to each row and column
Topologies are isomorph-free and has maximum degree bound for each node
#isomorph-free topologies
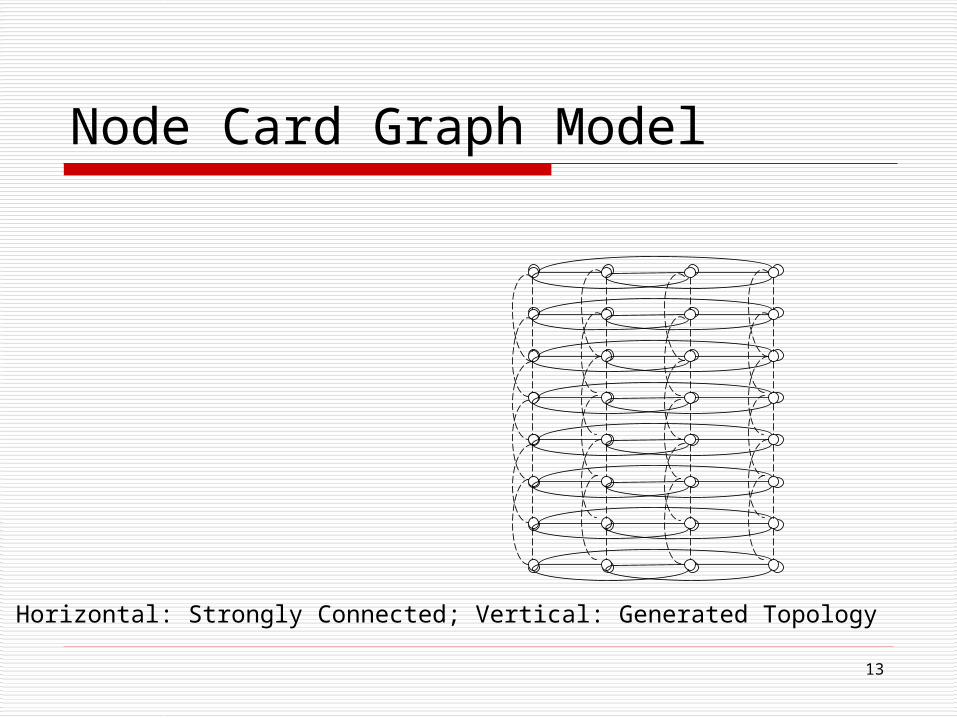
13
Node Card Graph Model
Horizontal: Strongly Connected; Vertical: Generated Topology
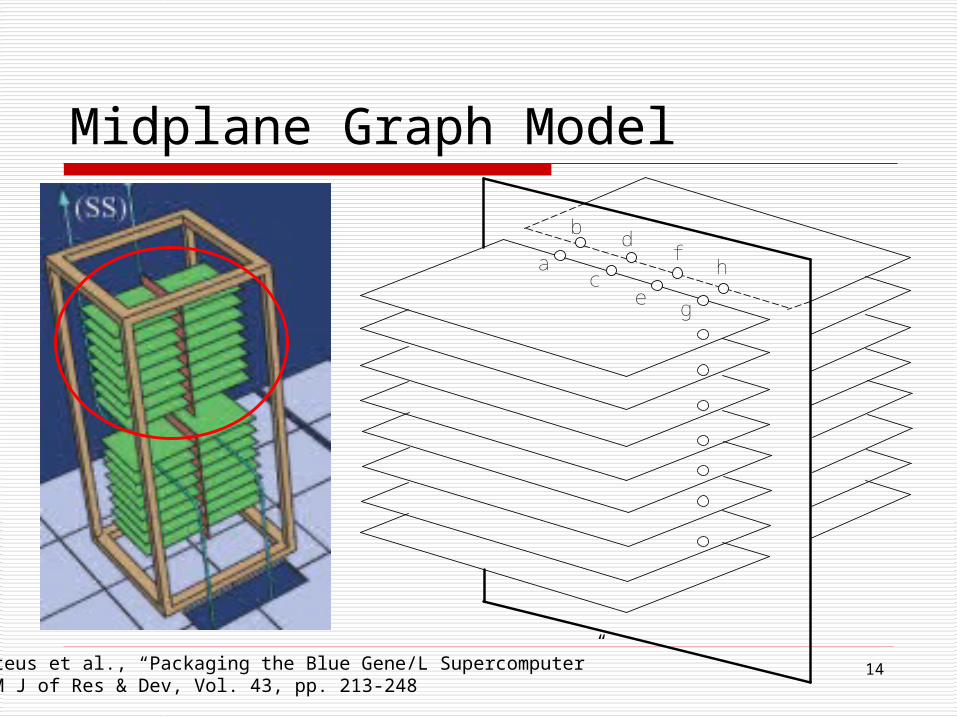
14
Midplane Graph Model
a
bd
cf
eg
h
Coteus et al., “Packaging the Blue Gene/L Supercomputer”IBM J of Res & Dev, Vol. 43, pp. 213-248
15
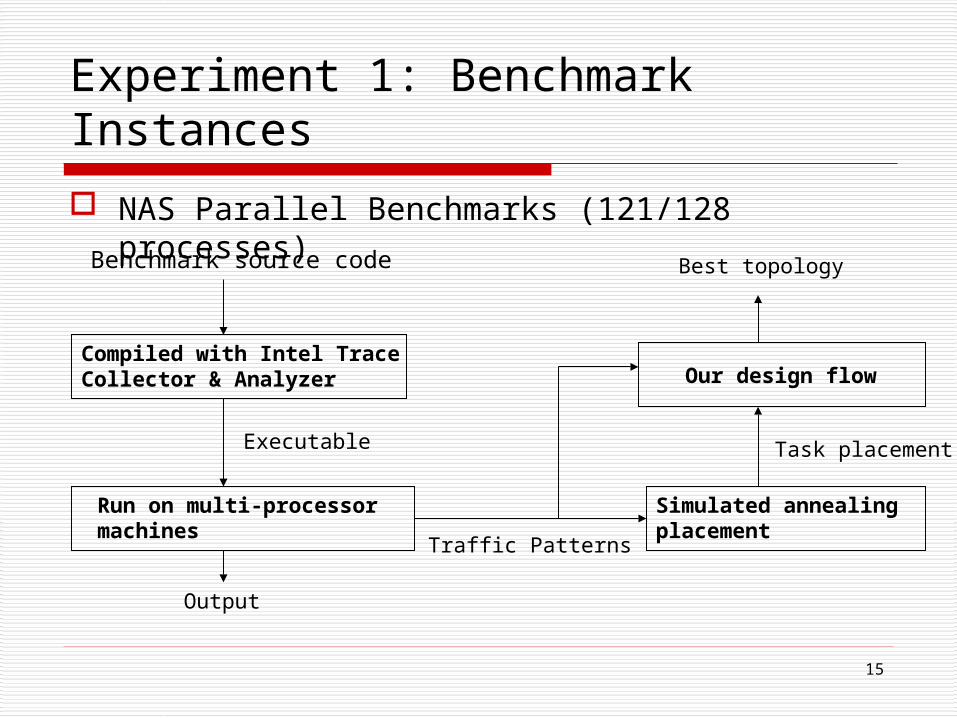
Experiment 1: Benchmark Instances
NAS Parallel Benchmarks (121/128 processes)
Benchmark source code
Compiled with Intel Trace Collector & Analyzer
Executable
Run on multi-processor machines
Output
Simulated annealing placement
Traffic Patterns
Task placement
Our design flow
Best topology
16
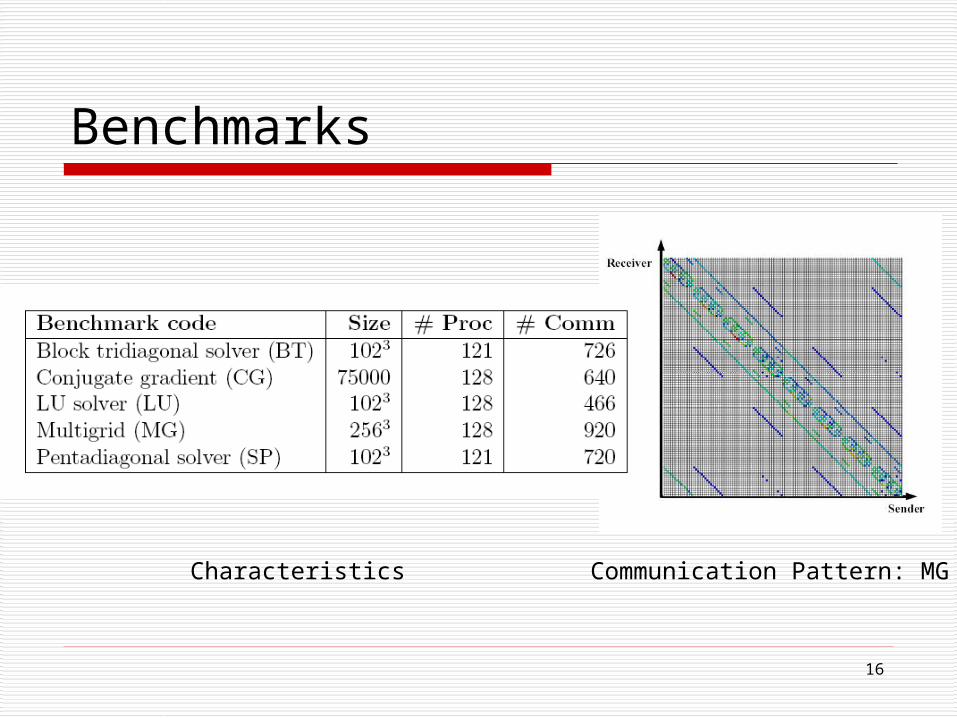
Benchmarks
Characteristics Communication Pattern: MG
17
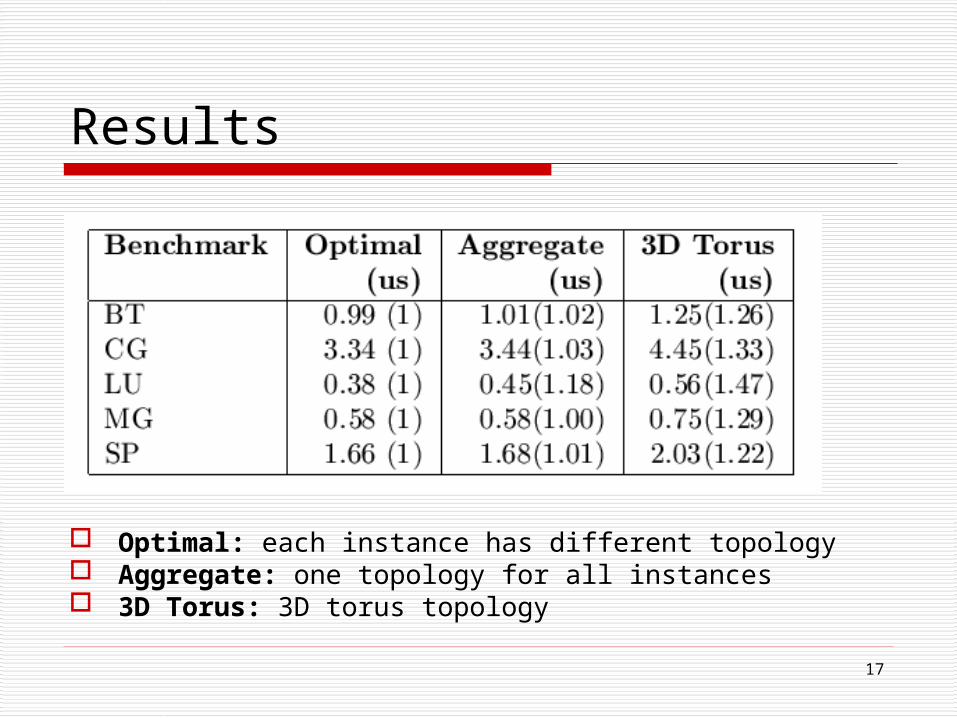
Results
Optimal: each instance has different topology Aggregate: one topology for all instances 3D Torus: 3D torus topology
18
Experiment 2: Generated Instances
Randomly generated communications Scalar values which represent the
demand for bandwidth between each pair of nodes
More general, time independent Control Parameters
# communication demands: O(n) pairs Communication amount: uniform traffic
but vary case by case (different congestion level)
19
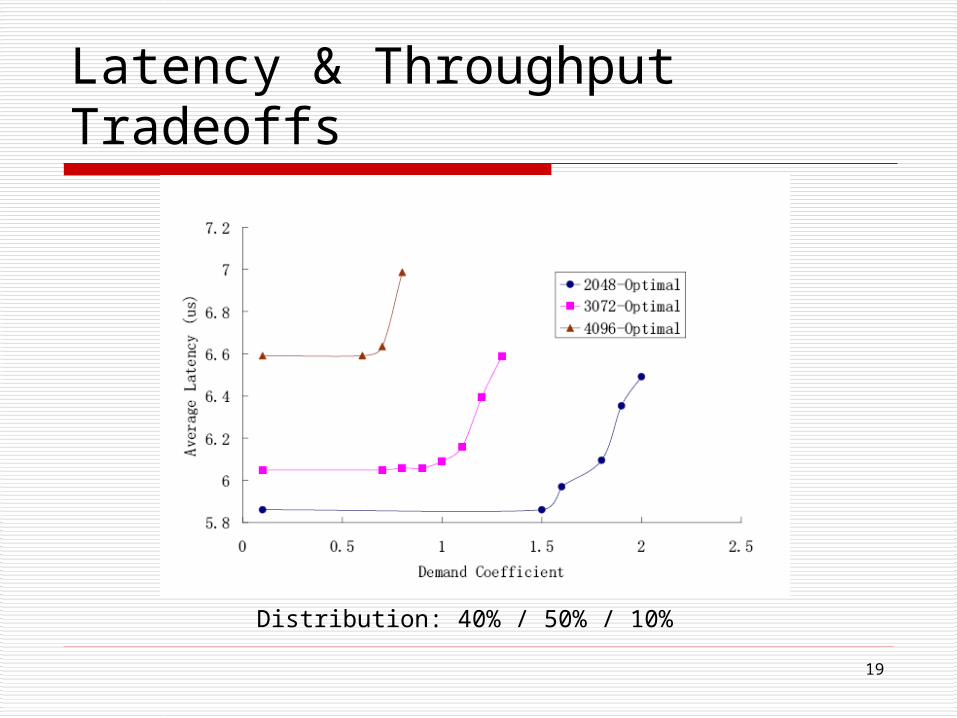
Latency & Throughput Tradeoffs
Distribution: 40% / 50% / 10%
20
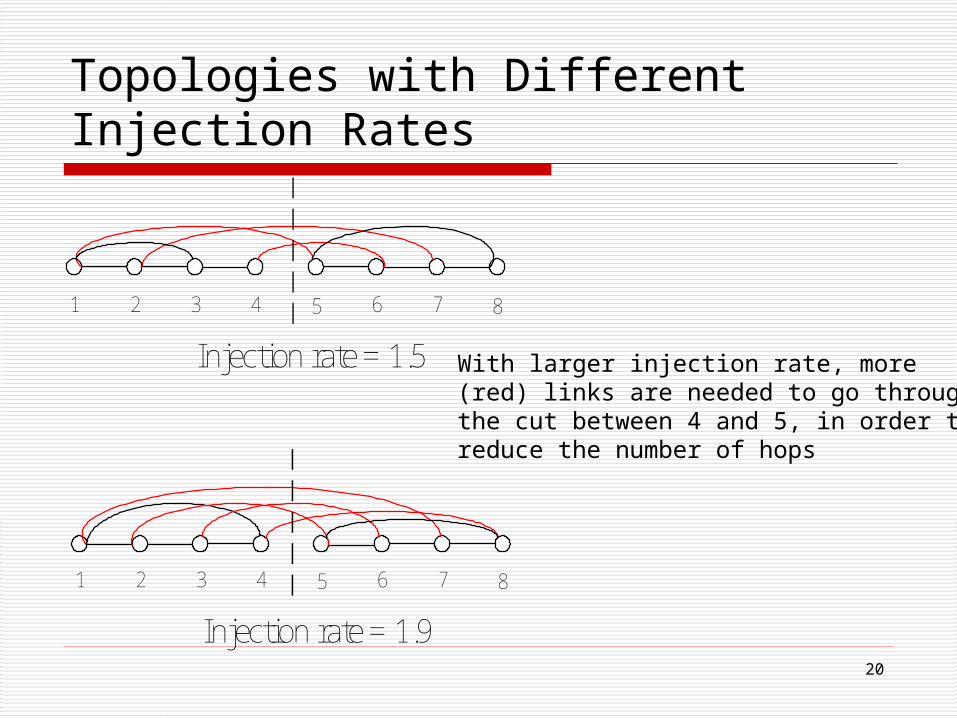
Topologies with Different Injection Rates
1 2 3 4 5 6 7 8
1 2 3 4 5 6 7 8
Injection rate = 1.5
Injection rate = 1.9
With larger injection rate, more(red) links are needed to go through the cut between 4 and 5, in order to reduce the number of hops
21
Conclusion
An design flow for interconnection network synthesis Fully automated Explore large design space Efficient evaluation algorithm
Future work Power consumption Accurate simulation

22
Q&A
Thank you!