1. analysis of rejections of asian agri-food; exports to global … › library › japanese ›...
TRANSCRIPT

7
For developing countries, securing export markets for their agri-food products is an important source of economic growth and employment. However, to be successful, exporters need to meet the food safety and quality regulations and requirements imposed by the importing countries through sanitary and phy-tosanitary measures. Inability to meet public regulations re-sults in shipments being rejected at the border. Many countries continue to experience challenges to consistently comply with quality and safety standards and requirements that prevail in international markets. Such instances of non-compliance are reflected in incidents where agri-food products that they want to export are rejected by authorities in the import market. These import rejections do not only have an immediate impact in the form of interrupted trade flows and foregone export revenues but might also harm the country’s reputation as an exporter of a certain commodity or product group.
Furthermore, there have been increasing concerns on food safe-ty issues in recent years because of a number of highly publi-cized “food scares” and “food scandals” both in developed and developing countries. As a consequence, related regulations and requirements have become more stringent. This can have a large impact on the exporters from developing countries, and their development prospects and their efforts to reduce poverty.
Identifying what causes import rejections will help export-ing countries better comply with the food safety and quality standards of importing countries and reduce the number of re-jections. The standards or requirements are often not uniform across countries. Rather, there are variations among countries reflecting differences stemming from climate, geography, peo-ple’s tastes and other factors. Therefore it is necessary to deter-mine whether products are rejected because of the standards or requirements imposed by a certain importing country or be-cause of root causes that are common across different import markets. If commonalities and differences in reasons for rejec-tion in different markets are identified, it is easier for exporting countries to understand what kinds of general measures to take to reduce rejections across markets and what specific measures are needed in certain markets. Yet, this issue has been rather neglected in economic research until recently because of pauci-ty of data. Much of the previous research on quality compliance issues of agri-food product exports from developing countries is based on specific case studies.
In light of this situation, UNIDO has compiled an internation-ally comparable dataset on import rejections for major import-ing markets (the United States and the EU) and published the first Trade Standards Compliance Report (TSCR) (UNIDO 2010)
in 2010. The data gathered and presented in the TSCR ena-bled stakeholders (including policymakers, international de-velopment organizations, donor agencies and researchers) to compare the performance of each country in terms of its trade standards compliance capabilities. The data also allow for an estimation of the financial implications of non-compliance. For instance, an estimated US$18 million worth of fish and fishery products exported from Asian countries to the United States market were lost in 2010 due to import rejections. From 2002 to 2010, the accumulated figure was US$285 million. Similarly, for other products, the lost opportunities loom large.
The present report builds on the previous TSCR while expand-ing the data coverage by adding Japan and Australia as import-ing markets. In addition, this report regionalizes the analysis by paying specific attention to exporting countries in East Asia. Countries examined in this report are: Brunei Darussalam, Cam-bodia, China, Indonesia, Japan, Republic of Korea, Lao People’s Democratic Republic, Malaysia, Myanmar, the Philippines, Sin-gapore, Thailand, and Viet Nam. The TSCR 2010 provided an analysis of global trends and patterns in import rejections in the agri-food sector. Meanwhile, the present regional report focuses on the performance of East Asian countries and analyzes their trade standards compliance capabilities in more detail, using the updated import rejection data compiled by UNIDO as well as providing in-depth case studies of selected agri-food supply chains in China and Viet Nam. Trade in agri-food products is or-ganized through specific supply chains linking different stages of production and marketing, although such supply chains are shorter and simpler compared to those associated with manu-factured goods. Because supply chains play an important role, the capacity to meet food safety standards rests on the capabili-ties of actors along the supply chain. The case studies in this report will examine each element in a supply chain in order to clearly identify the weak(est) links in a specific chain that may result in rejections in export markets. This kind of analysis will enable policymakers to identify the issues that warrant public interventions.
The structure of the report is as follows: chapter 1 provides an overview of overall trends in the export performance and trade standards compliance performance of East Asian countries in the agri-food sector. Chapter 2 examines the performance of East Asian countries in an important importing market in East Asia, namely the Japanese market. Chapters 3 to 5 look at specific agri-food product supply chains. Chapter 3 presents a case study on frozen vegetable exports from China. Chapter 4 provides a case study on the supply chain for cultured eels exported from China. Chapter 5 looks into seafood (pangasius
1. Analysis of Rejections of Asian Agri-food Exports to Global Markets

8 Regional Trade Standards Compliance Report - East Asia 2013
and shrimp) exports from Viet Nam. The annexes provide more information for each country to complement the analyses pro-vided in the report.
1.1 Introduction
As industrialisation has progressed in East Asia, agriculture’s share in GDP declined from a substantial 22.1 per cent, on aver-age, in 1990 to 15.6 per cent by 2000 and further to 11.9 per cent in 2010. The share of agricultural employment in total employ-ment has also declined from 32.3 per cent in 2000 to 15.8 per cent in 2009. These figures imply that East Asia is rapidly turn-ing away from agriculture. However, a country-by-country exami-nation reveals that agriculture still plays an essential role in eco-nomic development in many East Asian countries although the way in which agriculture contributes to economic development differs across countries.
In high-income countries – namely, Brunei Darussalam, Japan, Singapore and Republic of Korea – the GDP share of agriculture is small (less than 3 per cent in 2010) whereas in low-income countries such as Cambodia and Lao People’s Democratic Re-public it is over 30 per cent, showing a high dependency on the agricultural sector (see Table 1.1). Table 1.1 shows that middle-income countries such as Thailand, Malaysia, Indonesia, the Philippines and Viet Nam are also highly dependent on agri-culture, with its share in GDP ranging from 10 to 20 per cent. They are also active exporters of agricultural and food products. When we focus on the low- and middle-income countries in the region, the share of agricultural employment is still high, ac-counting for around 40 to 50 per cent. The importance of agri-culture in creating employment is explicitly described by Richter (2006: 46) for Thailand:
While the importance of agriculture as job provider has declined across the country, agriculture remains the dominant employer, even during the off-season, still providing jobs to more than 45 to 50 per cent of workers in the north, northeast and south. The key sector that provides monthly wage jobs in the northeast, north or south is services rather than industry.
This tendency can be observed in other East Asian countries as well (see Figure 1.1).
Note: East Asia is defined as comprising Brunei Darussalam, Cambodia, Indonesia, Malaysia, Lao People’s Democratic Re-public, Myanmar, Philippines, Singapore, Thailand, Viet Nam, China, Hong Kong (China), Macao (China), Japan, Democratic People’s Republic of Korea and Republic of Korea.
The importance and role of the agricultural sector can vary ac-cording to stage of economic development. The World Develop-ment Report 2008 (World Bank, 2008) categorises the way that agriculture contributes to a country’s economic development into three types: agriculture-based, transforming, and urban-ised countries. In agriculture-based countries, which are typi-cally low-income countries, agriculture itself contributes to eco-nomic growth due to its dominance in the country’s production. In transforming countries, which are mostly middle-income agri-cultural exporting countries in East Asia, agriculture is no longer
the engine of growth, but the engine of poverty reduction along with structural transformation (see Figure 1.2). In urbanised or industrialised countries, agriculture is a minor industry, but it remains important through its direct and indirect role in protect-ing the natural environment alongside further industrialisation.In agriculture-based countries such as Lao People’s Democratic Republic, Cambodia and Myanmar, growth in their agricultural sectors through technological progress has considerably con-tributed to economic growth. As a result, economic growth has led to poverty reduction for the majority of their populations be-cause poor people tend to be concentrated in rural areas. These countries mainly produce agricultural products for domestic consumption, as shown in Figure 1.2, because they do not have
Table 1.1: Share of agricultural sector in GDP in East Asian countries (%)
Country 1990 2000 2010
Brunei Darussalam 1.0 1.0 0.8
Cambodia - 37.8 36.0
China 27.1 15.1 10.1
Hong Kong, China - 0.09 -
Indonesia 19.4 15.6 15.3
Japan 2.1 1.5 1.2
Republic of Korea 8.9 4.6 2.6
Lao PDR 61.2 45.2 32.7
Macao, China - 0 0
Malaysia 15.2 8.6 10.6
Myanmar 57.3 57.2 -
Philippines 21.9 14.0 12.3
Singapore 0.3 0.1 0.03
Thailand 12.5 9.0 12.4
Viet Nam 38.7 24.5 20.6
Average (all East Asia) 22.1 15.6 11.9
Average (Japan and Republic of Korea excluded)
25.5 17.6 13.7
Source: World Bank World Development Indicators database
Figure 1.1: Agricultural employment (per cent of total employment) in East Asia
10
15
20
25
30
35
40
1990
1991
1992
1993
1994
1995
1996
1997
1998
1999
2000
2001
2002
2003
2004
2005
2006
2007
2008
2009
Shar
e of
Agr
icul
tura
l Em
ploy
men
t
(% o
f tot
al e
mpl
oym
ent)
East Asia
East Asia (except JPN and KOR)
Source: World Bank World Development Indicators database

9
Table 1.2: GDP share of food processing industry in East Asian countries (%)
Year
Countries
Cambodia ChinaHong Kong,
China
Macao,
ChinaIndonesia Japan
Republic of
KoreaMalaysia Philippines Thailand Viet Nam
1991 - 4.77 - 0.27 5.54 2.37 2.90 2.71 8.29 2.61 -
1992 - 4.35 - 0.21 5.51 2.47 2.81 2.76 7.58 - -
1993 4.71 4.34 - 0.23 5.20 2.46 2.70 2.58 8.23 5.92 -
1994 - 4.72 - 0.26 4.72 2.48 2.56 2.49 7.50 4.76 -
1995 1.90 4.56 - 0.23 4.59 2.45 2.32 2.73 7.36 - -
1996 - 5.07 - 0.27 4.14 2.41 2.37 2.45 6.59 6.37 -
1997 - 5.31 - 0.30 - 2.37 2.27 2.37 6.44 - -
1998 - 5.14 - 0.34 5.33 2.50 2.43 - 8.16 7.66 5.19
1999 - 4.90 - 0.34 5.12 2.59 2.48 3.04 6.56 - -
2000 1.11 4.62 0.24 0.38 4.99 2.54 2.33 2.47 - 5.95 5.60
2001 - 4.49 0.28 0.39 6.08 2.51 2.15 2.59 7.03 - -
2002 - 4.50 0.32 0.31 5.59 2.58 2.04 2.54 - 5.76 -
2003 - 4.22 0.29 0.20 7.07 2.51 1.94 2.53 5.98 - -
2004 - 3.87 0.27 0.19 6.95 2.46 2.02 2.38 - - -
2005 - 3.95 0.25 0.17 6.84 2.37 1.82 2.74 5.66 - -
2006 - 3.90 0.27 0.17 7.03 2.28 1.71 2.64 5.28 5.50 -
2007 - 3.88 0.30 0.29 6.94 2.30 - 2.52 2.51 - -
2008 - - 0.28 0.25 - - - - 2.56 - -
Source: World Bank World Development Indicators database
Figure 1.2: Relevance of agriculture for the economy (2000 and 2010)
Agriculture position across countries in 2000
Share of Agriculture Export (% of Export)
•Cambodia
•Thailand
•Indonesia•China
•
• •
•••Japan
•ASEAN 10
Shar
e of
Agr
icul
ture
Sec
tor (
% o
f GDP
)
60
40
20
00 10 20 30
• •
Agriculture position across countries in 2010
Share of Agriculture Export (% of Export)
•Cambodia
•Thailand•Indonesia
•Malaysia
•
••
••Korea•Japan
•ASEAN 10
Shar
e of
Agr
icul
ture
Sec
tor (
% o
f GDP
)
30
10
40
20
00 105 15 20 25
• •
Philippines
East AsiaSingapore
Korea
Macao Lao Macao
East Asia
Lao Singapore
AveragePhilippines
Average
•Malaysia
•Vietnam •Vietnam
•China
Source: World Bank World Development Indicators database
sufficient capacity to produce enough for export. Thus, growth in agricultural value added through adoption of advanced tech-nology and new crops can serve as a key engine of economic growth, and it is an essential step towards becoming an active exporter of agricultural products.
Thailand, Viet Nam, the Philippines, and Indonesia as well as China, are categorised as transforming countries according to World Development Report 2008 (World Bank, 2008), and have exhibited rapid economic growth through industrialisation. While industrialisation primarily benefits the urban population, rural poverty tends to be less severe than in the pre-industri-

10 Regional Trade Standards Compliance Report - East Asia 2013
alisation period because industrialisation is often made possi-ble by sufficient agricultural productivity. Agriculture no longer plays the prominent role that it did in the early stages of devel-opment in these countries. Thus, it is more appropriate to view growth in the agricultural sector as a means of reducing pov-erty and inequality, particularly between rural and urban areas in the transforming countries. History tells us that the growth success stories in England, the United States, Japan, and Re-public of Korea were initiated with an increase in agricultural productivity and this view is postulated by a number of studies. Most importantly, the agricultural sector provides labour for the manufacturing sector (e.g., Johnston and Mellor, 1961).
Furthermore, transforming countries tend to be actively engaged in agricultural and food export on account of their technological capacity and comparative agricultural advantage, even though their main strategic interest is in moving towards manufacturing production. Thus, it is important for the region and other regions to liberalise trade through reduction of tariff and non-tariff bar-riers so that these countries can take full advantage of export opportunities.
At the initial stages of industrialisation, the food processing in-dustry typically emerges and serves as a primal buyer of agri-cultural products. In East Asia, the food processing industry ac-counted on average for 2.7 per cent of GDP and 14.0 per cent of manufacturing industry in 2007. In agriculture-based countries, the GDP share of the processing industry is very low (for exam-ple, 1.1 per cent in Cambodia), but in transforming countries the share ranges from roughly 2 to 5 per cent (see Table 1.2 and Table 1.3). The food processing industry also employs a large
number of workers in terms of total manufacturing employment. It has strong backward linkages with the agricultural sector, and the growth of the food processing sector leads to growth of the agricultural sector (Anriquez and Stamoulis, 2007).
1.2 Trends in agricultural and food product exports from East AsiaSince 2000, the value of agricultural and food exports from East Asia1 has steadily increased, although exports dipped sub-stantially in 2009 reflecting the global slowdown. The growth was such that in ten years the value of exports almost doubled. When agricultural and food products are separated, the trend is similar, with the value of agricultural products about twice that of the food exports. In fact, both move almost hand-in-hand (see Figure 1.3). In terms of total exports, agricultural and food products account for only 2.3 per cent and 1.3 per cent of ex-ports in East Asia2, respectively (see Table 1.4). Relative to other countries or regions, the share of these products in total exports is rather small, reflecting the fact that the bulk of East Asia’s ex-ports are dominated by manufactured goods. In contrast to East
1 This report uses the following abbreviations: EAP (East Asia and the Pacific); LAC (Latin America and Caribbean); SSA (Sub-Saharan Africa); EU27 (EU 27 countries); SAR (South Asia); AUS (Australia); US (the United States); and ROW (Rest of the World). These categories reflect World Bank practice.2 East Asia consists of ASEAN10 countries (Brunei Darussalam, Cam-bodia, Indonesia, Lao People’s Democratic Republic, Malaysia, Myanmar, The Philippines, Singapore, Thailand, Viet Nam), China (including Hong Kong), Japan and Republic of Korea.
Table 1.3: Share of food processing industry in manufacturing in East Asian countries
Year
Countries
Cambodia ChinaHong Kong,
China
Macao,
ChinaIndonesia Japan
Republic of
KoreaMalaysia Philippines Thailand Viet Nam
1991 53.17 14.67 10.18 1.87 25.97 8.91 10.58 10.60 32.76 9.26 -
1992 20.02 13.30 10.09 1.80 25.09 9.63 10.56 10.71 31.33 - -
1993 - 12.77 10.29 2.59 23.33 10.18 10.06 9.96 34.70 19.96 -
1994 - 14.05 12.68 3.16 20.23 10.70 9.39 9.34 32.26 16.10 -
1995 - 13.54 10.50 3.10 19.00 10.58 8.41 10.34 32.01 - -
1996 - 15.12 11.80 3.50 16.18 10.37 8.87 8.80 28.88 21.43 -
1997 - 16.00 10.33 3.73 - 10.28 8.61 8.37 28.91 - -
1998 - 16.15 11.62 3.68 21.32 11.08 8.89 - 34.80 24.81 30.30
1999 - 15.51 7.93 4.00 19.69 11.70 8.83 9.84 27.96 - -
2000 6.56 14.39 7.16 4.87 18.00 11.43 8.26 7.99 - 17.70 30.19
2001 - 14.18 9.04 4.45 20.92 12.01 8.09 8.82 28.52 - -
2002 - 14.34 11.38 3.30 19.45 12.49 7.79 8.68 - 17.10 -
2003 - 12.84 10.99 3.59 25.03 11.97 7.52 8.44 24.27 - -
2004 - 11.97 10.77 4.06 24.78 11.58 7.30 7.85 - - -
2005 - 12.15 10.27 4.36 24.96 10.98 6.60 9.24 23.55 - -
2006 - 11.85 11.57 10.19 25.54 10.71 6.32 8.98 22.34 15.69 -
2007 - 11.81 14.48 12.01 25.64 10.83 - 9.07 - - -
2008 - - 14.42 - - - - - - - -
Source: World Bank World Development Indicators database

11
Asia, Latin American countries rely heavily on agricultural and food product exports. Close to one fifth of exports from Latin American countries comes from agricultural and food products (see Table 1.4). Other countries and regions also rely on exports of agricultural goods and/or food products.
Although the shares of agricultural and food product exports are small in East Asia, in value terms, East Asia’s exports of agricul-tural and food products are substantial. The EU is by far the larg-est exporter of agricultural and food products in the world (see Figure 1.4 and Figure 1.5). After the EU, East Asia is the second or third largest exporting region in the world, competing head-to-head with Latin American countries. In fact, East Asia and Latin America export similar amounts of agricultural and food prod-ucts (see Figure 1.6). Even though East Asian countries export widely to many countries, for agricultural and food exports the regional market of East Asia is the main market. In 2010, close to half (47.5 per cent) of agricultural and food exports from East Asia were destined for East Asian countries, followed by 11.8 per cent to the EU and 10.5 per cent to the United States (see Table 1.5). Although the export share to the East Asia region has de-clined by 8.3 per cent since 2000, in terms of absolute export values, East Asia itself is still the major market and is rapidly growing (see Figure 1.7). At country level, agricultural and food exports from China (including Hong Kong) to the East Asian mar-ket are the largest (see Table 1.6). Special attention should be given to frozen fishery products and frozen vegetable products because they account for a significant proportion of exports from East Asian countries (in 2009 frozen fishery products accounted for 17.6 per cent of foodstuff exports from East Asia and frozen vegetable products for 7.4 per cent (see Table 1.7)). China is a
Table 1.4: Share of agriculture/food in total exports (%), 2010
EAP AUS EU27 LAC SAR SSA US ROW
Agriculture 2.3 8.7 4.6 11.3 7.9 6.2 6.9 3.7
Food 1.3 2.1 3.8 6.9 2.0 5.1 2.5 2.3
Ag + Food 3.6 10.8 8.2 18.2 9.9 11.3 9.4 6.0
Other 96.4 89.3 91.7 81.8 90.1 88.8 90.6 94.1
Source: UN Comtrade database
Figure 1.4: Agricultural exports by region
0
50,000
100,000
150,000
200,000
250,000
2000 2002 2004 2006 2008 2010
mill
ion
US$
EAP
SAR
USA
LAC
SSA
EU27
AUS
Source: UN Comtrade database
Figure 1.5: Food exports by region
0
50,000
100,000
150,000
200,000
2000 2002 2004 2006 2008 2010
mill
ion
US$
EAP
SAR
USA
LAC
SSA
EU27
AUS
Source: UN Comtrade database
Figure 1.3: Trends in agricultural and food exports from East Asia, 2000-2010
0
10,000
20,000
30,000
40,000
50,000
60,000
70,000
80,000
90,000
100,000
Agro
Food
2000
2001
2002
2003
2004
2005
2006
2007
2008
2009
2010
mill
ion
US$
Source: UN Comtrade database
Figure 1.6: Comparison of agricultural and food product exports for LAC and EAP
0
20,000
40,000
60,000
80,000
100,000
120,000
2000 2002 2004 2006 2008 2010
mill
ion
US$
LAC_Ag
EAP_Ag
LAC_Food
EAP_Food
Source: UN Comtrade database

12 Regional Trade Standards Compliance Report - East Asia 2013
Table 1.5: Export market shares of EAP in 2010 (%)
Agriculture Food Agriculture + Food
Total Export Value US$95,781,988 US$52,964,880 US$148,746,868
AUS 0.9 3.0 1.6
EAP 44.7 52.7 47.5
EU27 12.7 10.2 11.8
LAC 1.9 1.8 1.9
SAR 11.3 2.0 8.0
SSA 4.6 2.2 3.8
US 8.5 14.1 10.5
ROW 15.4 14.0 14.9
Total 100.0 100.0 100.0
Source: UN Comtrade database
Table 1.6: Exports from EAP countries (including Japan) to the EAP region in 2009 (US$1,000)
Agriculture Food
Total 36,954,990 Total 23,078,8002
China
(incl. Hong Kong)
12,798,299 China
(incl. Hong Kong)
8,692,790
Indonesia 5,706,039 Thailand 4,935,365
Malaysia 5,912,405 Singapore 2,801,643
Thailand 4,558,444 Malaysia 1,858,311
Viet Nam 4,098,922 Indonesia 1,363,946
Republic of Korea 1,303,970 Republic of Korea 1,296,740
Japan 1,064,869 Japan 1,151,994
Singapore 762,033 Viet Nam 638,476
Philippines 738,053 Philippines 333,977
Myanmar NA Myanmar NA
Cambodia 11,956 Cambodia 5,560
Source: UN Comtrade database
Table 1.7: Vegetables and fish exported to all regions from EAP countries in 2009 (US$1,000)
Vegetables
7.4% of Agriculture
Fish/Shrimps/Eels
17.6% of Agriculture
Total 6,251,024 Total 14,933,252
China (incl. Hong Kong) 5,491,024 (87.8%) China (incl. Hong Kong) 5,575,876 (37.3%)
Indonesia 60,477 (1.0%) Viet Nam 3,313,391 (22.2%)
Thailand 589,030 (9.4%) Thailand 3,255,106 (21.8%)
Viet Nam 48,556 (0.8%) Indonesia 1,337,594 (9.0%)
Malaysia 45,249 (0.7%) Republic of Korea 513,284 (3.4%)
Singapore 7,430 (0.1%) Malaysia 367,960 (2.5%)
Japan 6,295 (0.1%) Japan 372,068 (2.5%)
Republic of Korea 1,744 (<0.1%) Philippines 98,992 (0.7%)
Philippines 1,219 (<0.1%) Singapore 98,980 (0.7%)
Note: Vegetables include codes 0710 and 2004 of the Harmonized Commodity Description and Coding System (HS). The HS codes for fish are 030269, 030379, 030410, 030420 and 030490; 030613, 030623 and 160520 for shrimps; and 030192, 030266 and 030376 for eels.
Source: UN Comtrade database
13
leading exporter of both frozen fishery and vegetable products in East Asia. Within East Asia, Japan is a main importer of both agricultural and food products. In 2010, the Japanese market represented 20 per cent of the market for agricultural exports from East Asian countries and one-third of food product exports (see Figure 1.8). In addition, the Japanese market is considered to be highly sophisticated (i.e. exporters and sellers can expect higher margins) and also to have stricter standards. Success in the Japanese market can be a sign of better competitiveness in other markets. Because the Japanese market is a significant market in East Asia, this report emphasises Japanese import re-jections of shipments coming from other East Asian countries.
1.3 General trends in import rejections of East Asian agri-food products
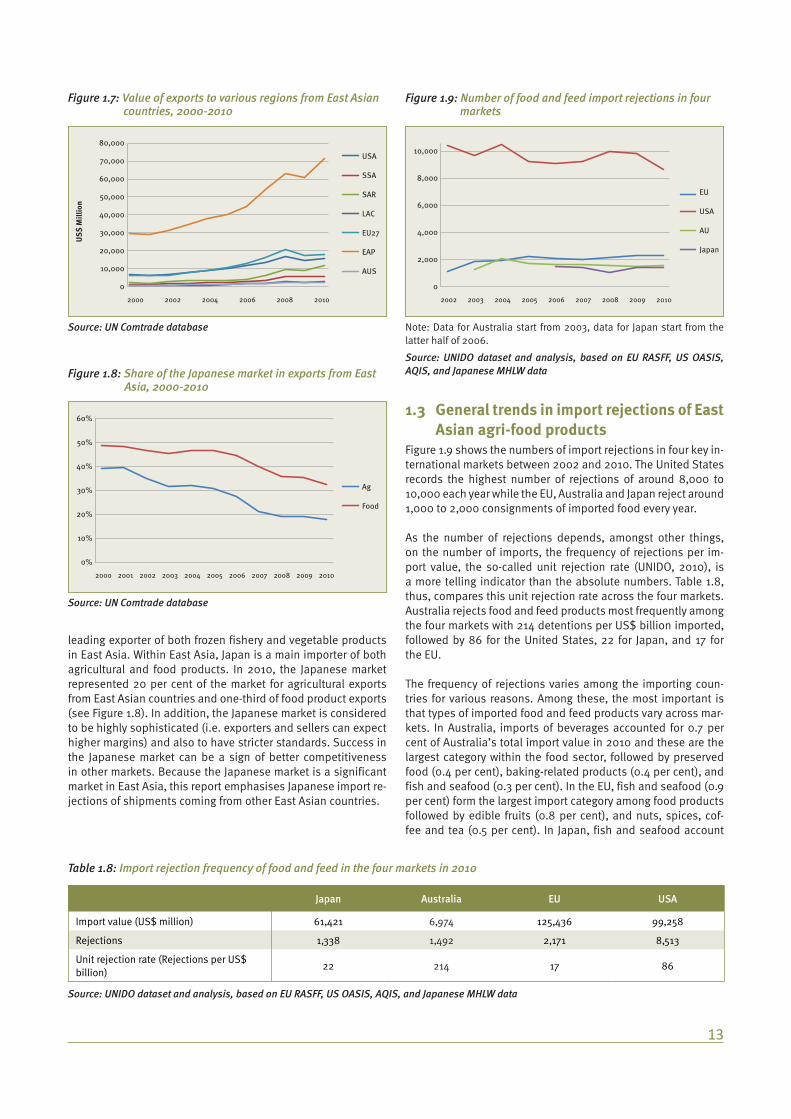
Figure 1.9 shows the numbers of import rejections in four key in-ternational markets between 2002 and 2010. The United States records the highest number of rejections of around 8,000 to 10,000 each year while the EU, Australia and Japan reject around 1,000 to 2,000 consignments of imported food every year.
As the number of rejections depends, amongst other things, on the number of imports, the frequency of rejections per im-port value, the so-called unit rejection rate (UNIDO, 2010), is a more telling indicator than the absolute numbers. Table 1.8, thus, compares this unit rejection rate across the four markets. Australia rejects food and feed products most frequently among the four markets with 214 detentions per US$ billion imported, followed by 86 for the United States, 22 for Japan, and 17 for the EU.
The frequency of rejections varies among the importing coun-tries for various reasons. Among these, the most important is that types of imported food and feed products vary across mar-kets. In Australia, imports of beverages accounted for 0.7 per cent of Australia’s total import value in 2010 and these are the largest category within the food sector, followed by preserved food (0.4 per cent), baking-related products (0.4 per cent), and fish and seafood (0.3 per cent). In the EU, fish and seafood (0.9 per cent) form the largest import category among food products followed by edible fruits (0.8 per cent), and nuts, spices, cof-fee and tea (0.5 per cent). In Japan, fish and seafood account
Figure 1.7: Value of exports to various regions from East Asian countries, 2000-2010
0
20,000
40,000
60,000
80,000
10,000
30,000
50,000
70,000
2000 2002 2004 2006 2008 2010
US$
Mill
ion
USA
SSA
SAR
LAC
EU27
EAP
AUS
Source: UN Comtrade database
Figure 1.8: Share of the Japanese market in exports from East Asia, 2000-2010
0%
10%
30%
50%
60%
20%
40%
2000 2002 2004 2006 2008 20102001 2003 2005 2007 2009
Ag
Food
Source: UN Comtrade database
Figure 1.9: Number of food and feed import rejections in four markets
0
2,000
6,000
10,000
4,000
8,000
2002 2004 2006 2008 20102003 2005 2007 2009
EU
USA
AU
Japan
Note: Data for Australia start from 2003, data for Japan start from the latter half of 2006.
Source: UNIDO dataset and analysis, based on EU RASFF, US OASIS, AQIS, and Japanese MHLW data
Table 1.8: Import rejection frequency of food and feed in the four markets in 2010
Japan Australia EU USA
Import value (US$ million) 61,421 6,974 125,436 99,258
Rejections 1,338 1,492 2,171 8,513
Unit rejection rate (Rejections per US$ billion)
22 214 17 86
Source: UNIDO dataset and analysis, based on EU RASFF, US OASIS, AQIS, and Japanese MHLW data

14 Regional Trade Standards Compliance Report - East Asia 2013
for most food imports, making up 1.7 per cent of total imports, followed by meat (1.2 per cent) and cereals (1.0 per cent). In the United States, beverages are the largest product category consisting of 0.8 per cent, then fish and seafood (0.6 per cent), edible fruit and nuts (0.5 per cent) and spices, coffee and tea (0.3 per cent) follow. As Table 1.9 shows, rejection frequency dif-
fers across food products, which might lead to different rejec-tion frequencies across countries with different product import structures. Secondly, as discussed earlier, food safety stand-ards and related requirements, including those regarding label-ling and packaging, differ between countries. Table 1.10 shows the reasons for rejection in the four major importing markets in
Table 1.9: Import rejection cases by product category in 2010
Product category
Australia EU United States Japan
Cases Share (in %) Cases Share (in %) Cases Share (in %) Cases Share (in %)
Beverage 188 11.8 43 2 504 6.0 172 12.9
Cereals and bakery products 349 22.0 111 5.1 1,164 13.9 195 14.6
Confectionery and sugar 44 2.8 37 1.7 829 9.9 139 10.4
Dairy 94 5.9 26 1.2 329 3.9 19 1.4
Fats and vegetable and animal oils
26 1.6 17 0.8 32 0.4 19 1.4
Feed materials 0 0.0 116 5.3 206 2.5 0 0.0
Fish and fishery products 237 14.9 421 19.4 1,627 19.4 295 22.0
Food additives 0 0.0 0 0 35 0.4 18 1.3
Fruits and vegetables and products
207 13.0 425 19.6 2,053 24.5 231 17.3
Herbs and spices 77 4.8 205 9.4 889 10.6 41 3.1
Meat and meat products 18 1.1 88 4.1 14 0.2 95 7.1
Nuts, nut products and seeds
75 4.7 522 24 159 1.9 104 7.8
Other processed foods 272 17.1 159 7.3 527 6.3 9 0.7
Other products of animal origin
1 0.1 1 0 0 0.0 1 0.1
Total 1,588 100 2,171 100 8,368 100 1,338 100
Source: UNIDO dataset and analysis, based on EU RASFF, US OASIS, AQIS, and Japanese MHLW data
Table 1.10: Reasons for import rejections in 2010, rankings in parentheses
Reason for rejection Australia Japan United States EU
Labelling 1,165 (1) 0 5,843 (1) 16 (13)
Bacterial contamination 219 (2) 311 (1) 1,350 (5) 253 (4)
Adulteration/missing document 218 (3) 8 (9) 1,472 (4) 166 (6)
Other contaminants 89 (4) 32 (7) 188 (7) 132 (7)
Pesticide residues 73 (5) 265 (3) 738 (6) 347 (2)
Heavy metal 25 (6) 11 (8) 38 (9) 71 (9)
Mycotoxins 39 (7) 149 (5) 26 (10) 679 (1)
Veterinary drugs residues 20 (8) 86 (6) 180 (8) 58 (11)
Additive 21 (9) 178 (4) 1,816 (3) 291 (3)
Hygienic condition/controls 0 287 (2) 2,046 (2) 238 (5)
Other microbiological contaminants 0 0 N/A 123 (8)
Packaging N/A 0 13 (12) 40 (12)
Others 41 11 (8) 19 (11) 69 (10)
Total 1,910 1,338 13,729 2,483
Note: Reasons for rejections are sorted according to Australia’s ranking of reasons. The number in parentheses indicates the rank.
Source: UNIDO dataset and analysis, based on EU RASFF, US OASIS, AQIS, and Japanese MHLW data

15
2010. For example, Australia does not list packaging as a rea-son for rejection while the EU does not list “other microbiologi-cal contaminants”. Moreover, among the consolidated list of reasons, their composition is diverse across the four markets. While Australia and the United States record labelling as the most frequent reason for rejection, Japan reports no cases of rejection through non-compliance in labelling and the EU re-ports very few problems related to labelling. The weights and stringency of each rejection reason vary across countries; some markets have more stringent food safety standards than others and some markets have more detailed labelling requirements and so on. Thirdly, the methods used to check, sample and test can also differ. Fourth, the frequency of inspections also differs across markets.
1.4 Performance of Asian countries in the major markets
To improve capacity to meet the standards imposed by an im-porting country, the commonalities and differences in rejections across markets need to be analyzed. Specifically, one needs to examine in detail the reasons for rejections to identify rejection reasons that are common across the importing countries and those that are specific to certain markets. By identifying com-mon challenges across importing markets, an exporting country could take effective general measures to enhance competitive-ness across the markets. In addition, some markets have spe-cific requirements that exporting countries are finding difficult to meet, in which case it is in the interests of exporting countries to pinpoint the exact causes of these difficulties in order to over-come them.
Table 1.11 lists the 15 countries with the most frequent agri-food import rejections in each importing market to show the relative performance of exporting countries. Among Asian countries, China, Indonesia, Thailand and Viet Nam tend to experience more rejections across the four major markets. Comparing the rejection rates and import shares reveals that the number of re-jections is not well correlated with the import shares. For exam-
Table 1.11: Fifteen countries with the most frequent agri-food import rejections and their import shares in 2010 (%)
Japan Australia EU United States
Rank Import share Import share Import share Import share
1 China 14.0 China 6.9 Iran 0.3 Mexico 15.4
2 United States 24.4 Japan 0.6 Turkey 3.5 India 1.9
3 Viet Nam 1.7 India 1.6 China 5.2 China 6.4
4 Thailand 6.1 United States 10.6 India 3.0 UK 2.2
5 Ghana 0.2 Thailand 7.0 United States 7.6 Canada 16.6
6 Ecuador 0.3 Italy 4.1 Thailand 2.6 Viet Nam 2.0
7 Indonesia 1.8 Philippines 0.4 Brazil 8.4Dominican Republic
0.5
8 Italy 1.2 Rep. of Korea 0.7 Argentina 4.2 Thailand 4.2
9 Rep. of Korea 2.9 Malaysia 4.1 Viet Nam 2.1 Japan 0.8
10 Canada 6.4 Viet Nam 2.9 Indonesia 3.1 Indonesia 2.4
11 India 1.5 Indonesia 1.8 Egypt 0.6 Rep. of Korea 0.5
12 France 2.6 France 3.2 Ghana 0.3 Philippines 1.2
13 Philippines 2.0 UK 3.2 Morocco 2.8 France 3.5
14 Brazil 4.0 South Africa 0.9 Ukraine 1.6 Italy 3.5
15 Australia 7.1 Sri Lanka 0.4 Nigeria 0.6 Pakistan 0.1
Note: Ranking is according to total cases during 2006–2010 for Japan, 2003–2010 for Australia, 2002–2010 for the EU, and 2002–2010 for the United States
Source: UNIDO dataset and analysis, based on EU RASFF, US OASIS, AQIS, and Japanese MHLW data, UN Comtrade
Table 1.12: Rejections per US$ billion imported for food and feed exports from Asian countries in 2010
Japan Australia EU US
Cambodia 0 0 0 0
China 29 298 45 150
Hong Kong, China 18 888 0 431
Indonesia 40 215 6 142
Japan - 1,972 11 183
Republic of Korea 22 1,649 32 363
Lao PDR 150 0 0 0
Malaysia 5 85 5 60
Myanmar 47 106 0 0
Philippines 15 1,111 8 162
Singapore 8 18 0 231
Thailand 30 108 36 75
United States 11 127 16 -
Viet Nam 111 164 27 181
Source: UNIDO dataset and analysis, based on EU RASFF, US OASIS, AQIS, and Japanese MHLW data

16 Regional Trade Standards Compliance Report - East Asia 2013
ple, in the three importing markets of Japan, Australia and the EU, China ranks higher than the United States in terms of the number of rejections, despite the fact that there are more im-ports from the United States than from China in these markets. Similarly, in Japan and the United States, Viet Nam is reported to have higher rejection rates than Thailand, Republic of Korea and France, all of which have larger import shares than Viet Nam in these markets.
Rejections per US$ billion imported or rejection rates for Asian exporting countries are calculated in Table 1.12. In the Japanese market, Lao People’s Democratic Republic and Viet Nam have higher rejection rates relative to other exporting countries. In Australia, food and feed products exported from Japan, Repub-lic of Korea and the Philippines are most frequently rejected. In the EU, China, Thailand and Republic of Korea have relatively more rejections. Most of the Asian countries perform relatively well against their competitors in one market and less well in other markets. And there is a variation of rejection frequency across the four markets. Interestingly, relatively higher-income countries such as Japan and Republic of Korea perform poorly in some markets. For instance, among Asian countries, Japan saw the largest number of rejections in the Australian market in 2010 while Republic of Korea seems to struggle in the Australian, EU and United States markets.
Table 1.13 to Table 1.20 show the reasons for rejections of agri-food exports from Asian countries across four markets. Some characteristics of the markets can be observed. In Australia and the United States, non-compliance with labelling requirements results in significant levels of rejection while Japan does not re-ject for labelling reasons and the EU only makes relatively few rejections on this basis. In contrast, bacterial contamination is the most prominent reason for rejections in Japan. Rejections in relation to hygiene conditions are significant in the United States. Let us now look more closely at the individual East Asian countries’ performance.
Cambodia has relatively few rejections in each market (see Ta-ble 1.13): One case for the EU in 2002–2010, one case for Japan in 2006–2010, two cases for Australia in 2003–2010 and 10 cases for the United States in 2002–2010. Among the reasons for rejection, bacterial contamination is common across all four markets.
China experiences far more rejections than Cambodia (see Table 1.14). Every year, the number of rejections is 317 for Australia, 238 for the EU, 369 for Japan and 1,080 for the United States on average. Reasons for rejection of Chinese exports vary among the four markets. The most frequent reason for rejection in the EU is detection of mycotoxins, while bacterial contamination as well as pesticide residues are more frequently cited in Japan. The United States rejects Chinese exports most frequently for non-compliance with hygienic standards while Australia rejects most frequently for labelling non-compliance.
For Indonesia, the average number of rejections each year is 40 for the EU, 375 for the United States, 38 for Japan and 59 for Australia. In the United States, bacterial contamination and hygienic condition/control are among the top reasons for rejec-tions. In Japan, veterinary drugs residues and bacterial contami-nation are the most important causes of import rejections. The
major reason for rejection in the EU is detection of heavy metals as well as veterinary drugs residues (see Table 1.14).
For Lao People’s Democratic Republic, there are no rejection cases reported in Australia, the EU or United States. There were only three cases recorded in Japan during 2006–2010. The top rejection reason is pesticide residues (see Table 1.15).
For Malaysia, the annual average number of rejections is 17 for the EU, 85 for the United States, four for Japan, and 63 for Aus-tralia. In both the EU and Japan, bacterial contamination and additives are the major reasons to reject Malaysian imports (see Table 1.16). Labelling is the most frequent reason given in Aus-tralia.
For Myanmar, the number of rejections is small: 12 for the Unit-ed States; eight for Australia; two for the EU; and 17 for Japan. Labelling is the most frequent reason for rejection in the United States and Australia. Veterinary drugs and other contaminants are the most frequent reasons cited by the EU while in Japan, major rejection reasons are pesticide residues and mycotoxins (see Table 1.17).
For the Philippines, the number of rejections is 343 for the United States, 76 for Australia, 27 for Japan and 16 for the EU. Adulteration and/or missing documents are among the top re-jection reasons for the United States, Australia, and the EU (see Table 1.18). Japan rejected a lot of Philippine products because of bacterial contamination.
For Thai exports, 392 rejections for the United States, 119 for the EU, 110 for Japan and 97 for Australia are recorded every year on average. Among those rejections, bacterial contamination is the most frequent reason in Japan, the EU, the United States and Australia (see Table 1.19). Pesticide residues are also an important reason for rejection in the EU, Japan and Australia. Veterinary drugs residues matter in the EU. Hygienic condition/controls are problems in the United States and Japan. Labelling is the most frequent reason cited in Australia.
For Viet Nam, the number of rejections is 64 for Australia, 81 for the EU, 113 for Japan and 512 for the United States on average. Bacterial contamination is a common reason for rejection in all four countries (see Table 1.20). In addition to these rejections, veterinary drugs residues are the major reason for rejections in Japan and the EU. Reflecting market characteristics, non-com-pliance with hygienic conditions in the United States and label-ling in Australia are frequent reasons for rejections.
Rejection reasons such as bacterial contamination, pesticide residues and veterinary drugs residues indicate that compli-ance issues have their origin at the farming stage of the produc-tion process. And these appear among the most frequent rea-sons for rejections of food exported from developing countries, including in East Asia.
To compare the situation between developed countries and developing countries, Japan, Republic of Korea, and Singapore are taken as examples. For Japan as an exporter, the number of rejections is 473 for the United States, 148 for Australia and 75 for the EU. The most frequent reason cited in the United States and Australia is either non-compliance with labelling require-

17
Table 1.13: Reasons for import rejections of agri-food products from Cambodia (%)
Myc
otox
ins
Addi
tives
Bact
eria
l con
tam
inat
ion
Vete
rinar
y dr
ugs
resi
dues
Pest
icid
e re
sidu
es
Oth
er c
onta
min
ants
Hea
vy m
etal
s
Adul
tera
tion/
mis
sing
do
cum
ent
Hyg
ieni
c co
nditi
on/
cont
rols
Oth
er m
icro
biol
ogic
al
cont
amin
ants
Labe
lling
Pack
agin
g
Oth
ers
EU 0 0 100 0 0 0 0 0 0 0 0 0 0
US 0 0 20 10 0 10 0 0 30 NA 30 0 0
JPN 100 0 0 0 0 0 0 0 0 0 0 NA 0
AUS 0 0 50 0 0 0 0 0 0 0 50 0 0
Note: The recorded period is 2002–2010 for the EU and United States, 2003–2010 for Australia and 2006–2010 for Japan. The number represents the share of rejection reasons in each market.
Source: UNIDO dataset and analysis, based on EU RASFF, US OASIS, AQIS, and Japanese MHLW data
Table 1.14: Reasons for import rejections of agri-food products from China (%)
Myc
otox
ins
Addi
tives
Bact
eria
l con
tam
inat
ion
Vete
rinar
y dr
ugs
resi
dues
Pest
icid
e re
sidu
es
Oth
er c
onta
min
ants
Hea
vy m
etal
s
Adul
tera
tion/
mis
sing
do
cum
ent
Hyg
ieni
c co
nditi
on/
cont
rols
Oth
er m
icro
biol
ogic
al
cont
amin
ants
Labe
lling
Pack
agin
g
Oth
ers
EU 30.0 15.3 3.2 13.9 1.4 8.5 4.0 10.6 3.4 4.1 1.2 0.9 3.6
US 0.1 19.6 4.9 7.9 5.0 2.5 0.1 15.3 24.1 NA 19.9 0.2 0.5
JPN 6.7 15.1 26.5 15.9 23.5 2.2 0.2 2.1 2.9 0.1 0.0 0.1 4.7
AU 4.1 1.0 7.2 3.6 2.4 0.9 8.4 5.4 0.4 0.0 61.9 NA 4.8
Note: The recorded period is 2002–2010 for the EU and United States, 2003–2010 for Australia and 2006–2010 for Japan. The number represents the share of reasons for rejections in each market.
Source: UNIDO dataset and analysis, based on EU RASFF, US OASIS, AQIS, and Japanese MHLW data
Table 1.15: Reasons for import rejections of agri-food products from Indonesia (%)
Myc
otox
ins
Addi
tives
Bact
eria
l con
tam
inat
ion
Vete
rinar
y dr
ugs
resi
dues
Pest
icid
e re
sidu
es
Oth
er c
onta
min
ants
Hea
vy m
etal
s
Adul
tera
tion/
mis
sing
do
cum
ent
Hyg
ieni
c co
nditi
on/
cont
rols
Oth
er m
icro
biol
ogic
al
cont
amin
ants
Labe
lling
Pack
agin
g
Oth
ers
EU 7.6 12.0 7.6 20.4 0.6 14.0 26.3 0.6 3.1 5.0 0.3 0.3 2.2
US 0.2 4.9 24.4 4.3 0.0 4.4 0.0 11.1 38.8 NA 11.8 0.0 0.1
JPN 4.8 3.7 26.1 33.5 9.6 4.8 0.0 0.0 16.0 0.0 0.0 0.0 1.6
AUS 8.7 1.5 5.9 0.4 1.3 7.8 6.1 7.8 0.0 0.0 59.0 1.5 NA
Note: The recorded period is 2002–2010 for the EU and United States, 2003–2010 for Australia and 2006–2010 for Japan. The number represents the share of rejection reasons in each market.
Source: UNIDO dataset and analysis, based on EU RASFF, US OASIS, AQIS, and Japanese MHLW data

18 Regional Trade Standards Compliance Report - East Asia 2013
Table 1.16: Reasons for import rejections of agri-food products from Lao People’s Democratic Republic (%)
Myc
otox
ins
Addi
tives
Bact
eria
l con
tam
inat
ion
Vete
rinar
y dr
ugs
resi
dues
Pest
icid
e re
sidu
es
Oth
er c
onta
min
ants
Hea
vy m
etal
s
Adul
tera
tion/
mis
sing
do
cum
ent
Hyg
ieni
c co
nditi
on/
cont
rols
Oth
er m
icro
biol
ogic
al
cont
amin
ants
Labe
lling
Pack
agin
g
Oth
er
JPN 25.0 0.0 0.0 0.0 75.0 0.0 0.0 0.0 0.0 0.0 0.0 0.0 0.0
Note: The recorded period is 2006–2010 for Japan. The number represents the share of rejection reasons in each market.
Source: UNIDO dataset and analysis, based on EU RASFF, US OASIS, AQIS, and Japanese MHLW data
Table 1.17: Reasons for import rejections of agri-food products from Malaysia (%)
Myc
otox
ins
Addi
tives
Bact
eria
l con
tam
inat
ion
Vete
rinar
y dr
ugs
resi
dues
Pest
icid
e re
sidu
es
Oth
er c
onta
min
ants
Hea
vy m
etal
s
Adul
tera
tion/
mis
sing
do
cum
ent
Hyg
ieni
c co
nditi
on/
cont
rols
Oth
er m
icro
biol
ogic
al
cont
amin
ants
Labe
lling
Pack
agin
g
Oth
ers
EU 4.0 13.9 44.4 7.3 0.7 13.9 0.7 4.6 0.7 2.6 2.0 0.0 5.3
US 0.0 10.2 10.5 3.7 0.1 1.7 0.0 27.7 21.5 0.0 24.4 0.0 0.1
JPN 5.0 45.0 35.0 5.0 0.0 10.0 0.0 0.0 0.0 0.0 0.0 0.0 0.0
AUS 4.2 0.0 7.8 0.2 1.2 0.6 1.2 3.4 1.2 0.2 78.1 NA 2.0
Note: The recorded period is 2002–2010 for the EU and United States, 2003–2010 for Australia and 2006–2010 for Japan. The number represents the share of rejection reasons in each market.
Source: UNIDO dataset and analysis, based on EU RASFF, US OASIS, AQIS, and Japanese MHLW data
Table 1.18: Reasons for import rejections of agri-food products from Myanmar (%)
Myc
otox
ins
Addi
tives
Bact
eria
l con
tam
inat
ion
Vete
rinar
y dr
ugs
resi
dues
Pest
icid
e re
sidu
es
Oth
er c
onta
min
ants
Hea
vy m
etal
s
Adul
tera
tion/
mis
sing
do
cum
ent
Hyg
ieni
c co
nditi
on/
cont
rols
Oth
er m
icro
biol
ogic
al
cont
amin
ants
Labe
lling
Pack
agin
g
Oth
ers
EU 0.0 0.0 0.0 58.8 0.0 35.3 0.0 0.0 0.0 5.9 0.0 0.0 0.0
US 0.0 0.9 11.7 0.0 0.0 0.9 0.0 0.0 16.2 NA 70.3 0.0 0.0
JPN 29.4 0.0 0.0 0.0 58.8 11.8 0.0 0.0 0.0 0.0 0.0 0.0 0.0
AUS 6.5 0.0 0.0 0.0 0.0 4.8 0.0 6.5 0.0 NA 67.7 NA 14.5
Note: The recorded period is 2002–2010 for the EU and United States, 2003–2010 for Australia and 2006–2010 for Japan. The number represents the share of reasons for detentions in each market.
Source: UNIDO dataset and analysis, based on EU RASFF, US OASIS, AQIS, and Japanese MHLW data

19
Table 1.19: Reasons for import rejections of agri-food products from the Philippines (%)
Myc
otox
ins
Addi
tives
Bact
eria
l con
tam
inat
ion
Vete
rinar
y dr
ugs
resi
dues
Pest
icid
e re
sidu
es
Oth
er c
onta
min
ants
Hea
vy m
etal
s
Adul
tera
tion/
mis
sing
do
cum
ent
Hyg
ieni
c co
nditi
on/
cont
rols
Oth
er m
icro
biol
ogic
al
cont
amin
ants
Labe
lling
Pack
agin
g
Oth
ers
EU 17.0 22.0 3.5 7.8 0.0 19.1 3.5 19.1 2.1 0.0 0.7 1.4 3.5
US 0.1 13.7 7.3 0.0 0.4 2.8 0.0 26.2 28.1 NA 21.2 0.2 0.1
JPN 1.5 15.0 52.6 0.0 17.3 3.8 1.5 0.0 5.3 0.8 0.0 0.0 2.3
AUS 5.6 0.3 1.1 0.0 0.2 4.8 2.5 15.1 0.3 0.0 67.9 NA 2.3
Note: The recorded period is 2002–2010 for the EU and United States, 2003–2010 for Australia and 2006–2010 for Japan. The number represents the share of rejection reasons in each market.
Source: UNIDO dataset and analysis, based on EU RASFF, US OASIS, AQIS, and Japanese MHLW data
Table 1.20: Reasons for import rejections of agri-food products from Thailand (%)
Myc
otox
ins
Addi
tives
Bact
eria
l con
tam
inat
ion
Vete
rinar
y dr
ugs
resi
dues
Pest
icid
e re
sidu
es
Oth
er c
onta
min
ants
Hea
vy m
etal
s
Adul
tera
tion/
mis
sing
do
cum
ent
Hyg
ieni
c co
nditi
on/
cont
rols
Oth
er m
icro
biol
ogic
al
cont
amin
ants
Labe
lling
Pack
agin
g
Oth
ers
EU 2.2 11.7 25.8 17.9 23.6 5.9 5.1 0.9 1.6 2.0 0.1 0.5 2.7
US 0.1 8.4 13.2 0.6 2.2 0.7 0.0 20.9 31.9 NA 21.9 0.0 0.1
JPN 6.9 6.8 53.8 2.7 11.3 1.5 0.0 0.0 16.8 0.0 0.0 0.0 0.2
AUS NA 0.4 5.7 1.0 5.2 9.2 2.8 5.8 1.8 0.0 63.0 NA 2.1
Note: The recorded period is 2002–2010 for EU and United States, 2003–2010 for Australia and 2006–2010 for Japan. The number represents the share of rejection reasons in each market.
Source: UNIDO dataset and analysis, based on EU RASFF, US OASIS, AQIS, and Japanese MHLW data
Table 1.21: Reasons for import rejections of agri-food products from Viet Nam (%)
Myc
otox
ins
Addi
tives
Bact
eria
l con
tam
inat
ion
Vete
rinar
y dr
ugs
resi
dues
Pest
icid
e re
sidu
es
Oth
er c
onta
min
ants
Hea
vy m
etal
s
Adul
tera
tion/
mis
sing
do
cum
ent
Hyg
ieni
c co
nditi
on/
cont
rols
Oth
er m
icro
biol
ogic
al
cont
amin
ants
Labe
lling
Pack
agin
g
Oth
ers
EU 3.2 10.8 23.4 27.3 2.1 9.1 8.4 2.5 3.9 4.8 0.3 0.6 3.7
US 0.7 8.7 23.6 3.8 0.4 4.6 0.0 10.6 25.4 NA 21.6 0.0 0.5
JPN 1.2 5.7 25.8 52.8 8.9 0.2 0.0 0.0 4.1 0.0 0.0 0.4 1.1
AUS 1.4 2.7 25.1 8.6 1.0 3.9 1.8 2.1 0.2 0.0 51.7 NA 1.6
Note: The recorded period is 2002–2010 for the EU and United States, 2003–2010 for Australia and 2006–2010 for Japan. The number represents the share of rejection reasons in each market.
Source: UNIDO dataset and analysis, based on EU RASFF, US OASIS, AQIS, and Japanese MHLW data

20 Regional Trade Standards Compliance Report - East Asia 2013
Table 1.22: Reasons for import rejections of agri-food products from Japan (%)
Myc
otox
ins
Addi
tives
Bact
eria
l con
tam
inat
ion
Vete
rinar
y dr
ugs
resi
dues
Pest
icid
e re
sidu
es
Oth
er c
onta
min
ants
Hea
vy m
etal
s
Adul
tera
tion/
mis
sing
do
cum
ent
Hyg
ieni
c co
nditi
on/c
on-
trol
s
Oth
er m
icro
biol
ogic
al
cont
amin
ants
Labe
lling
Pack
agin
g
Oth
ers
EU 1.3 52.0 0.0 4.0 6.7 6.7 17.3 6.7 0.0 0.0 0.0 0.0 5.3
US 0.0 9.2 2.2 0.0 0.2 0.5 0.0 44.6 8.4 NA 34.9 0.0 0.0
AUS 0.0 0.1 2.5 0.1 0.3 3.0 0.2 25.1 0.0 0.0 67.1 NA 1.5
Note: The recorded period is 2002–2010 for the EU and United States, 2003–2010 for Australia. The number represents the share of rejection rea-sons in each market.
Source: UNIDO dataset and analysis, based on EU RASFF, US OASIS, AQIS, and Japanese MHLW data
Table 1.23: Reasons for import rejections of agri-food products from The Republic of Korea (%)
Myc
otox
ins
Addi
tives
Bact
eria
l con
tam
inat
ion
Vete
rinar
y dr
ugs
resi
dues
Pest
icid
e re
sidu
es
Oth
er c
onta
min
ants
Hea
vy m
etal
s
Adul
tera
tion/
mis
sing
do
cum
ent
Hyg
ieni
c co
nditi
on/c
on-
trol
s
Oth
er m
icro
biol
ogic
al
cont
amin
ants
Labe
lling
Pack
agin
g
Oth
ers
EU 1.0 26.2 5.8 6.8 1.9 3.9 9.7 8.7 1.0 1.0 1.9 3.9 28.2
US 34.6 12.8 4.8 0.0 0.9 0.7 0.0 37.0 9.0 NA 34.6 0.0 0.2
JPN 0.6 12.8 42.8 1.1 33.3 0.0 0.0 1.1 5.6 0.0 0.0 0.0 2.8
AUS 0.0 0.6 5.1 0.0 1.3 2.1 0.0 15.7 0.9 0.0 72.9 NA 1.3
Note: The recorded period is 2002–2010 for the EU and United States, 2003–2010 for Australia and 2006–2010 for Japan. The num-ber represents the share of rejection reasons in each market.Source: UNIDO dataset and analysis, based on EU RASFF, US OASIS, AQIS, and Japanese MHLW data
Table 1.24: Reasons for import rejections of agri-food products from Singapore (%)
Myc
otox
ins
Addi
tives
Bact
eria
l con
tam
inat
ion
Vete
rinar
y dr
ugs
resi
dues
Pest
icid
e re
sidu
es
Oth
er c
onta
min
ants
Hea
vy m
etal
s
Adul
tera
tion/
mis
sing
do
cum
ent
Hyg
ieni
c co
nditi
on/c
on-
trol
s
Oth
er m
icro
biol
ogic
al
cont
amin
ants
Labe
lling
Pack
agin
g
Oth
ers
EU 9.2 4.2 0.8 0.8 0.0 3.4 75.6 0.8 0.0 0.0 0.0 0.0 5.0
US 1.1 3.7 13.7 0.0 0.0 19.2 0.0 13.7 37.3 NA 11.4 0.0 0.0
JPN 14.3 71.4 0.0 0.0 0.0 0.0 0.0 14.3 0.0 0.0 0.0 0.0 0.0
AUS 1.6 0.5 1.6 1.1 3.3 1.6 2.7 0.5 1.6 0.0 83.2 NA 2.2
Note: The recorded period is 2002–2010 for the EU and United States, 2003–2010 for Australia and 2006–2010 for Japan. The number represents the share of rejection reasons in each market.
Source: UNIDO dataset and analysis, based on EU RASFF, US OASIS, AQIS, and Japanese MHLW data

21
ments or adulteration/missing documents (see Table 1.21). Meanwhile, in the EU, additives and heavy metals are among the most common reasons for rejections.
For Republic of Korea, the average number of rejections is 379 for the United States, 66 for Australia, 36 for Japan and 11 for the EU. Labelling and adulteration/missing documents are again the major reasons for Australian and United States rejections (see Table 1.22). Among other major reasons, improper use of additives for the EU, detections of mycotoxins for the United States and bacterial contamination and pesticide residues for Japan need to be noted.
For Singapore, the number of rejections is 30 for the United States, 23 for Australia, 13 for the EU and 7 for Japan. The most frequent reason for Australia is labelling non-compliance. Heavy metals provoke the most rejections in the EU while in Japan it is the improper use of additives (see Table 1.23).
So, to sum up, for relatively higher-income countries, knowl-edge and implementation of importer food safety standards such as labelling and documentation are the major source of problems. In addition, reflecting the fact that exports from these countries are concentrated more in processed foods with higher value added, non-compliance with additive requirements is a common reason for rejections.
In general, the distribution of rejection reasons reflects the characteristics of export product categories and suggests which food production processes can be upgraded to meet import standards. In the next section, we therefore delineate the re-lationship between supply chain management and its implica-tions for standards compliance.
1.5 Potential pitfalls along the supply chain
While the total value of agricultural and food products exported from East Asia has steadily increased, it is mainly driven by intra-regional trade, and export growth to key markets in developed countries such as the EU, the United States, Japan and Australia is slower. One of the reasons is that these markets require ex-porters to meet tighter mandatory food safety regulations estab-lished by public authorities as well as standards set by various private and international entities. As we have seen, rejections of agriculture and food products exported from Asia have occurred due to non-compliance with national/regional mandatory food safety regulations for various reasons such as pesticides, mi-crobacteria and hygiene standards. Judged by import rejection rates, cases of non-compliance are not an insignificant phe-nomenon. Therefore, to win key markets, meeting regulations has remained a major challenge. Moreover, food safety regula-tions imposed by importing countries are becoming increas-ingly stringent over time, especially in developed countries. In addition, driven by consumer demand and competition among larger supermarket chains in the developed countries which aim to differentiate their products from others (Henson and Rear-don, 2005), various private standards have been introduced, especially in the EU. In an environment where regulations and standards become stricter, it is important for developing coun-tries in Asia to be compliant and competitive food suppliers to
the important markets such as the United States, EU, Australia and Japan by meeting their regulations and standards. This re-port has assumed the task of examining the challenges facing Asian farmers and food producers and of outlining possible ac-tion plans and measures to tackle compliance problems in order to improve product quality and meet market requirements. In the following, we will look at the issue of compliance (capacity and challenges) through a supply chain lens.As was highlighted in previous sections, the most common reasons for rejections of agri-food imports cited by Australian, EU, Japanese and United States authorities are bacterial contamination, pesticide resi-dues, other contaminants and mycotoxins.
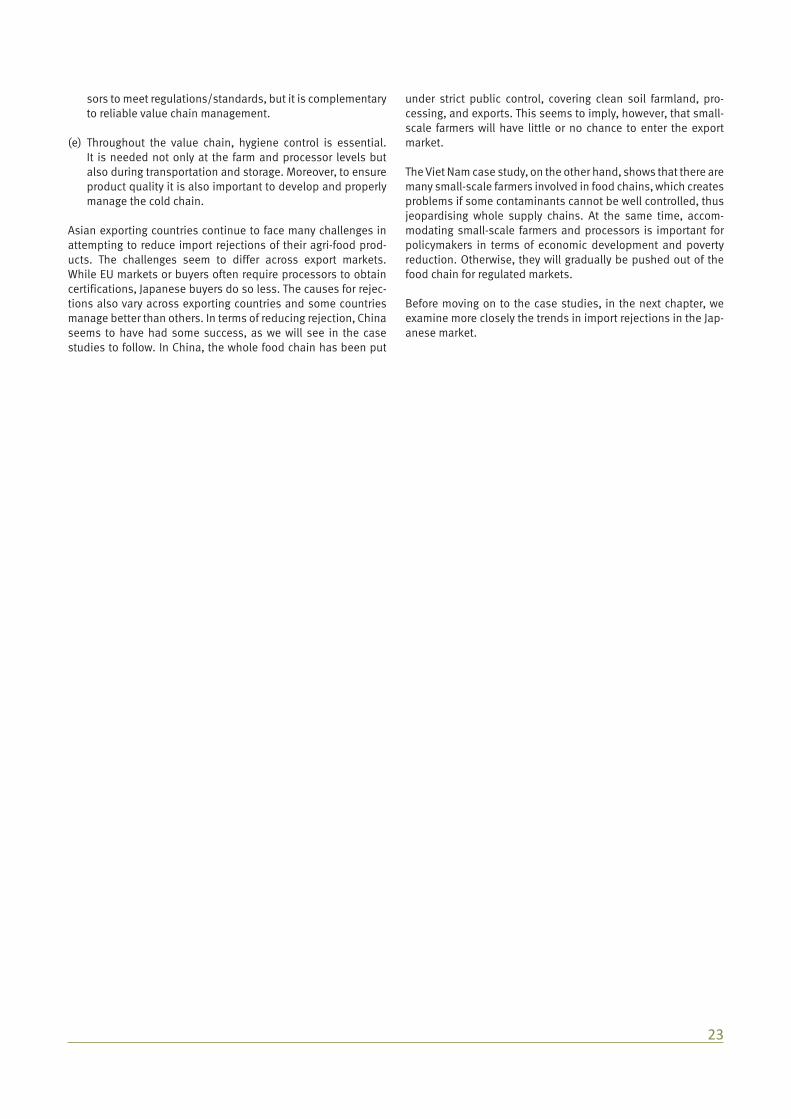
Figure 1.10 summarizes the root causes and possible sources of these problems along food value chains.
In a globalised world, suppliers of materials such as feed for fish or pesticides for agro products are located around the globe and supply of such inputs may come from domestic producers or foreign ones. For example, in a typical shrimp product value chain in Viet Nam, feed is imported from Chile or Peru, chemi-cals from Canada and other inputs are from domestic markets. Cultured shrimps are finally exported to multiple markets over-seas. One of the big challenges for East Asia is that a processor cannot meet import regulations and/or standards on its own; it is often necessary for farmers and suppliers along the entire value chain to take measures as well. Various requests to meet food safety regulations and standards need to be communicat-ed well beyond an exporter’s national borders.
As can be seen in Figure 1.10, issues of non-compliance can emerge at different stages of the supply chain, as follows:
(a) Pesticide residues, contaminants, mycotoxins, heavy met-als, veterinary drug residues could all enter the food chain at the the farming/growing/primary production stage. This is primarily related to input procurement. Let’s start with the processor. The processor procures inputs from farmers, say shrimp farms. In order for their processed food to comply with regulations/standards, the processor needs to procure from farmers who grow shrimps in a compliant way. If farm-ers are not familiar with requirements or do not recognise their importance, they may be tempted to use prohibited but cheap pesticides, antibiotics, feed and so on. In this way, contaminants exceeding permitted levels can be in-troduced into the food chain through farmer inputs. Insuf-ficient knowledge or recognition of inputs and regulations is definitely among the key explanations for import rejections. There are further reasons for inadequate input control. For instance, even if farmers are familiar with the requirements, they might not know the good substitutes. As the Viet Nam case study shows, shrimp feed is imported from Chile and Peru because domestic feed isn’t suitable for growing qual-ity shrimps, but mycotoxins have been introduced through the imported feed. Despite being aware of the problem, it is not easy for farmers to find a better substitute and it takes time for farmers to reduce the contamination level by chang-ing inputs. Another example relates to a tea leaves proces-sor who only procures tea leaves from domestic small-scale farmers. When the tea processor tried to sell the products to a brand company, excessive levels of pesticides and mi-
22 Regional Trade Standards Compliance Report - East Asia 2013
crobacteria were found. Despite the processor knowing the problem, the processor has no way of changing the farm-ing methods used by many small-scale farmers (Michida and Nabeshima 2012). In developing countries, produc-ers, especially small and medium producers, are often not well equipped with the financial and technical capac-ity to comply with foreign import regulations or standards. A clean environment that can accommodate food produc-tion that satisfies regulations is a must. However, owning land with good soil and having access to safe and clean wa-ter is usually beyond the reach of many farmers/processors. As a consequence, small-scale farmers can lose access to the regulated markets.
(b) Compliance issues related to bacterial contamination and unhygienic conditions, improper use of additives, adultera-tion/missing documents, packaging and labelling could oc-cur at the processing stage of the supply chain. Beyond pro-curing adequate inputs, processors need to install proper production management for hygiene control. To do so, buy-ers might ask processors as well as farmers to obtain vari-ous certifications such as for HACCP (Hazard Analysis and Critical Control Point). Also there are private standards such as GlobalGAP and the British Retail Consortium (BRC), which are often applied in the EU market. Certifications like these help buyers to determine and confirm that the processor in-stalled processing management properly, and that hygiene controls are therefore in place. Meeting private standards helps reduce import rejections at port. However, certifica-tions are not always easy to obtain, especially for small-scale processors and farmers. Moreover, obtaining and re-newing certifications involve cost.
Similarly, in order to make sure products do not contain ex-cessive levels of contaminants, processors need to test their products before sale. As testing fees can be very expensive and sweep out all the profit, small- and medium-scale farm-ers/processors are not willing to test unless it is absolutely necessary. Moreover, small-scale processors may not able to bear the high cost of testing.
When a test result shows a product has some contaminants, how do processors deal with the problems? Processors us-ing inputs from various farmers need to sort out the source of the problem. To do so, a traceability system is important to track which farmers or inputs cause the problems so that the problematic inputs can be separated. Yet, developing a traceability system takes time and this is another hurdle for processors in developing countries like Viet Nam.
(c) Problems with regard to labelling and documents could oc-cur at the trading stage of the supply chain. As some export-ers sell to more than one market, they differentiate products depending on the grade quality and other requirements of export markets.
(d) At the final stage of the supply chain, problems can occur in the form of non-compliance with private standards and con-ducting tests required by buyers Some uncertainties remain even after products are tested and exporters and the prod-ucts are found to meet the regulation thresholds. However, different countries use different testing and sampling meth-ods which means that, even if pre-shipping testing does not reveal contaminants, testing in the importing country (e.g. at the port) could still reveal problems. Testing helps proces-
Figure 1.10: Prototype of agri-food supply chain - production stages and potential sources of non-compliance causing rejections
Farmer 1
Farmer 2
Farmer 3
Traders Processors Exporter Importer
Export Market 1
Export Market 2
Export Market 3
Exporting country Importing country
(a)*Input control *Certification *Testing*The environment
(b)*Input control*Production process management*Traceability* Certification*Testing
(c)TestingDifferentiate markets
(d)Inspection at portsSome uncertainties
Source: Authors’ own illustration
(e) Hygienic control: necessary throughout value chains including transportation and storage
23
sors to meet regulations/standards, but it is complementary to reliable value chain management.
(e) Throughout the value chain, hygiene control is essential. It is needed not only at the farm and processor levels but also during transportation and storage. Moreover, to ensure product quality it is also important to develop and properly manage the cold chain.
Asian exporting countries continue to face many challenges in attempting to reduce import rejections of their agri-food prod-ucts. The challenges seem to differ across export markets. While EU markets or buyers often require processors to obtain certifications, Japanese buyers do so less. The causes for rejec-tions also vary across exporting countries and some countries manage better than others. In terms of reducing rejection, China seems to have had some success, as we will see in the case studies to follow. In China, the whole food chain has been put
under strict public control, covering clean soil farmland, pro-cessing, and exports. This seems to imply, however, that small-scale farmers will have little or no chance to enter the export market.
The Viet Nam case study, on the other hand, shows that there are many small-scale farmers involved in food chains, which creates problems if some contaminants cannot be well controlled, thus jeopardising whole supply chains. At the same time, accom-modating small-scale farmers and processors is important for policymakers in terms of economic development and poverty reduction. Otherwise, they will gradually be pushed out of the food chain for regulated markets.
Before moving on to the case studies, in the next chapter, we examine more closely the trends in import rejections in the Jap-anese market.