1 analyst day | dec . 7, 2017 | st. regis new york · day | dec. 7, 2017 | st. regis new york ......
TRANSCRIPT

| Proprietary © Meritor, Inc. 2017 1 Analyst Day | Dec. 7, 2017 | St. Regis New York

| Proprietary © Meritor, Inc. 2017
Forward-Looking Statements This presentation contains statements relating to future results of the company (including certain projections and business trends) that are “forward-looking statements” as defined in
the Private Securities Litigation Reform Act of 1995. Forward-looking statements are typically identified by words or phrases such as “believe,” “expect,” “anticipate,” “estimate,”
“should,” “are likely to be,” “will” and similar expressions. Actual results may differ materially from those projected as a result of certain risks and uncertainties, including but not limited
to reliance on major OEM customers and possible negative outcomes from contract negotiations with our major customers, including failure to negotiate acceptable terms in contract
renewal negotiations and our ability to obtain new customers; the outcome of actual and potential product liability, warranty and recall claims; our ability to successfully manage rapidly
changing volumes in the commercial truck markets and work with our customers to manage demand expectations in view of rapid changes in production levels; global economic and
market cycles and conditions; availability and sharply rising costs of raw materials, including steel, and our ability to manage or recover such costs; our ability to manage possible
adverse effects on our European operations, or financing arrangements related thereto following the United Kingdom's decision to exit the European Union or, in the event one or more
other countries exit the European monetary union; risks inherent in operating abroad (including foreign currency exchange rates, restrictive government actions regarding trade,
implications of foreign regulations relating to pensions and potential disruption of production and supply due to terrorist attacks or acts of aggression); risks related to our joint ventures;
rising costs of pension benefits; the ability to achieve the expected benefits of strategic initiatives and restructuring actions; our ability to successfully integrate the products and
technologies of FABCO Holdings, Inc. and future results of such acquisition, including its generation of revenue and it being accretive; the demand for commercial and specialty
vehicles for which we supply products; whether our liquidity will be affected by declining vehicle productions in the future; OEM program delays; demand for and market acceptance of
new and existing products; successful development and launch of new products; labor relations of our company, our suppliers and customers, including potential disruptions in supply
of parts to our facilities or demand for our products due to work stoppages; the financial condition of our suppliers and customers, including potential bankruptcies; possible adverse
effects of any future suspension of normal trade credit terms by our suppliers; potential impairment of long-lived assets, including goodwill; potential adjustment of the value of deferred
tax assets; competitive product and pricing pressures; the amount of our debt; our ability to continue to comply with covenants in our financing agreements; our ability to access capital
markets; credit ratings of our debt; the outcome of existing and any future legal proceedings, including any litigation with respect to environmental, asbestos-related, or other matters;
the actual impacts of our modifications to benefits provided to certain former union employee retirees on the company’s balance sheet, earnings and amount of cash payments;
possible changes in accounting rules; ineffective internal controls; and other substantial costs, risks and uncertainties, including but not limited to those detailed in our Annual Report on
Form 10-K for the year ended September 30, 2017 and from time to time in other filings of the company with the SEC. These forward-looking statements are made only as of the date
hereof, and the company undertakes no obligation to update or revise the forward-looking statements, whether as a result of new information, future events or otherwise, except as
otherwise required by law. All earnings per share amounts are on a diluted basis. The company's fiscal year ends on the Sunday nearest Sept. 30, and its fiscal quarters end on the Sundays nearest Dec. 31, March 31 and June 30. All year and quarter references relate to the company's fiscal year and fiscal quarters, unless otherwise stated.
2

| Proprietary © Meritor, Inc. 2017
Analyst Day 2017
3
Business Overview
Financial Review
Jay Craig CEO and President
Chris Villavarayan Senior Vice President
and President, Americas
Joe Plomin Senior Vice President
and President, International
Rob Speed Senior Vice President and President,
Aftermarket & Trailer and Chief Procurement Officer
Kevin Nowlan Senior Vice President
and Chief Financial Officer
State of the Business
Jay Craig
Q&A
Beyond M2019

| Proprietary © Meritor, Inc. 2017 Proprietary © Meritor, Inc. 2017
Jay Craig
CEO and President

| Proprietary © Meritor, Inc. 2017
Building on Success
5

| Proprietary © Meritor, Inc. 2017
Demonstrated ability to execute
Achieving Targeted Financial Performance (1)(2)
6
Adjusted
EBITDA Margin
Adjusted Diluted EPS
from Con. Ops.
300bp increase 80% increase
Outlook Actual Actual Actual
1. See Appendix – “Non-GAAP Financial Information”
2. Based on management’s current planning assumptions and other factors. Actual results may differ materially from projections as a result of risks and uncertainties. See slide “Forward Looking Statements.”

| Proprietary © Meritor, Inc. 2017
Delivering World-Class Performance
7
Global CPPM Performance Incident Rate
Quality Delivery Safety
OE Delivery
Strategy Zero
• M2019 target 25PPM –
ultimate target zero
Focused on no fault forward
Recipient of six customer
quality awards in FY17
Excellent delivery performance
maintained as volumes have
increased
Met M2019 target of >99% in
FY17
Received Ashok Leyland’s first
ever Gold Delivery Award
Ultimate target zero injuries
Below M2019 target of ≤.65 in
FY17
Nearly half of plants had zero
recordable injuries in FY17
Dramatic improvement due to
employee engagement and
safety involvement teams
Goal: Customer quality of <25 PPM Goal: >99% OE delivery Goal: Safety case rate to ≤.65
FY13 FY14 FY15 FY16 FY17
190
72 65 50 40
FY13 FY14 FY15 FY16 FY17
0.98 0.92 0.76 0.70
0.48
FY13 FY14 FY15 FY16 FY17
97.9% 97.6% 98.8% 98.5% 99.0%
| Proprietary © Meritor, Inc. 2017
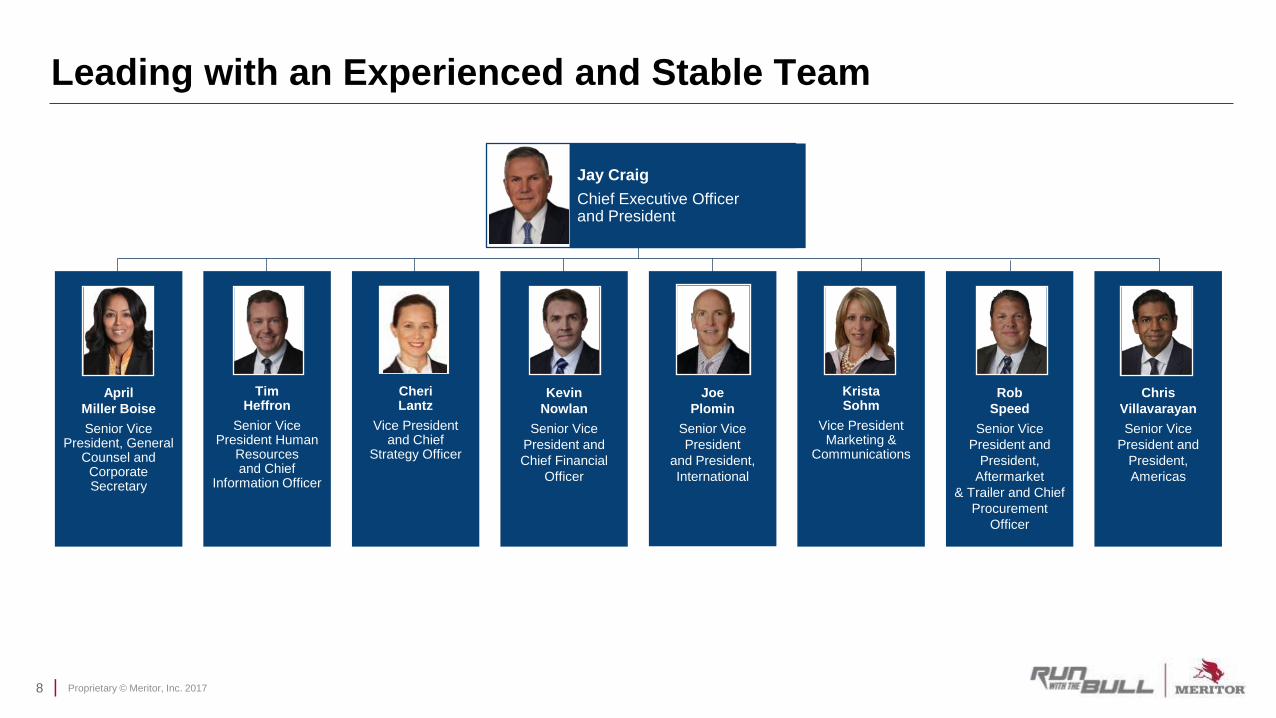
Leading with an Experienced and Stable Team
Jay Craig
Chief Executive Officer and President
Cheri Lantz
Vice President and Chief
Strategy Officer
Joe
Plomin
Senior Vice
President
and President,
International
Rob
Speed
Senior Vice
President and
President,
Aftermarket
& Trailer and Chief
Procurement
Officer
Chris
Villavarayan
Senior Vice
President and
President,
Americas
Kevin
Nowlan
Senior Vice
President and
Chief Financial
Officer
Tim Heffron
Senior Vice President Human
Resources and Chief
Information Officer
Krista Sohm
Vice President Marketing &
Communications
April
Miller Boise
Senior Vice President, General
Counsel and Corporate Secretary
8

| Proprietary © Meritor, Inc. 2017
Supporting Strategic Growth
9
3
6
~7
Pace of Major Product Launches
Average Annual Product Launches
Maintaining increased cadence of
product launches
Eight significant launches in FY17
Developing global platforms to meet
the needs of our customers
Awarded over $700M
of new business since
launch of M2016
Expanding core business

| Proprietary © Meritor, Inc. 2017
Gross Debt Reduction OPEB Reduction S&P Credit Rating
Strengthening the Balance Sheet
10
Improved credit profile enables investment focus on strategic growth actions
$220M
Reduction
1. Reflects pro forma call of $175M 6.75% Notes, which occurred on November 2, 2017 and paydown of US Securitization program, which had an $89M balance as of September 30, 2017
FY17
Pro forma(1)
FY16
Actual FY16
Actual
FY17
Actual FY16
Actual
FY17
Actual
$343M
Reduction

| Proprietary © Meritor, Inc. 2017
-50%
0%
50%
100%
150%
200%
250%
300%
350%
400%
Apr-13 Oct-13 Apr-14 Oct-14 Apr-15 Oct-15 Apr-16 Oct-16 Apr-17 Oct-17
▬ MTOR +331%
> $1.6B of shareholder value created
Creating Shareholder Value
11
1. Meritor share price performance versus a peer group average and the S&P 500 over the period from 4/30/13 to 11/30/17
2. Peer group includes American Axle & Manufacturing Holdings, Inc., BorgWarner Inc., Dana Incorporated, Federal-Mogul Corporation, Hyster-Yale Materials Handling, Inc., ITT Corporation, Kennametal Inc., Modine
Manufacturing Company, Oshkosh Corp., SPX Corporation, Tenneco Inc., The Manitowoc Company, Inc., The Greenbrier Companies, Inc., The Timken Company, Tower International, Trinity Industries Inc., Visteon
Corporation, WABCO Holdings, Wabash National Corp., Westinghouse Air Brake Technologies Corporation
▬ Peers +82%
▬ S&P 500 +66%
Meritor Share Price Performance vs. Peer Group Average and S&P 500(1)(2)
ANNOUNCED ANNOUNCED

| Proprietary © Meritor, Inc. 2017
FY17-FY19 Long-Term Incentive Plan
(LTIP) ties directly to M2019 financial
targets
Management long-term incentives
are 100 percent equity based
CEO’s total compensation is 85 percent
performance-based and at risk
Employees own five percent of the
company through a combination of
shares outstanding and other unvested
equity-based awards
Executive Compensation Aligned to M2019
12
1
(1)
(1) (2)
(1) (2)(3)
LTIP Weight
25%
50%
25%
Target
1. Based on management’s current planning assumptions and other factors. Actual results may differ materially from projections as a result of risks and uncertainties. See slide “Forward Looking Statements.”
2. See Appendix – “Non-GAAP Financial Information”
3. Net Debt to Adjusted EBITDA Ratio: (Total debt – Cash and cash equivalents) / Adjusted EBITDA

| Proprietary © Meritor, Inc. 2017
Board Expertise Aligned with Long-Term Growth Strategy
Board expertise aligned with long-term growth strategy
Strategic Operational
William Newlin
Independent
Chairman of Meritor
Chairman and Director
Newlin Investment
Company
Rhonda Brooks
President
R. Brooks Advisor
Ike Evans
Former Executive Chairman of
the Board, Chief Executive
Officer and President
Meritor
Thomas Pajonas
Executive Vice President and President, Industrial
Product Division Flowserve Corp.
Lloyd Trotter
Managing Partner GenNx360 Capital
Partners
Rodger Boehm
Retired Senior Partner McKinsey & Company, Inc.
Appointed December 2017
Appointed Nov. 17
Financial
Jan Bertsch
Senior Vice President and Chief Financial Officer
Owens-Illinois, Inc.
William Lyons
Retired Chief Financial
Officer
CONSOL Energy Inc.
and CNX Gas Corp.
13

| Proprietary © Meritor, Inc. 2017 Proprietary © Meritor, Inc. 2017
Americas
Business Overview
Chris Villavarayan
Senior Vice President and President, Americas

| Proprietary © Meritor, Inc. 2017
Technology
Products
Investing for Growth
15
Speed to market
• Target to increase by 50% over next three years
• Simulation (integrated computational engineering)
used at every step of product development process
• More simulation = less testing = speed to market
Product reliability
• Three new state-of-the-art dynos
Launched multiple new products in FY17 for various applications
Growing share with existing customers and entering adjacent markets

| Proprietary © Meritor, Inc. 2017
Market Leading Position in Rear Axles
Efficiency improvement up to 1.5% over
current 14X
30 lbs. weight savings
OEM Meritor 14X HE Axle
Databook Position
Optional
Optional
Optional (March 2018)
14X HE – The Industry Benchmark in High
Efficiency Tandem Drive Axles
17X EVO – Designed to Meet the Needs of
Increased Fuel Efficiency
Meritor solution for industry trend toward
downsped powertrains
15 lbs. weight savings versus existing 6x2
OEM Meritor 17X EVO
Databook Position
Optional
Optional
7 out of 10
Class 8
fleets spec
Meritor
16

| Proprietary © Meritor, Inc. 2017
Trend toward medium duty trucks that require
less maintenance with higher fuel economy
Successfully launched for International
DuraStar trucks and IC Bus
Reduced weight by 59 lbs. compared to 14X
OEM Meritor 13X Axle
Databook Position
Standard
13X Axle Optimized for Medium-Duty Market
RPL35 Driveline Capable of
Handling Increased Torque
RPL35 family meets high torque requirements,
reduces operating costs and outlives warranty
Demand increasing significantly as OEMs
transition to direct transmissions with faster axle
ratios <2.47
OEM Meritor RPL35
Databook Position
Standard (for super fast ratios)
Standard (for super fast ratios)
Growing in Core Product Categories
17

| Proprietary © Meritor, Inc. 2017
MFS+ Integrated Axle and Brake Offering
First to market with integrated air disc brake torque
plate into steer axle
Reduced weight by up to 85 lbs.
OEM Meritor MFS+ Axle
Databook Position
Standard
Optional (May 2018)
Optional (July 2018)
18
Lightest truck brake in North America, superior reliability
and improved braking performance
Air disc brake adoption accelerating
OEM Meritor EX+L ADB
Databook Position
Standard
(April 2018)
Optional
Optional
EX+L Air Disc Brake Market and Share Growth
Growing in Core Product Categories
Awarded standard position on Freightliner Cascadia

| Proprietary © Meritor, Inc. 2017
Completed Long-Term Agreement
Extended through 2022
Secures positions with our largest North American OEM
• Standard: Brakes, automatic slack adjusters and drivelines
• Optional: Rear and front axles
19
$20M
incremental
revenue
per year (1)
1. Based on management’s current planning assumptions and other factors. Actual results may differ materially from projections as a result of risks and uncertainties. See slide “Forward Looking Statements.”

| Proprietary © Meritor, Inc. 2017
Focus on Strategic Markets Product Spotlight
Rail Car Mover
Expanding product
coverage with new
strategic customers
P600 Tridem
Best-in-class capacity
Defense and Specialty
Specialty gear boxes
Fabco Related
Expanding Off-Highway and Specialty
20
79000 Series Axle
Designed for aggressive
regenerative torques
Rail Car and Crane
Planetary Axles
Multiple versions for
complete axle coverage
Heavy Haul
Growing product portfolio with
existing on-highway OEMs
RT Crane
Working to integrate new
products with existing customers
Transfer Case
for Navistar and
GM Class 4 and
5 Program

| Proprietary © Meritor, Inc. 2017
Focus on Strategic Markets Competitive Advantages
Industrial
and Gear Box
Manufacturers
Vertical Integration
Capability to forge, machine and heat
treat – shortening supply chain and
reducing total manufacturing costs
Technology
Near-net forging shortens machine
cycle time, reduces raw material
weight and improves machine capacity
Meritor Production System
Proven foundation of on-time delivery,
high quality and world-class safety
Increasing Components Offering
21
Off-Highway
Construction
and Agriculture
Aftermarket
Loose gearing

| Proprietary © Meritor, Inc. 2017
M2019 Remaining Focus
Grow the Core
Capture growing air disc brake market
in North America
Grow medium duty axle share
Strengthen driveline position with
leading products designed for downspeeding
Expand to New Markets
Expand off-highway and specialty business
Accelerate components growth
Leverage global product development to shape the
future of conventional and electrified powertrains
Expand regional customer relationships
to new markets
22
Gross
Pipeline
Remaining(1)
M2019
New
Business
M2016
Programs $220M
$160M
$165M
1. Based on management’s estimates
Americas

| Proprietary © Meritor, Inc. 2017 Proprietary © Meritor, Inc. 2017
International
Business Overview
Joe Plomin
Senior Vice President and President, International

| Proprietary © Meritor, Inc. 2017 24
0
0.5
1
1.5
2
2.5
3
3.5
4
4.5
5
177 17X 17X EVO
17X HE
4.7
3.7 3.4
3.0
40
42
44
46
48
50
52
177 17X EVO 17X HE
44
50
52
Leading European Supplier of High-Efficiency Drivetrain Products
17X Axle
Product Evolution to High Efficiency
Improved
Efficiency
Gross Combination
Weight Increase
GC
W (
To
n)
Po
we
r L
oss (
kW
)
Axle Type
Axle Type
17X HE with EX air disc brake
0
10
20
30
40
50
60
70
80
90
EX+ H EX+ L Centum
88
77 68
Weight
Reduction
Brake Type
LTA
extended
through
2024
LTA
extended
through
2020
Weig
ht (lb
s)
EX Air Disc Brake
24

| Proprietary © Meritor, Inc. 2017
Expanding Product Platforms to Grow Customer Base
Global Hub Reduction Program 610 Hub
Reduction
incorporated
into new XF
vocational truck
Mature market products used as building block for global product offerings
Leverage scale, customization in region and Meritor Production System
25

| Proprietary © Meritor, Inc. 2017
Growing India Business
Research and development center in Bangalore
serves as global center of excellence
Knowledge transfer into local market
26
Axle Share
Brake Share
Technology Hub
Strong position with Ashok Leyland
Growing with every major OEM
Expanding Market Presence
25%
29% 31% 31%
FY14 FY15 FY16 FY17
(1)
(1)
1. Based on management estimates and 3rd party market analysis

| Proprietary © Meritor, Inc. 2017
Key India Business Wins
27
On-Highway
Volvo Eicher
MT-148 Axle
Volvo Thailand
MS-160 Axle
Q+ Air Disc Brakes
Military
Ashok Leyland
11X Variant
AL/VFJ
6x6 Axle
Off-Highway
BEML
Wheel Loader Axle
JCB
Motor Grader Axle
Guru
100 HP
Motor Grader
5.5T
Wheel Loader
MPV

| Proprietary © Meritor, Inc. 2017
Products Designed to Address Shifting China Market Dynamics
DuaLite Series™ Mid-Tier Market Shift
Introduced in 2016
Broad axle and brake product range
Specifically designed for China market
Premium
(1%)
Mass Market
(76%)
-2%
Mid-tier
(18%) 8%
1-2%
Low-tier
(5%) -10%
CAGR
Weight
80
% 55%
20%
15%
10%
15%
20%
50%
15%
2016 2025 % H
MD
Tru
cks in
Op
era
tion
Individual Operators
Small/Medium Fleets
Platforms
Large Fleets
Shift to Large Fleets and
Fleet-Like Platforms(2)
(lbs.)
Tandem Axle
28 1. Estimated 2009 to 2020 growth CAGR.
2. Based on management’s estimates and third-party market analysis for non-captive China axle, driveline and brake markets.
1400
1450
1500
1550
1600
1650
1700
1750
1800
Competitor A Competitor B Competitor C Meritor 166 Meritor 156
(1)

| Proprietary © Meritor, Inc. 2017
Continue advancements in European
core axle and brake products to drive
growth
Transfer of mature market technology
into India/China creating opportunities
as local requirements increase
China transition to consumption
economy is positively changing
purchase behavior towards Total
Cost of Ownership
Investments in high-performance
operations
M2019 Remaining Focus
International
Gross
Pipeline
Remaining(1)
M2019
New
Business
M2016
Programs $120M
$65M
$180M
1. Based on management’s estimates
29

| Proprietary © Meritor, Inc. 2017 Proprietary © Meritor, Inc. 2017
Aftermarket & Trailer
Business Overview
Rob Speed
Senior Vice President and President, Aftermarket
& Trailer and Chief Procurement Officer

| Proprietary © Meritor, Inc. 2017
Creating a Customer-Focused Aftermarket Business
31
Customer Preferences
Customer satisfaction
Improved delivery performance
Ease of doing business
Expanded product portfolio
Offerings at different price points
North America
Customer Preferences
Acceptance and demand for
non-OE products
Increasing expectations on
short lead times
Changing preferences
throughout product lifecycle
Market Dynamic
Consolidation of Independent
Aftermarket (IAM) into large
associated groups
Europe

| Proprietary © Meritor, Inc. 2017
Improving Fill Rate Enhancing Online Presence
Building the Foundation for Growth
32
~60%
92%
Jump-Off Current Long-Term
Goal
24-Hour Fill Rate
95%+
Consistent and predictable
performance
High fill rates drive improvements
in B2C fulfillment
Improved up-time for end fleet
customers
Expanded customer care hours
Launched MeritorPartsXpress.com
in April 2017
Largest parts distribution center
(PDC) in Kentucky with regional
centers in Canada and Mexico
PDC in California established
in October 2017
• Serving 13 western-most states
• Stocking over 4,000 SKUs to fill
majority of customers’ needs
• Improving lead time by 10+ days –
now 24 hours
Expanding PDC Footprint

| Proprietary © Meritor, Inc. 2017
Building the Foundation for Growth
33
Rationalized Product Portfolio New Value Brand
Launched in September 2017
Offers fleets and end-users quality parts at lower
prices, designed and engineered to industry standards
Products match the lifecycle stage of their equipment
Leverage warranty, sales, service and customer care
teams
Developed product strategies with a clear value
proposition, right to play and significant opportunity for
growth
Expanded suspension portfolio to focus on additional
areas of opportunity
• OE genuine and value lines
• Increased part availability by ~50% to 3,000+ SKUs

| Proprietary © Meritor, Inc. 2017
Capitalizing on Major Opportunities for Profitability in Europe
34
Offering multiple products for various price points
• Launched Meritor OE equivalent friction pads
in late 2016
Broadening portfolio across vehicle applications
Optimizing supply chain solutions
Expanding Friction Portfolio
Reman air disc brakes are preferred solution for
vehicles in price sensitive life cycle stage
Centralized reman in Czech Republic during 2016 to
proactively address competition
Executing additional cost reduction programs to
further optimize product
Optimizing Reman Caliper Costs

| Proprietary © Meritor, Inc. 2017
Supporting Trailer Customers’ Needs for Greater Efficiency
35
Market Drivers
Cost and value driven
Weight savings in specific segments
“Great Recession” replacement demand
expected to produce strong market
through 2019
Higher service level expectations in
niche vocational market
Fleet requirements for efficiency gains

| Proprietary © Meritor, Inc. 2017
Released MTec6 in April 2017
Lightest axle in the industry with 40 lb. weight reduction
MTec6 is also 21% stiffer than a 5” design, which
reduces deflection at the wheels to reduce tire wear
Pursuing Growth in the Trailer Market
Meritor Tire Inflation System (MTIS) is the market
leader in tire inflation on trailers
• Approximately 80% share of tire inflation market
Expected growth from increased focus on efficiency
and cost savings for fleets
Proven Solution for Fuel Efficiency Innovative Design for Reduced Lifecycle Cost
36
6.0”
Outside
Diameter
5.0”
Outside
Diameter

| Proprietary © Meritor, Inc. 2017
M2019 Remaining Focus
Aftermarket and Trailer
37
Capitalize on foundational
investments in footprint
Leverage newly developed
products for vocational markets
Implement strategies to address
gaps in product portfolio
Optimize Aftermarket portfolio globally
Gross
Pipeline
Remaining(1)
M2019 New Business
M2016 Programs $35M $25M
$280M
1. Based on management’s estimates
M2019 Timing
Uncertainty

| Proprietary © Meritor, Inc. 2017 Proprietary © Meritor, Inc. 2017
Financial
Overview
Kevin Nowlan
Senior Vice President & CFO

| Proprietary © Meritor, Inc. 2017
Status
Grow Revenue
Faster than Market (measured from FYE15-FYE19)
Grow Adj. Diluted EPS (measured from FYE15-FYE19)
Reduce Net Debt
to Adj. EBITDA Ratio (measured at end of FYE19)
Management Performance Metrics
>20% (above market)
+$1.25 (Increase
in EPS)
<1.5x (from 2.6x
at FYE15)
Target
On
Track
On
Track
On
Track
39
1. Based on management’s current planning assumptions and other factors. Actual results may differ materially from projections as a result of risks and uncertainties. See slide “Forward Looking Statements.”
2. See Appendix – “Non-GAAP Financial Information”
3. Net Debt to Adjusted EBITDA Ratio: (Total debt – Cash and cash equivalents) / Adjusted EBITDA
(1)
(1) (2)
(1) (2) (3)

| Proprietary © Meritor, Inc. 2017
$205
$40
($45)
Revenue Outperformance Forecast $ Millions
$200
M2016
M2019
Other
Net new business wins account for 80% of projected revenue outperformance
20%
Revenue
Outperformance
$190
$315
40
($45) $220
$160
New Business Wins
Not Yet in P&L
Risk Adjusted M2019
Un-Awarded
FY19
Outlook
FY17
Actual
16% Already Won
Gross
Opportunities
$625
Includes new
wins for
DTNA,
electrification
($65)
4% 10% 6%
$660
1. Based on management’s current planning assumptions and other factors. Actual results may differ materially from projections as a result of risks and uncertainties. See slide “Forward Looking Statements.”
(1)

| Proprietary © Meritor, Inc. 2017
Change in FY19 End Market Outlook
North America Aftermarket Growth South America
North America Class 8 Market Revenue
South America ($150)
North America Aftermarket (45)
North America Class 8 40
Total Revenue Decline due to Markets ($155)
More severe, protracted market downturn vs. what was assumed in original plan FY16 actual market decline versus 1% planned growth negatively impacting
cumulative growth through FY19
Increased revenue due to higher FY19 Class 8 projection
1.0%
2.0%
2.0% 2.0%
-6.4%
4.3%
0.0% 2.0%
FY16 FY17 FY18 FY19
Analyst Day 2015 Current Forecast
7.2%
-0.4%
Cumulative
Growth
Units in 000s
FY13 FY14 FY15 FY16 FY17 FY18 FY19
186
156
61 73 70-80 80-90
Current Forecast Analyst Day 2015
89 70-80 113
143
150-170
FY13 FY14 FY15 FY16 FY17 FY18 FY19
243 281
253 237 260 250 – 270
Current Forecast Analyst Day 2015
328 275-290
260 260-280 260-280
41
$ Millions
(1) (2)
1. Source: Fiscal year actuals based on ACT, LMC Automotive and Anfavea
2. FY18 and FY19 Outlook based on Meritor estimates. Actual results may differ materially from projections as a result of risk and uncertainties. Please see “Forward Looking Statements”.

| Proprietary © Meritor, Inc. 2017
FY16Actual
FY17Actual
FY18Outlook
FY19Outlook
FY19Original Plan
$3,123 $3,147 $3,275 $3,290
$4,100
$76 $200 $375
$660
FY16 - FY19 Revenue Forecast
Cumulative
Revenue
Outperformance
3% 6% 11% 20%
$660M of revenue expansion through 2019 driven by market outperformance
$ Millions
$3,199 $3,347
~$3,650(2)
~$3,950 ~$4,100
Revenue
Outperformance
Baseline
Revenue
~7%
CAGR
1. Based on management’s current planning assumptions and other factors. Actual results may differ materially from projections as a result of risks and uncertainties. See slide “Forward Looking Statements.”
2. Represents midpoint of company’s FY18 guidance of $3.6 billion to $3.7 billion, as communicated in earnings release on November 15, 2017
42
(1)
Original FY19 Plan $4,100
Decline in Markets ~(155)
Currency Translation ~5
Current FY19 Forecast ~$3,950

| Proprietary © Meritor, Inc. 2017
Meritor WABCO JV Earnings Eliminated Incremental Investment
Lower Retiree Medical Benefits Expense Higher Material, Labor & Burden Performance
FY16 - FY19 Key Adjusted EBITDA Contributors
Stronger cumulative
performance since
M2019 launch driving
higher FY19 forecast
Impact of retiree
benefits change
executed in
September 2017
Increased and
accelerated $12M
SG&A and ER&D spend
to support investment in
M2019 and longer-term
growth initiatives
$27M equity earnings
from Meritor WABCO
eliminated due to
divestiture
FY19 OriginalPlan
FY19 CurrentForecast
($10) ($10)
($5)
($23) ($6)
FY17 FY18 FY19
($21)
($33)
Income / (expense)
1.75%
1.50%
1.25%
2.00%
2.00%
1.50%
$ Millions
FY19 OriginalPlan
FY19 CurrentForecast
$27
$0
FY19 OriginalPlan
FY19 CurrentForecast
+ $15M
43
FY19 OriginalPlan
FY19 CurrentForecast
($24)
$15
(1) (2)
1. See Appendix – “Non-GAAP Financial Information”
2. Based on management’s current planning assumptions and other factors. Actual results may differ materially from projections as a result of risks and uncertainties. See slide “Forward Looking Statements.”

| Proprietary © Meritor, Inc. 2017
FY16Actual
FY17Actual
FY18Outlook
FY19Outlook
FY19Original Plan
$327 $347
$400
$455 $470
FY16 - FY19 Adjusted EBITDA Forecast
Original FY19 Plan $470
Conversion on Lower Revenue(4) (27)
Higher Material, Labor & Burden
Performance 15
Incremental SG&A and ER&D Investment (12)
Lower Retiree Medical Benefits Expense 39
Meritor WABCO JV Earnings Eliminated (27)
Other (3)
Current FY19 Forecast $455
Continued Adjusted EBITDA margin expansion in line with original expectations
$ Millions
(3)
10.9%(3)
1. See Appendix – “Non-GAAP Financial Information”
2. Based on management’s current planning assumptions and other factors. Actual results may differ materially from projections as a result of risks and uncertainties. See slide “Forward Looking Statements.”
3. Represents midpoint of company’s FY18 guidance of 10.8% to 11.0% Adjusted EBITDA margin on revenue of $3.6 billion to $3.7 billion, as communicated in earnings release on November 15, 2017
4. Assumed an average 18% conversion on revenue
10.4% 10.2%
11.5% 11.5%
44
(1) (2)

| Proprietary © Meritor, Inc. 2017
Diluted Shares Outstanding
FY19Original
Plan
FY19Current
Forecast
$80
$60
FY16 - FY19 Key Adjusted EPS Contributors
Execution of debt repurchases
in Q4 FY17 and Q1 FY18
FY19Original
Plan
FY19Current
Forecast
95
91
Primarily execution of convertible
debt refinancing in Q4 FY17
4M
Fewer
Shares
$20
Lower
$ Millions
Interest Expense
45
(1) (2)
1. See Appendix – “Non-GAAP Financial Information”
2. Based on management’s current planning assumptions and other factors. Actual results may differ materially from projections as a result of risks and uncertainties. See slide “Forward Looking Statements.”

| Proprietary © Meritor, Inc. 2017 46
Adjusted Diluted EPS Outlook
FY16Actual
FY17Actual
FY18Outlook
RevenueConversion
Performance,Other
FY19Outlook
$1.64
$1.88
$2.30(3)
$2.84
Original FY19 Plan $2.84
Change in Adjusted EBITDA (0.16)
Interest Expense 0.21
Change in Shares Outstanding
(4M) 0.12
Depreciation & Amortization (0.11)
Other (0.06)
Current FY19 Forecast $2.84
$ in millions, except per share amounts
Revenue
Adjusted EBITDA(2) (~11.5%)
Interest Expense
Depreciation & Amortization
Tax Expense (15%)
Other
Adj. Net Income(2)
Adj. Diluted EPS(2) (91M shares)
$ 3,950
455
(60)
(80)
(45)
(11)
$ 259
~$ 2.84
Walk to FY19 Adj. Diluted EPS(2) Target
1. Based on management’s current planning assumptions and other factors. Actual results may differ materially from projections as a result of risks and uncertainties. See slide “Forward Looking Statements.”
2. See Appendix – “Non-GAAP Financial Information”
3. Represents midpoint of company’s FY18 guidance of $2.20 to $2.40 Adj. Diluted EPS from Continuing Operations, as communicated in earnings release on November 15, 2017 46
(1) (2)

| Proprietary © Meritor, Inc. 2017 47
(2)
(1)
Capital Allocation Priorities
Maintain Strong
Liquidity
Liquidity of ~20% of sales
Limited debt maturities over the next 6 years
Achieve Target
Leverage
S&P upgrade to ‘BB-’ with positive outlook
Target ‘BB’ credit metrics and Net Debt ratio <1.5x(2)(3)
De-Risk Retiree
Obligations
$419M reduction in net retirement liabilities
Significantly reduced pension and OPEB cash
payments forecast through 2019
Return Value to
Shareholders
Repurchased 8.7M shares in 2016
Dilutive share reduction of 5.1M shares(4) from
repurchase of 7.875% convertible notes
Support
Strategic
Growth
Fabco transaction in 2017
Increased focus on investing in growth opportunities FY16Actual
FY17Actual
FY18Outlook
FY19Outlook
$111
$81
>$100
$ Millions
Consistent free cash flow generation provides funding for strategic
growth initiatives and opportunistically returning value to shareholders
$90 -
$100 On
Track
Complete
Complete
Focus
Area
1. Based on management’s current planning assumptions and other factors. Actual results may differ materially from projections as a result of risks and uncertainties. See slide “Forward Looking Statements.”
2. See Appendix – “Non-GAAP Financial Information”
3. Net Debt to Adjusted EBITDA Ratio: (Total debt – Cash and cash equivalents) / Adjusted EBITDA
4. Assumes share price of $25
Convertible Refi
Opportunistic
47
Free Cash Flow(2) Focus Area Comment
(1)

| Proprietary © Meritor, Inc. 2017
Debt Ratios Leverage Summary
FY16 - FY19 Debt to Adjusted EBITDA Forecast
On track to achieve M2019 Net Debt to Adjusted EBITDA target of 1.5x
FY16 Actual FY17 Actual FY18 Outlook FY19 Outlook
$996 $1,038
$786 $764
$607
$188
$147 $106
Gross Debt Pension and OPEB
$1,603
$1,226
$933 $870
$ Millions
48
(1) (2)
1. Based on management’s current planning assumptions and other factors. Actual results may differ materially from projections as a result of risks and uncertainties. See slide “Forward Looking Statements.”
2. See Appendix – “Non-GAAP Financial Information”
3. Net Debt to Adjusted EBITDA Ratio: (Total debt – Cash and cash equivalents) / Adjusted EBITDA
3.0x 3.0x
2.0x
1.7x
2.6x 2.7x
1.8x
1.5x
FY16 Actual FY17 Actual FY18 Outlook FY19 Outlook
Gross Debt to Adj EBITDA Net Debt to Adj EBITDA(2) (2)(3)

| Proprietary © Meritor, Inc. 2017 Proprietary © Meritor, Inc. 2017
Jay Craig
CEO & President

| Proprietary © Meritor, Inc. 2017
Exploring Current State and Anticipated Growth
China is leading the world, all other regions are still nascent
50
30
10
0 # o
f E
lec
tric
Ve
hic
les in
20
16
(0
00
)
20
China
Bus
(~42%)
China
Truck
(~4%)
North America
Bus
(~4%)
North America
Truck
(<1%)
Europe
Bus
(4%)
Europe
Truck
(<1%)
Rest of
World
(<0.1%)
Electrification Has Already Begun
40

| Proprietary © Meritor, Inc. 2017
Hybrid and Battery Electric Commercial Vehicles Growing in Popularity
Today’s Drivers
51
Future Driver
Customers New OEs and eSuppliers Regional
100,000+ electric CVs
produced in China last year
Landscape is
changing
OEs are investing in
electric buses and trucks
Strong interest in
eTrucks from fleets

| Proprietary © Meritor, Inc. 2017 Proprietary © Meritor, Inc. 2017

| Proprietary © Meritor, Inc. 2017
Infrastructure, standardization and diesel prices will impact timing
Projected Decline in Battery Costs will Drive Increased Demand
53

| Proprietary © Meritor, Inc. 2017
Meritor Capabilities Support Trend Toward Electrification
54
Axle Solutions
Precision Gearing
Brake Technology
Suspensions
eAxles integrate electric motor
into differential or wheel-ends
Reduces weight, cost
and space required
Lead industry for high efficiency, power
density gear design and manufacturing
EVs require 2-3X more gearing content
to enable optimized EV performance
Investment ongoing to expand
capabilities
eBrakes optimized for electric
vehicles with regenerative
braking
Air and hydraulic brake
platforms with lower weight,
cost and better packaging
Protec independent
suspensions for medium- and
heavy-duty applications
eCarrier or in-wheel motor
solutions for independent
suspension EVs

| Proprietary © Meritor, Inc. 2017
Growing Expertise with TransPower Investment
Transaction closed on Nov. 20, 2017
Allows for 50 percent equity stake over time upon certain milestones
Global leader in electric vehicle technologies for large commercial vehicles
Provides scalable, modular drive train, power and battery storage technology
Technologies adaptable to many applications
Partnerships with Navistar and Peterbilt
TransPower Core Competencies
Meritor Core Competencies
Commercial relationships
Product manufacturing
Sales/service network
Software/controls
EV and hybrid products
On-Road electrification experience
Full capabilities for advanced electrification solutions
55
$30M
in FY19
Revenue(1)
1. Based on management’s current planning assumptions and other factors. Actual results may differ materially from projections as a result of risks and uncertainties. See slide “Forward Looking Statements.”

| Proprietary © Meritor, Inc. 2017
Capabilities Provide a Full-Suite of Solutions
56
Remote-Mount Motor
Meritor gearboxes have multiple sets
of high-precision planetary gears
Dri
ve
lin
e
Front Axle
Battery Pack
Rear
Axle
Separate Motor
Separate
Gearbox
Bra
ke
Bra
ke
Bra
ke
P
ow
er
Ele
ctr
on
ics
So
ftw
are
an
d
co
ntr
ols
Ele
ctr
ifie
d
Ac
ce
ss
ory
Mo
du
le
Bra
ke
Suspension
Suspension
Two Motors
Meritor in-wheel eAxles have two sets
of planetary gears per wheel-end
v
Mo
tor
Bra
ke
Bra
ke
Battery Pack
Po
we
r
Ele
ctr
on
ics
So
ftw
are
an
d
co
ntr
ols
Electrified
Accessory
Module
Bra
ke
Bra
ke
Independent
Suspension
Independent
Suspension
Mo
tor
Ge
ari
ng
Ge
ari
ng
One Motor
Meritor eAxles have a shiftable planetary
gearset plus conventional bevel and diff gears
Front Axle
Rear
Axle
Integrated Motor
Integrated
Gearing
Bra
ke
Bra
ke
Bra
ke
Bra
ke
Battery Pack
Po
we
r
Ele
ctr
on
ics
So
ftw
are
an
d
co
ntr
ols
Suspension
Suspension
Electrified
Accessory
Module
Current
core
content
Expanding
core
capabilities
Expanding
through
partnership

| Proprietary © Meritor, Inc. 2017 57
Electrification Video

| Proprietary © Meritor, Inc. 2017
Capabilities Provide a Full-Suite of Solutions
58
Remote-Mount Motor
Meritor gearboxes have multiple sets
of high-precision planetary gears
Dri
ve
lin
e
Front Axle
Battery Pack
Rear
Axle
Separate Motor
Separate
Gearbox
Bra
ke
Bra
ke
Bra
ke
P
ow
er
Ele
ctr
on
ics
So
ftw
are
an
d
co
ntr
ols
Ele
ctr
ifie
d
Ac
ce
ss
ory
Mo
du
le
Bra
ke
Suspension
Suspension
Two Motors
Meritor in-wheel eAxles have two sets
of planetary gears per wheel-end
v
Mo
tor
Bra
ke
Bra
ke
Battery Pack
Po
we
r
Ele
ctr
on
ics
So
ftw
are
an
d
co
ntr
ols
Electrified
Accessory
Module
Bra
ke
Bra
ke
Independent
Suspension
Independent
Suspension
Mo
tor
Ge
ari
ng
Ge
ari
ng
One Motor
Meritor eAxles have a shiftable planetary
gearset plus conventional bevel and diff gears
Front Axle
Rear
Axle
Integrated Motor
Integrated
Gearing
Bra
ke
Bra
ke
Bra
ke
Bra
ke
Battery Pack
Po
we
r
Ele
ctr
on
ics
So
ftw
are
an
d
co
ntr
ols
Suspension
Suspension
Electrified
Accessory
Module
Current
core
content
Expanding
core
capabilities
Expanding
through
partnership

| Proprietary © Meritor, Inc. 2017
Run with the Bull
59
Clear Long-Term Strategy Aligned Organization Positioned for Future
Focused on strategic priorities
Accelerating performance
Delivering results
M2016 built the foundation
for growth
M2019 accelerates growth
and earnings platform
Global product platforms
Long-term agreements with
strategic customers
Electrification solutions
Emerging markets

| Proprietary © Meritor, Inc. 2017 Proprietary © Meritor, Inc. 2017
Q & A

| Proprietary © Meritor, Inc. 2017 Proprietary © Meritor, Inc. 2017
Appendix

| Proprietary © Meritor, Inc. 2017
Non-GAAP Financial Information
62
In addition to the results reported in accordance with accounting principles generally accepted in the United States (“GAAP”), we have provided information regarding non-GAAP financial measures. These non-
GAAP financial measures include Adjusted income (loss) from continuing operations attributable to the company, Adjusted diluted earnings (loss) per share from continuing operations, Adjusted EBITDA, Adjusted
EBITDA margin, Segment adjusted EBITDA, Segment adjusted EBITDA margin, Free cash flow and Net debt.
Adjusted income (loss) from continuing operations attributable to the company and Adjusted diluted earnings (loss) per share from continuing operations are defined as reported income (loss) from continuing
operations and reported diluted earnings (loss) per share from continuing operations before restructuring expenses, asset impairment charges, non-cash tax expense related to the use of deferred tax assets in
jurisdictions with net operating loss carry forwards, and other special items as determined by management. Adjusted EBITDA is defined as income (loss) from continuing operations before interest, income taxes,
depreciation and amortization, non-controlling interests in consolidated joint ventures, loss on sale of receivables, restructuring expenses, asset impairment charges and other special items as determined by
management. Adjusted EBITDA margin is defined as Adjusted EBITDA divided by consolidated sales from continuing operations. Segment adjusted EBITDA is defined as income (loss) from continuing operations
before interest expense, income taxes, depreciation and amortization, noncontrolling interests in consolidated joint ventures, loss on sale of receivables, restructuring expense, asset impairment charges and other
special items as determined by management. Segment adjusted EBITDA excludes unallocated legacy and corporate expense (income), net. Segment adjusted EBITDA margin is defined as Segment adjusted
EBITDA divided by consolidated sales from continuing operations, either in the aggregate or by segment as applicable. Free cash flow is defined as cash flows provided by (used for) operating activities less capital
expenditures. Net debt is defined as total debt less cash and cash equivalents.
Management believes these non-GAAP financial measures are useful to both management and investors in their analysis of the company's financial position and results of operations. In particular, Adjusted
EBITDA, Adjusted EBITDA margin, Segment adjusted EBITDA, Segment adjusted EBITDA margin, Adjusted income (loss) from continuing operations attributable to the company and Adjusted diluted earnings (loss)
per share from continuing operations are meaningful measures of performance to investors as they are commonly utilized to analyze financial performance in our industry, perform analytical comparisons, benchmark
performance between periods and measure our performance against externally communicated targets.
Free cash flow is used by investors and management to analyze our ability to service and repay debt and return value directly to shareholders. Net debt over Adjusted EBITDA is a specific financial measure in our
current M2019 plan used to measure the company’s leverage in order to assist management in its assessment of appropriate allocation of capital.
Management uses the aforementioned non-GAAP financial measures for planning and forecasting purposes, and Segment adjusted EBITDA is also used as the primary basis for the CODM to evaluate the
performance of each of our reportable segments.
Our Board of Directors uses Adjusted EBITDA margin, Free cash flow, Adjusted diluted earnings (loss) per share from continuing operations and Net debt over Adjusted EBITDA as key metrics to determine
management’s performance under our performance-based compensation plans.
Adjusted income (loss) from continuing operations attributable to the company, Adjusted diluted earnings (loss) per share from continuing operations, Adjusted EBITDA, Adjusted EBITDA margin, Segment adjusted
EBITDA and Segment adjusted EBITDA margin should not be considered a substitute for the reported results prepared in accordance with GAAP and should not be considered as an alternative to net income as an
indicator of our financial performance. Free cash flow should not be considered a substitute for cash provided by (used for) operating activities, or other cash flow statement data prepared in accordance with GAAP,
or as a measure of financial position or liquidity. In addition, this non-GAAP cash flow measure does not reflect cash used to repay debt or cash received from the divestitures of businesses or sales of other assets
and thus does not reflect funds available for investment or other discretionary uses. Net debt should not be considered a substitute for total debt as reported on the balance sheet. These non-GAAP financial
measures, as determined and presented by the company, may not be comparable to related or similarly titled measures reported by other companies. Set forth below are reconciliations of these non-GAAP financial
measures to the most directly comparable financial measures calculated in accordance with GAAP.

| Proprietary © Meritor, Inc. 2017
Non-GAAP Financial Information
1. Represents tax expense related to the use of deferred tax assets in jurisdictions with net operating loss carry forwards
2. The twelve months ended September 30, 2017 includes non-cash income tax benefit (expense) of $52M related to the partial reversal of the U.S. valuation allowance, $15M related to capital losses associated with the sale of equity
investment, and $1M related to other correlated tax relief. The twelve months ended September 30, 2016 includes non-cash income tax benefit (expense) of $438M related to the partial reversal of the U.S. valuation allowance, ($9M)
related to the establishment of a valuation allowance in Brazil and $25M related to other correlated tax relief.
3. The twelve months ended September 30, 2017 includes $89M of income tax expense related to the gain on sale of equity investment, $14M of income tax benefit related to the loss on debt extinguishment, and $1M of income tax benefits
related to other adjustments
4. The twelve months ended September 30, 2015 have been recast to reflect non-cash tax expense
63
Adjusted Income from Continuing Operations Reconciliation(in millions, except per share amounts)
2017 2016 2015(4)
Income from Continuing Operations Attributable to the Company $ 325 $ 577 $ 65
Adjustments:
Restructuring costs 6 16 16
Non-cash tax expense(1) 37 13 4
Gain on sale of equity investment (243) - -
Asset impairment charges, net of noncontrolling interests 3 - 2
Loss on debt extinguishment 36 - 24
Goodwill impairment charges - - 15
Pension settlement losses - - 59
Tax valuation allowance reversal, net and other(2) (68) (454) (16)
Income tax epense (benefit)(3) 74 (1) (10)
Adjusted Income From Continuing Operations Attributable to the Company $ 170 $ 151 $ 159
Diluted Earnings Per Share From Continuing Operations $ 3.60 $ 6.27 $ 0.65
Impact of Adjustments on Diluted Earnings Per Share (1.72) (4.63) 0.94
Adjusted Diluted Earnings Per Share From Continuing Operations $ 1.88 $ 1.64 $ 1.59
Diluted Shares Outstanding 90.2 92.0 100.1
Twelve Months Ended
September 30,

| Proprietary © Meritor, Inc. 2017
Non-GAAP Financial Information
1. Adjusted EBITDA margin equals Adjusted EBITDA divided by consolidated sales from Con Ops
2. The twelve months ended September 30, 2013 has been recast for discontinued operations
(In millions)
2017 2016 2013 (2)
Net Income (Loss) Attributable to Meritor, Inc. $324 $573 ($22)
Loss from Discontinued Operations 1 4 7
Income (Loss) From Con Ops Attributable to Meritor, Inc. $325 $577 ($15)
Interest Expense, Net 119 84 126
Provision (Benefit) for Income Taxes 52 (424) 64
Depreciation and Amortization 75 67 67
Noncontrolling Interests 4 2 2
Loss on Sale of Receivables 5 5 6
Restructuring Costs 6 16 23
Pension settlement losses - - 109
Gain on Sale of Equity Investment (243) - (125)
Asset Impairment Charges 4 - -
Specific Warranty Contingency, Net of Supplier Recovery - - 7
Adjusted EBITDA $347 $327 $264
Adjusted EBITDA Margin(1) 10.4% 10.2% 7.2%
Twelve Months Ended
September 30,
64

| Proprietary © Meritor, Inc. 2017
Non-GAAP Financial Information
Free Cash Flow Reconciliation(in millions)
2016
Cash provided by operating activities $ 176 $ 204
Capital expenditures (95) (93)
Free cash flow $ 81 $ 111
Tweleve Months
Ended
September 30,
2017
65

| Proprietary © Meritor, Inc. 2017
Non-GAAP Financial Information
1. Net Debt to Adjusted EBITDA Ratio: (Total debt – Cash and cash equivalents) / Adjusted EBITDA
2. On November 2, 2017, we redeemed the remaining $175 million aggregate principal amount outstanding of the 6.75 percent notes
Net Debt to Adjusted EBITDA(in millions)
2017 2016 2015
Short-term debt (2) $ 288 $ 14 $ 15
Long-term debt 750 982 1,036
Total debt $ 1,038 $ 996 $ 1,051
Less: Cash and cash equivalents (88) (160) (193)
Net debt $ 950 $ 836 $ 858
Adjusted EBITDA $ 347 $ 327 $ 334
Net Debt to Adjusted EBITDA (1)
2.7 2.6 2.6
As of September 30,
and for the Twelve Months Ending September 30,
66

| Proprietary © Meritor, Inc. 2017
Non-GAAP Financial Information
1. Amounts are approximate
2. Based on management’s planning assumptions and other factors. Actual results may differ materially from projections as a result of risks and uncertainties. Please see “Forward Looking Statements.”
67
(In millions, except per share amounts)
Net Income attributable to Meritor, Inc. $ ~210 $ 160 - 180
Loss from Discontinued Operations - -
Income from Continuing Operations Attributable to Meritor, Inc. $ ~210 $ 160 - 180
Interest Expense, Net ~60 60 - 70
Provision for Income Taxes ~95 70 - 80
Depreciation and Amortization ~80 ~80
Restructuring ~5 ~5
Other (noncontrolling interests, loss on sale of receivables, etc.) ~5 ~10
Adjusted EBITDA $ ~455 $ 385 - 405
Sales $ ~$3,950 $ 3,600 - 3,700
Adjusted EBITDA Margin(1) ~11.5% 10.8% - 11.0%
Diluted earnings per share from Continuing Operations $ ~2.30 $ 1.75 - 1.95
Adjustments:
Restructuring Costs ~0.04 ~0.05
Non-Cash tax expense ~0.50 ~0.40
Adjusted diluted earnings per share from Continuing Operations $ ~2.84 $ 2.20 - 2.40
Diluted average common shares outstanding 91.0 92.0
2018
Fiscal Year Outlook (1)(2)
2019

| Proprietary © Meritor, Inc. 2017
Non-GAAP Financial Information
68
1. Net Debt to Adjusted EBITDA Ratio: (Total debt – Cash and cash equivalents) / Adjusted EBITDA
2. Based on management’s planning assumptions and other factors. Actual results may differ materially from projections as a result of risks and uncertainties. Please see “Forward Looking Statements.”
(in millions)
2019 2018
Total debt $ 764 $ 786
Less: Cash and cash equivalents (104) (86)
Net debt $ 660 $ 700
Adjusted EBITDA $ 455 $ 400
Net Debt to Adjusted EBITDA (1)
1.5 1.8
Fiscal Year Outlook(2)

| Proprietary © Meritor, Inc. 2017
Non-GAAP Financial Information
1. Amounts are approximate
2. Based on management’s planning assumptions and other factors. Actual results may differ materially from projections as a result of risks and uncertainties. Please see “Forward Looking Statements.”
(In millions)
Free Cash Flow:
Cash provided by operating activities $ >200 $ 190 - 200
Capital expenditures ~(100) ~(100)
Free cash flow
$ >100
$ 90 - 100
20182019
Fiscal Year Outlook (1)(2)
69

| Proprietary © Meritor, Inc. 2017 70