1 and ivan zilic2, “finei’ll do it myself”: lessons from
TRANSCRIPT

Stjepan Srhoj1 and Ivan Zilic2,*
“Fine...I’ll do it myself”: Lessons from self-employment grants in a long recession period
AbstractThis paper evaluates the effect of a self-employment grant scheme for unemployed individuals—designed to ease the first 12 months of business operation—on firm growth, survival, and labor market reintegration in Croatia in the 2010–2017 period. Grants offered a moderate amount of finances (up to 50% of average annual gross salary) and absorbed only 5% of funds allocated to active labor market policies (ALMPs), but accounted for 10% of new firms opened throughout the years. We contribute to the literature on self-employment grants with several novel findings. Exploiting the longitudinal structure of the unemploy-ment episodes dataset, we find that individuals who finish their spell with a grant have a sig-nificantly lower probability of returning to unemployment. The policy is particularly effective for individuals who would have otherwise had labor market opportunities (men, more edu-cated, prime-age workers, previously employed), individuals who became unemployed after inactivity and lost their job due to a firm’s closure—which demonstrates that self-employment subsidies can be effective in ameliorating unemployment. However, the policy was not effec-tive for longer unemployed individuals. At the firm level, we find descriptive evidence that limited liability firms opened via a grant have lower growth potential and worse survival profile, while unlimited liability firms—even though a sizable portion of them closes after a required 12-month grant period—have a more favorable survival profile. Finally, we also find that the effectiveness of these grants has increased throughout the years, indicating toward the direction of institutional learning.
Current version: April 23, 2021Keywords: self-employment grant, evaluation, unemployment, firm performanceJEL codes: J68, M13, H25, H43Corresponding author: Ivan Zilic [email protected]
Srhoj and Zilic. IZA Journal of Labor Policy (2021) 11:6
© The Author(s). 2021 Open Access This article is distributed under the terms of the Creative Commons Attribution 4.0 International License (http://creativecommons.org/licenses/by/4.0/), which permits unrestricted use, distribution, and reproduction in any medium, provided you give appropriate credit to the original author(s) and the source, provide a link to the Creative Commons license, and indicate if changes were made.
Cite as: Zilic. IZA Journal of Labor Policy (2021) 11:6.https://doi.org/10.2478/izajolp-2021-0006
1 Department of Economics and Business, University of Dubrovnik Lapadska obala 7, 20000 Dubrovnik, Croatia. E-mail: [email protected]
2 Research Associate The Institute of Economics, Zagreb Trg J. F. Kennedyja 7, 10000 Zagreb, Croatia; South East Europe Research Unit, European Institute London School of Economics and Political Science Houghton Street, WC2A 2AE, London, UK

Page 2 of 32 Srhoj and Zilic. IZA Journal of Labor Policy (2021) 11:6
1 IntroductionEntrepreneurship is the backbone of economic growth and development, and governmental policies can spur but also limit entrepreneurship momentum and activities (e.g., Bornhäll et al., 2015; Henrekson, 2005). To design policies that facilitate entrepreneurial behavior one must understand the heterogeneity of different entrepreneurship motives, processes, and out-comes, especially during an economic downturn (e.g., Peric and Vitezic, 2016). The reasoning behind startups is often divided into two types of motives: the push and the pull factors [for an overview, see Simoes et al. (2016)]. Push factors encompass poor job prospects like unemploy-ment, limited work flexibility, or termination of unemployment benefits, which steer the deci-sion toward self-employment, while pull factors encompass reasons such as wanting to be one’s boss or perceiving a business and/or lifestyle opportunity that directs an individual toward self-employment (Caliendo and Kritikos, 2010).
The past decade, with the experience of a deep recession, has provided a plethora of push factors materialized as high unemployment and all of the adverse ramifications that unem-ployment brings. Therefore, governments around the world spend considerable funds to tackle unemployment with traditional active labor market policies (ALMPs), such as job creation, training, and salary subsidies. For example, according to Eurostat, European Union (EU) member states spent almost 2% of their combined gross domestic product (GDP) in 2013 to support unemployed individuals to get paid jobs.1 However, the effectiveness of these policies has been questioned as they yield ambiguous results [see, for example, Card et al. (2010, 2017)].
Recently, a complementary measure to the traditional ALMPs—self-employment grants for unemployed individuals—has become increasingly popular. These grants aim to support unemployed individuals to start their firms, thus “turning unemployment into employment” (Caliendo, 2016), and are maybe particularly interesting for underpaid individuals, as well as for individuals with limited employment opportunities (less educated, minorities, youths, and individuals with depreciated skills) [see, for example, Caliendo (2016) and Dvouletý and Lukeš (2016)]. Grants for self-employment are also attractive to policymakers as self-employment that might directly decrease unemployment and also indirectly decrease unemployment via entre-preneurs’ potential hiring (so-called double dividend), thus giving the self-employment grant not only a social but also a growth role.
Previous research, mostly on developed countries, has shown that self-employment grants are a successful avenue of labor market integration, but that firms opened through self-employment grants have lower growth potential.2 Heterogeneous effects show that they are most effective for individuals who would otherwise have no employment options, namely, less educated, younger individuals, and women (Caliendo and Künn, 2011, 2015).
However, following the arguments from Shane (2009), decreasing the entry barriers into entrepreneurship is not necessarily a good public policy as it decreases the quality of entrants (Conti and Roche, 2021; Branstetter et al., 2014). In Portugal, examining the policy reform
1 https://ec.europa.eu/eurostat/web/labour-market/labour-market-policy/database2 For example, analyzing firm survival Andersson and Wadensjö (2007), Désiage et al. (2010), and Caliendo (2016)
show a significant and positive effect; while Caliendo and Künn (2011) and Wolff and Nivorozhkin (2012) also show positive labor market integration effects. However, Désiage et al. (2010) and Caliendo et al. (2015) found no significant effects of self-employment grants on employment growth, turnover growth, value-added, profitability, labor, and capital productivity; and Caliendo (2016) finds an indication of deadweight effect as his results suggest that 40–60% of subsidized firms would have been opened without the grant.

Page 3 of 32 Srhoj and Zilic. IZA Journal of Labor Policy (2021) 11:6
decreasing entry barriers, Branstetter et al. (2014) find a modest positive effect on firm creation and firm employment, but mostly in low technology sectors. In high-technology sectors, Conti and Roche (2021) show that recession induces a reduction in the opportunity costs of starting new ventures and therefore induces pushes into entrepreneurship those individuals who are most likely constrained by the lack of attractive wage work prospects.
This paper contributes to the literature by analyzing self-employment grants for unem-ployed individuals in Croatia in the period 2010–2017. The grant scheme was designed to ease the initial phase of a business startup by financing salaries, contributions, basic work equip-ment, and training and seminars. While the amount of the grant was of moderate magnitude—going up to €4,750 on average in 2017—and the whole grant scheme accounted for only 5% of funds spent on ALMPs, >15,000 grants were awarded, which contributed up to 10% of firm creation within a particular year. Potential users of the measure were unemployed individuals registered at the public unemployment office Croatian Employment Service (CES), and who applied for a grant with a business plan. The public employment office evaluated the busi-ness proposal based on the feasibility of the idea, projected output in terms of employment potential, and unemployment duration of an individual. If awarded the grant, an individual registered a business—in the form of a limited or unlimited liability firm— and had to run it for 12 months, after which they had to file a report on the funds used.
We estimate the effect of the grant receipt on the probability of reentering unemploy-ment by using the universe of unemployment episodes. Exploiting the fact that the dataset contains multiple unemployment spells per individual, we rely on individual fixed effects to control unobserved heterogeneity which affects selection into the grant as well as, arguably, rich episode- and individual-based set of covariates. Multiple estimation models, specifica-tions, and subsamples provide evidence that the self-employment grant significantly reduces the probability of reentering unemployment. Comparing the most comprehensive specification within a particular model with the specification using individual-fixed effects points toward slightly positive selection into the grant (compared with other unemployed people in the data-set) as estimation with individual-fixed effect yields quantitatively smaller effects. Taking into account all of these estimates, we conclude that self-employment grants are an effective mea-sure to combat unemployment.
Recent studies show mixed findings with regard to the long-term effects of policies like the one we study. Sánchez-Cañizares et al. (2020) evaluate public policy which enabled discounted flat rate for self-employed workers in the Autonomous Community of Andalusia (Spain) and find positive effects on firm survival. They find a strong positive effect in the short run, but a diminishing effect over a longer period, with the conclusion that in the long run the effect cannot be guaranteed. On the other hand, Caliendo and Tübbicke (2020) estimate the effect of the German startup subsidy program reform on employment prospects and earnings up to 40 months after receiving the subsidy. They find positive effects of the new program on employ-ment prospects and earnings in the longer term, but this effect is also stronger compared with previous policy design. We can track entrepreneurs’ employment for >60 months after the grant, and we show the effect is long-lasting, along the lines of Caliendo and Tübbicke (2020).
Furthermore, to descriptively document the effect of the self-employment grant on firm performance, we match the dataset on grant recipients with the universe of limited liability firms and find that, on average, firms opened via the self-employment grant exert lower growth

Page 4 of 32 Srhoj and Zilic. IZA Journal of Labor Policy (2021) 11:6
of sales and employment, which is line with the well-documented interpretation of necessity entrepreneurs. In particular, individuals receiving self-employment grants are usually without other employment options (compared with other entrepreneurs), so the growth potential of their business is limited. The survival of these firms, although based on a crude yearly indica-tor, shows a negative significant difference compared with the no-grant counterparts.
However, matching the grant recipient dataset with the universe of unlimited liability firms, we can analyze the survival profile in more detail, and we find that—although a por-tion of firms was closed after the required 12-month grant period expired, which points to the direction of cash and carry effect—firms opened with a grant scheme have a much more favorable survival profile throughout the period. While this evidence is only descriptive, as we do not control for the selection into the grant, the direction of bias, due to the necessity entre-preneurial interpretation (compared with other entrepreneurs), makes these estimates a lower bound of the true effect. Finally, we find compelling evidence that grant scheme is becoming more effective throughout the years, which might come from better selection screening, bet-ter self-selection of candidates, more business opportunities as the economy recovers, and, in general, from institutional learning.
While these results are somewhat in line with other literature on self-employment, we argue that we contribute to the literature in multiple ways. First, self-employment grant assess-ment has been focusing on developed countries, so providing estimates for Croatia—the most recent EU member state, which is less developed than the European core and experienced a particularly deep recession with significant labor market challenges—might generalize previ-ous results and help their external validity. Second, we use unique and, arguably, rich datasets that enable us to use various methods (linear and nonlinear) to document the effect descrip-tively, but also, arguably, causally. Finally, given the socialist heritage of Croatia where the government was the main provider and organizer of economic activity, we also tangentially analyze whether governments can promote self-employment and entrepreneurial behavior in societies where proactive market behavior is not embedded in social norms and culture. The fact that we find clear evidence that there is institutional learning while administrating self-employment grants indicates that this task is indeed feasible.
The paper is structured as follows: in Section 2, we explain the labor market context and self-employment grant in more detail. Section 3 covers the dataset and methods we use, as well as the results. Finally, the paper concludes with the Section 4.
2 Institutional settingThe Republic of Croatia, the most recent EU member state, experienced strong adverse eco-nomic developments during the Great Recession. The recession hit Croatia in 2009 causing a considerable number of private firms to go bankrupt, while many of those surviving faced strong sales decline and overall economic hardship [for more about industry dynamics and firm behavior in Croatia, see Vitezić et al. (2018) and Srhoj et al. (2021)]. The cumulative drop of Croatia’s GDP reached 12% between 2009 and 2014, and the unemployment rate more than doubled (from 8.6% to 17.3%) [for more about the labor market in Croatia, see Botrić (2017) and Nikolic et al. (2017)]. Even after the recession, in the period 2015–2017, the GDP growth was rather modest, not reaching the 2008 pre-recession levels before 2017. While the

Page 5 of 32 Srhoj and Zilic. IZA Journal of Labor Policy (2021) 11:6
unfavorable external economic conditions contributed to Croatia’s economic slowdown, the Great Recession exposed structural problems with the Croatian economy and labor market (Franičević, 2011; Nestić, 2015). To ameliorate these alarming unemployment trends, the Croa-tian government engaged in several ALMPs to tackle the unemployment concerns, notably vocational training for work without commencing employment (Tomić and Zilic, 2020), and among others, the support for unemployed individuals who wanted to start a business and get self-employed.
The key self-employment policy—Your initiative–your workplace—has been active since 2010 as part of the Act on Employment Promotion.3 The main goal of the policy, admin-istrated by the CES, has been to promote self-employment of unemployed individuals by easing the initial phase of a business startup—first 12 months at the market—with a lump sum grant. Beneficiaries of the policy are unemployed individuals registered with the pub-lic employment office (CES) who apply for a self-employment grant.4 The applications are evaluated by CES based on several criteria: being unemployed, various aspects of the busi-ness plan, including the feasibility of the business idea, the estimated number of employees, and the applicants’ duration of unemployment.5 If awarded the grant, which could amount to up to 50% of Croatian average annual gross salary, individuals are obliged to register their proposed business (limited or unlimited liability firm) and remain self-employed for 12 months. After the grant period, users have to submit a report documenting the expenses and performance and in case of any transgressions in the form of closing the business or unjustifiable expenses, the user of the grant is obliged to return the funds plus the interest rate to CES.
The self-employment grant amount, in the period 2010–2013, could have been used exclu-sively to cover the wage costs of a self-employed individual (beneficiaries registering a limited liability firm pay themselves 50% and receive the other 50% of the gross II wage costs from CES, unlimited liability firms received an amount that covered their full cost of contribution).6 Since 2014, the self-employment grants have been given in line with the Commission Regula-tion (EU) No. 1407/2013 of 18 December 2013 on the application of Articles 107 and 108 of the Treaty on the Functioning of the European Union to de minimis aid. Beginning with the year 2014, grants could have been used for other purposes apart from salary costs, including the purchase of machinery, software, materials, and resources needed for doing business, as well as costs of printing promotion materials, web site development, business premises rental, and training related to conducting firm activities. Also, from 2013 onward unemployed individu-als could jointly open an unlimited or limited liability firm. In this way one firm could receive several grants, i.e., a grant for each previously unemployed individual, now entrepreneur, in the new firm. The policy was completely funded from the national budget in the 2010–2014 period, while it was co-funded by the EU from 2015 onward.
3 The measure for financially supporting self-employment out of unemployment is firstly noted in the Act for Employment Promotion 2009/2010. The funds for this measure were allocated from the national budget–division 05025, program 1671, activity A689027.
4 The grant was not available for previous users of ALPMs for self-employment.5 A five-member committee of each regional CES office makes a joint assessment of each application. In 2016, an
assessment form was introduced with 10 areas graded by each committee member based on each of these elements, with the final decision being based on the average overall grade.
6 The awarded funds could be used for wages and contributions, basic work equipment and education, training, and seminars.

Page 6 of 32 Srhoj and Zilic. IZA Journal of Labor Policy (2021) 11:6
There are several insights given in Table 1, which shows descriptive statistics on awarded grants. First, the average amount of the grant is of a moderate magnitude. For example, in 2016 the average amount was €3,415, which is around 4.3 average net salary in Croatia at the time.7 Second, even if the amount was not high, the number of grants was considerable (16,574 in the period 2010–2017). For example, 2,173 grants were available in 2016 compared with the total of 30,989 newly registered limited and unlimited liability firms in 2016, which implies that potentially 7% of newly registered businesses were supported through the self-employment grant.8 Third, there is an increase in the number of grants awarded and the total amount of the grant in the year when Croatia entered the EU, which coincides with the year of local elec-tions in Croatia (2013). From 2012 to 2013, the number of grants increased from 838 to 4,409 (526%), while the total amount increased from €2.2 million to €9.1 million (420%). Finally, the total value of grants subsidizing self-employment in the period 2010–2017 is €53.6 million. For example, in 2016, grants subsidizing self-employment accounted for 5% of the funds spent on ALMPs in Croatia. Existing CES evaluation (HZZ, 2016, p. 42) suggests a strong and positive effect of 38–46 percentage points of self-employment grants on the employment status.
Finally, when registering a business in the Republic of Croatia, individuals decide between two main options—a limited liability firm and an unlimited liability firm (craft). If an unlim-ited liability firm (craft) is opened, an entrepreneur operates as a private individual and is legally responsible for the craft’s potential unpaid costs toward suppliers or unpaid taxes with his/her real estates, movable property, or his/her future wage at a new job. While opening an unlimited liability firm does seem risky, in 2017 about 39.5% of all firms in Croatia were crafts (HOK, 2017). There are several reasons why opening a craft is a desirable option. First, there are lower costs and it is faster to register and close a craft. Second, there is considerably lower taxation if annual revenue is less than approximately €20,000 (until 2015) and €40,000 (since 2015). Third, there is
7 Comparing the grant amount to unemployment benefits can indicate whether potential moral hazard motives into self-employment grants are possible. For example, in 2017, a person with 10 years of work experience could receive unemployment benefits of total value between (roughly) €2,600 and €4,150 a year, depending on the previous wage (http://www.hzz.hr/default.aspx?id=10292), while the mean grant amount in 2017 was €4,749.
8 During the 2010–2017 period a total of 11,132 unlimited liability firms received self-employment grants, with a mean amount of €3,039. In the same period, 4,995 limited liability firms received on average €3,140.
Table 1 Descriptive statistics on self-employment grants (in €)
Year # Grants #New unlim. liab. firms
# New lim. liab. Firms
Mean amount
Median amount
SD of amount
Total amount
2010 282 6,539 19,074 4,061 3,983 491 1,145,2722011 770 7,532 19,947 3,851 3,876 744 2,965,5712012 838 7,372 19,984 2,614 2,467 304 2,190,1322013 4,409 9,641 30,416 2,074 1,930 1,175 9,145,9602014 2,938 7,816 22,168 3,321 3,263 1,038 9,757,1212015 2,649 7,235 21,119 3,398 3,274 643 9,000,3362016 2,162 7,652 23,337 3,415 3,308 809 7,384,1632017 2,526 9,905 6,060* 4,749 4,658 1,269 11,995,409
Note: CES grants, unlimited and limited liability firms database. The monetary units are converted to Euros from Croatian Kuna based on the medium exchange rate on the last day of a particular year given by the Croatian National Bank. The period 2009–2014 was a period of recession in the Republic of Croatia.*The firm-level database is truncated with March 29, 2017.CES, Croatian Employment Service.

Page 7 of 32 Srhoj and Zilic. IZA Journal of Labor Policy (2021) 11:6
simpler financial reporting regulated by the Income Tax Act (OG 177/2004). On the other hand, if an entrepreneur expects an income larger than the legally set threshold, registering a craft would not be the optimal solution due to higher taxation ( Budimir and Aralica, 2013).
3 Empirical analysis3.1 Data
In order to document the effect of self-employment grants on labor market integration, we use a dataset on the universe of all unemployment episodes which covers all spells starting from January 1, 2009, until November 23, 2017 (N = 2,637,860). These data include the ID of an indi-vidual in the episode, as well as personal characteristics (age, gender, education, etc.), informa-tion regarding the episode (start and end dates of the episode, reason for entering and leaving unemployment, NACE industry codes of the previous employer and the next one, if applicable, etc.). Most importantly, it also includes an indicator of whether an episode ended with a self-employment grant, as well as grant start and end dates. As we observe individuals and their unemployment episodes through time, we can control for the selection into self-employment grant using the within-individual variation, and arguably, come closer to an empirical ideal–causal estimate. Note, however, that this identification strategy relies on an untestable (at least in this setting) assumption that individuals’ entrepreneurial propensity is time-invariant, which might not be the case.
In addition, we also use the universe of all limited liability firms in Croatia across the 1993–2017 period (N = 1,908,831) containing firm ID, NACE industry codes, county of head-quarters, year of incorporation and exit, complete balance sheets, and profit and loss state-ments; and the universe of all unlimited liability firms in Croatia from October 8, 1991, to May 26, 2018 (N = 306,059); including the dates of incorporation and dates of exit, NACE industry codes, and a firm’s headquarters county.9
Using the unlimited liability firms (crafts), since information on the exact dates of firm opening and closure is available, we provide a detailed account of the firm’s survival. We com-plement this analysis with the effect of grants on the newly founded firm’s performance in terms of employment and sales growth using a limited liability firm database. It should be noted that the analysis of firm survival and growth is a descriptive one, as we are not able to control for the selection into the grant.
3.2 Individual unemployment reentry
We use data on unemployment spells to analyze the pattern of employment integration, i.e., to determine whether individuals who exit the unemployment via self-employment grant tend to stay longer out of unemployment. While the ideal setting would be the one in which we have access to employment data, the unemployment episodes dataset we use does not track indi-viduals once they are out of unemployment. One of the key components of these data is that we observe an individual ID in an episode, which means that we potentially observe multiple
9 We merge these datasets with grant recipients published by Croatian employment service (available at http://www.hzz.hr/default.aspx?id=19186).

Page 8 of 32 Srhoj and Zilic. IZA Journal of Labor Policy (2021) 11:6
spells per individual, so we can construct unemployment reentry variables, but also base our identification strategy on fixed-effects estimation. From the universe of all unemployment epi-sodes starting from January 1, 2009, until November 23, 2017, we exclude all unfinished spells as we model individual reentry into unemployment—this reduces the sample from 2,637,860 to 2,463,498 observations. Also, we exclude all unemployment episodes that did not finish in employment, which additionally reduces the sample to 1,529,671 observations (episodes) and 735,273 distinct individuals (and 15,129 treated episodes).10
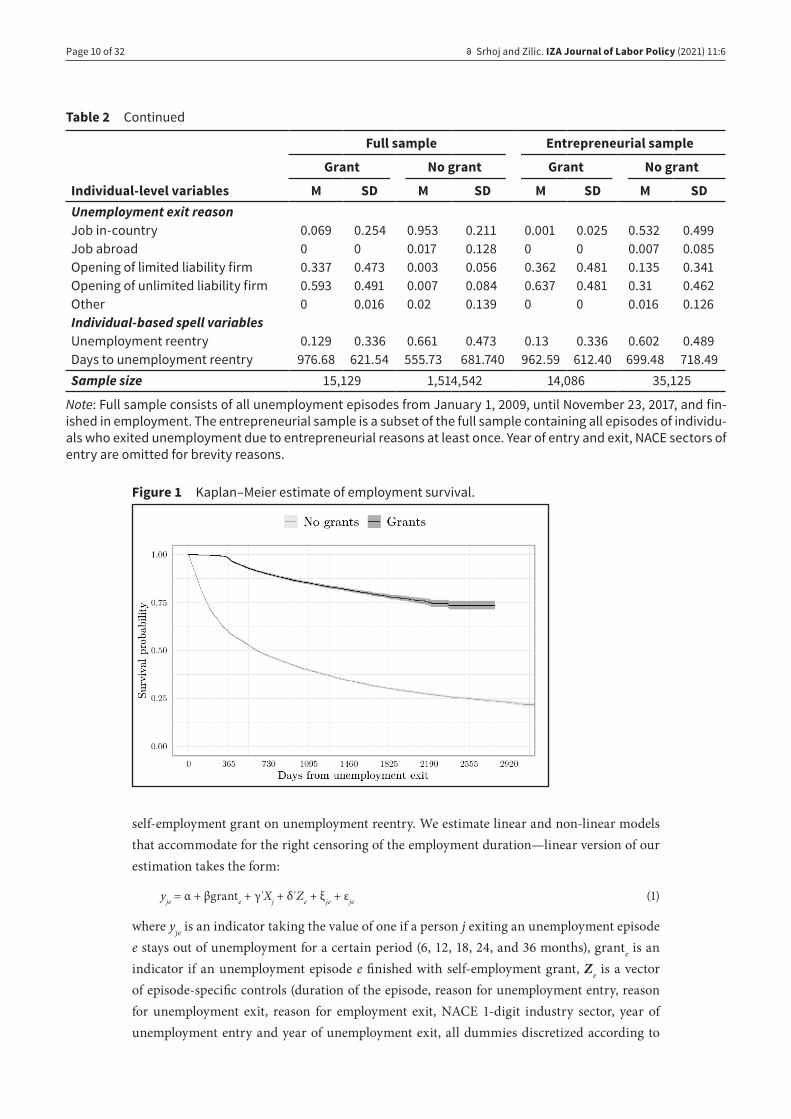
In addition to this, to compare self-employment grant holders with individuals who were also entrepreneurs at some point and, therefore, define a better comparison group, we keep all unemployment episodes of individuals who exited unemployment because they opened a firm in any of the episodes—we refer to this as an entrepreneurial sample (number of appearances in the entrepreneurial sample is presented in the Appendix – Figure A1).11 This reduces the dataset to 49,216 episodes and 29,226 individuals, 14,083 of which are treated. Table 2 displays the descriptive statistics of both of these datasets, while Figure 1 shows Kaplan–Meier survival estimates (Kaplan and Meier, 1958) for the entrepreneurial sample, where the dependent vari-able is time to reentering unemployment. Kaplan–Meier survival estimates for the full sample is available in the Appendix in Figure A2.
Comparative survival profile indicates a strong positive effect of grants, and, while there is, to some extent, cash and carry effect as a portion of individuals returns to the unemploy-ment office as soon as the required 1-year time frame expires, very high survival rates of not returning to unemployment in the first year contrast the sharp decline in survival probability of unemployment episodes not ending with a self-employment grant.
We can see that there are some observable differences in sample composition which might affect the Kaplan–Meier survival results (Table 2). In particular, among individuals who fin-ished their unemployment episode with a self-employment grant, there is, on average, a dis-proportionate number of men, they are middle-aged (from 30 years to 50 years) and more educated. Also, they most likely spend up to a year at the employment office before getting a grant and 70% of them were employed before the unemployment spell, while a disproportionate number of them also came from inactivity. If they had been previously employed, most grant receivers lost their jobs because their contract expired or they were laid off due to economic, technological, and organizational reasons. Finally, almost 60% of grant receivers opened an unlimited liability firm (or slightly more in the entrepreneurial sample),12 and, as expected, they have a lower probability of returning to unemployment with a longer period before reen-tering unemployment.
To estimate the effect associated with the grant, we build our empirical strategy on the longitudinal nature of the dataset where we can observe an individual in different unemploy-ment episodes, which enables us to eliminate the effect of fixed unobserved characteristics that might drive the results. Therefore, using repeated observations on treated individuals we arguably ameliorate concerns for selection into the grant, estimating the effect of receiving a
10 We also exclude unemployment episodes finishing in vocational education without employment as this is a one-year ALMP (in total 82,473 episodes). For more details see Tomić and Zilic (2020).
11 Note that this only changes the composition of the control group; we also present results using the full sample in the Appendix—conclusions are identical but greater in magnitude.
12 There is a portion of grant receivers who are coded for finding a job in a country, and while this should be viewed as a problem in the dataset, in the entrepreneurial sample, by definition, a portion of these individuals is almost zero.

Page 9 of 32 Srhoj and Zilic. IZA Journal of Labor Policy (2021) 11:6
Table 2 Descriptive statistics of unemployment spells which ended in employment
Full sample Entrepreneurial sample
Grant No grant Grant No grant
Individual-level variables M SD M SD M SD M SDFemale 0.426 0.494 0.523 0.499 0.428 0.495 0.458 0.498Age (years)≤20 0.027 0.163 0.104 0.305 0.027 0.163 0.051 0.22120–30 0.305 0.46 0.386 0.487 0.302 0.459 0.354 0.47830–40 0.376 0.484 0.236 0.425 0.377 0.485 0.315 0.46440–50 0.203 0.402 0.173 0.378 0.204 0.403 0.192 0.394≥50 0.089 0.284 0.101 0.302 0.089 0.285 0.088 0.283EducationElementary or less 0.057 0.232 0.152 0.359 0.058 0.233 0.088 0.284High school 0.685 0.464 0.671 0.47 0.688 0.463 0.708 0.455University or more 0.258 0.437 0.177 0.382 0.254 0.435 0.204 0.403Tenure≤2 years 0.098 0.297 0.179 0.383 0.097 0.296 0.128 0.3342–5 years 0.108 0.311 0.134 0.34 0.107 0.309 0.131 0.3375–10 years 0.206 0.404 0.179 0.383 0.204 0.403 0.211 0.40810–20 years 0.365 0.482 0.237 0.425 0.369 0.483 0.315 0.465≥20 years 0.14 0.347 0.155 0.362 0.142 0.349 0.135 0.342Unemployment episode variables Duration of unemployment episode≤30 days 0.016 0.126 0.108 0.31 0.016 0.125 0.092 0.28930–90 days 0.223 0.416 0.252 0.434 0.224 0.417 0.247 0.43190–180 days 0.294 0.456 0.254 0.435 0.3 0.458 0.263 0.44180 days–1 year 0.245 0.43 0.228 0.42 0.243 0.429 0.235 0.4241–2 years 0.146 0.353 0.102 0.302 0.143 0.35 0.11 0.3132–3 years 0.043 0.203 0.031 0.173 0.043 0.203 0.032 0.175≥3 years 0.032 0.176 0.025 0.158 0.032 0.175 0.021 0.145Status before unemploymentEmployment 0.702 0.457 0.757 0.429 0.704 0.456 0.763 0.425Education 0.036 0.185 0.083 0.275 0.034 0.182 0.047 0.211Inactivity 0.241 0.428 0.128 0.334 0.239 0.427 0.17 0.376Vocational training 0.008 0.092 0.02 0.138 0.009 0.092 0.008 0.09Other 0.013 0.113 0.013 0.112 0.013 0.115 0.012 0.108Employment exit reasonNot applicable 0.299 0.458 0.245 0.43 0.296 0.457 0.239 0.426Expiration of contract 0.226 0.418 0.446 0.497 0.225 0.418 0.309 0.462Expiration of seasonal contract 0.012 0.11 0.068 0.251 0.012 0.11 0.044 0.205Dismissal (econ., tech., and org. reasons)
0.309 0.462 0.16 0.367 0.311 0.463 0.272 0.445
Dismissal 0.022 0.147 0.012 0.107 0.023 0.149 0.018 0.133Worker resigned 0.03 0.171 0.016 0.125 0.03 0.171 0.017 0.131Consensual resignation 0.085 0.279 0.043 0.203 0.084 0.278 0.054 0.227Firm closure 0.015 0.121 0.009 0.097 0.016 0.124 0.043 0.203Other 0.003 0.054 0.002 0.043 0.003 0.056 0.003 0.051
(Continued)
Page 10 of 32 Srhoj and Zilic. IZA Journal of Labor Policy (2021) 11:6
self-employment grant on unemployment reentry. We estimate linear and non-linear models that accommodate for the right censoring of the employment duration—linear version of our estimation takes the form:
yje = α + βgrante + γ΄Xj + δ΄Ze + ξ je + εje (1)
where yje is an indicator taking the value of one if a person j exiting an unemployment episode e stays out of unemployment for a certain period (6, 12, 18, 24, and 36 months), grante is an indicator if an unemployment episode e finished with self-employment grant, Ze is a vector of episode-specific controls (duration of the episode, reason for unemployment entry, reason for unemployment exit, reason for employment exit, NACE 1-digit industry sector, year of unemployment entry and year of unemployment exit, all dummies discretized according to
Full sample Entrepreneurial sample
Grant No grant Grant No grant
Individual-level variables M SD M SD M SD M SDUnemployment exit reasonJob in-country 0.069 0.254 0.953 0.211 0.001 0.025 0.532 0.499Job abroad 0 0 0.017 0.128 0 0 0.007 0.085Opening of limited liability firm 0.337 0.473 0.003 0.056 0.362 0.481 0.135 0.341Opening of unlimited liability firm 0.593 0.491 0.007 0.084 0.637 0.481 0.31 0.462Other 0 0.016 0.02 0.139 0 0 0.016 0.126Individual-based spell variablesUnemployment reentry 0.129 0.336 0.661 0.473 0.13 0.336 0.602 0.489Days to unemployment reentry 976.68 621.54 555.73 681.740 962.59 612.40 699.48 718.49Sample size 15,129 1,514,542 14,086 35,125
Note: Full sample consists of all unemployment episodes from January 1, 2009, until November 23, 2017, and fin-ished in employment. The entrepreneurial sample is a subset of the full sample containing all episodes of individu-als who exited unemployment due to entrepreneurial reasons at least once. Year of entry and exit, NACE sectors of entry are omitted for brevity reasons.
Table 2 Continued
Figure 1 Kaplan–Meier estimate of employment survival.

Page 11 of 32 Srhoj and Zilic. IZA Journal of Labor Policy (2021) 11:6
Table 2), Xj is a vector of individual-specific variables (gender, age, education, tenure, all dis-cretized according to Table 2; we use only time-variant if we also use individual fixed effects), while ξ is an individual fixed effect that captures fixed intrinsic characteristics which might affect entrepreneurial motives [see, for example, Caliendo et al. (2014)]. We compare these estimates with estimates obtained by matching algorithms in a cross-sectional setting that is standard in the literature (Caliendo and Künn, 2015; Caliendo and Künn, 2011; Dvouletý and Lukeš, 2016). In conducting nearest neighbor matching with replacement, we use the same covariates as in Eq. (1) and then estimate the average treatment effect on the treated defined as the difference in outcomes between treated and control group in the post-treatment period.13
In order to fully accommodate the right-censoring of the data and estimate the differences in survival, we use the Cox proportional hazard model [see, for example, Cox (1972) and Cox and Oakes (1984)]. In particular, we estimate:
lje(r|grant,X,Z) = l0(r)exp{θgrante + γ΄Xj + δ΄Ze} (2)
where r is the duration in days to individual unemployment reentry, while grante, Xj, and Ze represent the same variables as in equation1, while the l0(r) is unrestricted baseline hazard. The parameter of interest is θ which measures the change in probability of unemployment reentry at a specific time (measured in days) associated with the receiving self-employment grant, and the corresponding hazard ratio (exp(θ)).
Apart from the Cox proportional hazard model, we also estimate the Weibull parametric survival model and the Cox mixed-effects model (Allison, 2010). While the first two methods do not exploit the fact that the dataset is constructed on the repeated entries of individuals, the Cox-mixed effect model estimates baseline hazard for unemployment reentry for every indi-vidual and then estimates the multiplicative part based on the covariates. These three models, one fully parametric (Weibull), one semiparametric with unrestricted common baseline haz-ard (Cox PH), and one semi-parametric with unrestricted baseline hazard function separate for every individual (COX ME) serve as an embedded robustness check to one another.
All of the results presented in Table 3 indicate a clear significant positive effect of self-employment grants on the probability of staying out of the unemployment in a certain time frame. We also compare these estimates with results obtained with nearest neighbor matching (Table A2 in Appendix). We find nearest neighbors based on a propensity score and show an overlap of propensity scores in Figure A3 in Appendix showing a good overlap.14 The average treatment effect on the treated shows a similar but slightly higher positive effect as opposed to linear model 3, and given that complete conditional exogeneity is difficult to argue we continue with specifications exploiting the longitudinal nature of our dataset. For example, estimation including individual fixed-effects (Table 3) shows that individuals who finished their unem-ployment episodes with grant have 6.4 percentage points higher probability of staying out of unemployment 18 months after the grant receipt than no-grant individuals, which constitutes 11.1% of the sample mean.
Comparing specifications within the sample and the same outcome, we see that includ-ing individual-based covariates does not change the magnitude of the effect dramatically
13 We also try the nearest neighbor matching with 2, 3, and 4 neighbors, Mahalanobis, radius, and kernel matching. For brevity, we show the nearest neighbor matching with 1 neighbor and we make other results obtainable upon request.
14 For brevity we make balance tests before and after matching obtainable upon request.

Page 12 of 32 Srhoj and Zilic. IZA Journal of Labor Policy (2021) 11:6
(Columns 1 vs. 2 of Table 3), but including episode-based covariates does significantly reduce the magnitude of the effect, implying that situation before the episode is more important in explaining the selection into self-employment grant than the individual-level variables.
Comparing Columns 3 and 4 of Table 3—estimations with and without individual fixed effects—offers insights into the selection for the self-employment grant based on the unobserv-able. As the control group is based on individuals who were entrepreneurs at least once in the dataset, the fact that the fixed-effects estimation is quantitatively higher than the estimation without fixed effects is not surprising. Intuitively, if we compare grant recipients with unem-ployed individuals who became employed and were entrepreneurs at some point, they tend to be slightly less able to stay out of unemployment. 15 As a robustness check, we also estimate same specifications but on the sample of unemployment episodes including only individuals with at least two occurrences in the sample. The results, presented in Appendix in the Table A3 corroborate our baseline conclusions.
The results of the estimation of survival models presented in Table 4 offer similar evi-dence regarding the effectiveness of self-employment grants. All estimation approaches indi-cate that receiving a grant is linked to an improvement in the probability of not returning to unemployment: the self-employment grant improves the chance of staying out of unemploy-ment by around 36%. The estimates within the sample are quantitatively very similar, there-fore no additional information, in terms of the magnitude of self-employment grant effect, is obtained by estimating baseline hazards for every individual. Like in the linear models, the entrepreneurial sample gives a smaller magnitude of effects than the full sample, due to the composition of the control group. While the causal evidence of the effectiveness of
15 Note that the opposite is true if we estimate the same specification in the full sample—when compared to (non-entrepreneurial) unemployed individuals who became employed, self-employment grant recipients tend to be slightly more able to stay out of unemployment (see the results on full sample in the Table A1 in the Appendix).
Table 3 Results, unemployment reentry: linear models
Entrepreneurial sample
Sample mean (1) (2) (3) (4) NNot unemployed after6 months 0.768 0.197*** (0.004) 0.191*** (0.004) 0.023*** (0.003) 0.020 (0.015) 48,25912 months 0.652 0.335*** (0.004) 0.326*** (0.004) 0.066*** (0.004) 0.086*** (0.017) 45,69218 months 0.577 0.353*** (0.005) 0.343*** (0.005) 0.052*** (0.005) 0.064*** (0.020) 43,40624 months 0.515 0.381*** (0.005) 0.371*** (0.005) 0.057*** (0.005) 0.080*** (0.022) 40,50836 months 0.416 0.354*** (0.006) 0.342*** (0.006) 0.020*** (0.006) 0.073*** (0.024) 34,530Individual-based covariates No Yes Yes Yes –Episode based covariates No No Yes Yes –Individual fixed-effects No No No Yes –
Note: Entrepreneurial sample is a subset of a full sample containing all episodes of individuals who exited unem-ployment due to entrepreneurial reasons at least once. Individual-based covariates are gender, age, education, tenure, all discretized according to Table 2. Episode-based covariates include duration of the episode, reason for unemployment entry, reason for unemployment exit, reason for employment exit, NACE 1-digit industry sector, year of unemployment entry, and year of unemployment exit, all dummies discretized according to Table 2. Stan-dard errors clustered at the individual level are in parentheses.*p < 0.10.**p < 0.05.***p < 0.01.

Page 13 of 32 Srhoj and Zilic. IZA Journal of Labor Policy (2021) 11:6
self-employment grants is still rather scarce (Caliendo, 2016), our findings are in line with most of the evaluation studies (Caliendo and Künn, 2011; Wolff and Nivorozhkin, 2012; Cali-endo and Künn, 2015), which find the positive association of receiving a grant on the prob-ability of being employed.
3.2.1 Heterogeneous effects on unemployment reentry
To document the heterogeneous effects, we first show Kaplan–Meier survivals across a legal form of firms that opened via a grant (limited and unlimited liability)—Figure 2. We can see that limited liability is a more successful legal form in terms of survival, which is expected given the possibility to close the craft cheaper and faster.
Table 4 Results, unemployment reentry: survival models
Entrepreneurial sample
COX proportional hazard Parametric Weibull COX mixed effectsCoefficient hazard ratioSurvival −0.443*** 0.642 0.501*** 0.640 −0.447*** 0.640
(0.030) [0.606, 0.680] (0.033) [0.599, 0.683] (0.030) [0.603, 0.679]Observations 49,211 49,211 49,211Ind. covariates Yes Yes YesEpis. covariates Yes Yes Yes
Note: Entrepreneurial sample is a subset of a full sample containing all episodes of individuals who exited unem-ployment due to entrepreneurial reasons at least once. All estimates include individual-based covariates—gender, age, education, tenure, and episode-based covariates include duration of the episode, reason for unemployment entry, reason for unemployment exit, reason for employment exit, NACE 1-digit industry sector, year of unemploy-ment entry, and year of unemployment exit, all dummies discretized according to Table 2. Parentheses contain robust standard errors, while brackets contain a 95% confidence interval of the hazard ratio.*p < 0.10.**p < 0.05.***p < 0.01.
Figure 2 Kaplan–Meier estimate of employment survival by legal form.

Page 14 of 32 Srhoj and Zilic. IZA Journal of Labor Policy (2021) 11:6
To document heterogeneous effects in more detail, we use the Cox proportional hazard model16 and rerun the estimation within the categories of discrete covariates we use, control-ling for the rest of the variables. For example, we estimate the COX PH model only for episodes including individuals aged ≤20, controlling for all other covariates presented in the specifica-tions above. Table A4 in Appendix presents these results. Concentrating only on the entrepre-neurial sample, we see that there is no great heterogeneity in terms of the significance of the effects as the self-employment grant significantly reduces the risk of returning to unemploy-ment for most of the subsamples.
The self-employment grant is more effective for individuals who are 20–50 years old,17 in contrast to younger and older individuals. It is also more effective for men, although it is also rather successful for women as it reduces their probability of unemployment reentry by 38.5%. As for the status before unemployment, the self-employment grant is the most effective for people coming from inactivity into unemployment as it reduces the probability of unemploy-ment reentry by 41.7%. While this seems like a very successful strategy of activating individu-als, note that we cannot discard the possibility that an individual could return into inactivity after the grant period expires.18 The grant receipt is not effective for individuals coming into unemployment straight from education and vocational training, which does not imply that these individuals will not have long-term positive effects due to the capacity building gained from entrepreneurial experience (Table A4).
As for educational attainment, the grant is the most effective in terms of labor market reintegration for individuals who finished high school and least effective for individuals who finished elementary school as the highest educational achievement.19 While heterogeneous
16 We use the COX PH model as it gives almost identical estimates as other methods, computationally is faster than the COX ME, and also enables clearer filtering of observations, since we do not need repeated individual entries.
17 The most successful age group is 40–50, which contrasts findings from Caliendo and Künn (2011), who found that individuals below the age of 30 responded the best to the grant.
18 Note that grant receivers and no-grant individuals who came from inactivity spend a similar amount of time at the unemployment office.
19 University graduates are also quite successful in using grant funds, which somewhat contrasts findings from Caliendo and Künn (2011).
Figure 3 Heterogeneous effects: education.

Page 15 of 32 Srhoj and Zilic. IZA Journal of Labor Policy (2021) 11:6
point estimates of self-employment grants go in the direction of a U-shaped relationship between educational attainment and self-employment (Poschke, 2013), due to wide confidence intervals, the U-shaped heterogeneous effects of self-employment grants across educational level cannot be claimed. Heterogenous effects based on age and gender are presented in the Appendix, Figures A5 and A6, respectively.
Analyzing heterogeneous effects across employment exit reasons (if applicable) carries a dose of ambiguity as unemployment exit reasons are hard to differentiate (employees might affect the official category of resignation). Nonetheless, we record a very strong improvement in the survival if an individual becomes unemployed because of a firm’s closure, as the probability of not reentering unemployment is 63.4%, indicating that self-employment is a good career solution for individuals with know-how, but without a place to work.
While effects across the potential tenure give a rather balanced profile, heterogeneous effects across unemployment duration provide interesting insights—the longer the dura-tion of the unemployment episode, the less effective the self-employment grant. This profile is even extreme, as individuals who spent little time at the unemployment office utilize the self-employment grant the best (a striking 74% reduction in the probability of returning to unemployment), which might indicate the bogus employment status.20 Nonetheless, even with this outlier, the linearity of the effects across unemployment duration holds, which raises a question regarding the effectiveness of the policy toward the individuals who spent more time at the unemployment office (and who should be targeted with the ALMP). In particular, in our entrepreneurial sample, receiving a self-employment grant does not increase the probability of staying out of unemployment if the grant was received at the end of the episode that was longer than 2 years. Several other reasons might be behind a negative relationship between unemploy-ment duration and self-employment grant effect, including a lack of financial resources needed for running the business or human capital decay and skill loss (Ortego-Marti, 2016), which make it difficult for individuals to withstand the minimum efficiency scale on the market.
20 Individuals might resign from work, apply to the unemployment office and receive a self-employment grant, and then work almost exclusively for the firm they resigned from in the first place. For more on bogus employment see Thörnqvist (2014).
Figure 4 Heterogeneous effects: time spent at the unemployment office.
Page 16 of 32 Srhoj and Zilic. IZA Journal of Labor Policy (2021) 11:6
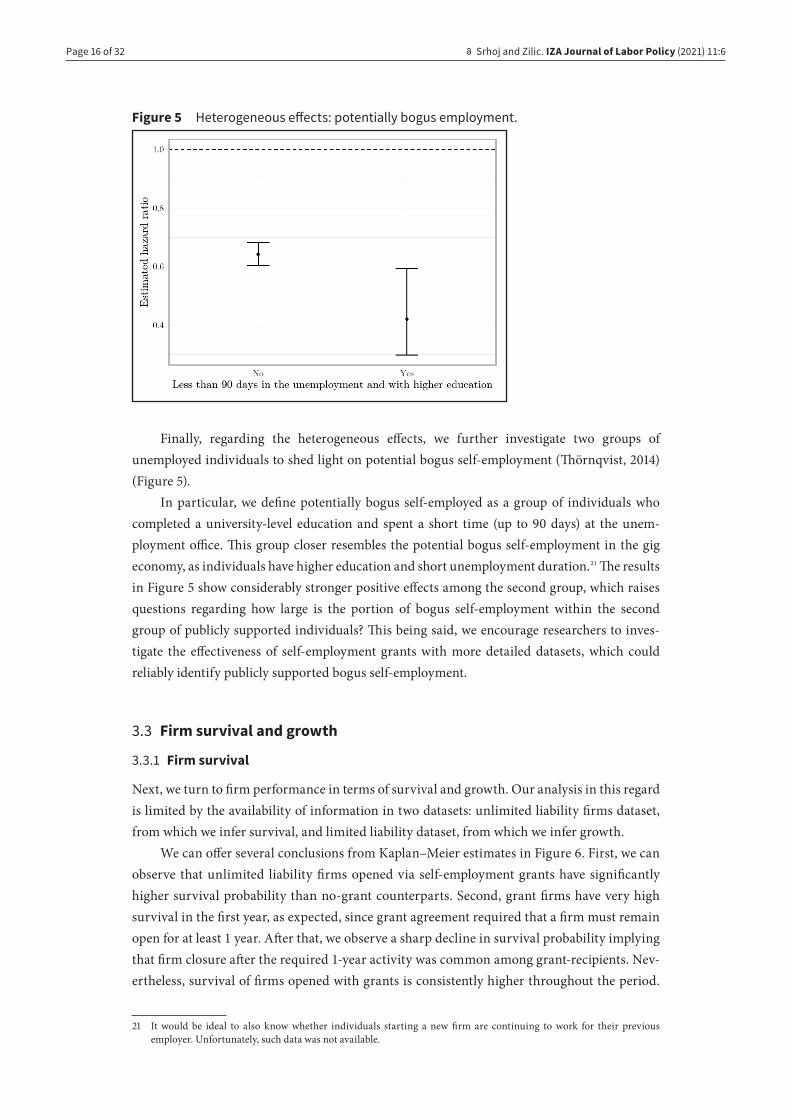
Finally, regarding the heterogeneous effects, we further investigate two groups of unemployed individuals to shed light on potential bogus self-employment (Thörnqvist, 2014) ( Figure 5).
In particular, we define potentially bogus self-employed as a group of individuals who completed a university-level education and spent a short time (up to 90 days) at the unem-ployment office. This group closer resembles the potential bogus self-employment in the gig economy, as individuals have higher education and short unemployment duration.21 The results in Figure 5 show considerably stronger positive effects among the second group, which raises questions regarding how large is the portion of bogus self-employment within the second group of publicly supported individuals? This being said, we encourage researchers to inves-tigate the effectiveness of self-employment grants with more detailed datasets, which could reliably identify publicly supported bogus self-employment.
3.3 Firm survival and growth
3.3.1 Firm survival
Next, we turn to firm performance in terms of survival and growth. Our analysis in this regard is limited by the availability of information in two datasets: unlimited liability firms dataset, from which we infer survival, and limited liability dataset, from which we infer growth.
We can offer several conclusions from Kaplan–Meier estimates in Figure 6. First, we can observe that unlimited liability firms opened via self-employment grants have significantly higher survival probability than no-grant counterparts. Second, grant firms have very high survival in the first year, as expected, since grant agreement required that a firm must remain open for at least 1 year. After that, we observe a sharp decline in survival probability implying that firm closure after the required 1-year activity was common among grant-recipients. Nev-ertheless, survival of firms opened with grants is consistently higher throughout the period.
21 It would be ideal to also know whether individuals starting a new firm are continuing to work for their previous employer. Unfortunately, such data was not available.
Figure 5 Heterogeneous effects: potentially bogus employment.

Page 17 of 32 Srhoj and Zilic. IZA Journal of Labor Policy (2021) 11:6
For example, 95.1%, 75.3%, and 66.4% of firms initiated with a self-employment grant are still open after 1 year, 2 years, and 3 years, respectively, while 80.1%, 67.6%, and 60.0% no-grant firms are still operating after 1 year, 2 years, and 3 years, respectively. Note that survival profiles using this dataset reflect the results from unemployment episodes datasets (see, for example, Figure 2). Indeed, these descriptive conclusions are corroborated by the results of linear probability and Cox proportional hazard models—survival of unlimited liability firms opened via the grant is 23.8% more favorable than the no-grant counterparts (Table A5 in Appendix).
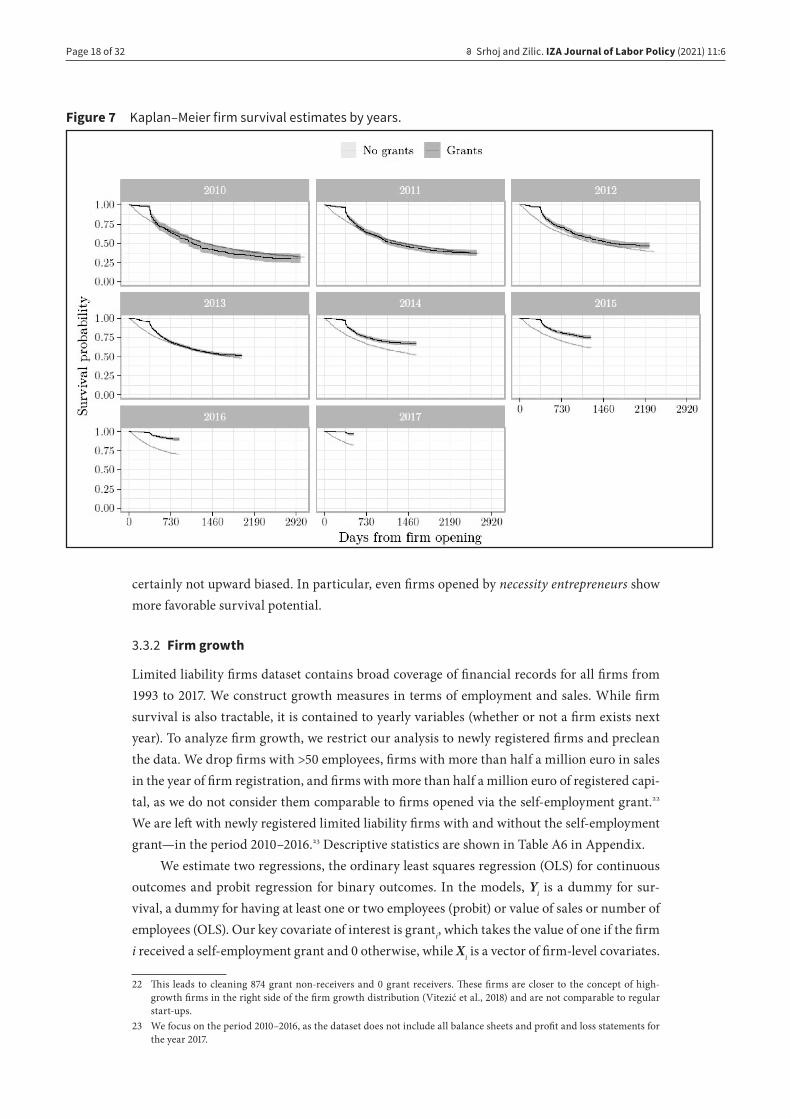
Apart from these baseline results, we also show the effect through time (Figure 7), where we can see improvement in the effectiveness of the grant every year. Similar profile of grant effectiveness can be seen from Kaplan-Meier survival estimates on unemployment re-entry across the years presented in the Appendix in Figure A4. These improvements, evident par-ticularly during the recession period (2010–2013), can be attributed to better self-selection of applicants, improved screening of business ideas, more efficient controls, and, consequently, to institutional learning.
Summing up the results presented in the figures above, we find that unlimited liability firms display a sharp decline in the survival probability after 1 year, which points in the direc-tion of the cash and carry effect [see, for example, Pfeiffer and Reize (2000)], because as soon as the required 1 year of operating expires a sizable portion of firms opened through a grant scheme closes. However, an increase in firm closures after 1 year does not necessarily imply an adverse effect because the grants curve does not cross the no grant curve, which is why the cash and carry effect cannot be confirmed, and because individuals might have reintegrated into a labor market differently—as we see in the part with unemployment reentry. In other words, we find evidence supporting a more favorable survival profile, which is in line with the previous empirical findings [see, for example, Andersson and Wadensjö (2007), Désiage et al. (2010), and Caliendo (2016)]. While our results presented in this section are descriptive in nature, as we disregard the issues of unobserved characteristics, which might affect both selec-tions in self-employment grant and firm survival, bearing in mind that the self-employment grant is targeted at unemployed individuals, we argue that these positive survival estimates are
Figure 6 Kaplan–Meier firm survival estimates.
Page 18 of 32 Srhoj and Zilic. IZA Journal of Labor Policy (2021) 11:6
certainly not upward biased. In particular, even firms opened by necessity entrepreneurs show more favorable survival potential.
3.3.2 Firm growth
Limited liability firms dataset contains broad coverage of financial records for all firms from 1993 to 2017. We construct growth measures in terms of employment and sales. While firm survival is also tractable, it is contained to yearly variables (whether or not a firm exists next year). To analyze firm growth, we restrict our analysis to newly registered firms and preclean the data. We drop firms with >50 employees, firms with more than half a million euro in sales in the year of firm registration, and firms with more than half a million euro of registered capi-tal, as we do not consider them comparable to firms opened via the self-employment grant.22 We are left with newly registered limited liability firms with and without the self-employment grant—in the period 2010–2016.23 Descriptive statistics are shown in Table A6 in Appendix.
We estimate two regressions, the ordinary least squares regression (OLS) for continuous outcomes and probit regression for binary outcomes. In the models, Yi is a dummy for sur-vival, a dummy for having at least one or two employees (probit) or value of sales or number of employees (OLS). Our key covariate of interest is granti, which takes the value of one if the firm i received a self-employment grant and 0 otherwise, while Xi is a vector of firm-level covariates.
22 This leads to cleaning 874 grant non-receivers and 0 grant receivers. These firms are closer to the concept of high-growth firms in the right side of the firm growth distribution (Vitezić et al., 2018) and are not comparable to regular start-ups.
23 We focus on the period 2010–2016, as the dataset does not include all balance sheets and profit and loss statements for the year 2017.
Figure 7 Kaplan–Meier firm survival estimates by years.

Page 19 of 32 Srhoj and Zilic. IZA Journal of Labor Policy (2021) 11:6
The results shown in Table 5 convey similar messages to descriptive statistics (Table A6 in Appendix) regarding the differences between a firm receiving a grant and regular start-ups. Firms receiving a grant, on average, have lower sales. For example, in the first year of doing business firms have €9,467 lower annual sales. This negative difference in annual sales increases as much as four times in 2 years after registering a firm. Furthermore, firms receiving the grant for self-employment have on average 0.436 employees less than 1 year after the firm was registered, which increases to 0.579, 2 years later. Breaking down the employment patterns in detail, Columns 3 and 4 of Table 5 show that grant-receiving firms have, on average, a higher probability of having only one employee, as the effect of a grant on having at least one employee is positive and significant, while the effect on having two or more employees, although insig-nificant, is negative. Finally, we see a statistically significant negative difference in survival between firms receiving grants for self-employment and regular startups.
The difference in survival estimates between crafts and limited liability firms can be explained by tax regimes and market selection (Jovanovic, 1982). Namely, taxation is more favorable for entrepreneurs who start a craft and have a turnover <300,000 Kunas (approx. €40,000), while if an entrepreneur runs a craft above this threshold, taxation sharply increases and it is no longer favorable in comparison to limited liability firms. Thus, unemployed indi-viduals start limited liability firms when they assume the turnover will be above this threshold. However, as elaborated by Jovanovic (1982), entrepreneurs do not know their true productivity level until they arrive on the market, therefore, a negative link between self-employment grants and firm survival might be explained with this interpretation.
Summing up the descriptive results presented in Table 5 and Table A6 in Appendix, we find that limited liability firms initiated via self-employment subsidy are on average smaller in terms of capital, sales, and employment, and exert smaller growth potential than their no-grant counterparts, while their survival profile is worse. These conclusions, although descriptive,
Table 5 Regression results for limited liability firms
Employees (at least)
Sales Employment One Two Survival
(1) (2) (3) (4) (5) NTime horizonEnd of firm registration year (t)
–9,467*** (1,173)
−0.023 (0.070)
0.332*** (0.006)
–0.040*** (0.006)
46,336
1 year later (t+1) –36,214*** (5,217)
–0.436*** (0.097)
0.217*** (0.007)
–0.074*** (0.010)
–0.018*** (0.006)
34,300
2 years later (t+2) –35,921*** (5,946)
–0.579*** (0.131)
0.136*** (0.010)
–0.045*** (0.012)
–0.037*** (0.009)
24,804
Note: Models 1 and 2 are OLS regression estimates, while Models 3–5 are marginal effects from probit regressions. All estimates include NACE 2-digit industry dummies, county of firm headquarters, year of firm registration, type of a firm’s legal form, number of months a firm was officially open during the year (all dummies), the value of capital owner registered, and other types of grants as covariates [used in Srhoj et al. (2021, 2019)]. Standard errors clus-tered at NACE 2-digit level are in the parenthesis. Sample sizes of probit regressions on survival are 37,625 (t+1) and 30,330 (t+2).*p < 0.10.**p < 0.05.***p < 0.01.

Page 20 of 32 Srhoj and Zilic. IZA Journal of Labor Policy (2021) 11:6
corroborate the interpretation of necessity entrepreneurs. In particular, unemployed individu-als wanting to start a firm are more likely to be necessity entrepreneurs as they start businesses due to a lack of employment opportunities, in contrast to individuals who become entre-preneurs because of identified business opportunities (Block and Sandner, 2009). While the self-employment grant does serve as an ALMP and, thus, helps unemployed individuals to reintegrate into the labor market, firms opened with these grants have limited contribution to the economic growth (Shane, 2009; Caliendo, 2016), and results presented in tables above sup-port these conclusions.
To further interpret our estimates from a public policy perspective, using Table 3 which presents the results on the effect of grants on unemployment reentry, we calculate a simple back-of-envelope estimation of the amount of money spent per one job. In particular, as the effect of receiving a grant on not being unemployed after 24 months is 8 percentage points lower than the non-grant counterparts (Table 3, Column (4)), this implies that, on average, one would need to administrate 12.5 grants to have one unemployed less after 2 years. Since the average amount of self-employment grant is just above €3,200, the cost of one job is around €38,800 (95% con-fidence interval is €26,250–€87,500). Our estimated public cost per job is higher than the costs found by Brown and Earle (2017; $21,580–$25,450) but are within the range of public cost per job identified by a recent review of 30 robust microeconometric impact evaluations of public grants for micro, small and medium-sized enterprises in the EU ( Dvouletý et al., 2021). The previous study shows heterogeneity of public costs of “€189,000, €62,000, €26,000, €14,700 and €6,000 per job” (Dvouletý et al., 2021, p. 14). Note, however, that our relatively high cost per one job might come from our implicit assumption. In particular, as we do not observe the number of employees in the unlimited liability dataset, we assume that one craft is one employee, which might not be the case. Therefore, the amount of €38,800 is actually per one unlimited liability firm, and hence the upper bound for the cost per one job.
4 ConclusionsThis paper evaluates the effectiveness of ALMP—self-employment grant—in Croatia in the period 2010–2017. The government provided startup grants for unemployed individu-als to ease challenges during the first 12 months of business opening and thus: (i) directly decreasing unemployment via self-employment and (ii) indirectly decreasing unemploy-ment by potential hiring of new entrepreneurs. Grant beneficiaries could open limited or unlimited liability firms and use the funds—which could go up to 50% of average Croatian gross annual salary—on entrepreneurs’ salaries and contributions, basic equipment, and training. While the funds allocated to this policy accounted for only around 5% of annual ALMPs funds, firms opened via this grant scheme accounted for up to 10% of newly opened firms throughout the years, giving this policy not only labor market activation, but also growth role.
Using four different and, arguably, rich datasets, we analyze whether these grants posi-tively affect firm survival, firm growth, and individual employment possibilities. The results show that limited liability firms initiated through a grant have lower sales and employment growth, while the survival analysis, based on annual reports, reveals a worse survival profile. On the other hand, using much more detailed firm demography data, we find that unlimited

Page 21 of 32 Srhoj and Zilic. IZA Journal of Labor Policy (2021) 11:6
liability firms have higher survival compared with no-grant counterparts, even if a sizable portion of them closes after the required 1-year period. Using a quasi-longitudinal dataset of unemployment episodes, we find compelling evidence that individuals who exit unemploy-ment with a self-employment grant have better chances of staying out of unemployment, which characterizes self-employment grants as an effective policy to advance labor market prospects of unemployed individuals. While heterogeneous effects indicate that a self-employment grant is particularly effective for individuals who became unemployed after inactivity and lost their job due to a firm’s closure—which indicated favorable activation potential of this policy, they also indicate that the longer the unemployment duration, the less effective the grant. Further-more, the grant is more effective for individuals who would otherwise have access to labor market opportunities (men, more educated, prime-age workers, previously employed). Finally, our simple and conservative back-of-the-envelope calculation shows the public cost per job cre-ated is about €38,800.
While this paper attempts to document the effect of self-employment grants on firm per-formance and labor market reintegration in detail, a lot still needs to be understood, in this empirical setting, as well as in others. For example, the effects of variation in funds, the use of funds, and the duration of the measure all relate to the question of optimal design of the grant. Furthermore, the question of the political economy of grants remains an important one, since self-employment grants, as also shown in this piece of research, have an intrinsic tension between social and growth components.
AcknowledgmentsThe authors would like to thank Valerija Botrić, Ondrej Dvoulety, Teo Matković, Ozana Nadoveza Jelić, Iva Tomić, Marko Lucić, as well as participants at the Challenges of Europe Brač conference, University of Dubrovnik round table, ESPE Bath conference, 4th Online Workshop on Industrial Dynamics and Innovation, and the 22nd EFZG Brown Bag Seminar for their valuable comments and suggestions. Any possible errors are our own.
ReferencesAllison, P. D. (2010): Survival Analysis, in: The Reviewers Guide to Quantitative Methods in the Social Sciences,
edited by Hancock, G. R.; R. O. Mueller; L. M. Stapleton. Routledge, New York, 413-424.Andersson, P.; E. Wadensjö (2007): Do the Unemployed Become Successful Entrepreneurs? International
Journal of Manpower 28(7), 604-626.Block, J.; P. Sandner (2009): Necessity and Opportunity Entrepreneurs and their Duration in Self- Employment:
Evidence from German Micro Data. Journal of Industry, Competition and Trade 9(2), 117-137.Bornhäll, A.; S.-O. Daunfeldt; N. Rudholm (2015): Employment Protection Legislation and Firm Growth: Evi-
dence from A Natural Experiment. Industrial and Corporate Change 26(1), dtw017.Botrić, V. (2017). Youth Employment Initiative (YEI) in Croatia. Technical Report, European Parliament’s Com-
mittee on Employment and Social Affairs.Branstetter, L.; F. Lima; L. J. Taylor; A. Venâncio (2014): Do Entry Regulations Deter Entrepreneurship and Job
Creation? Evidence from Recent Reforms in Portugal. The Economic Journal 124(577), 805-832.Brown, J. D.; J. S. Earle (2017): Finance and Growth at the Firm Level: Evidence from SBA Loans. The Journal
of Finance 72(3), 1039-1080.Budimir, T.; Z. Aralica (2013): Assessments of Creditworthiness of Crafts in Croatia. Economic Research-
Ekonomska istrazivanja 26(Suppl. 1), 133-150.Caliendo, M. (2016): Start-Up Subsidies for the Unemployed: Opportunities and Limitations. IZA World of
Labor, 200.Caliendo, M.; F. Fossen; A. S. Kritikos (2014): Personality Characteristics and the Decisions to Become and
Stay Self-Employed. Small Business Economics 42(4), 787-814.Caliendo, M.; J. Hogenacker; S. Künn; F. Wießner (2015): Subsidized Start-Ups Out of Unemployment: A Com-
parison to Regular Business Start-Ups. Small Business Economics 45(1), 165-190.

Page 22 of 32 Srhoj and Zilic. IZA Journal of Labor Policy (2021) 11:6
Caliendo, M.; A. S. Kritikos (2010): Start-Ups by the Unemployed: Characteristics, Survival and Direct Employ-ment Effects. Small Business Economics 35(1), 71-92.
Caliendo, M.; S. Künn (2011): Start-Up Subsidies for the Unemployed: Long-Term Evidence and Effect Hetero-geneity. Journal of Public Economics 95(3-4), 311-331.
Caliendo, M.; S. Künn (2015): Getting Back into the Labor Market: The Effects of Startup Subsidies for Unem-ployed Females. Journal of Population Economics 28(4), 1005-1043.
Caliendo, M.; S. Tübbicke (2020): New Evidence on Long-Term Effects of Start-Up Subsidies: Matching Esti-mates and their Robustness. Empirical Economics 59(4), 1605-1631.
Card, D.; J. Kluve; A. Weber (2010): Active Labour Market Policy Evaluations: A Meta-Analysis. The Economic Journal 120(548), F452-F477.
Card, D.; J. Kluve; A. Weber (2017): What Works? A Meta Analysis of Recent Active Labor Market Program Evalu-ations. Journal of the European Economic Association 16(3), 894-931.
Conti, A.; M. P. Roche (2021): Lowering the Bar? External Conditions, Opportunity Costs, and High-Tech Start-Up Outcomes. Organization Science, 1-25, https://doi.org/10.1287/orsc.2020.1411 [Accessed: June 2nd 2021.].
Cox, D. (1972): Pregression Models and Life-Tables. Journal of the Royal Statistical Society: Series B 34(2), 187-220.
Cox, D. R.; D. Oakes (1984): Analysis of Survival Data. Chapman and Hall: Boca Raton.Désiage, L. J.; R. Duhautois; D. Redor (2010): Do Public Subsidies have an Impact on New Firm Survival?
An Empirical Study with French Data. https://halshs.archives-ouvertes.fr/file/index/docid/809709/file-name/10-04.pdf [Accessed: June 2nd 2021.].
Dvouletý, O.; M. Lukeš (2016): Review of Empirical Studies on Self-Employment Out of Unemployment: Do Self-Employment Policies Make A Positive Impact? International Review of Entrepreneurship 14(3), 361-376.
Dvouletý, O., Srhoj, S. & Pantea, S. (2021): Public SME grants and firm performance in European Union: A systematic review of empirical evidence. Small Business Economics, 57, 243–263. https://doi.org/10.1007/s11187-019-00306-x
Franičević, V. (2011): Croatia: Prolonged Crisis with an Uncertain Ending, in: Work Inequalities in the Crisis: Evidence from Europe, edited by Daniel Vaughan-Whitehead, 143-197. https://doi.org/10.4337/9780857937513
Henrekson, M. (2005): Entrepreneurship: A Weak Link in the Welfare State? Industrial and Corporate Change 14(3), 437-467.
HOK (2017): Poduzetnistvo u brojkama xii/2017. Technical Report, Hrvatska obrtnicka komora.HZZ (2016): Vanjska evaluacija mjera aktivne politike tržišta rada 2010. - 2013. Sumarno evaluacijsko izvješće.
Veljača, 2016. Hrvatski zavod za zapošljavanje, Zagreb. https://www.hzz.hr/UserDocsImages/HZZ_i_Ipsos_Vanjska-evaluacija-mjera-aktivne-politike-trzista-rada_2010.pdf [Accessed: June 2nd 2021.]
Jovanovic, B. (1982): Selection and the Evolution of Industry. Econometrica: Journal of the Econometric Soci-ety, 50, 3, 649-670. https://doi.org/10.2307/1912606
Kaplan, E. L.; P. Meier (1958): Nonparametric Estimation from Incomplete Observations. Journal of the American Statistical Association 53(282, :457-481.
Nestić, D. (2015): Ključni problemi hrvatskog tržišta rada, in: Zaposlimo Hrvatsku! Strateške smjernice za rast zaposlenosti. Hrvatska gospodarska komora, 43-59.
Nikolic, J.; I. Rubil; I. Tomić (2017): Pre-Crisis Reforms, Austerity Measures and the Public-Private Wage Gap in Two Emerging Economies. Economic Systems 41(2), 248-265.
Ortego-Marti, V. (2016): Unemployment History and Frictional Wage Dispersion. Journal of Monetary Economics 78, 5-22.
Peric, M., V. Vitezic (2016): Impact of Global Economic Crisis on Firm Growth. Small Business Economics 46(1), 1-12.
Pfeiffer, F.; F. Reize (2000): Business Start-Ups by the Unemployed–An Econometric Analysis Based on Firm Data. Labour Economics 7(5), 629-663.
Poschke, M. (2013): Who Becomes an Entrepreneur? Labor Market Prospects and Occupational Choice. Journal of Economic Dynamics and Control 37(3), 693-710.
Sánchez-Cañizares, S. M.; L. J. Cabeza-Ramírez; M. D. Guerrero-Baena (2020): Evaluation of Self- Employment Support Policies Using Survival Analysis. The Discounted Flat Rate in Andalusia (Spain). Papers in Regional Science 99(5), 1389-1411.
Shane, S. (2009): Why Encouraging More People to Become Entrepreneurs is Bad Public Policy. Small Business Economics 33(2), 141-149.
Simoes, N.; N. Crespo; S. B. Moreira (2016): Individual Determinants of Selfemployment Entry: What do We Really Know? Journal of Economic Surveys 30(4), 783-806.

Page 23 of 32 Srhoj and Zilic. IZA Journal of Labor Policy (2021) 11:6
Srhoj, S.; B. Škrinjarić; S. Radas (2021): Bidding Against the Odds? The Impact Evaluation of Grants for Young Micro and Small Firms During the Recession. Small Business Economics 56, 83-103.
Srhoj, S.; B. Škrinjarić; S. Radas; J. Walde (2019): Closing the Finance Gap by Nudging: Impact Assessment of Public Grants for Women Entrepreneurs. Radni materijali EIZ-a 2, 5-41.
Thörnqvist, C. (2014): Bogus Self-Employment in the European Union. Paper for the UACES Panel ‘Vulnerabili-ties of Regular Labour Migration in the EU’, Cork, Ireland, 1-3.
Tomić, I.; I. Zilic (2020): Working for 200 Euro? The Unintended Effects of Traineeship Reform on Youth Labor Market Outcomes. Labour 34(3), 347-371.
Vitezić, V.; S. Srhoj; M. Perić (2018): Investigating Industry Dynamics in a Recessionary Transition Economy. South East European Journal of Economics and Business 13(1), 43-67.
Wolff, J.; A. Nivorozhkin (2012): Start Me Up: The Effectiveness of A Self-Employment Programme for Needy Unemployed People in Germany. Journal of Small Business & Entrepreneurship 25(4), 499-518.

Page 24 of 32 Srhoj and Zilic. IZA Journal of Labor Policy (2021) 11:6
Appendix
A.1 Unemployment re-entry
Figure A1 Number of appearances of individuals in the entrepreneurial sample.
Figure A2 Kaplan–Meier estimates of employment survival: full sample.

Page 25 of 32 Srhoj and Zilic. IZA Journal of Labor Policy (2021) 11:6
Table A1 Results, unemployment re-entry: full sample
Full sample
Sample mean (1) (2) (3) (4) NNot unemployed after6 months 0.617 0.297***
(0.002)0.273***
(0.002)0.052***
(0.003)0.013
(0.013)1,497,186
12 months 0.428 0.474*** (0.003)
0.448*** (0.003)
0.112*** (0.004)
0.095*** (0.015)
1,424,800
18 months 0.371 0.471*** (0.003)
0.445*** (0.003)
0.103*** (0.005)
0.077*** (0.017)
1,338,826
24 months 0.314 0.490*** (0.004)
0.464*** (0.004)
0.111*** (0.005)
0.104*** (0.018)
1,255,829
36 months 0.251 0.442*** (0.005)
0.419*** (0.005)
0.087*** (0.006)
0.112*** (0.020)
1,066,772
Individual-based covariates No Yes Yes Yes –Episode-based covariates No No Yes Yes –Individual fixed-effects No No No Yes –
Note: The full sample consists of all unemployment episodes from January 1, 2009, until November 23, 2017, and finishing in employment. Individual-based covariates are gen-der, age, education, tenure, all discretized according to Table 2. Episode-based covari-ates include duration of the episode, reason for entering unemployment, reason of exiting unemployment, reason of employment exit, NACE 1-digit industry sector, year of entering unemployment, and year of exiting unemployment, all dummies discretized according to Table 2. Standard errors clustered at the individual level are in the parenthesis.*p < 0.10.**p < 0.05.***p < 0.01.
Figure A3 Overlap of propensity scores before and after nearest neighbor matching.

Page 26 of 32 Srhoj and Zilic. IZA Journal of Labor Policy (2021) 11:6
Table A2 Nearest neighbor matching and linear model
Matching Linear model
Sample mean (1) N Sample mean (2) NNot employed after6 months 0.877 0.010**
(0.005)21,404 0.768 0.023***
(0.003)48,259
12 months 0.775 0.055*** (0.006)
21,404 0.652 0.066*** (0.004)
45,692
18 months 0.673 0.066*** (0.007)
21,404 0.577 0.052*** (0.005)
43,406
24 months 0.576 0.095*** (0.007)
21,404 0.515 0.057*** (0.005)
40,508
36 months 0.405 0.058*** (0.007)
21,404 0.416 0.020*** (0.006)
34,530
Notes: Estimates in the column “Matching” represent the average treatment effect on the treated obtained by the nearest neighbor matching. The selection equation is solved with a probit model containing covariates as in Table 3. Individual-based covariates are gen-der, age, education, tenure, all discretized according to Table 2. Episode-based covariates include duration of the episode, reason of unemployment entry, reason of unemployment exit, reason of employment exit, NACE 1-digit industry sector, year of unemployment entry, and year of unemployment exit. “Linear model” estimates are obtained from Model 3 given in Table 3.*p < 0.10.**p < 0.05.***p < 0.01.

Page 27 of 32 Srhoj and Zilic. IZA Journal of Labor Policy (2021) 11:6
Table A3 Results, unemployment re-entry: episodes by individuals with at least two appearances in the dataset
Sample mean (1) (2) (3) (4) NPanel A: Full sampleNot unemployed after6 months 0.550 0.348***
(0.004)0.319***
(0.004)0.087***
(0.006)0.013
(0.012)1,127,780
12 months 0.325 0.541*** (0.005)
0.513*** (0.005)
0.166*** (0.007)
0.095*** (0.013)
1,073,749
18 months 0.262 0.497*** (0.006)
0.471*** (0.006)
0.135*** (0.009)
0.077*** (0.015)
1,011,130
24 months 0.200 0.494*** (0.007)
0.471*** (0.007)
0.143*** (0.010)
0.104*** (0.016)
946,819
36 months 0.135 0.393*** (0.009)
0.375*** (0.009)
0.111*** (0.011)
0.112*** (0.018)
802,001
Individual-based covariates No Yes Yes Yes –Episode-based covariates No No Yes Yes –Individual fixed-effects No No No Yes –Panel B: Entrepreneurial sampleNot unemployed after6 months 0.671 0.269***
(0.006)0.261***
(0.006)0.065***
(0.006)0.020*
(0.012)30,436
12 months 0.503 0.424*** (0.006)
0.417*** (0.006)
0.132*** (0.007)
0.086*** (0.014)
29,021
18 months 0.407 0.410*** (0.007)
0.401*** (0.008)
0.100*** (0.009)
0.064*** (0.016)
27,565
24 months 0.330 0.421*** (0.008)
0.414*** (0.008)
0.107*** (0.010)
0.080*** (0.017)
25,855
36 months 0.217 0.348*** (0.010)
0.343*** (0.010)
0.076*** (0.012)
0.073*** (0.019)
22,228
Individual-based covariates No Yes Yes Yes –Episode-based covariates No No Yes Yes –Individual fixed-effects No No No Yes –
Note: The full sample consists of all unemployment episodes from January 1, 2009, until November 23, 2017, and finishing in employment. The entrepreneurial sample is a subset of a full sample containing all episodes of individuals who exited unemployment due to entrepreneurial reasons at least once. Individual-based covariates are gender, age, educa-tion, tenure, all discretized according to Table 2. Episode-based covariates include duration of the episode, reason of entering unemployment, reason of exiting unemployment, reason of employment exit, NACE 1-digit industry sector, year of entering unemployment, and year of exiting unemployment, all dummies discretized according to Table 2. Standard errors clustered at the individual level are in the parenthesis.*p < 0.10.**p < 0.05.***p < 0.01.

Page 28 of 32 Srhoj and Zilic. IZA Journal of Labor Policy (2021) 11:6
Table A4 Heterogeneous effects: COX PH model with the most comprehensive specification
Full sample Entrepreneurial sample
Hazard ratio
Hazard ratio low
Hazard ratio high
Hazard ratio
Hazard ratio low
Hazard ratio high
(1) (2) (3) (4) (5) (6)Age (years)≤20 0.645 0.518 0.803 0.870 0.672 1.12720–30 0.426 0.389 0.466 0.611 0.550 0.67930–40 0.434 0.397 0.475 0.662 0.596 0.73740–50 0.450 0.405 0.501 0.594 0.524 0.673≥50 0.533 0.459 0.619 0.718 0.599 0.860GenderFemale 0.474 0.440 0.510 0.670 0.615 0.730Male 0.438 0.409 0.469 0.621 0.573 0.673EducationElementary or less 0.608 0.515 0.717 0.742 0.613 0.899High school 0.450 0.424 0.477 0.622 0.581 0.666University or more 0.399 0.354 0.449 0.655 0.568 0.755Potential tenure≤2 years 0.431 0.368 0.504 0.635 0.529 0.7642–5 years 0.430 0.369 0.502 0.654 0.545 0.7835–10 years 0.429 0.383 0.480 0.651 0.569 0.74410–20 years 0.431 0.394 0.471 0.604 0.544 0.670≥20 years 0.510 0.454 0.573 0.670 0.584 0.769Not applicable 0.532 0.454 0.624 0.751 0.620 0.909Unemployment duration≤30 days 0.150 0.071 0.315 0.260 0.122 0.55330–90 days 0.356 0.314 0.404 0.514 0.444 0.59490–180 days 0.382 0.342 0.426 0.513 0.452 0.581180 days–1 year 0.455 0.415 0.499 0.649 0.582 0.7251–2 years 0.551 0.494 0.614 0.796 0.696 0.9112–3 years 0.636 0.523 0.773 0.853 0.665 1.095≥3 years 0.576 0.443 0.748 0.820 0.574 1.173Status before unemploymentWorking 0.446 0.419 0.473 0.641 0.597 0.688Education 0.613 0.507 0.741 0.853 0.674 1.078Inactivity 0.400 0.361 0.443 0.583 0.515 0.660Vocational training 0.592 0.324 1.083 1.390 0.592 3.260Other 0.416 0.269 0.641 0.423 0.260 0.688Employment exit reasonNot applicable 0.440 0.403 0.480 0.614 0.553 0.682Expiration of contract 0.472 0.427 0.521 0.659 0.586 0.741Expiration of seasonal contract 0.458 0.327 0.640 0.703 0.480 1.029Dismissal (econ., tech., and org. reasons) 0.501 0.456 0.551 0.684 0.612 0.764Dismissal 0.687 0.486 0.971 0.989 0.640 1.529Worker resigned 0.407 0.286 0.580 0.539 0.343 0.845Consensual resignation 0.339 0.271 0.424 0.516 0.395 0.674Firm closure 0.358 0.249 0.515 0.366 0.246 0.545Other 0.387 0.106 1.414 0.358 0.022 5.809
(Continued)

Page 29 of 32 Srhoj and Zilic. IZA Journal of Labor Policy (2021) 11:6
Figure A4 Kaplan–Meier estimates of employment survival by years.
Full sample Entrepreneurial sample
Hazard ratio
Hazard ratio low
Hazard ratio high
Hazard ratio
Hazard ratio low
Hazard ratio high
(1) (2) (3) (4) (5) (6)Year of exit2010 0.535 0.415 0.691 1.079 0.780 1.4942011 0.606 0.527 0.697 0.847 0.717 1.0002012 0.500 0.430 0.581 0.692 0.582 0.8222013 0.461 0.422 0.503 0.705 0.628 0.7912014 0.508 0.448 0.577 0.691 0.598 0.7982015 0.451 0.386 0.526 0.577 0.483 0.6882016 0.189 0.144 0.248 0.292 0.217 0.3932017 0.023 0.006 0.091 0.037 0.009 0.151
Note: The full sample consists of all unemployment episodes from January 1, 2009, until November 23, 2017, and finishing in employment. The entrepreneurial sample is a subset of a full sample containing all episodes of individu-als who exited unemployment due to entrepreneurial reasons at least once. All estimates include individual-based covariates are gender, age, education, tenure; and episode-based covariates include duration of the episode, rea-son of entering unemployment, reason exiting unemployment, reason of employment exit, NACE 1-digit industry sector, year of entering unemployment, and year of exiting unemployment, all dummies discretized according to Table 2 (excluding a covariate we use to partition the dataset). Hazard ratio low and hazard ratio high represents the 95% confidence interval.*p < 0.10**p < 0.05***p < 0.01
Table A4 Continued

Page 30 of 32 Srhoj and Zilic. IZA Journal of Labor Policy (2021) 11:6
Figure A5 Heterogeneous effects: age.
Figure A6 Heterogeneous effects: gender.

Page 31 of 32 Srhoj and Zilic. IZA Journal of Labor Policy (2021) 11:6
Table A5 OLS and Cox proportional hazard estimates of firm survival (unlimited liability firms)
Dependent variable (method)
Firms survive (OLS) Survival (COX PH)
6 months 12 months 18 months 24 months 36 months Coefficient Hazard ratioGrant received
0.089*** 0.148*** 0.069*** 0.049*** 0.015 −0.272*** 0.762(0.006) (0.007) (0.009) (0.010) (0.013) (0.021) [0.696, 0.835]
Observations 61,241 56,384 51,758 48,029 40,997 61,953R2 0.030 0.045 0.036 0.042 0.047 0.054
Note: The first five columns present the OLS estimate of the received grant effect on the corresponding indicator of firm survival (with an associated sample truncation). The sixth and seventh columns present results of the estima-tion of the Cox proportional hazard model of the received grant effect on survival probability (the sixth column is coefficient, while the seventh is hazard ratio). All estimates include dummies for the NACE 2-digit industry sector of the firm, dummies for the county of the firm’s headquarters, and dummies for the year of the firm opening. Parentheses contain standard errors clustered at the NACE 2-digit level, while brackets contain a 95% confidence interval of hazard ratio (last column).*p < 0.10.**p < 0.05. ***p < 0.01.
A.2 Unlimited liability firms

Page 32 of 32 Srhoj and Zilic. IZA Journal of Labor Policy (2021) 11:6
Table A6 Descriptive statistics of limited liability firms
Grant No grant
M Median SD M Median SDRegistered capita (in euro)Sales (in euro)
1,444 1.333 7,178 6,166 2,667 29,202
t 13,225 5,245 27,698 26,134 5,383 56,868t+1 35,641 16,234 71,016 103,409 24,615 522,825t+2 45,859 19,620 108,306 137,826 28,229 816,707Number of employeest 1.321 1.000 1.230 1.341 1.000 2.689t+1 1.529 1.000 1.629 2.201 1.000 6.154t+2 1.633 1.000 1.784 2.618 1.000 9.596At least one employeet 0.917 0.542t+1 0.906 0.649t+2 0.843 0.664At least two employeest 0.234 0.259t+1 0.301 0.369t+2 0.363 0.406Firm survivest+1 0.883 0.915t+2 0.759 0.824Year of firm registration2010 0.005 0.1062011 0.023 0.1082012 0.033 0.1152013 0.369 0.1712014 0.137 0.1642015 0.223 0.1512016 0.210 0.186Sample size 4,154 42,182
Note: The sample consists of all new limited liability firms registered from January 1, 2010, until December 31, 2016. For brevity, we do not show NACE 2-digit industry dummies, dum-mies for the county of the firm’s headquarters, dummies for types of firm legal forms, and dummies for the number of months that a firm was officially open.
A.3 Limited liability firms