1 big data, causal inference, and instrumental variables center for health policy and healthcare...
TRANSCRIPT

1
Big Data, Causal Inference, and Instrumental Variables
Center for Health Policy and Healthcare ResearchJanuary 22, 2015
Steven D. Pizer, PhD
Associate Professor of Health Economics
Department of Pharmacy and Health Systems Sciences
School of Pharmacy, Bouvé College of Health Sciences
Director, Health Care Financing & Economics (HCFE)
U.S. Department of Veterans Affairs

Goals
• What’s this big data thingy and why is it a big deal?
• Tutorial on selection bias and instrumental variables
• Application using practice patterns as natural experiments

Goals
• What’s this big data thingy and why is it a big deal?
• Tutorial on selection bias and instrumental variables
• Application using practice patterns as natural experiments

What Is Big Data in Healthcare?
• Data for comparative effectiveness research is being transformed– Large, multi-state, multi-payor claims
databases– Labs, imaging, vitals, notes will be linked– VA, Kaiser already there
• Regional Health Information Exchanges– Improve continuity of care– Great resource for research
4

Big Data: Great at Finding Correlations
• Machine learning algorithms and predictive modeling are built on finding relationships in data
• Netflix: People who like Breaking Bad have a good chance of liking the Walking Dead
• Does correlation have to be causal for it to be predictively useful?
5

Spurious Correlations
• Statistical significance: Standard threshold is 5%, meaning would be observed by chance 1 out of 20 times
• But if you look at enough relationships you’ll find “significant” ones by chance
• Spurious means there’s no real connection
6

US Spending on Science, Space and Technology Correlates with Suicides by Hanging, Strangulation and Suffocation
7http://www.tylervigen.com/view_correlation?id=1597

Number of People Who Drowned by Falling into a Swimming Pool Correlates with Number of Nicholas Cage Films
8http://www.tylervigen.com/view_correlation?id=359

If We Don’t Think About Causation . . .
• Our predictions can be fragile
• Our interventions can be misguided
• Should we try to improve pool safety by keeping Nicholas Cage out of the movies?
9

Big Data Analysis Requires Observational Study Methods• Big data is not randomized
• We have to compare treatments when patients and providers choose what they think is best
• We want to choose treatments and design interventions
• Causal inference is crucial10

Goals
• What’s this big data thingy and why is it a big deal?
• Tutorial on selection bias and instrumental variables
• Application using practice patterns as natural experiments

Selection Bias
• Selection bias is well known.– Patients who get treatment are different from
those who don’t– Randomized controlled trials eliminate it
• Selection into treatment often correlated with outcome.– For example . . .
12
A study of low-income housing residents has documented that the more television people say they watched, the less active they were, researchers from Dana-Farber Cancer Institute and colleagues report.
The findings of television's effects on physical activity are the first to be based on objective measurements using pedometers, rather than the study subjects' memories of their physical activity, say the researchers. The study will be published online by the American Journal of Public Health on July 27 and later in the journal's September 2006 issue.
Study Suggests TV-watching Lowers Physical Activity27 Aug 2006


Reporting Associations Without Causal Model• This stuff makes me crazy
• It undermines the credibility of research
• Can we do better?
• We have to think much more carefully about causation and bias
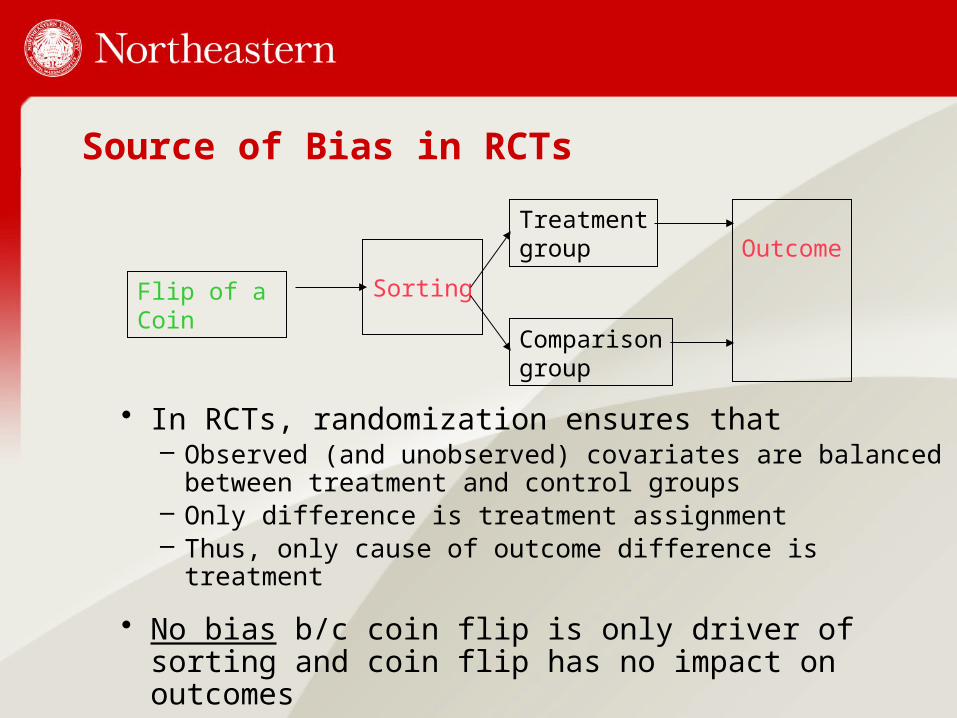
Source of Bias in RCTs
• In RCTs, randomization ensures that– Observed (and unobserved) covariates are
balanced between treatment and control groups– Only difference is treatment assignment– Thus, only cause of outcome difference is
treatment
• No bias b/c coin flip is only driver of sorting and coin flip has no impact on outcomes
Flip of a Coin
Sorting
Treatmentgroup
Comparisongroup
Outcome

Sources of Bias in Observational Studies
• In non-randomized studies, things get messy b/c there are many drivers of sorting that also affect outcomes.
Patient characteristicsObserved: health, income, ed, dist.Unobserved: health,skills, attitudes
Provider characteristicsObserved: staff,costs, congestion,Unobserved: culture, attitudes,leadership
Sorting
Institutional factorslaws, programs
Treatmentgroup
Comparisongroup
Outcome

What Can Be Done About Selection Bias?• Think carefully about causation and include as
many of the important factors as possible (risk adjustment)
• Use a matching technique, like propensity scores, to make treatments and controls more comparable
• Use a quasi-experimental design, like instrumental variables, to exploit natural randomness
18
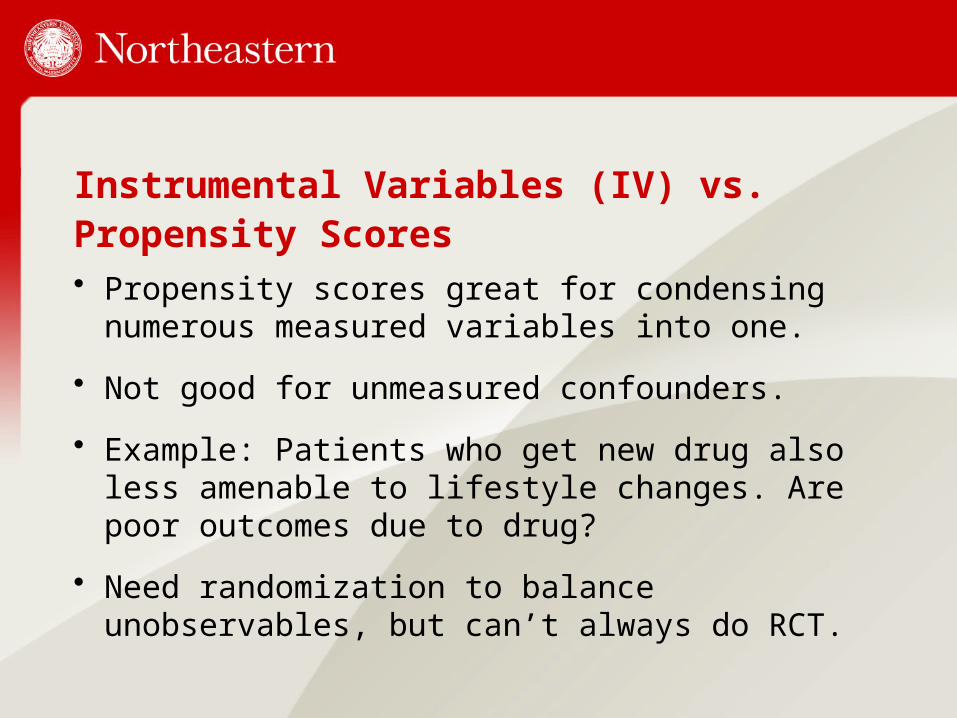
Instrumental Variables (IV) vs. Propensity Scores• Propensity scores great for condensing
numerous measured variables into one.
• Not good for unmeasured confounders.
• Example: Patients who get new drug also less amenable to lifestyle changes. Are poor outcomes due to drug?
• Need randomization to balance unobservables, but can’t always do RCT.
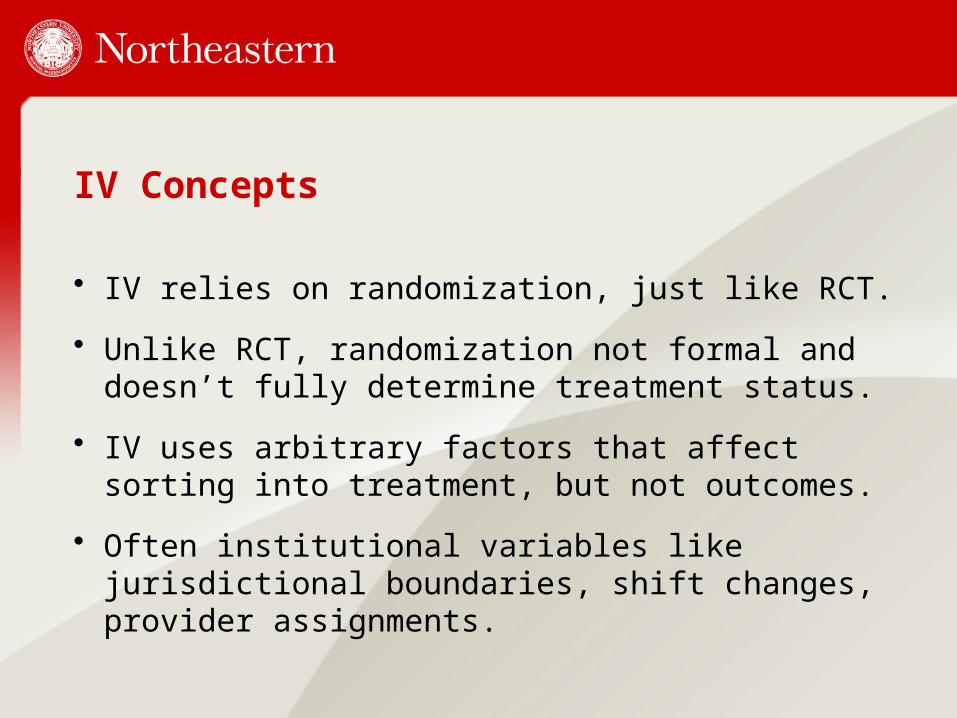
IV Concepts
• IV relies on randomization, just like RCT.
• Unlike RCT, randomization not formal and doesn’t fully determine treatment status.
• IV uses arbitrary factors that affect sorting into treatment, but not outcomes.
• Often institutional variables like jurisdictional boundaries, shift changes, provider assignments.

Translating Diagram Into EquationsPatient characteristics
Provider characteristics
Sorting
Institutional factors
Treatment
Comparison
Outcome
Eq 1: Outcome = Treatment + Xpatient + Xprovider + u1
Eq 2: Treatment = Xpatient + Xprovider + Xinstitutions + u2
Selection bias occurs in Eq 1 when u1 is correlated with u2,
and therefore with Treatment.

IV: A General Approach
• Applicable to linear or nonlinear models with additive errors.
• Estimate Eq 2 (like propensity score estimation).
• Construct predicted value of u2 (u2hat).
• Add u2hat to outcome equation to control for correlated unobservables.
Eq 1: Outcome = O(Treat, u2hat, Xpatient, Xprovider) + u1
Eq 2: Treatment = T(Xpatient, Xprovider, Xinstitutions) + u2

Why Does IV Work?
• u2hat measures all the unobserved factors that affect Treatment– Includes variables that cause bias like unmeasured pain as
well as random factors– The variation in Treatment that remains after all the
controls is variation due to Xinstitutions, which are not related to outcomes
• When we control for u2hat, Treatment is no longer correlated with u1, so estimates no longer biased
23
Eq 1: Outcome = O(Treat, u2hat, Xpatient, Xprovider) + u1Eq 2: Treatment = T(Xpatient, Xprovider, Xinstitutions) + u2

IV: Issues
• Must have identifying instrument(s): Xinstitutions in this case.
• Identifying instrument(s) must be strongly correlated with Treatment and excludable from Outcome equation.
• Excludable means it has no effect on outcome except through its effect on treatment
Eq 1: Outcome = O(Treat, u2hat, Xpatient, Xprovider) + u1
Eq 2: Treatment = T(Xpatient, Xprovider, Xinstitutions) + u2

IV Issues: LATE
• LATE: Local Average Treatment Effects.
• Instrument may not affect everyone equally.
• IV estimate only applies to segment of population “in play”.
• Example: Prescriber practice pattern only applies to those who would consider medication change.

Goals
• What’s this big data thingy and why is it a big deal?
• Tutorial on selection bias and instrumental variables
• Application using practice patterns as natural experiments

IV Application: Capitalizing on Prescribing Pattern Variation to Compare Medications for Type 2 Diabetes
• Current work with Julia Prentice, David Edelman, Walid Gellad, and Paul Conlin
• Published in Value in Health, 2014

Background
• Metformin (MET) is established as 1st line treatment for type 2 diabetes.
• Diabetes is progressive, so additional meds often needed: sulfonylureas (SU), TZDs, insulin, newer drugs.
• TZDs have reputation for safety issues
• How does SU compare to TZD? TZD: Thiazolidinedione, e.g., pioglitazone

Study Population
• All patients with VA Rx for DM meds in 2000-2005; follow through 2010.
• Include patients with history of metformin as 1st med and SU or TZD as 2nd med.
• To capture outcomes, include patients with VA and Medicare in baseline year (prior to 2nd med start)– Included 51% of patients from prior step
30
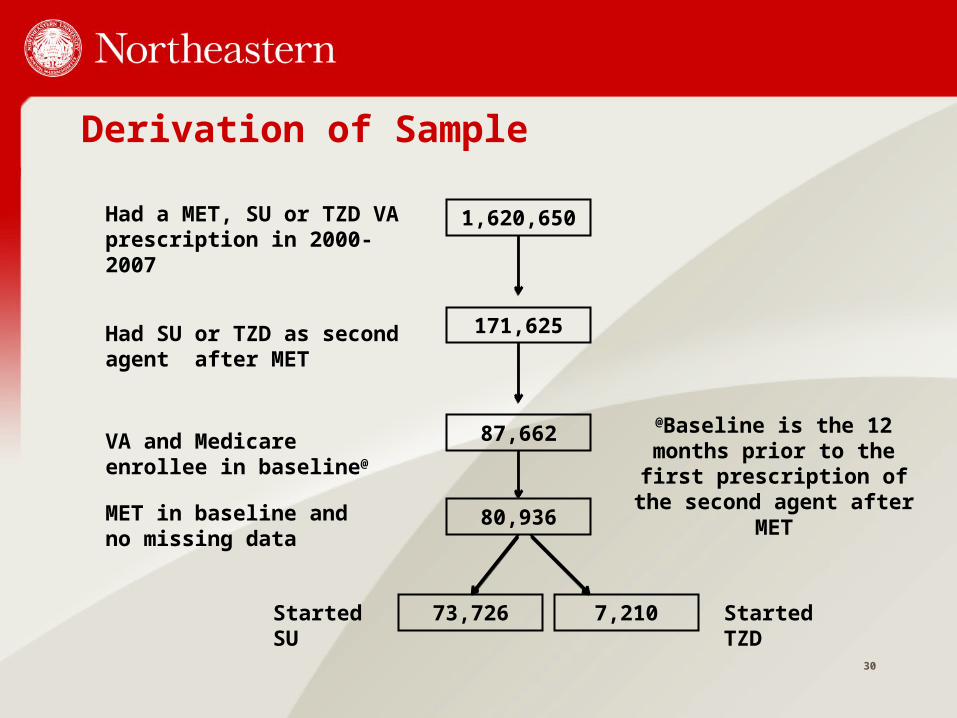
Derivation of Sample
Had a MET, SU or TZD VA prescription in 2000-2007
Had SU or TZD as second agent after MET
VA and Medicare enrollee in baseline@
MET in baseline and no missing data
Started SU Started TZD
1,620,650
171,625
87,662
80,936
73,726 7,210
@Baseline is the 12 months prior to the first prescription
of the second agent after MET
Treatment Variables
• Treatment: Patients who initiated SU compared to patients who initiated TZD
• Large majority stayed on whatever 2nd drug they initiated – 81% of SU initiators with at least 2 years of
follow-up were still on SU after 2 years– 64% of TZD initiators with at least 2 years
follow-up remained on TZD 2 years later

Outcome Variables
• Mortality
• AMI or stroke
• Hospitalization for an ambulatory care-sensitive condition (ACSC)– 13 adult conditions defined by AHRQ:– E.g., CHF, COPD, PN, dehydration, long-term
complications of diabetes, UTI, asthma, angina, uncontrolled diabetes, short-term complications of diabetes, lower extremity amputation
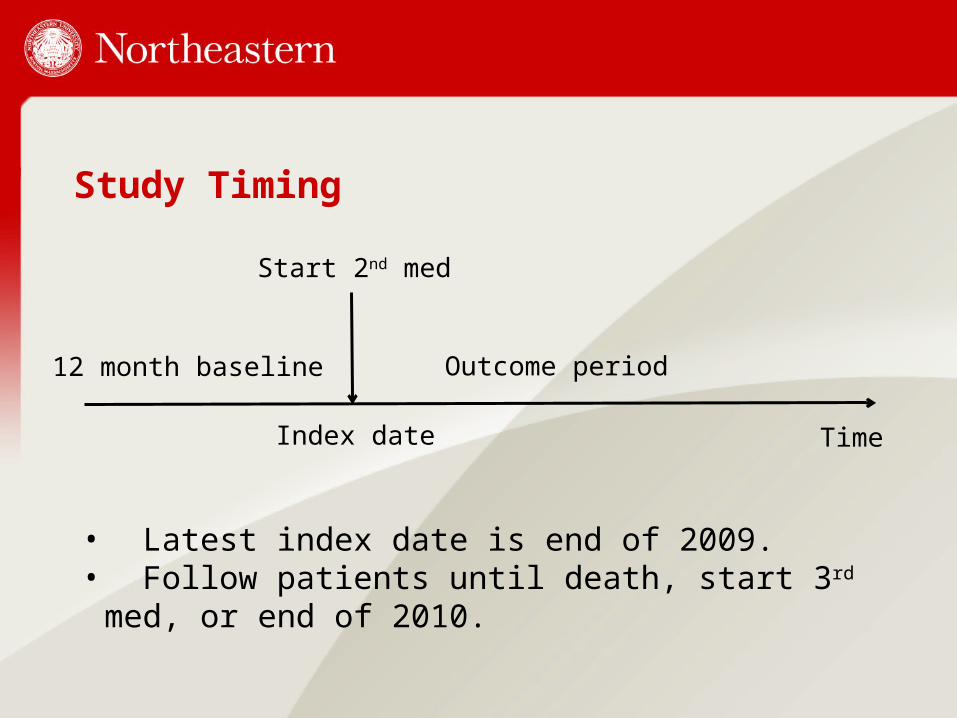
Study Timing
Time
12 month baseline
Index date
Start 2nd med
Outcome period
• Latest index date is end of 2009.• Follow patients until death, start 3rd med, or end of 2010.

Potential Selection Bias
• What if patients receive SU because they are healthier or sicker in unmeasured ways?
• Outcomes would be better or worse because of unobserved baseline health differences.

Solution: Instrumental Variables
• Can we find a variable that acts like randomization in RCT?
• Yes! Provider’s past prescribing pattern not affected by individual patient’s health status. – Wang et al., NEJM 2005; Stukel et al.,
JAMA 2007, Brookhart et al., Med Care 2007
– Especially true in VA because primary care docs are often arbitrarily assigned.

IV Construction
• Provider-level prescribing patterns– Share of SU or TZD Rx in 12 mos prior to
index date written for SU– Calculated at clinic level if provider <10 Rx– Provider assigned at index date
12 month baseline
Start SU or TZD
Outcome period
Provider-level prescribing patterns

Is IV Excludable from Outcome Equation?• What if provider’s prescribing pattern is
correlated with provider unobservables that affect outcomes?
• Provider-level quality of diabetes care could affect prescribing and outcomes too.
• Solution: Control for provider-level quality of diabetes care.
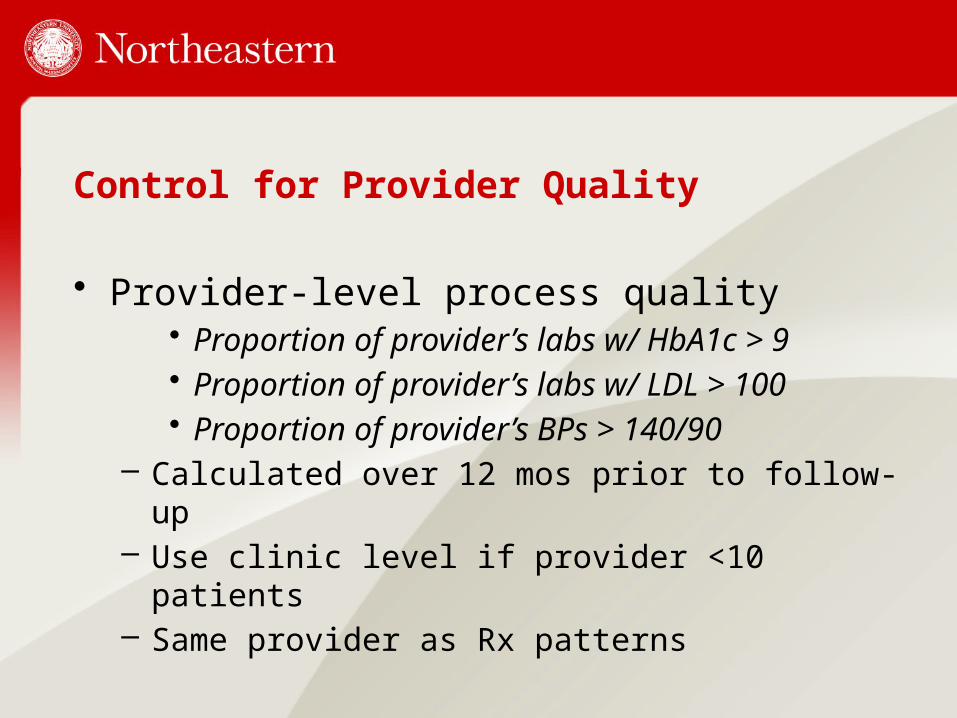
Control for Provider Quality
• Provider-level process quality• Proportion of provider’s labs w/ HbA1c > 9• Proportion of provider’s labs w/ LDL > 100• Proportion of provider’s BPs > 140/90
– Calculated over 12 mos prior to follow-up– Use clinic level if provider <10 patients– Same provider as Rx patterns
Other Control Variables• Age, race, sex, baseline HbA1c, serum
creatinine, urine microalbumin, BMI
• Components of diabetes severity index (Young et al 2008)
• Dx-based comorbidity groups (Elixhauser et al 1998)
• Year effects, hospital effects

Descriptive StatisticsVariable Doc in Bottom
50% SU RxDoc in Top 50% SU
Age 69.2 69.2
Male 98% 98%
White 87% 90%
HbA1c > 9 8% 8%
CHF 13% 13%
HTN 84% 84%
COPD 23% 24%
Provider HbA1c > 9 41% 41%
Provider LDL > 100 38% 38%
Mortality 9% 10%
ACSC Hosp 17% 18%

Outcome Models: First Stage
• Dependent variable: Receipt of SU Rx at index date
• Independent variables: Provider SU prescribing rate in baseline; Baseline patient characteristics, Baseline provider process quality
• Estimated by probit regression, saving residuals
41

Outcome Models: Second Stage
• Dependent variables: Time to mortality, ACSC hospitalization, or stroke/AMI
• Independent variables: Baseline patient characteristics, provider process quality, treatment choice, residual from 1st stage
• Cox proportional hazards model, censoring on death, start of 3rd med, end of 2010.

Falsification Test
• Estimate outcome models on samples that ought not to be affected by SU prescribing– MET initiators followed for 2 years with no new
drugs– MET-Insulin initiators with no additional drugs
• Because these groups were not considering SU, their provider’s SU prescribing rate should not affect their outcomes (unless it’s correlated with omitted variables)
43

Results: Effects of SU Choice (adjusted hazard ratios)
44
Mortality ACSC hosp Stroke or AMI0
0.2
0.4
0.6
0.8
1
1.2
1.4
1.6
1.8

Results: Falsification Test MET Sample
45
Mortality ACSC hosp Stroke or AMI1
1.05
1.1
1.15
1.2
1.25
1.3
1.35

Results: Falsification TestInsulin Sample
46
Mortality ACSC hosp0
0.2
0.4
0.6
0.8
1
1.2
1.4

Discussion
• Choice of SU has consistently large, statistically significant adverse effects on risk of mortality and ACSC hospitalization.
• These previously undetected risks imply that TZDs are safer than SU (contrary to common belief).
• Falsification tests demonstrate that SU prescribing rate does not affect outcomes except through SU use (i.e. instrumental variable is good).

Value of Instrumental Variables
• 1st stage treatment equation showed that sicker patients got TZD and had tighter A1c control.
• Naïve comparison was biased: SU treatment looked good because patients were already healthier.
• Caution! SU prescribers less likely to control LDL, so prescribing pattern not excludable unless LDL variable included in model.

Impact
• Briefing for VA PBM leadership
• Brief for VA leadership circulated to regions
• JAMA Forum article
• Will this change practice?
49

Sometimes IV Beats RCT . . .