1 bootstrap confidence intervals for three-way component methods henk a.l. kiers university of...
TRANSCRIPT

1
Bootstrap Confidence Intervals for Three-way
Component Methods
Henk A.L. Kiers
University of GroningenThe Netherlands

2
i = 1......I
j=1 . . . . . . . JVARIABLES
k=1
K
SUBJECTs
OCCASIONS
three-way data
X

3
Three-way Methods: Tucker3
Xa = AGa(CB) + Ea
A (IP), B (JQ), C (KR) component matricesGa matricized version of G (PQR) core array
CP = Candecomp/ParafacXa = AGa(CB) + Ea
G (RRR) superdiagonal
Practice:
• three-way methods applied to sample from population
• goal: results should pertain to population
i = 1......I
j=1 . . . . . . . JVARIABLES
k=1
K
SUBJECTs
OCCASIONS
three-way data
X

4
Example (Kiers & Van Mechelen 2001):
• scores of 140 individuals, on 14 anxiousness response scales in 11 different situations
• Tucker3 with P=6, Q=4, R=3 (41.1%) Rotation: B, C, and Core to simple structure

5
FactorLoadings
Exhila-ration
Auton.physiol.
Sick-ness
Excret.need
Heart beats faster -0.06 0.57 -0.07 -0.18
“Uneasy feeling” -0.28 0.25 0.07 -0.06
Emotions disruptaction
-0.18 0.20 0.23 -0.01
Feel exhilaratedand thrilled
0.46 0.11 0.05 0.09
Not want to avoidsituation
0.41 -0.11 0.06 -0.02
Perspire -0.07 0.52 -0.03 -0.03
Need to urinatefrequently
0.06 0.21 -0.03 0.48
Enjoy thechallenge
0.48 0.09 0.08 0.01
Mouth gets dry 0.08 0.36 0.00 0.32
Feel paralyzed -0.06 0.18 0.28 0.19
Full feeling instomach
0.00 0.00 0.79 -0.12
Seek experienceslike this
0.48 0.12 0.09 -0.03
Need to defecate -0.09 -0.12 -0.09 0.72
Feel nausea -0.14 -0.18 0.45 0.25
Results for example data Kiers & Van Mechelen 2001:
B

6
Situation TypeLoadings
Performancejudged by
others
Inanimatedanger
Alone inwoods
Auto trip 0.13 0.15 -0.11
New date 0.26 0.15 -0.30
Psychologicalexperiment
0.04 0.09 0.13
Ledge high onmountain side
0.04 0.77 0.09
Speech beforelarge group
0.49 -0.14 -0.11
Consult counsel.bureau
0.25 -0.07 0.19
Sail boat on roughsea
0.15 0.53 -0.07
Match in front ofaudience
0.38 0.11 -0.09
Alone in woods atnight
0.09 0.05 0.89
Job-interview 0.48 -0.13 -0.04
Final exam 0.46 -0.16 0.16
C

7
Performance judged by othersCore Exhil Auto
phys.Sick-ness
Excr.need
dim. 1 -36.4 1.0 0.4 0.2dim. 2 -0.2 0.7 -0.1 36.9dim. 3 -0.5 0.1 -1.2 -0.9dim. 4 -0.8 -1.6 0.3 -2.2dim. 5 -0.4 1.0 34.9 0.2dim. 6 -1.0 40.0 1.2 1.2
Fit 6.6 % 7.9 % 5.8 % 6.2 %Inanimate danger
Exhil Autophys.
Sick-ness
Excr.need
dim. 1 -1.6 -3.4 -2.0 -1.0dim. 2 2.9 3.5 2.4 15.2dim. 3 -0.4 2.6 -1.9 -1.9dim. 4 -30.2 11.1 11.8 9.0dim. 5 -0.4 -4.0 6.5 -4.7dim. 6 2.7 11.2 0.5 -0.6
Fit 4.0 % 1.5 % 1.1 % 1.4 %Alone in woods
Exhil Autophys.
Sick-ness
Excr.need
dim. 1 -2.5 -4.3 -1.7 2.2dim. 2 1.6 -0.5 3.9 12.4dim. 3 -26.4 18.5 8.4 6.6dim. 4 -0.4 0.4 -0.8 -2.4dim. 5 3.0 1.7 9.8 2.2dim. 6 1.2 5.0 -4.8 -7.0
Fit 3.0 % 1.9 % 0.9 % 0.9 %
Core

8
Is solutions stable?
Is solution ‘reliable’? Would it also hold for population?
Kiers & Van Mechelen report split-half stability results:
Split-half results: rather global stability measures

9
How can we assess degree of stability/reliability of individual results?
confidence intervals (CI) for all parameters
• not readily available
• derivable under rather strong assumptions (e.g., normal distributions, full identification)
• alternative:
BOOTSTRAP

10
BOOTSTRAP• distribution free
• very flexible (CI’s for ‘everything’)
• can deal with nonunique solutions
• computationally intensive

11
Bootstrap procedure:Analyze sample data X (IJK) by desired method
sample outcomes (e.g., A, B, C and G)
Repeat for b=1:500
• draw sample with replacement from I slabs of X Xb
(IJK)
• analyze bootstrap sample Xb in same way as sample outcomes b (e.g., Ab, Bb, Cb and Gb)
For each individual parameter :
• 500 values available
• range of 95% middle values “95% percentile interval” ( Confidence Interval)

12
Basic idea of bootstrap:
• distribution in sample = nonparametric maximum likelihood estimate of population distribution
• draw samples from estimated population distribution, just as actual sample drawn from population
From which mode do we resample?
Answer: mimic how we sampled from population
• sample subjects from population resample A-mode
13
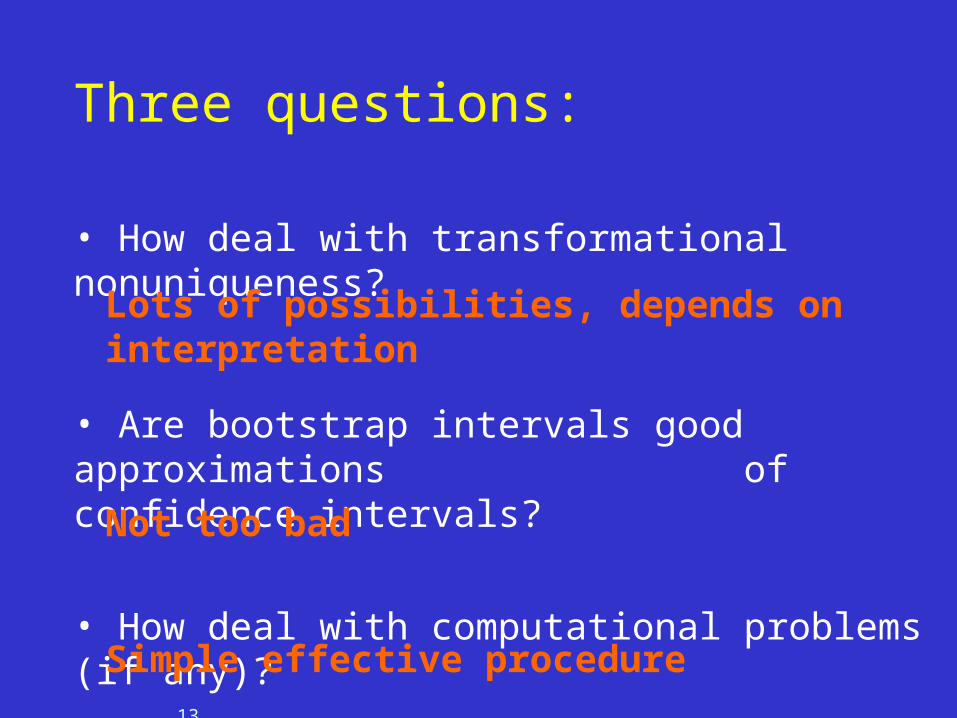
Three questions:
• How deal with transformational nonuniqueness?
• Are bootstrap intervals good approximations of confidence intervals?
• How deal with computational problems (if any)?
Lots of possibilities, depends on interpretation
Not too bad
Simple effective procedure

14
1. How to deal with transformational nonuniqueness?
• identify solution completely
• identify solution up to permutation/reflection
for CP and Tucker3
• identify solution up to orthogonal transformations
• identify solution up to arbitrary nonsingular transformations
only for Tucker3

15
Identify solution completely:
uniquely defined outcome parameters bootstrap straightforward (CI’s directly available)
CP and Tucker3 (principal axes or simple structure) - solution identified up to scaling/permutation
Both cases: - further identification needed

16
does not affect fit
Identify solution up to permutation/reflection
outcome parameters b may differ much, but maybe only due to ordering or sign
bootstrap CI’s unrealistically broad !
how to make b’s comparable?
Solution:
reorder and reflect columns in (e.g.) Bb, Cb
such that Bb, Cb optimally resemble B, C

17
cannot fully mimic sample & analysis
processmore realistic solution
Identified up to perm./refl.
takes orientation, order, (too?!) seriously
direct bootstrap CI’sCompletely identified
conspros
e.g., two equallystrong components
unstable order

18
IntermezzoWhat can go wrong when you take orientation too seriously?
Two-way Example Data: 100 x 8 Data set
PCA: 2 Components
Eigenvalues: 4.04, 3.96, 0.0002, (first two close to each other)
PCA (unrotated) solutions for variables (a,b,c,d,e,f,g,h)
bootstrap 95% confidence ellipses*
*) thanks to program by Patrick Groenen (procedure by Meulman &
Heiser, 1983)

19
Data Bootstrap 1 Bootstrap 2 Bootstrap 3 a -0.6 0.8 -0.6 0.8 -1.0 -0.3 0.8 0.6 b -0.8 0.7 -0.7 0.7 -0.9 -0.4 0.7 0.7 c -0.5 0.9 -0.5 0.9 -1.0 -0.2 0.9 0.5 d -0.8 0.6 -0.8 0.6 -0.8 -0.6 0.6 0.8 e -0.8 -0.6 -0.8 -0.6 0.3 -1.0 -0.7 0.7 f -0.7 -0.7 -0.7 -0.7 0.5 -0.9 -0.8 0.6 g -0.9 -0.5 -0.9 -0.5 0.2 -1.0 -0.6 0.8 h -0.6 -0.8 -0.7 -0.8 0.6 -0.8 -0.9 0.5
Look at loadings for data and some bootstraps:
Loadings Bootstrap based standard errors
a -0.6 0.8 0.6 0.5 b -0.8 0.7 0.5 0.6 c -0.5 0.9 0.6 0.5 d -0.8 0.6 0.5 0.6 e -0.8 -0.6 0.6 0.5 f -0.7 -0.7 0.6 0.5 g -0.9 -0.5 0.5 0.5 h -0.6 -0.8 0.6 0.5
… leading to standard errors: ...
What caused these enormous ellipses?

20
Conclusion: solutions very unstable, hence: loadings seem very uncertain
Configurations of subsamples very similar
So: We should’ve considered the whole configuration !
However ….

21
Identify solution up to orthogonal transformations
Tucker3 solution with A, B, C columnwise orthonormal: any rotation gives same fit (counterrotation of core) outcome parameters b may differ much,
but maybe only due to coincidental ‘orientation’ bootstrap CI’s unrealistically broad
Make b’s comparable: rotate Bb, Cb, Gb such that they optimally resemble B, C, G
How?• minimize f1(T)=||BbT–B||2 and f2(U)=||CbU–C||2
• counterrotate core: Gb(UT)• minimize f3(S)=||SGb–G||2
• use Bb* = BbT , Cb* = CbU, Gb* = SGb to determine 95%CI’s
comparable across bootstraps

22
Notes:
• first choose orientation of sample solution (e.g., principal axes or other)
• order of rotations (first B and C, then G): somewhat arbitrary, but may have effect

23
Identify solution up to nonsingular transformations
....analogously..... transform Bb, Cb, Gb so as to optimally resemble B, C, G

24
Expectation:
the more transformational freedom used in bootstraps
the smaller the CI’s
Example:
• anxiety data set (140 subjects, 14 scales, 11 situations)
• apply 4 bootstrap procedures
• compare bootstrap se’s of all outcomes

25
BootstrapMethod
mean se (B)
mean se (C)
mean se (G)
Principal Axes
.085 .101 3.84
Simple Structure
.085 .093 2.77
Orthog Matching
.059 .088 2.20
Oblique Matching
.055 .076 2.17
Some summary results:

26
Now what CI’s did we find for Anxiety data
Plot of confidence ellipses for first two and last two B components

27
Confidence intervals for Situation Loadings

28
Confidence intervals for Higest Core Values

29

30
2. Are bootstrap intervals good approximations of Confidence Intervals?
95%CI should contain popul.values in 95% of samples
“coverage” should be 95%
Answered by SIMULATION STUDY
Set up:
• construct population with Tucker3/CP structure + noise
• apply Tucker3/CP to population population parameters
• draw samples from population
• apply Tucker3/CP to sample and construct bootstrap CI’s
• check coverage: how many CI’s contain popul. parameter

31
Design of simulation study:
• noise: low, medium, high
• sample size (I): 20, 50, 100
• 6 size conditions: (J=4,8, K=6,20, core: 222, 333, 432)
Other Choices
• number of bootstraps: always 500
• number of populations: 10
• number of samples 10
Each cell: 1010500 = 50000 Tucker3 or CP analyses(full design: 336=54 conditions)

32
Procedure B C G
Bootstrap forCANDECOMP/PARAFAC
95% 94% -
Tucker3 principal axes,bootstraps permuted/reflected
91% 85% 87%
Tucker3 simple structure,bootstraps permuted/reflected
92% 94% 93%
Tucker3 simple structure,bootstraps optimally rotated
92% 94% 93%
Tucker3 simple structure,bootstraps optimally transformed
95% 94% 95%
Tucker3 principal axes,bootstraps permuted/reflected,nonsimple B and C used in construction
95% 94% 94%
Here are the results
Should be close to 95%

33
Procedure B C G
CP 91.5-98.2(1.4, .3)
91.8-97.4(.4,.5)
-
Tucker3 princ 81.2-96.8(1.8,.7)
72.2-92.1(2.0,1.9)
75.8-92.8(3.2,1.6)
Tucker3 simp 84.3-95.8(.8,.5)
91.8-96.5(.5,.6)
88.8-96.8(1.6,.4)
Tucker3 rotated 84.2-95.8(.8,.5)
92.0-95.7(.5,.7)
86.0-95.0(1.9,.9)
Tucker3 transformed 91.1-98.1(1.9,.5)
92.1-95.6(.5,.7)
89.4-96.8(1.5,.6)
Tucker3 nonsimpleB and C
90.7-98.1(1.2,.5)
86.4-97.2(2.8,.5)
85.4-98.3(2.0,.3)
Some details: ranges of values per cell in design (and associated se’s)
•Some cells really low coverage
•Most problematic cases in
conditions with small I (I=20)

34
3. How deal with computational problems (if any)
Is there a problem?
Computation times per 500 boostraps:(Note: largest data size: 100 8 20)
CP: min 4 s, max 452 s Tucker3 (SimpStr): min 3 s, max 30 s Tucker3 (OrthogMatch): min 1 s, max 23 s
Problem most severe with CP

35
Idea: Start bootstraps from sample solution
Problem: May detract from coverage
Tested by simulation:
• CP with 5 different starts per bootstrap
vs
• Fast bootstrap procedure
How deal with computational problems for CP?

36
Results:
Fast method about 6 times faster (as expected)
Coverage
Optimal method: B: 95.5% C: 95.1%
Fast method: B: 95.3% C: 94.7%
• Time gain enormous
• Coverage hardly different

37
Conclusion & Discussion
• Bootstrap CI’s seem reasonable
• Matching makes intervals smaller
• Computation times for Tucker3 acceptable, for CP can be decreased by starting
each bootstrap in sample solution

38
Conclusion & Discussion• What do bootstrap CI’s mean in case of matching?
• 95% confidence for each value ? - chance capitalization- ignores dependence of parameters
(they vary together)
Show dependence by bootstrap movie...!?!
Develop joint intervals (hyperspheres)...?
• Sampling from two modes (e.g., A and C) ?
some first tests show that this
works
some first tests show that this does not work