1 budapest university of technology and economics department of measurement and information systems...
TRANSCRIPT

1Budapest University of Technology and EconomicsDepartment of Measurement and Information Systems
Cloud Based Analytics forCloud Based Applications
András Pataricza1, Imre Kocsis1, Zsolt Kocsis2 et al.
1Dept. of Meas. and Information Systems, BME, Hungary2IBM CAS Budapest, Hungary
{pataric,ikocsis}@mit.bme.huICA CON 2012, April 20, 2012
2
Clouds for demanding applications?
Standard infrastructure vs
demanding application?
Standard infrastructure vs
demanding application?

3
Clouds for demanding applications?
Virtual Desktop Infrastructure Telecommunications
Extra-functional reqs: throughput, timeliness, availability
„Small problems” have high impact(soft real time)
Extra-functional reqs: throughput, timeliness, availability
„Small problems” have high impact(soft real time)
4
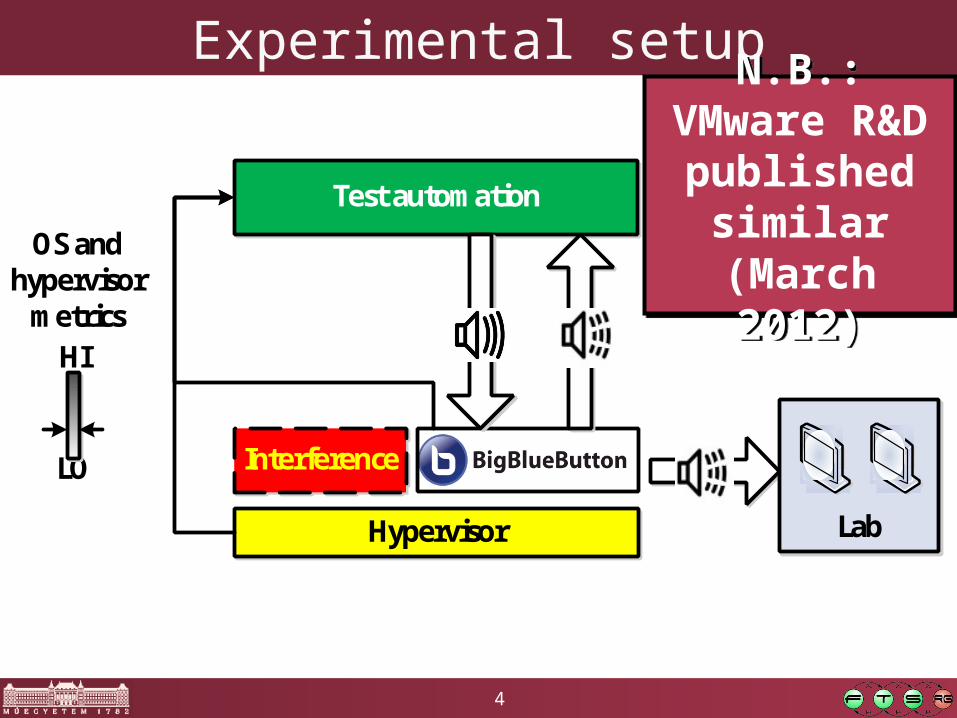
Test automation
Hypervisor
Interference
Lab
OS and hypervisor
metrics
OS and hypervisor
metrics
LOLO
HIHI
Experimental setupN.B.: VMware R&D published
similar(March 2012)
N.B.: VMware R&D published
similar(March 2012)

5
IT EDA is Big Data!
Hypervizor (host + VMs), OS, application, ...Which determine the QoS?Which determine the QoS?

6
IT EDA is Big Data!High availabilty, rare faults
Rare events: granularity AND long horizon
Searching for outliers
High availabilty, rare faults
Rare events: granularity AND long horizon
Searching for outliers
7
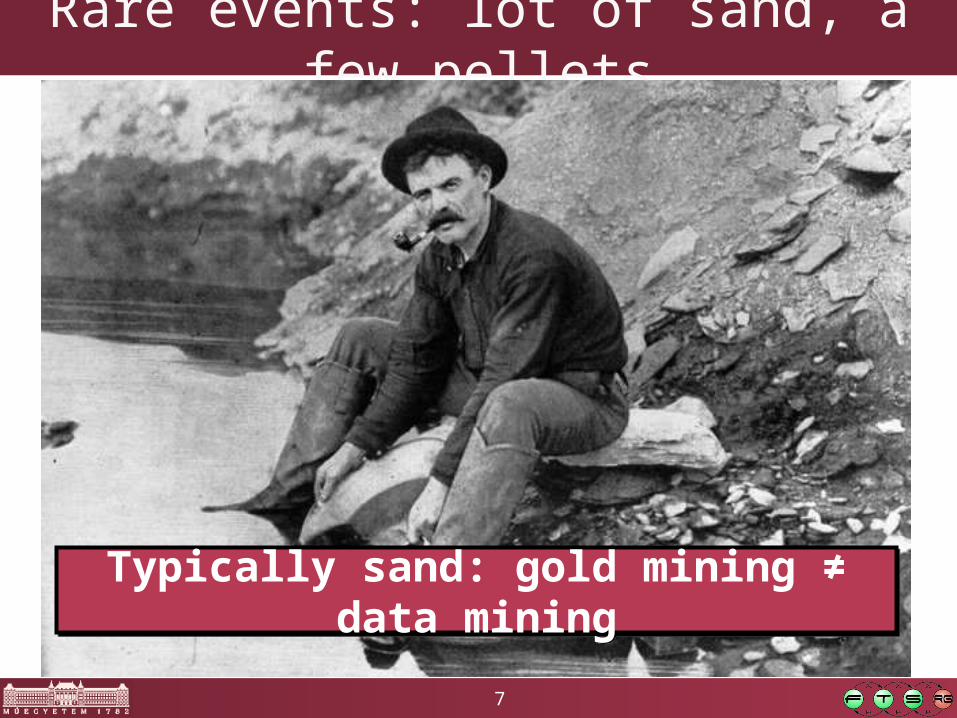
Rare events: lot of sand, a few pellets
Typically sand: gold mining ≠ data miningTypically sand: gold mining ≠ data mining

8
Visual analytics = causal insight
8
Computing power use = CPU use ×CPU clock rate (const.)Should be pure proportional
Correlation coefficient:0.99998477434137Well-visible, but numerically suppressed
Origin???
Computing power use = CPU use ×CPU clock rate (const.)Should be pure proportional
Correlation coefficient:0.99998477434137Well-visible, but numerically suppressed
Origin???

9
Visual analytics
Noisy…High frequency components dominateBut they correlate (93%!)YOU DON’T SEE IT
Noisy…High frequency components dominateBut they correlate (93%!)YOU DON’T SEE IT
10
Dangers in a standard cloud for demanding apps?

11
Impacts of resource sharing?
Self-inducedSelf-induced Parasitic influenceParasitic influence

12
Short transient faults – long recovery
8 sec platform overload
8 sec platform overload
30 sec service outage
30 sec service outage
120 sec SLA violation120 sec SLA violation
As if you unplug your
desktop for a second...
As if you unplug your
desktop for a second...
13
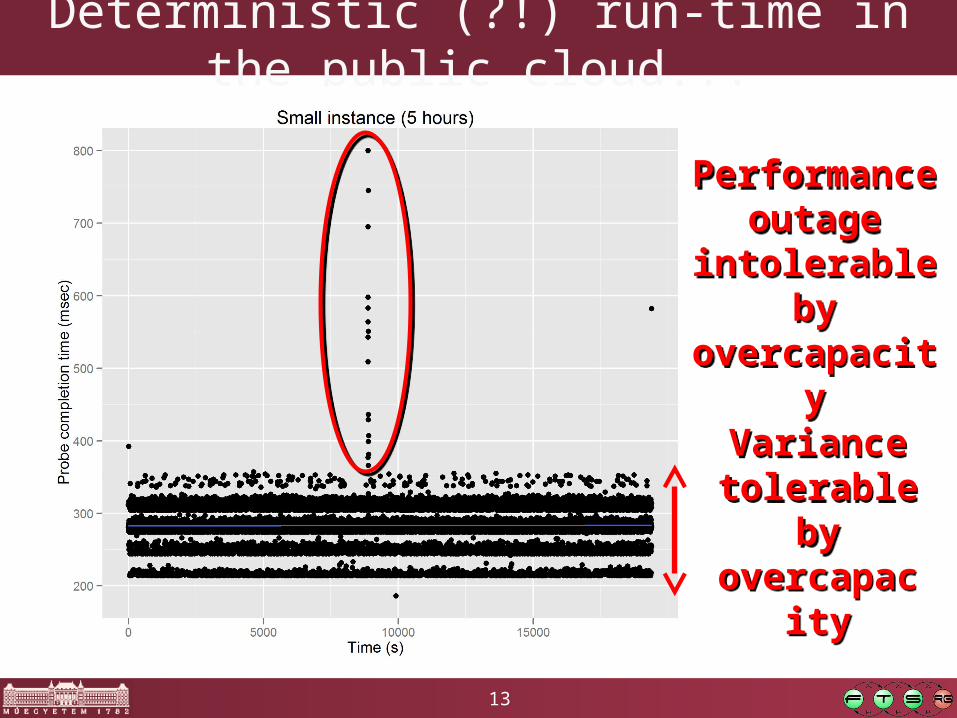
Deterministic (?!) run-time in the public cloud...
Variance tolerable by overcapacity
Variance tolerable by overcapacity
Performance outage
intolerable by overcapacity
Performance outage
intolerable by overcapacity

14
The noisy neighbour problem
HypervisorHypervisor
TenantTenant NeighborNeighbor
15
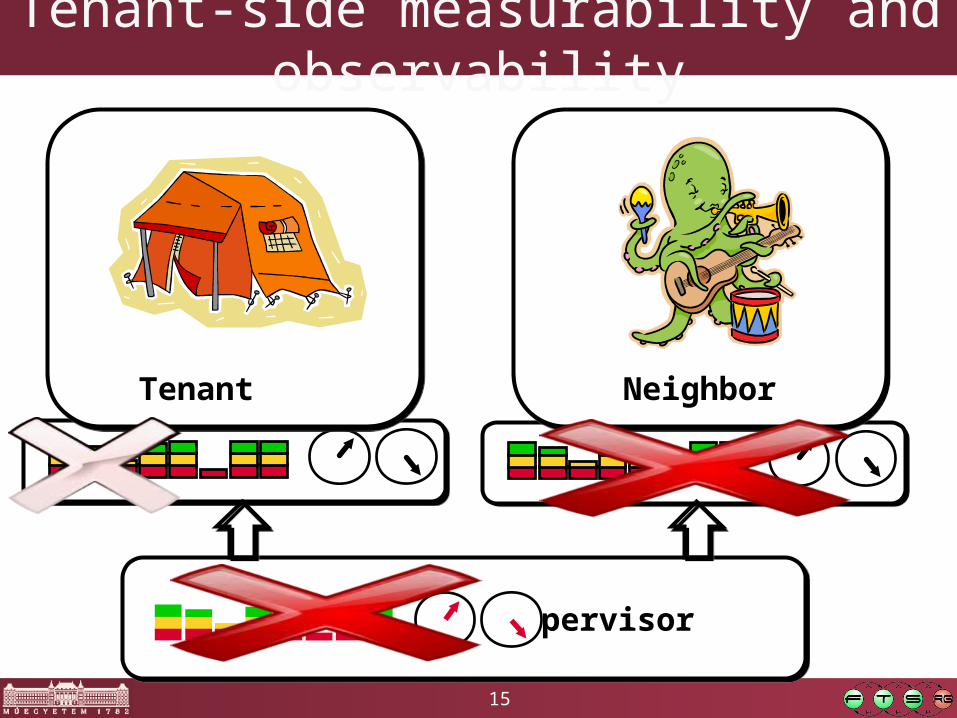
Tenant-side measurability and observability
HypervisorHypervisor
TenantTenant NeighborNeighbor

16
Let’s try it at user level
17
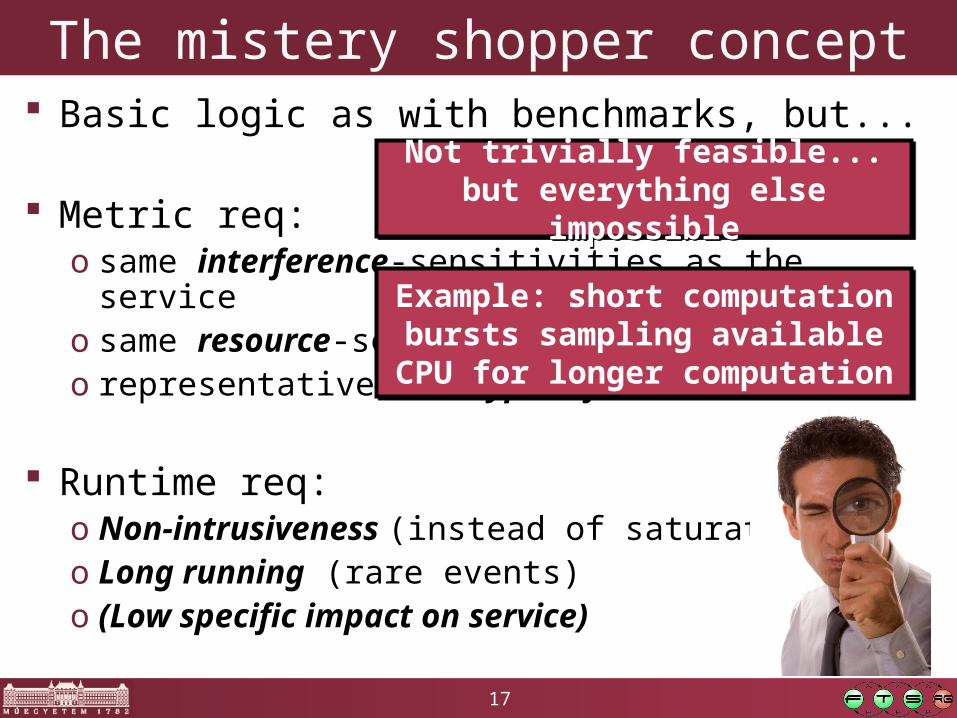
The mistery shopper concept Basic logic as with benchmarks, but...
Metric req:o same interference-sensitivities as the serviceo same resource-sensitivities as the serviceo representative for types of services
Runtime req:o Non-intrusiveness (instead of saturation)o Long running (rare events)o (Low specific impact on service)
Not trivially feasible...but everything else impossible
Not trivially feasible...but everything else impossible
Example: short computation bursts sampling available CPU for longer
computation
Example: short computation bursts sampling available CPU for longer
computation

18
Indirect platform & QoS observability
VM
metric
Mistery shopperApplication
QoS
Resource view
Interferences
Load
The „classic” approach:deploy, run/test, observe, analyze
The „classic” approach:deploy, run/test, observe, analyze
The „classic” approach:deploy, run/test, observe, analyze
The „classic” approach:deploy, run/test, observe, analyze
The „classic” approach:deploy, run/test, observe, analyze
The „classic” approach:deploy, run/test, observe, analyze
1. Connect1. Connect
2. Observe2. Observe
3. Infer 3. Infer (qualitatively)(qualitatively)
3. Infer 3. Infer (qualitatively)(qualitatively)
Observability problems (if present) bypassedObservability problems (if present) bypassedObservability problems (if present) bypassedObservability problems (if present) bypassed
Works Works withoutwithout the application! the application!Works Works withoutwithout the application! the application!
19
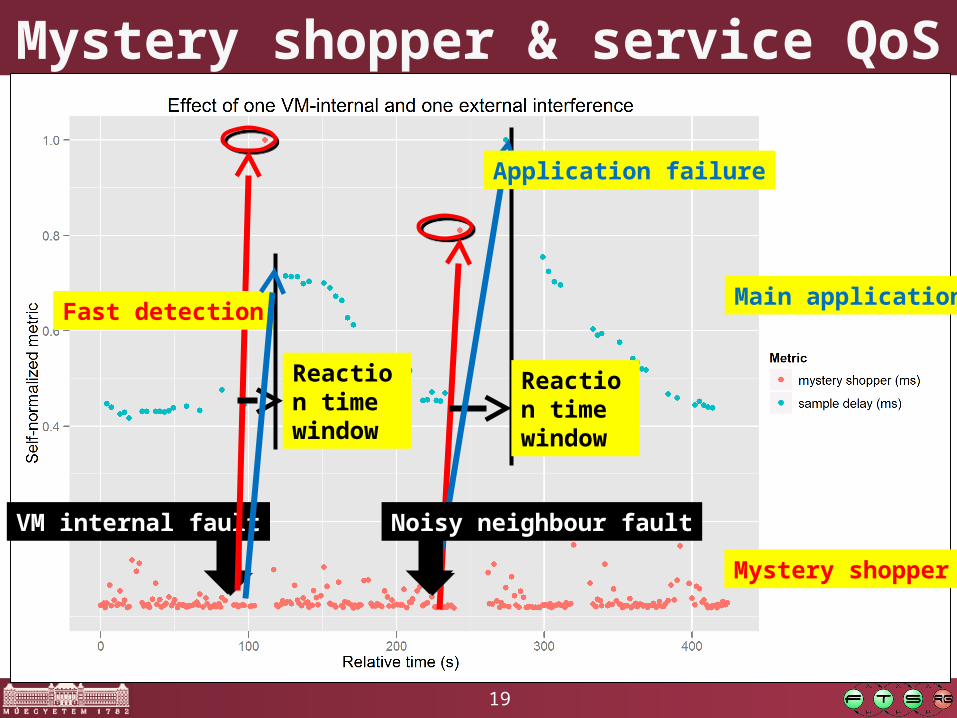
Mystery shopper & service QoS
VM internal fault
Mystery shopper
Main applicationFast detection
Reaction timewindow
Reaction timewindow
Noisy neighbour fault
Application failure
20
Summary Technical
o SLA coverage needed for all aspectsoMissing guarantees can be (somewhat) compensated• Cheap computing power -> redundancy• „Double” autonomic computing
– Cloud level – provider– Application level – user
Methodologyo Visual exploratory data analysis for insighto Algorithmic analysis for proofs and evaluationo Fault-tolerance design patterns revisited• Cheap redundancy in the cloud