1 by assoc. prof. dr. ahmet ÖztaŞ gaziantep university department of civil engineering ce 533 -...
Post on 20-Dec-2015
220 views
TRANSCRIPT

1
By
Assoc. Prof. Dr. Ahmet ÖZTAŞ
Gaziantep UniversityDepartment of Civil Engineering
CE 533 - ECONOMIC DECISION ANALYSIS IN CONSTRUCTION
CHP 7 -Benefit/Cost Analysis and Public
Sector Projects

2
CHP 7. Benefit/Cost (B/C) Analysis
1. Public Versus Private Sector Projects
2. Benefit/Cost Analysis
3. Incremental B/C Evaluation of Two or More Alternatives
4. Using Excel for B/C Analysis
Topics

3
Learning Objectives
7.1 Public Sector Analysis
7.2 Benefit Cost Analysis
7.3 Alternative Selection
7.4 Spreadsheets
Using theB/C
RatioApproach

4
7.1 Public versus Private Sector Projects
• Public Sector:
• Ownership – by citizens- the public
• Public Sector Projects:
• Provide needed services to the public and “no profit”

5
7.1 Types of Projects
• Hospitals
• Parks and recreation facilities
• Highways, dams, bridges
• Courts, schools, prisons
• Public housing
• Many other types

6
7.1 Characteristics – Compared
Characteristic Public Sector Private Sector
Size of Investment
Larger Some Large; medium to small
Life Estimates
Quite Long: 30-50 years
Shorter:2-25 years
Annual Cash Flow Estimates
No Profit: costs and benefits
Revenues – profit cost estimates

7
7.1 Attributes
• Public Sector Projects do not have “profits”.
• Projects can have certain undesirable consequences associated
• Thus, can be controversial in nature
• Draw media attention – debated on pros and cons
8
7.1 Estimating for Public Projects: Costs
• Basic elements for public projects:
• Costs
• Construction, operations, maintenance less est. salvage values
• Initial costs fairly well know
• Future O&M are less known and must be estimated

9
7.1 Estimating: Benefits
• BENEFITS to the public (users) must be estimated in terms of periodic dollar values
• Very difficult to do
• Benefits = the advantages to the public stated in $$
• Owners – generally the public

10
7.1 Estimating: Disbenefits
• Disbenefits
• Expected undesirable (negative) consequences to the owners (public)
• Assuming the project is undertaken
• May be indirect economic disadvantages to the public
• Very hard to estimate and convert to $ amounts

11
7.1 General Principle
• For public projects we find:
It is very difficult to estimate and reach agreement on the economic
impacts of benefits and disbenefits for public sector projects.

12
7.1 Funding Sources – Compared
Characteristic Public Sector Private Sector
Funding Taxes, fees, bonds, pvt. funds
Sale of new stock, bonds, loans, ret. earnings
Interest Rate Tends to be lower
Higher: At market cost
13
7.1 Funding Public Projects
• Generally low interest charges
• Public entities do not pay taxes
• Project investments basically backed by public agencies
• Cost-sharing arrangements often exist
• Less perceived risk with public projects
• Interest rate is determined differently than in the private sector: Called the social discount rate

14
7.1 Additional Comparisons
Characteristic Public Sector Private Sector
Selection criteria
Multiple or many
Rate of return or present value
Environment of the evaluation
Political arena
(debated, pressure groups)
Primarily economic

15
7.1 Selection Process
• Not as “clean” as in the private sector
• Involves interest and pressure groups
• Often draws media attention
• Involves many different viewpoints:
• Citizen
• The tax base
• Number of students in the school district
• Creation and retention of jobs.
• Economic development potential

16
7.1 Evaluation Process
• The viewpoint finally adopted will:
• Determine the estimates of..
• Costs
• Benefits
• Disbenefits
• Note: the viewpoint must be established before the economic evaluation

17
7.2 B/C Analysis – Single Project
• Historical Point
•B/C analysis philosophy was instituted and promoted by the Flood Control Act of 1936
•Introduced to promote a sense of objectivity in an analysis
18
7.2 B/C Formulations
• Assignable life, N - years
• Estimate costs ($)
• Estimate benefits in ($)
• Estimate disbenefits in ($)
• Assign an interest rate – i (%/year)

19
7.2 B/C Formulations
• Then convert all amounts to either a
• Present Worth – PW(i%)
• Annual Worth – AW(i%)
• Future Worth – FW(i%)
• Then calculate a B/C ratio in one of three ways…..

20
7.2 B/C Ratios: 3 Formats
( )/
(cos )
PW benefitsB C
PW ts
( )
(cos )
AW benefits
AW ts
• Three acceptable formats are:
( )
(cos )
FW benefits
FW ts
21
7.2 Notes Regarding Signs
• By convention:
• Revenues are assigned (+) signs
• Costs are assigned (+) signs
• Salvage values are subtracted from costs
• Disbenefits are treated more than one way
22
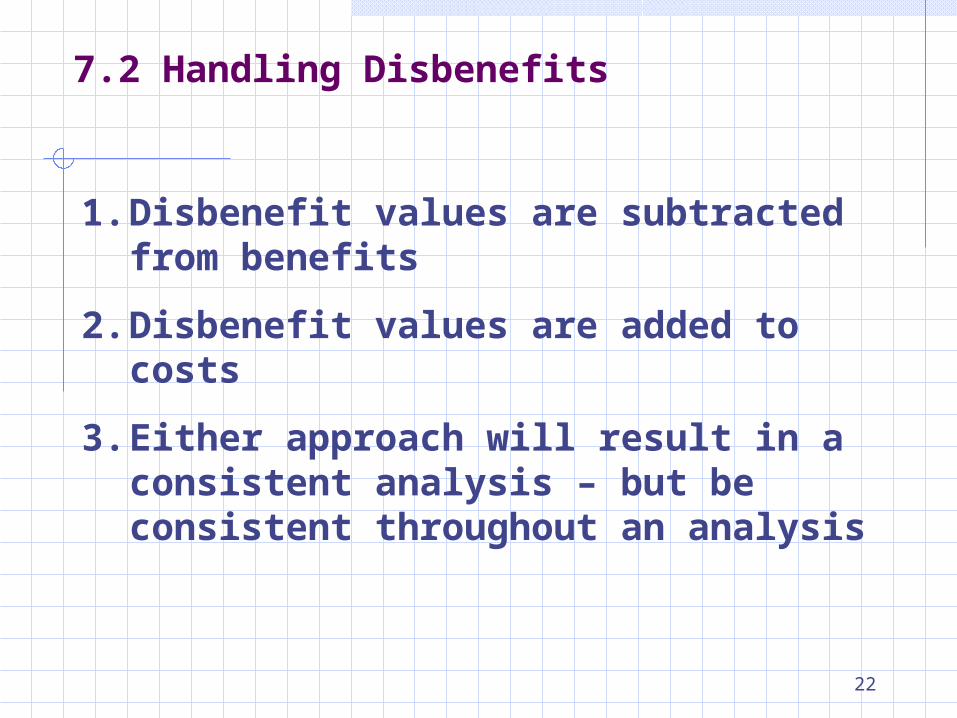
7.2 Handling Disbenefits
1. Disbenefit values are subtracted from benefits
2. Disbenefit values are added to costs
3. Either approach will result in a consistent analysis – but be consistent throughout an analysis

23
7.2 Decision Rule
• If B/C ratio (=>) 1.00
• Conditionally accept the alternative
• If B/C ratio (<) 1.00, conditionally reject the alternative
• If B/C ratio “close” to 1.00, then intangible factors may sway the decision to accept or reject
• There are 3 B/C formula:

24
7.2 Conventional B/C Ratio
• 1) Conventional B/C Ratio is:
- disbenefits/
Benefits B DB C
Costs C
25
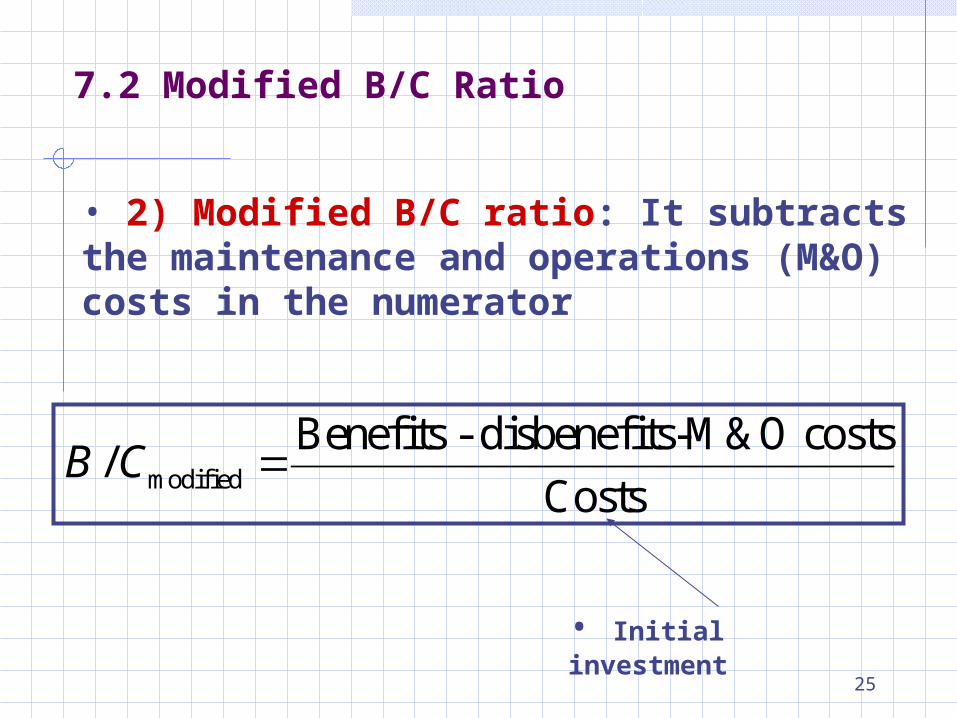
7.2 Modified B/C Ratio
• 2) Modified B/C ratio: It subtracts the maintenance and operations (M&O) costs in the numerator
modified
Benefits - disbenefits-M&O costs/
CostsB C
• Initial investment

26
7.2 Convention vs. Modified?
• It makes no difference which approach is used
• However, the ratio values will differ (magnitude)
• But, the same absolute (accept/reject) decision will be taken.

27
7.2 Benefit-Cost Difference
• 3) B – C difference:
• B-C difference is not a ratio
• B-C difference is:
• (Benefits – Costs) (as a PW or AW)
• The “B” represents the Net Benefit
• Benefits – Disbenefits

28
7.2 Example 7.2

29
7.2 Example 7.2
• Applies all three approaches to the same problem situation

30
7.2 Example 7.2
• B/C = 0.51 (reject)
• Mod B/C = 0.39 (reject)
• (B-C) = $-0.24 million (< 0…reject)
• Result: Same decision with varying magnitudes of the ratio.
31
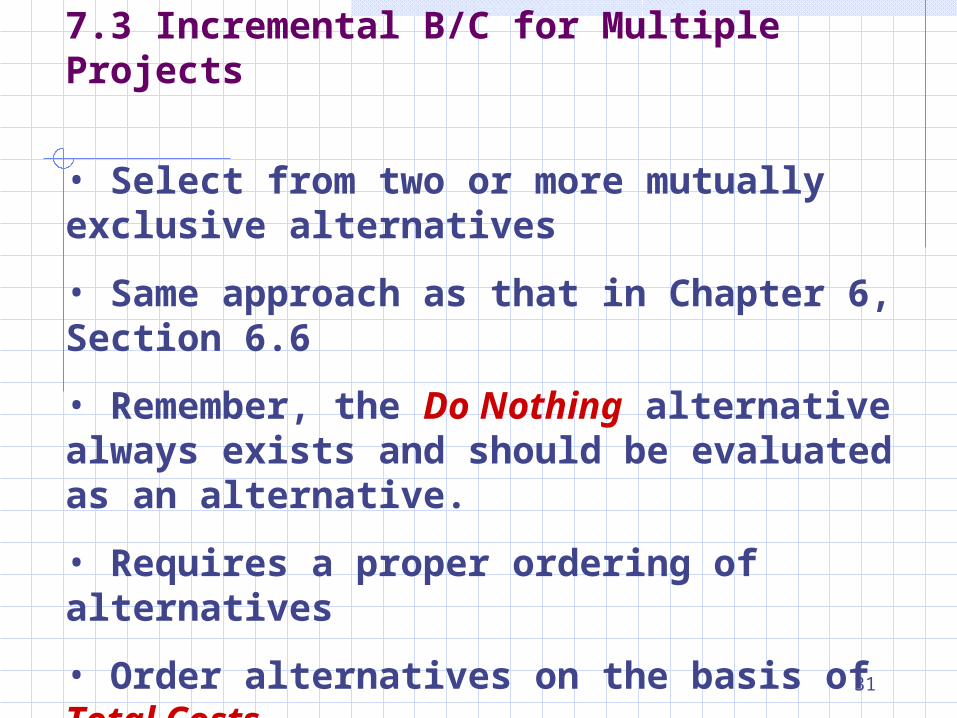
7.3 Incremental B/C for Multiple Projects
• Select from two or more mutually exclusive alternatives
• Same approach as that in Chapter 6, Section 6.6
• Remember, the Do Nothing alternative always exists and should be evaluated as an alternative.
• Requires a proper ordering of alternatives
• Order alternatives on the basis of Total Costs

32
7.3 Incremental B/C for Multiple Projects
If (B/C) (=>) 1.00, select the higher- cost alternativeOtherwise select the lower-cost alternative! If you are using a PW to determine equivalency, then you must have an equal- life model or LCM of lives. Or, apply AW on a typical cycle for the alternatives and the repeatability assumption applies.

33
7.3 Incremental B/C for Multiple Projects
There are 2 types of benefits: 1) Usage cost estimates, 2) Direct benefit estimates.Before conducting the incremental evaluation, classify alternatives.Usage cost: implied benefits based on the difference in costs between alternatives. Evaluate these alternatives only against each other.Direct benefit: Benefit amounts estimated. First evaluate against DN, then, against each other.

34
A procedure for comparing multiple, mutually excluive alternatives using conventional B/C ratio:
• For eachalternative, determine the equivalent PW, AW or FW for costs C and benefits [or (B-D) if disbenefits are considered];
• Order alternatives by increasing total equivalent costs. For direct benefit alternatives, add DN as the first alternative
• Determine the incremental cost (C) and benefits (B) between first two alternatives.
7.3 Incremental B/C for Multiple Projects

35
For usage cost alternative,
B = usage cost of 2 - usage cost of 1
4. Calculate incremental conventional B/C ratio using below equation
B/C = (B-D)/C
5. If (B/C) => 0, eliminate 1; 2 is survivor. otherwise
1 is survivor.
6. Continue to compare alternatives using step 2 through 5 until one alternative remains as survivor.
7.3 Incremental B/C for Multiple Projects

36
7.3 Example 7.3 (Incremental B/C)
the addition is estimated at 30 years. Use conventional B/C ratio ananlysis to select A or B.
XXXXXXXXXXXXXXX 800,000 1,050,000

37
7.3 Example 7.3 (Incremental B/C)
1) AW1= 10,000(A/P,5%,30)+35= 685,500
AW2= 15,000(A/P,5%,30)+55= 1,030,7502) Add DN and order: DN, 1, 2.3) Compare 1-to-DN which is alt. 14) Calculate incremental (B/C) ratio
B/C = 800,000/685,500 = 1.175) Since 1.17 > 1.0 design 1 is survivor.6) Compare 2-to-1:
B = 1,050,000 - 800,000= 250,000 C = 1,030,750 - 685,500= 345,250 B/C = 250,000/ 345,250 = 0.72 < 1.0 Design 2 eliminated, and design 1 is selection for
bid.

38
7.3 Example 7.4 (Incremental B/C)

39
7.3 Example 7.4 (Incremental B/C)

40
7.3 Example 7.4 (Incremental B/C)
• 4 Alternatives { 1,2,3, and 4}
• Ranked on total cost as shown
• Analysis Summary:
• (2 -1) B/C = 2.24 …Go with {2}
• (3-2) B/C =0.62…Reject 3, stay with {2}
• (4-2) B/C = 1.83 Go with 4, final winner

41
7.3 Example 7.5 (Incremental B/C)

42
7.3 Example 7.5 (Incremental B/C)
43
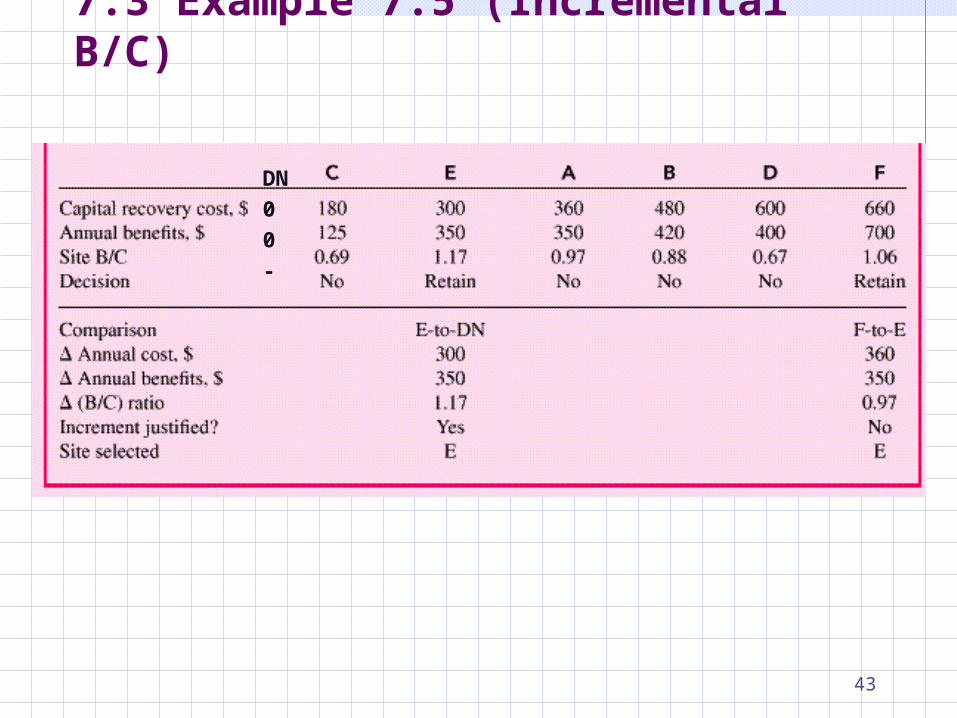
7.3 Example 7.5 (Incremental B/C)
DN
0
0
-
44
Chapter Summary
• B/C is primarily a public-sector analysis technique
• Uses PW or AW with a social cost of capital interest rate (specified before the analysis is conducted)
• B/C ratio greater than 1 indicates economic desirability
• Results may depend upon viewpoints that define costs and benefits
• Applied within the political arena

45
End of Chapter 7