1 capital structure decisions: which factors are reliably important? murray z. frank vidhan k. goyal
TRANSCRIPT

1
Capital Structure Decisions: Which Factors are Reliably Important?
Murray Z. Frank
Vidhan K. Goyal

2
“We already know what Compustat has to say about capital structure.”
• When asked for details usually cite: – Titman and Wessels 1988 – Harris and Raviv 1991– Rajan and Zingales 1995

3
• The available studies “generally agree that leverage increases with fixed assets, non-debt tax shields, growth opportunities, and firm size and decreases with volatility, advertising expenditures, research and development expenditures, bankruptcy probability, profitability and uniqueness of the product.” (Harris and Raviv 1991, page 334)
• The “results do not provide support for an effect on debt ratios arising from non-debt tax shields, volatility, collateral value, or future growth.” (Titman and Wessels 1988, page 17)
Who is correct?
What we know

4
We really do not know, what we “already know.”
• Implications for capital structure theory– Which directions need development?
– What effects are first order and which are minor?
• Implications for empirical work on leverage.– Inconsistency across papers in the choice of factors.
– Some conclusions do depend on the factors used.

5
Our approach: data first.
1. Collect plausible factors from the literature.
2. Look for robust patterns in the data, and remove minor factors.
3. Then consider how this might relate to theory.
6
Comment on Methodology
• Data Description versus theory testing.– Many theories can be, and have been, proposed. – Within alternative theoretical structures, patterns in the
data may have alternative interpretations.– We are describing data, not “testing a theory.”
• All methods rest on assumptions. – Our main assumptions: Linear regressions, Bayesian
Information Criterion.
• A first step before imposing more theoretically interesting structure. – What facts does theory need to explain?

7
Plan for the Talk
1. Short reminder of theory.2. Describing changes over time.3. Selection of factors.4. Robustness: time, type of firm, definitions,
missing data. (if time permits)5. Core model of leverage.6. Minor factors. (if time permits)7. What does this say about theory?
8
Trade-off theory• Taxes and/or agency versus deadweight
bankruptcy costs.– Static (Bradley, Jarrell and Kim 1984, Myers 1984
discussion was very influential) – Dynamic (Stiglitz 1973, Fischer, Heinkel and
Zechner 1989, Hennessey and Whited 2003, Leary and Roberts 2003, Strebulaev 2003, etc.).
9
Pecking Order theory
• Retained earnings, debt, and only in extreme circumstances use equity. – Myers 1984, Shyam-Sunder and Myers 1999,
Fama and French 2002 and 2003, Frank and Goyal 2003.
• Market timing: an old idea that is newly popular.– Hovakimian, Opler and Titman 2001, Baker and
Wurgler 2002, Welch 2004, Frank and Goyal 2004.

10
Balance sheet changes between the 1950s and the 1990s.
• Inventories have dropped from 25% of assets to 8% at the median firm.
• Shift from property plant and equipment towards intangible assets.
• Total Debt/Total Assets– Was 0.20 in the 1950s and 0.28 in the 1990s.– Big increase in various current liabilities.

11
Operations1950-1959
1960-1969
1970-1979
1980-1989
1990-2000
+ Sales
1.426(1.292
)
1.478(1.349
)
1.518(1.375
)
1.274(1.131
)
1.149(0.979
)
- Cost of goods sold 1.195(0.981
)
1.098(0.931
)
1.111(0.948
)
0.922(0.739
)
0.821(0.616
)
- Selling, general and Admin. Expenses
0.152(0.090
)
0.226(0.178
)
0.275(0.222
)
0.307(0.227
)
0.343(0.227
)
= Operating Income before depreciation
0.192(0.182
)
0.158(0.149
)
0.132(0.141
)
0.044(0.112
)
-0.017(0.098
)

12
Financing Activities
1970-19791980-1989
1990-2000
Sale of common and preferred stock
0.019(0.000)
[0.000, 0.003]
0.083(0.001)[0.000, 0.022]
0.128(0.003)[0.000, 0.063]
Purchase of common and preferred stock
0.004(0.000)
[0.000, 0.000]
0.007(0.000)[0.000, 0.000]
0.008(0.000)[0.000, 0.000]
Cash dividends 0.011
(0.002)[0.000, 0.019]
0.011(0.000)[0.000, 0.015]
0.008(0.000)[0.000, 0.006]
Long term debt issuance
0.061(0.014)
[0.000, 0.080]
0.081(0.013)[0.000, 0.093]
0.105(0.008)[0.000, 0.106]
Long term debt reduction
0.043(0.014)
[0.000, 0.045]
0.064(0.018)[0.001, 0.062]
0.082(0.017)[0.000, 0.073]
13
Some Facts about Equity
• The median firm issues both equity (and debt) in most years. • In the 1990s on the average public firm issues more net equity
than net debt. (Firm size matters.)• Equity issues come in many forms, not just IPO and SEO.
– Stock exchanges in mergers and employee compensation are both significant.
– But also rights offerings, DRIPs, convertible bonds, and private placements.
– Even SEOs are not rare (about 10% of firms per year). Particularly important for small firms.

14
-.03
0.0
3.0
6.0
9
1945 1950 1955 1960 1965 1970 1975 1980 1985 1990 1995 2000Year
Capital exp./assets Internal funds/assets
Dividend/assets Deficit/assetsEquity issues/assets Debt issues/assets
Entire US non-farm non-financial corporate sector

15
-.03
.02
.07
.12
.17
1970 1975 1980 1985 1990 1995 2000Year
Capital exp./assets Internal funds/assets
Dividend/assets Deficit/assetsEquity issues/assets Debt issues/assets
Large publicly traded firms

16
-.3
-.2
-.1
0.1
.2.3
1970 1975 1980 1985 1990 1995 2000Year
Capital exp./assets Internal funds/assets
Dividend/assets Deficit/assetsEquity issues/assets Debt issues/assets
Small publicly traded firms

17
-.03
0.0
3.0
6
1970 1975 1980 1985 1990 1995 2000Year
Capital exp./assets Internal funds/assets
Dividend/assets Deficit/assetsEquity issues/assets Debt issues/assets
Private firms
18
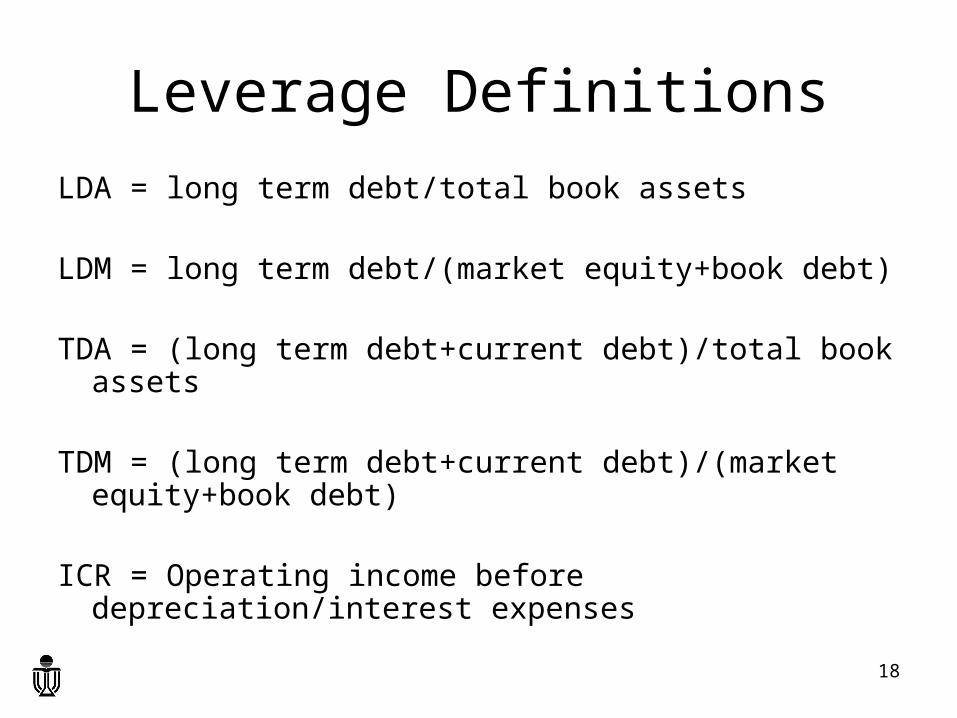
Leverage Definitions
LDA = long term debt/total book assets
LDM = long term debt/(market equity+book debt)
TDA = (long term debt+current debt)/total book assets
TDM = (long term debt+current debt)/(market equity+book debt)
ICR = Operating income before depreciation/interest expenses
19
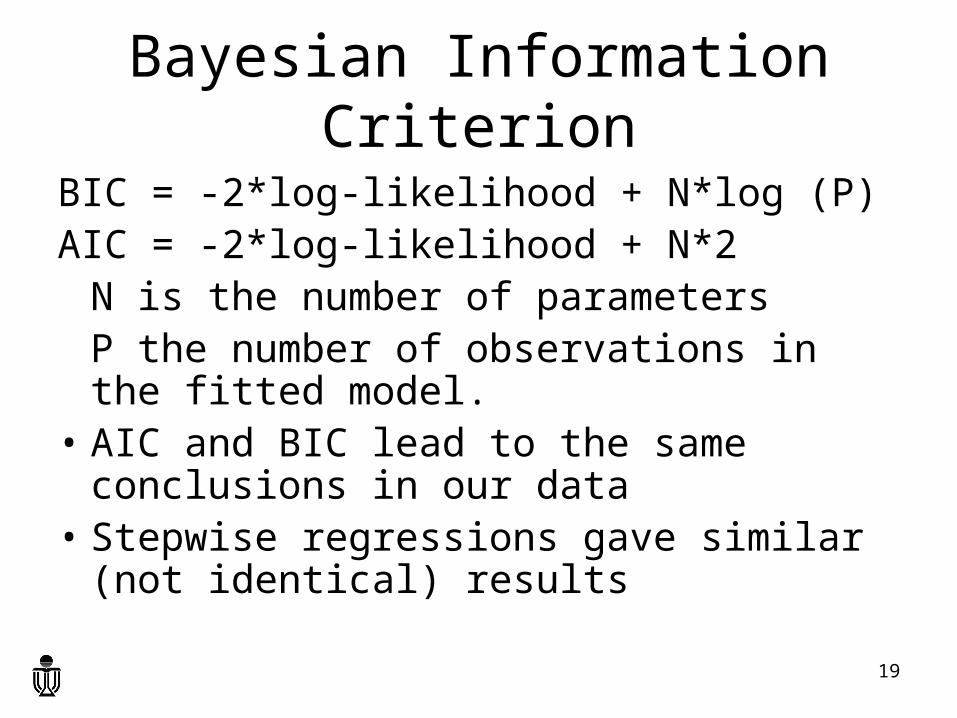
Bayesian Information Criterion
BIC = -2*log-likelihood + N*log (P) AIC = -2*log-likelihood + N*2
N is the number of parameters P the number of observations in the fitted model.
• AIC and BIC lead to the same conclusions in our data
• Stepwise regressions gave similar (not identical) results

20
Variable Coefficient estimate in the last regression in which
the variable was included
t-statistic in the last regression in
which the variable was
included
Own R2 Cumul. R2
BIC
RnD -0.016 -11.9 0.02 0.36 -34574.8
ChgAsset 0.024 10.2 0.01 0.36 -34512.1
NBER 0.019 8.5 0.01 0.36 -34572.8
CrspRet 0.041 7.4 0.00 0.36 -34615.8
TBill -0.397 -7.8 0.02 0.36 -34664.4
QualSprd -0.451 -8.2 0.00 0.36 -34719.7
Tang -0.041 -7.9 0.06 0.36 -34770.0
ChgSales -0.012 -5.2 0.01 0.36 -34816.6
TermSprd -0.508 -5.1 0.01 0.36 -34831.7
InvTaxCr -0.766 -3.7 0.02 0.36 -31646.7
MacroGr -0.203 -3.2 0.00 0.36 -31645.4
Depr -0.054 -2.5 0.00 0.36 -31640.5
IndustGr -0.015 -2.0 0.01 0.36 -31632.9
Mature 0.004 1.9 0.02 0.36 -31625.3
Sales -0.001 -0.5 0.03 0.36 -31614.2
TaxRate -0.004 -0.3 0.01 0.36 -31602.9
Table 5 (bottom part)

21
Variable Coefficient estimate in the last regression in which the variable
was included
t-statistic in the last regression in
which the
variable was included
Own R2 Cumul. R2
BIC
IndustLev 0.873 199.2 0.19 0.19 -16153.1
Mktbk -0.030 -110.6 0.10 0.24 -27763.0
Colltrl 0.161 62.6 0.09 0.26 -30173.2
Profit -0.143 -64.1 0.00 0.28 -34221.9
Dividend -0.053 -45.1 0.00 0.29 -36230.9
Assets 0.020 63.1 0.05 0.30 -40152.2
Inflation 1.262 55.7 0.03 0.32 -43215.8
Intang 0.250 40.6 0.00 0.32 -39896.8
StockVar -0.067 -31.7 0.04 0.34 -35548.2
MgrSenti -0.172 29.9 0.00 0.35 -36425.0
SGA -0.025 -24.1 0.02 0.35 -36949.4
Capex -0.149 -17.7 0.00 0.35 -37249.1
MacroProf -0.083 -17.5 0.00 0.35 -37543.8
StockRet -0.019 -17.1 0.03 0.36 -37825.6
NOLCF -0.017 -14.4 0.00 0.35 -33615.8
Losses -0.043 -14.6 0.01 0.35 -33816.1
Regultd 0.080 14.2 0.04 0.35 -34007.1
Unique -0.018 -12.4 0.01 0.35 -34149.5
Advert -0.289 -13.0 0.00 0.35 -34306.0
Rating -0.042 -12.3 0.00 0.36 -34444.6
Table 5 (top part)

22
Tables 5 and 6
• There is a core set of seven reliable factors:– Median industry leverage (+)
– Market-to-book (–)
– Collateral (+)
– Profits (–)
– Dividend-paying (–)
– Log of assets (+)
– Expected inflation (+)
• Accounts for about 32% of the variation.

23
• The top 7 factors tend to do well.– Not much in the way of sign reversals.– Less significance in some cases.
• None of the minor factors become major.
• Most factors are significant for some kinds of firms in some years.
Table 7: Firm Circumstances
24
All Years
Impute Missing
1950-1959
1960-1969
1970-1979
1980-1989
1990-2000
Intercept -0.0200(-8.79)
-0.0137(-5.80)
0.1938(13.00)
0.1437(19.52)
0.1435(18.94)
-0.0231(-4.95)
-0.0365(-8.35)
IndustLev 0.6463(139.64)
0.6604(154.74)
0.6580(32.69)
0.4756(43.75)
0.6333(54.85)
0.6804(69.29)
0.6182(87.64)
Mktbk -0.0307(-108.19)
-0.0306(-112.59)
-0.0398(-13.54)
-0.0227(-24.44)
-0.0611(-54.80)
-0.0348(-59.19)
-0.0217(-57.45)
Colltrl 0.1829(71.15)
0.1772(74.68)
0.0909(6.11)
0.1285(15.64)
0.1764(25.39)
0.2261(45.33)
0.1748(46.62)
Profit -0.1587(-68.92)
-0.1557(-77.44)
-0.5276(-20.79)
-0.5607(-37.69)
-0.5845(-51.91)
-0.1635(-34.30)
-0.1040(-34.84)
Dividend -0.0988(-75.10)
-0.1026(-83.51)
-0.0108(-1.16)
-0.0378(-11.08)
-0.0983(-35.18)
-0.1018(-39.53)
-0.0915(-40.14)
Assets 0.0224(70.28)
0.0217(74.84)
-0.0023(-1.65)
0.0067(8.13)
0.0208(27.01)
0.0236(37.99)
0.0212(42.66)
Inflation 1.2621(55.73)
1.3303(52.39)
1.0605(9.10)
0.5083(3.62)
0.9585(13.42)
0.6360(15.37)
1.5095(16.55)
Number of obs. 158,525 225,476 4,465 14,453 32,876 43,587 63,144
AIC -43,295.6 -675,049.6 -5,621.9 -14,397.3 -8,803.9 -11,410.9 -14,012.8
BIC -43,215.8 -675,047.6 -5,570.7 -14,336.7 -8,736.7 -11,341.4 -13,940.4
Adj R-squared 0.32 0.31 0.41 0.37 0.35 0.30 0.29
25
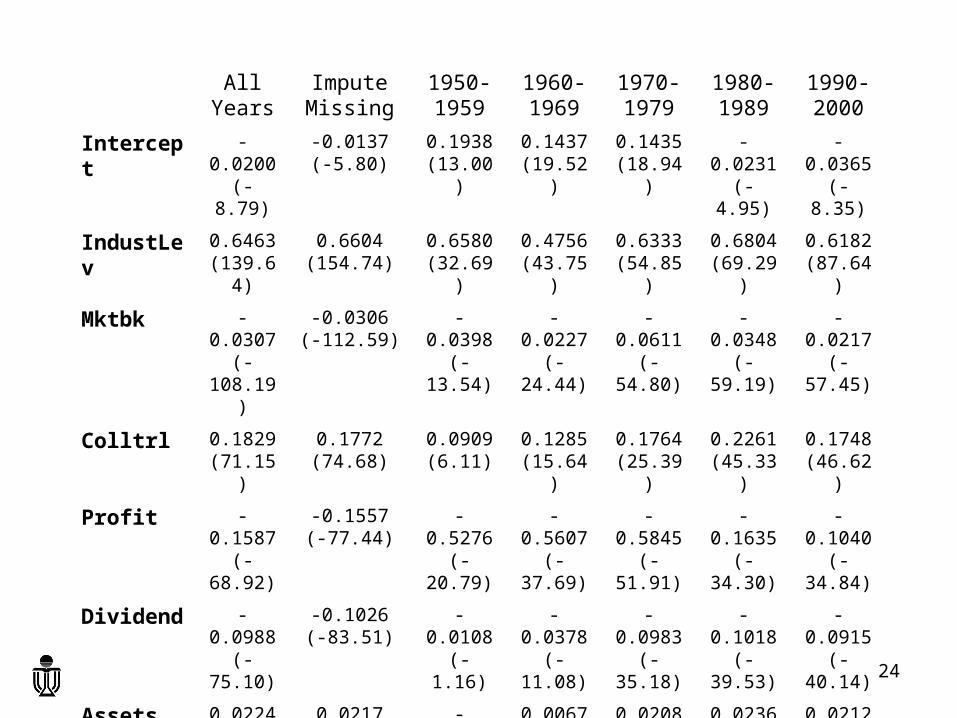
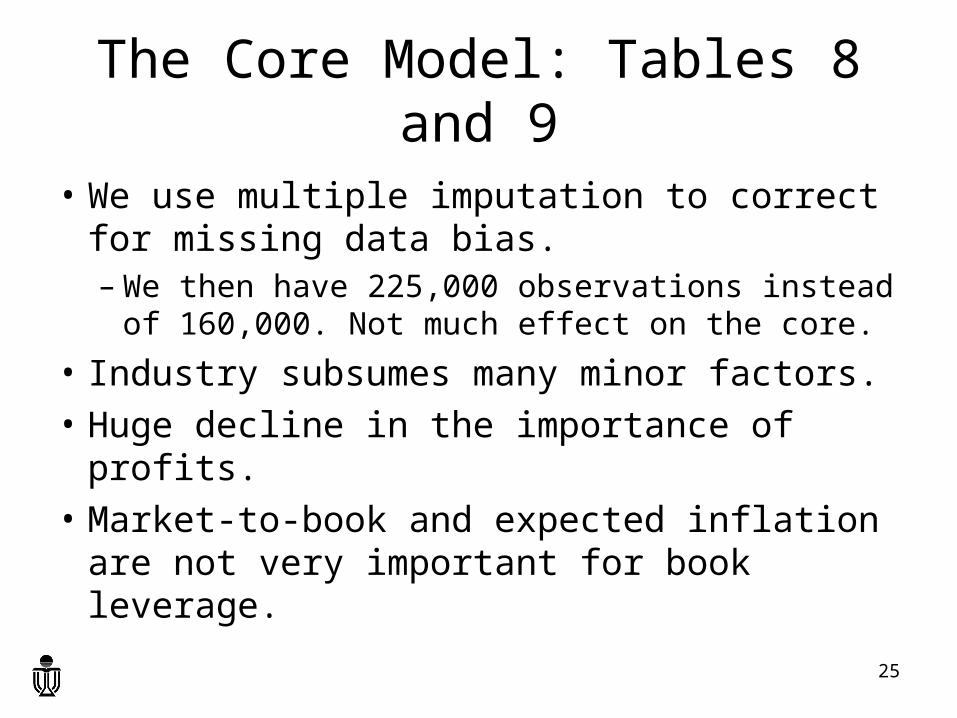
The Core Model: Tables 8 and 9
• We use multiple imputation to correct for missing data bias. – We then have 225,000 observations instead of
160,000. Not much effect on the core.
• Industry subsumes many minor factors.
• Huge decline in the importance of profits.
• Market-to-book and expected inflation are not very important for book leverage.

26
Minor Factors: Table 10
• Reintroduce them one at a time. – Almost all are statistically significant.
• Book vs market leverage effect reversals are common– NBER recession dummy, T-bill rate, Investment grade
rating, Net Operating Loss Carry Forwards, MacroProfit.• Some change sign depending on the control factors
– Investment tax credits, depreciation, tax rate, etc.• Some are fairly reliable, although less powerful than
the top seven factors.

27
Minor Factors: A Warning
• Investment Tax Credits – Table 4. positive correlation with leverage.
– Table 5. final coefficient is -0.766.
– Table 10. sometimes positive (T-statistic of 27.1) and sometimes negative (T-statistic of 7.9).
• Either sign could be reported as “robust.” – Add a few of the minor factors. Since they do not matter,
they will have little effect.
– This can happen by accident.
• Not all reported “robust results” are really robust.
28
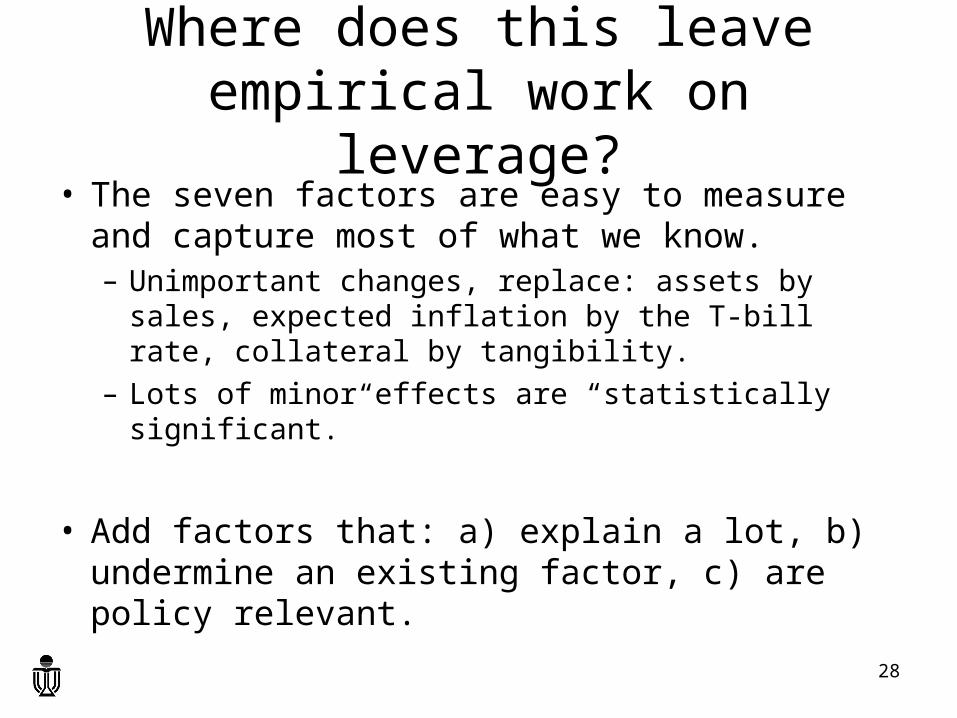
Where does this leave empirical work on leverage?
• The seven factors are easy to measure and capture most of what we know.– Unimportant changes, replace: assets by sales, expected
inflation by the T-bill rate, collateral by tangibility.
– Lots of minor effects are “statistically significant.”
• Add factors that: a) explain a lot, b) undermine an existing factor, c) are policy relevant.
29
Where does this leave the Pecking Order Theory?
• The pecking order has problems.
• To become more empirically relevant would need to provide a better account of firm size, industry effects, dividends, collateral and expected inflation. – Probably too big a hurdle.– Market timing theory is similarly incomplete.

30
Where does this leave the Trade-off Theory?
• Gradually undoing the effect of Myers 1984.• Static trade-off.
– Direct tax effects and risk factors are fairly minor.– Most factors do line up as predicted.– Profit does not line up as predicted by the static theory.
• Dynamic trade-off.– With taxes (Stiglitz 1973) or fixed cost of adjustment, do
get the negative sign on profits. – Can we distinguish the effects of taxes, agency conflicts
and underwriting costs?

31
Comment on Taxes
• Tax effects do not seem strong in our data.• Debt finance was common long before income tax.

32
Where Next?
• We are working on embedding these factors within a panel cointegration structure. In this way we hope to examine the responses to various classes of shocks.
• There is still much to be sorted out in how the statics and the dynamics interact.