1 chapter 3 appendix b development of objective function
TRANSCRIPT

1
Ch
apte
r 3
Chapter 3Appendix B
Development of ObjectiveFunction

2
Ch
apte
r 3
3)L/D rule standard .( ???1
4
4
solve and different.
4
2
~4
:constraint eliminate
4..
,2
min
31
31
2
2
2
2
vsD
L
VL
VD
D
VDC
D
VL
LD
Vts
LD
DDLC
opt
opt
opt
Optimize L/D for a Pressure Vessel

3
Ch
apte
r 3
erroneous assumptions
(1) dished ends (not flat)Ae = 2(1.16 D2) = 2.32 D2
(2) thickness is a function of D (not constant)(3) fabrication costs
$ ends > $ sides (1.5x)
2
0
0
3.48
fab cost of sides ($/lb.)
t thickness
density
(corrosion allowance) 117002 250250
.125 0.0108 0.125
C S DLt S D t
S
PDt t psi
P psi
t inch t D

4
Ch
apte
r 3
.7.31
.11
solution analytical no
/167029.144304.0263.
nkgallon ta 25,000
Lfor solve
)3(4
heads) (dished constraint volume
fcn. obj.in S,neglect
23
2
ftL
ftD
DDDC
DLD
V
opt
opt

5
Ch
apte
r 3
capacity pressure psi
gal 100 250 400
2500 1.7 2.4 2.9
25000 2.2 2.9 4.3
10 DLP

6
Ch
apte
r 3

7
Ch
apte
r 3

8
Ch
apte
r 3

9
Ch
apte
r 3

10
Ch
apte
r 3
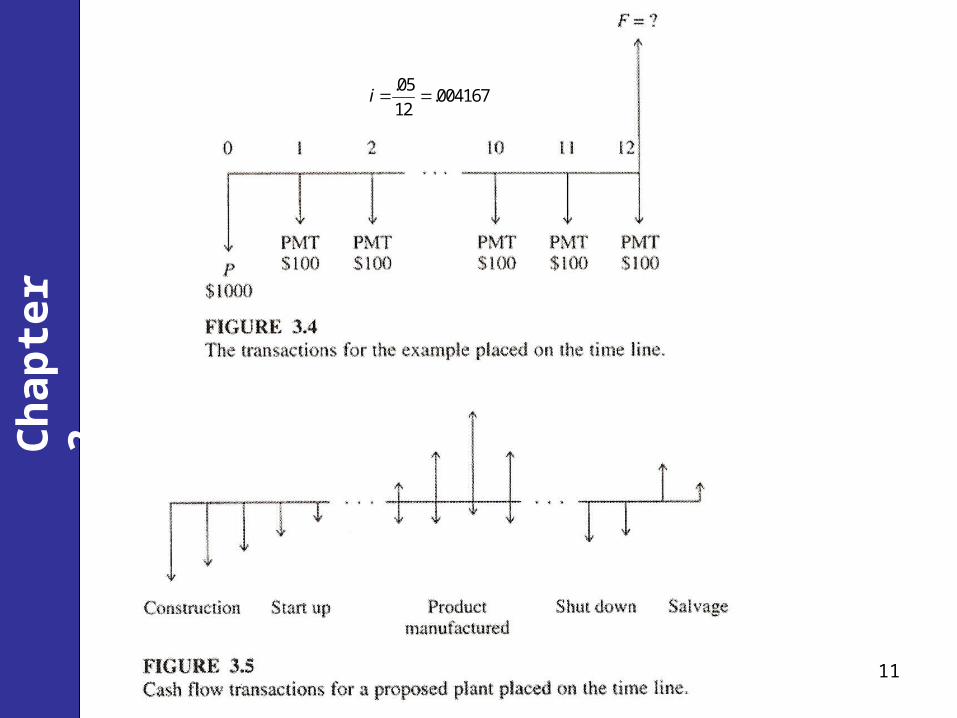
11
.05.004167
12i
Ch
apte
r 3

12
Ch
apte
r 3

13
Ch
apte
r 3

14
Ch
apte
r 3

15
Ch
apte
r 3

16
Ch
apte
r 3

17
Ch
apte
r 3

18
Ch
apte
r 3

19
Ch
apte
r 3

20
Ch
apte
r 3
21
Ch
apte
r 3

22
Ch
apte
r 3
nn
i
F
i
F
i
FP
)1(...
)1(1orth present w
221
Insulation example -- fixed vs. operating costs (Fi)
annualization factor (repayment multiplier)
021
01
or
d)(discounte investment
savings cumulative initial
1)1(
)1(
rIFfrf
r
FIf
i
iir
n
n
for Fi = constant = F (cash flow)
23
Ch
apte
r 3
There are several disadvantages to using IRR in optimization (requires iterative solution).NPV can be shown to be equivalent to using an annualization factor (series present worth factor).
- Steam Generator Example

24
Ch
apte
r 3

25
Ch
apte
r 3
20
0
0 0
2 0
$ (steam generated)
area ($25/ft )
/ vs.
(1 ) 1. /
(1 )
( , , , )
n
n
optp
Fyr
I
ROI F I
iNPV F I F r I
i i
T w r c U
Steam Generator Flow Diagram

26
Ch
apte
r 3

27
Ch
apte
r 3
In the previous section we only briefly mentioned the financial assumptions used in profitability analysis. Any detailed analysis of a project requires specifying the following parameters:
(1)initial investment(2)future cash flows(3)salvage value(4)economic life(5)depreciation(6)depletion(7)investment tax credit(8)taxes(9)inflation(10)debt/equity ratio

28
REVENUEOPERATIONS
SALESINCOME
MANUFACTURING(CASH OPERATING)
EXPENSES
OPERATING INCOME (PROFIT)
NET INCOME BEFORE TAXES
FEDERAL INCOME TAXESNET INCOMEAFTER TAXES
CASH
FLOW
SALVAGE VALUE
DEPRECIATION
Figure 3.3 Computation of Cash Flow
Ch
apte
r 3

29
Ch
apte
r 3

30
Ch
apte
r 3

31
Ch
apte
r 3

32
Ch
apte
r 3

33
Ch
apte
r 3

34
Ch
apte
r 3
35
Ch
apte
r 3

36
Ch
apte
r 3

37
InsulationThickness
x (cm)
InsulationCost($)
Valueof fuelsaved
($/year)
Payback period(years)
Return on investment
(% per year)
NetPresentvalue
($)
Internalrate ofreturn
(%)
1 2,135 5,281 1.27 79 16,013 247
2 4,270 8,182 1.64 61 23,847 191
3 6,405 10,020 2.01 50 28,028 155
4 8,540 11,288 2.38 42 30,250 130
5 10,675 12,215 2.75 36 31,301 112
6 12,810 12,984 3.10 32 31,809 98
7 14,945 13,480 3.48 29 31,378 86
A summary of the calculations is
Ch
apte
r 3