1 chapter 7: unemployment, inflation, and deflation econ 151 – principles of macroeconomics...
TRANSCRIPT

1
Chapter 7:
Unemployment, Inflation, and Deflation
ECON 151 – PRINCIPLES OF MACROECONOMICS
Materials include content from Pearson Addison-Wesley which has been modified by the instructor and displayed with permission of the publisher. All rights reserved.
2
Explain how the U.S. government calculates the official unemployment rate
Discuss the types of unemployment Describe how price indexes are calculated
and review the key types of price indexes
Learning Objectives

3
Distinguish between nominal and real interest rates
Evaluate who loses and who gains from inflation
Understand key features of business fluctuations
Learning Objectives

4
QuestionWho are the unemployed?
UnemploymentThe total number of adults (aged 16 years or
older) who are willing and able to work and who are actively looking for work but have not found a job
Unemployment

5
Lost output Early 2000s unemployment rate rose by 2
percentage points Factory output was 80% of potential Lost output was $200 billion of goods and services
that could have been producedPersonal psychological impact
Costs of Unemployment

6Source: U.S. Department of Labor, Bureau of Labor Statistics
Figure 7-1
More than a Century of Unemployment

7
The unemployment rate is the percentage of the measured labor force that is unemployed.
Unemployment

8
Labor Force Individuals aged 16 years or older who either
have jobs or are looking and available for jobs
Unemployment
Labor force = the employed + the unemployed

9
147.7* = 139.5 + 8.2
Unemployment
*U.S., millions of people; as of 2005
Labor force = the employed + the unemployed
Unemployment rate = x 100%unemployed
labor force
= x 100 % = 5.6%8.2
147.7

10
StocksThe quantity of something (unemployed)
measured at a point in time Flow
A quantity measured over time (job leavers, job finders)
Unemployment

11
Visualizing Stocks and Flows
Figure 7-4

12
Unemployment categoriesJob loserReentrantJob leaverNew entrant
Unemployment

13
Job LoserAn individual whose employment was
involuntarily terminated or who was laid off 40–60% of the unemployed
Unemployment

14
ReentrantAn individual who has worked a full-time job
before but left the labor force and has now reentered it looking for a job
20–30% of the unemployed
Unemployment

15
Job LeaverAn individual who voluntarily ended
employment Less than 10% to around 15% of the unemployed
Unemployment

16
New EntrantAn individual who has never worked a full-
time job for two weeks or longer 10–13% of the unemployed
Unemployment

17
Duration of unemployment More than a third of job seekers find work within one
month Approximately another third find employment within a
second month About a sixth are still unemployed after six months Average duration is just over 15 weeks throughout the
last decade
Unemployment
18
Discouraged Workers Individuals who have stopped looking for a job
because they are convinced they will not find a suitable one
QuestionHow does the existence of discouraged
workers bias the unemployment rate?
Unemployment

19
Labor Force Participation RateThe proportion of working-age individuals
who are employed or seeking employment
Unemployment

20
The major types of unemploymentFrictionalStructural CyclicalSeasonal
Unemployment

21
Frictional UnemploymentResults from the fact that workers must
search for appropriate job offers
Unemployment

22
Structural UnemploymentResults from a poor match of workers’
abilities and skills with current requirements of employers
Unemployment

23
Cyclical UnemploymentResults from business recessions that occur
when aggregate (total) demand is insufficient to create full employment
Unemployment

24
Seasonal UnemploymentResults from the seasonal pattern of work in
specific industries
Unemployment

25
Full EmploymentAn arbitrary level of unemployment that
corresponds to “normal” friction in the labor market
Unemployment

26
Natural Rate of UnemploymentThe unemployment rate that is estimated to
prevail in the long run when all workers and employers have fully adjusted to any changes in the economy
When seasonally adjusted the natural rate of unemployment should only take into account frictional and structural unemployment
Unemployment

27
InflationAn upward movement in the average level of
prices Deflation
A downward movement in the average level of prices
Inflation and Deflation

28
Purchasing PowerThe value of money for buying goods and
servicesVaries with prices and income
Inflation and Deflation

29
Nominal valuePrice expressed in today’s dollars
Real valueValue expressed in purchasing power
Inflation and Deflation

30
Measuring inflationPrice Index
The cost of today’s market basket of goods expressed as a percentage of the cost of the same market basket during a base year
Inflation and Deflation
Price index = 100cost today of market basket
cost of market basket in base year
31
Market BasketRepresentative bundle of goods and services
Base YearThe point of reference for comparison of
prices in other years.
Inflation and Deflation
32
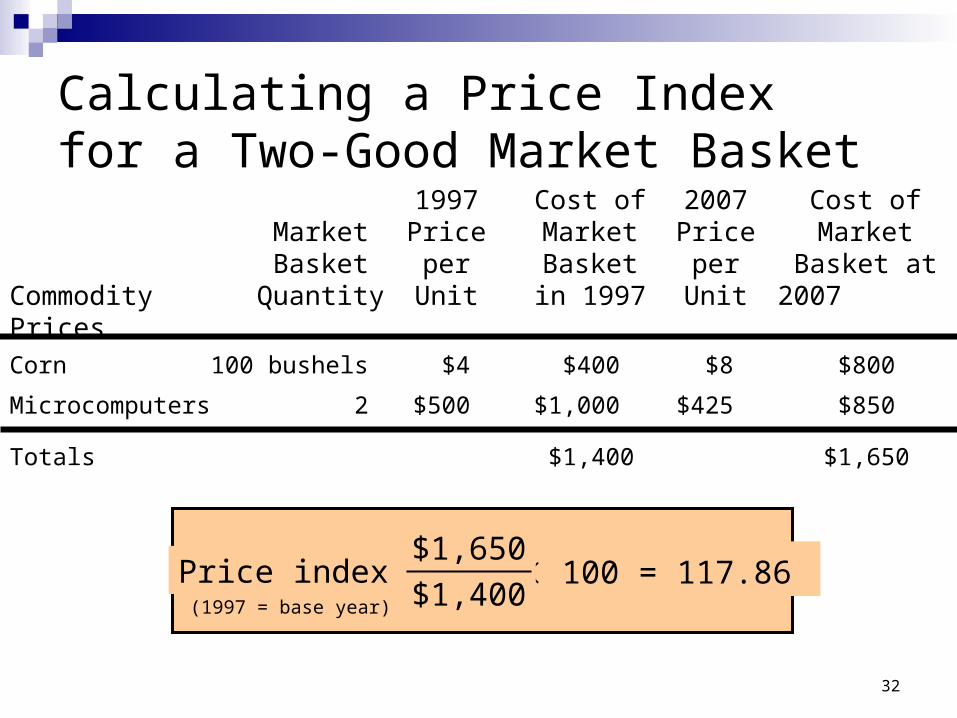
1997 Cost of 2007 Cost ofMarket Price Market Price MarketBasket per Basket per Basket at
Commodity Quantity Unit in 1997 Unit 2007 Prices
Corn 100 bushels $4 $400 $8 $800
Microcomputers 2 $500 $1,000 $425 $850
Calculating a Price Indexfor a Two-Good Market Basket
Totals $1,400 $1,650
Price index = 100 = 117.86 $1,650
$1,400(1997 = base year)

33
Inflation and Deflation
Real-world price indexesConsumer Price Index (CPI)Producer Price Index (PPI)GDP Deflator

34
Inflation and Deflation
Consumer Price Index (CPI) A statistical measure of a weighted average of prices
of a specified set of goods and services purchased by wage earners in urban areas
Market basket is based on a consumer expenditure survey
Methodology problems Substitution effect and the fixed quantity index Quality changes New products

35
Producer Price Index (PPI) A statistical measure of a weighted average of prices
of commodities that firms purchase from other firms Generally for non-retail markets Used as a leading indicator CPI PPIs for:
Food materials Intermediate goods
Finished goods
Inflation and Deflation

36
GDP DeflatorA price index measuring the changes in prices
of all final goods and services produced in the economy
Broadest measure of pricesNot based on a fixed market basket
Inflation and Deflation

37
Inflation and Deflation
Personal Consumption Expenditure IndexPrimary inflation index used by the Federal
ReserveBased on surveys of consumer purchases

38
Inflation and Deflation in U.S. History
Figure 7-6 Source: U.S. Department of Labor, Bureau of Labor Statistics

39
Anticipated versus Unanticipated InflationThe effects of inflation on individuals
depend upon which type of inflation exists.
Inflation and Deflation
40
Anticipated InflationThe rate of inflation that the majority of
individuals believe will occur Unanticipated Inflation
Inflation that comes as a surprise to individuals in the economy
Inflation and Deflation

41
Inflation and interest ratesNominal Rate of Interest
The market rate of interest expressed in today’s dollars
Real Rate of Interest The nominal rate of interest minus the anticipated
rate of inflation
Inflation and Deflation

42
Real interest rateNominal interest rate = 10%Expected inflation rate = 6%Real rate = 10% - 6% = 4%
Inflation and Deflation

43
Does inflation necessarily hurt everyone? Inflation affects people differently
Unanticipated positive inflationCreditor losesDebtors gains
Inflation and Deflation

44
Protecting against inflationCost-of-living adjustments (COLAs)
Clauses in contracts that allow for increases in specified nominal values to account of changes in the cost of living
Inflation and Deflation

45
The resource cost of inflationRepricing, or menu, cost of inflation
The cost associated with recalculating prices and printing new price lists when there is inflation
Inflation and Deflation
46
Business FluctuationsThe ups and downs in overall business
economic activity National income Employment Price level
Changing Inflation and Unemployment: Business Fluctuations

47
ExpansionA business fluctuation in which overall
business activity is rising at a more rapid rate than previously or at a more rapid rate than the overall historical trend for the nation
Changing Inflation and Unemployment: Business Fluctuations

48
ContractionA business fluctuation during which the pace
of national economic activity is slowing down
Changing Inflation and Unemployment: Business Fluctuations

49
RecessionA period of time during which the rate of
growth of business activity is consistently less than its long-term trend or is negative
DepressionAn extremely severe recession
Changing Inflation and Unemployment: Business Fluctuations

50
The Idealized Course of Business Fluctuations
Figure 7-7Time
Lev
el o
f N
atio
nal
Bu
sin
ess
Act
ivit
y
Peak
Peak
Growth trend
Exp
ansi
on
Trough
Contraction
(recession)

51
National Business Activity,1880–Present
Figure 7-8Source: American Business Activity from 1790 to Today, 67th Edition,
AmeriTrust Co., January 1996, plus author’s projections.

52
Leading Indicators Events that typically occur before, or “lead” changes
in business activity Leading indicators can be used to identify external
shocks. Examples of recession indicators
Reduction in the average workweek Decrease in prices of raw materials Drop in the quantity of money circulating
Changing Inflation and Unemployment: Business Fluctuations

53
The National Bureau of Economic Research publishes data on the length of all business contractions and expansions.
The cycle of business fluctuations has become longer over time, because the expansionary phase is now more prolonged.
Over the past half-century, the average expansion has lasted 57 months.
Issues and Applications: The Length of the Business Cycle

54
How the U.S. government calculates the official unemployment rate Unemployment is the percentage of the labor force
that is looking for work and currently not working
Types of Unemployment Frictional Structural Cyclical Seasonal
Summary Discussion of Learning Objectives

55
How price indexes are calculated and the key price indexes A price index is the cost of today’s market of goods
expressed as a percentage of the cost of the same markets basket during a base year
Key price indexes CPI PPI GDP Deflator
Summary Discussion of Learning Objectives

56
Summary Discussion of Learning Objectives
The nominal versus the real interest rate Real interest rate = nominal interest rate - anticipated
rate of inflation
Those who lose from inflation and those who gain Losers are creditors Gainers are debtors
Key features of business fluctuations Contractions Expansions

Chapter 7:
Unemployment, Inflation, and Deflation
ECON 151 – PRINCIPLES OF MACROECONOMICS
Materials include content from Pearson Addison-Wesley which has been modified by the instructor and displayed with permission of the publisher. All rights reserved.