1 china the mystique dragon flying high sunil r parekh senior director confederation of indian...
TRANSCRIPT

1
China China The Mystique Dragon Flying HighThe Mystique Dragon Flying High
Sunil R Parekh
Senior Director
Confederation of Indian Industry
Ahmedabad
Email : [email protected]

2
China and IndiaChina and IndiaChina India
Population 1.3 billion 1.0 billionLiteracy 83% 52%Life Expectancy 70 years 61 years
GDP ( $ trillion) 1 0.4 Composition of GDPAgriculture 17% 29%Industry 50% 20%Services 33% 51%
Import (2000-01) $225 bl $ 39 blExport (2000-01) $249 bl $ 45 bFDI ( 2001) $ 46 bl $ 3 bl

3
Key Components of GrowthKey Components of Growth Growth through domestic demand Competitive Pressure following WTO membership Policy of 5 SEZ, 14 open city. East China attracts 85% of all FDI ( $ 500
bl) SOE revival Manufacturing accounts for 50% of GDP Savings rate @32%-40% 17% VAT & no other manufacturing tax, 33% corporate tax Easy access to capital @ 2.5% pa Electricity cost @ Rs 2.5/KWH avg, extraordinary infrastructure ( Roads,
Ports, procedural efficiency) 250 of 500 Fortune 500 companies operating in East China within a
decade

4
Map of China

5
Guangdong vis-à-vis GujaratGuangdong vis-à-vis Gujarat
Fact Sheet Guangdong (2000)
Gujarat ( 2000)
Area 178,000 sq Km 196,000 sq Km
Population 86 million 52 million
GDP $ 118 billion $ 25 billion
Exports $ 93 billion $ 4 bl ( ex gems & jewellery)
Imports $ 82 billion
FI utilised $ 11 billion $ 0.5 bl

6
Other Progressive ProvincesOther Progressive Provinces
Fact Sheet (year 2000)
Jiangsu Fujian Shanghai Shandong Beijing
Area 102,600
Sq Km
121,700
Sq Km
6,340
Sq Km
156,700
Sq Km
16,800
Sq Km
Population 74 ml 35 ml 17 ml 91 ml 14 ml
GDP $ 104.6 bl $ 48 bl $ 56 bl $ 104 bl $ 30 bl
Exports $ 26 bl $ 14 bl $ 25 bl $ 16 bl $ 8 bl
Imports $ 23 bl $ 9 bl $ 30 bl $ 12 bl $17 bl
FI Utilised $ 6 bl $ 3 bl $ 3 bl $ 2 bl $2 bl

7
INDIA – CHINA TRADEINDIA – CHINA TRADE
Year Import from China
Export to China
1999 $ 1200 ml $ 800 bl
2000 $ 1600 ml $ 1400 bl
2001 $ 1900 ml $ 1700 bl
Key items for export to China– Minerals, Textiles, Machinery, Chemicals, Plastic
Key items for import from China– Organic Chemicals, Electrical Machinery, Mineral Fuel, Silk
( Balance of Trade in China’s favour)

8
India – Excessive services & too little India – Excessive services & too little industry, creating unbalanceindustry, creating unbalance
Industry Services GDP/cap ($)
China 49.3% 33.0% 769
Malaysia 46.0% 43.4% 4526
Indonesia 43.3% 37.3% 962
Thailand 40.0% 49.5% 2717
Vietnam 34.5% 40.1% 342
India 26.3% 46% 450A CII World Bank study - 2002

9
India – China India – China Item India China
Labour Less productive
Rigid laws
More productive
Flexible laws
Power Rs. 4.50-5.50/KWH Rs. 2.50-3.00/KWH
Int. rate 10-14% 2.5%
Decision Slow Very Fast
Roads 30 hrs for 600 Km 9 hrs for 600 Km
Ports 9 days 2 days for turn around
Raw material cost High Low
Telecom 167 th lines / month 9 mn lines/ month
Land cost High Comparatively low
Knowledge 51% literacy rate
Low Govt spending on higher education
80% literacy rate
High Govt spending on Higher education
Attitude to business
Mixed. Low usage of IT
Pro business. Thrust on use of IT

10
Manufacturing competitivenessManufacturing competitiveness
China IndiaRaw
MaterialValue
AdditionRaw
MaterialValue
AdditionFood Products 78.3 21.7 86.6 13.4Beverages 67.9 32.1 78.8 21.2Textiles 78.0 22.0 81.2 18.8Wearing Apparel 74.8 25.2 71.0 29.0Leather 75.2 24.8 88.1 11.9Wood Products 72.1 27.9 79.4 20.6Paper and Products 72.9 27.1 79.5 20.5Industrial Chemicals 72.9 27.1 76.1 23.9Petroleum Refineries 74.7 25.3 84.0 16.0Fabricated Metal Products 74.7 25.3 79.5 20.5Non-Electrical Machinery 73.3 26.7 76.6 23.4Electrical Machinery 77.0 23.0 73.7 26.3Transport Equipment 75.5 24.5 78.4 21.6

11
Hong KongHong Kong GDP $170 bl :-Service 90%, Industry 9.9%, Agriculture 0.1% Annual trade - $ 400 bl Trade with India – approx. $ 4 b (2001) Key Indian Exports – Pearls, precious & semi precious stones, textile yarns, leather, electrical
machinery and equipments Key Indian Imports – silver & platinum, semi-conductors, telecom equipments, office
equipments Immense potential for export of handicrafts, agriculture & fresh food products which can be
further explored & tapped Immense scope in financial services of IT products est @ $ 2.8 bl/year. Total
Domestic FS market is $ 8 bl Opportunity to invest in Cyber Port projects Excellent IPR regime Good Entry strategy for China

12
Overview of India - Hong Kong tradeOverview of India - Hong Kong trade 1999 2000 2001 (Jan – Dec)
Value Value Growth Value Growth
India to Hong Kong ( $ ml)
Exports 2,216 2,624 +18.4 2290 -12.7%
Hong Kong to India ( $ ml)
Domestic Exports
157 172 +9.9% 59 - 65.5%
Re-Exports 943 1,122 +19.0% 1142 +1.8%
Total Exports 1,099 1,294 +17.7% 1202 -7.1%
Total Bilateral Trade ( $ ml)
3,315 3,918 +18.2% 3,491 -10.9%
Trade Balance for India $ ml
+1,117 +1,330 +1088

13
PolicyPolicy
14
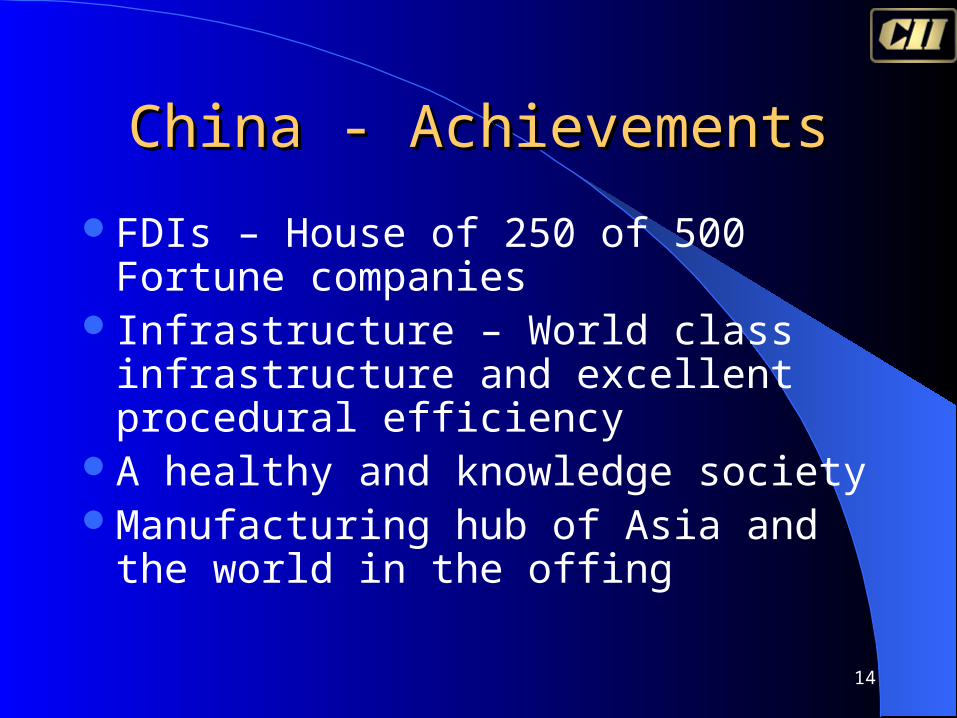
China - AchievementsChina - Achievements
FDIs – House of 250 of 500 Fortune companies
Infrastructure – World class infrastructure and excellent procedural efficiency
A healthy and knowledge society Manufacturing hub of Asia and the
world in the offing

15
ApproachApproach Disinvestment of SOEs Extensive Government support to higher education & increasing
the literacy rate Good health facilities Expanding market & integrating globally Competitive Business environment
For jobs Creation of manufacturing hub Hegemony in the region By leveraging domestic demand
Drivers of Policy Leadership in Asia Pacific region and Global To tackle unemployment & underemployment

16
Sustainability IssuesSustainability Issues
Infrastructure development – 96% developmental spending with a long term vision by government
Tax base – 15% of GDP, which can be doubled to earn greater revenue, after completion of incentives
High savings rate of 32-40%, cushioning effect Economy growing fast – ensures return on high
capital investment Labour component includes insurance premium

17
Taxation in ChinaTaxation in China Income Tax
The standard Foreign Enterprise Income Tax (FEIT) is 33% ( State tax 30% & LT 3%)The state tax of 30% can be reduced to 10%, 15% or 24%, if the enterprise is located in one of the specially designated zones and/or engaged in the relevant operations or projectsThe local tax of 3% may be waived or reduced by the local government.
Value Added Tax (VAT)The standard VAT rate is 17%, but certain products are taxed at 13%, or are exempt. Small scale business, as defined by authorities, are taxed at 6% or 4%, without any entitlement to input VAT credits
Business Tax ( Services)All entities and individuals who provide services (except for processing or repair services) or transfer intangible assets or immovable property in the PRC are subject to business tax, which ranges from 3% to 7%, while entertainment services attract business tax at 5% to 20%.

18
IncentivesIncentives A newly established Foreign Investment Enterprise (FIE) engaged in production
activities with a scheduled operation period of not less than ten years, is entitled to a five year tax holiday
They are entitled to full tax exemption for the first two profit making years and can enjoy a 50% tax reduction in the following three years
A FIE exporting 70% or more of its total production may receive a further reduction in tax in that year after the end of the five year tax holiday, subject to a minimum state tax rate of 10%
A FIE applying advanced technology may receive a 50% reduction in tax for a further three years following the five year tax holiday
If a FIE directly reinvests its dividends in that enterprise or uses it to establish another FIE, it may receive a refund of 40% of the state income tax paid on the reinvested amount. It will be 100% if the enterprise is export oriented or technologically advanced
Enterprises that acquire domestically sourced equipment may obtain an income tax credit of 40% of the cost of equipment

19
Other RegulationsOther Regulations Organisations’ controls
Foreign Investment Enterprises are required to submit recruitment plans to the local Organisation Bureau which then advise on the method of recruitment to be adopted
Employment contracts & payment systemsForeign investment enterprises are required to sign employment contracts with their workers, which are then certified by the local Organisations Bureau. FIEs can pay their wages, bonuses and subsidies directly to their workers.
Cost of EmploymentThe minimum basic salary of PRC employees in foreign investment enterprises should 20% higher than that of comparable salaries in the state enterprises.

20
Areas open for Foreign InvestmentAreas open for Foreign Investment Special Economic Zones
Estd in 1979. 5 SEZs- Shenzen, Zhuhai, Xiamen, Hainan, ShantouTo encourage investment through specially centrally-approved investment incentives and preferential tax treatment with a reduced income tax rate of 15%.
Open Coastal CitiesEstd in 1984. 14 Open Costal Cities with autonomy in approving foreign investment projects and offering various investment incentives to attract foreign business, but not the autonomy or degree of preferential treatment is not of the extent granted to SEZs.
Open Economic ZonesEstd inn1985. Yangtze & Pearl River delta area, Southern Fujian, Shandong and Liaoning peninsulaIncentives resemble those of the 14 Open Coastal Cities To encourage technology transfer, management reforms and production inputs between the coastal and interior regions

21
Areas open for Foreign InvestmentAreas open for Foreign Investment Economic & Technological Development Zones
Estd in 1999. 30 PRC citiesTo encourage advanced industry through foreign participation. FIEs engaged in production enjoy a 15% income tax rate
Pudong New AreaEstd in 1990. Preferential incentives similar to SEZs are grantedDeveloped as a banking and financial centreFIEs can do business in banking, insurance and retailingForeign banks are allowed to conduct Renminbi business in certain selected service categories
New & Hi-Technology Development Zones50 Zones engaged in in high technology industriesTo promote industrilisation of technologies owned by regional universities & research institutesReduced income tax rate of 15% for hi-tech enterprises

22
Areas open for Foreign InvestmentAreas open for Foreign Investment
Bonded Zones & Export Processing Zones
15 Bonded Zones
15 Export processing ZonesTo encourage processing trade.They are special customs areas. Special foreign exchange and taxation policies are available
Central & Western ChinaTo promote development of central & western region by developing the non-state sectors and township enterprises while invigorating the state sector, especially the military industry
23
Thank YouThank You

24
Opportunities for GujaratOpportunities for Gujarat
Pharma Chemicals Textile
Plastics Dairy & Dairy Products Silk
Elect & Machinery Leather Jems & Diamond

25
India’s Trade with E China RegionIndia’s Trade with E China Region
Name of the province
Imports from India’99 ($mn )
Exports to India ’99
($ mn)
Imports from India ’00 ($ mn)
Exports to India ’00
( $ mn)
Shanghai 43.7 53.5 153.01 81.8
Jiangsu 45.9 185.9 79.1 233.0
Zhejiang 34 99 69.5 160.6
Total 123.6 338.4 301.61 475.4

26
Key Sectors for Co-operationKey Sectors for Co-operation India’s Trade with Shanghai
Export : Import Organic Chemicals - $ 31 ml Elect Mach & Eqip - $ 14ml Minerals - $ 51 ml Mineral Fuel & Oil - $ 13 ml Textile - $ 14 ml Boiler & Machinery - $ 10ml Plastics - $ 6.3 ml Textiles - $ 3 ml Marine Products - $ 10.2 A Diamond trading center to be opened
India’s Trade with ZhejiangExport : Import Caprolactum - $14 ml Cotton yarn & fabrics - $ 22.4ml Chrome ore - $ 8.8 ml Raw silk - $12 mlMarine Product - $ 8 ml Pharmaceuticals - $ 7 mlCotton Yarn - $ 12 ml Dye Stuff - $ 6 mlPlastic raw material - $ 5 ml

27
India’s Export to ChinaIndia’s Export to ChinaProduct Category Value during Jan–Dec 2001
Minerals 546
Organic & Inorganic Chemicals 169
Textiles & raw materials 189
Plastic 166
Salt, Sulphur, Earth, Stone 96
Precious stone 83
Fish & Sea Food 78
Iron & Steel 64
Machinery 49
Leather 39
Mineral Fuel, Oil 37
Optical & Medical Inst 26
Total 1542(rounded up)
( $ mn)

28
India’s Imports from ChinaIndia’s Imports from ChinaProduct Category Value during Jan-Dec 2001
Organic Chemicals 379
Mineral Fuel, Oil etc 269
Electrical machinery 250
Silk, Silk Yarn, Fabric 181
Other Machinery 157
Salt, Sulphur, Earth, Stone 71
Inorganic Chem, Rare Earth Material 63
Optical, Medical Instruments 49
Impregnated Textile fabrics 42
Tanning, Dye, Paint, Putty 35
Precious Stones, Metals 34
Iron, Steel Products 29
Glass & Glassware 20
Furniture & Bedding 17
Total 1596 (rounded up)
( $ ml)

29
Total Chemical imports by China in the year 1999 was around $12 bl
Indian exports to China in the year 2000 was around US$ 0.2 bl
China’s export to chemicals to India in the year 2000 was around US$ 0.4 bl
Vam Organic & Kanoria Chemicals both have established registered office in Shanghai
Ranbaxy & Dr Reddy’s Laboratories both have registered their presence in the form of production joint ventures with local Chinese companies in Guangzhou & Kunshan.
Opportunities in Chemical IndustryOpportunities in Chemical Industry

30
Opportunities in Chemical Industry Contd..Opportunities in Chemical Industry Contd..
Name of the Commodity
India’s Export to China
($ mn, 1999)
China’s total import
($ mn, 1999)
Organic Chemicals 100 5500
Inorganic Chemicals 24 1000
Dyestuffs 4 286
Pigments 1 402
Coatings 1 655
Pesticides 4 243

31
Chinese Dairy industry is at a nascent stage of developmentDomestic need is met through imports Immense opportunity for Indian dairy industry to export
Countries exporting Dairy products to China:
New Zealand ( Powdered milk)USA (Whey)Australia ( Fluid milk)Malaysia, Finland, France & CanadaHong Kong re-exports dairy products to ChinaIndia has a negligible presence
Opportunities in Dairy IndustryOpportunities in Dairy Industry
32
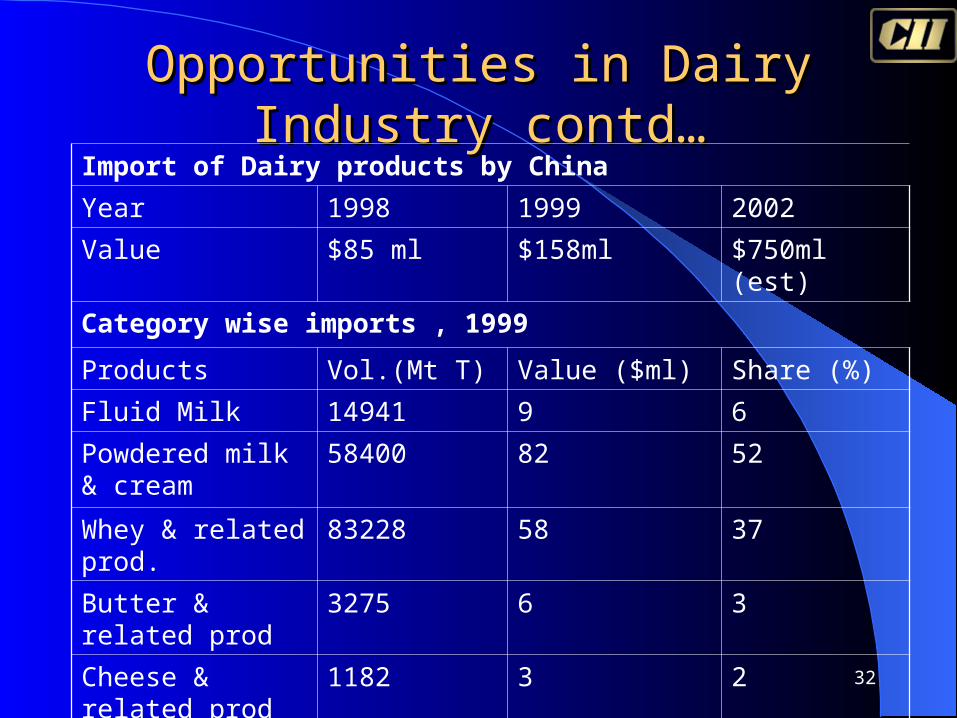
Opportunities in Dairy Industry contd…Opportunities in Dairy Industry contd…Import of Dairy products by China
Year 1998 1999 2002
Value $85 ml $158ml $750ml (est)
Category wise imports , 1999
Products Vol.(Mt T) Value ($ml) Share (%)
Fluid Milk 14941 9 6
Powdered milk & cream
58400 82 52
Whey & related prod.
83228 58 37
Butter & related prod
3275 6 3
Cheese & related prod
1182 3 2

33
Indian Commercial Presence Indian Commercial Presence in East Chinain East China
Dr Reddy’s Laboratory Kanoria Petrochemicals LtdNIIT RaymondAptech United Phosphorus LtdSatyam Computers Ltd Vaishali PetrochemicalsTCS Arobindo PharmaVam Organic Pan Product Impex Pvt LtdBry Air Sundaram Fastners LtdState Bank of India TI Cycles LtdOrind Refractories RanbaxyEssel Packaging Infosys Ltd

34
Challenges and Opportunities Challenges and Opportunities in China’s IT market 2002in China’s IT market 2002

35
1300 14801720
21502502
41.3
13.9 16.2
25
16.4
0
500
1000
1500
2000
2500
3000
1997 1998 1999 2000 2001
0
10
20
30
40
50
$15.7b
$ 17.9b$20.82b
$26.02b$30.3b
Sal
es A
mo
un
t (H
un
dre
d M
illi
on
RM
B)
Gro
wth
Ra
te (
%)
Growth of China’s IT Market 1997-2000

36
Drivers of IT Growth in China
Competitive pressure following WTO membership Product differentiation by Hardware manufacturers Explicit Government support for progress through use of IT in
society Major e-governance initiatives including Sowant (SMEs), Social
Insurance, The Golden Bridge Project, The Golden Taxation Project, The Golden Health Project
Thrust on development of IT as a business Convergence and cost benefits SOE revival Sector Demand : Banking, Telecom, Security, Corporates, IT
education, System Integration, Energy Transport & Logistics

37
Year 2000 Year 2001 Year 2002
Category Sale Amount (US$)
Growth Rate (%)
Sale Amount (US$)
Growth Rate (%)
Sale Amount (US$)
Growth Rate (%)
Hardware $19.4b 22.6 $22.0b 13.5 $26.05b 18.5
Software $2.78b 30.7 $ 3.5b 23.9 $4.32b 25.3
Information Service
$3.87b 34.2 $ 4.8b 25.5 $6.10b 25.4
Total $26.03b 25 $30.3b 16.4 $36.48 20.4
Structure & Increase of China’s IT Market 2000-01

38
Development in China’s Software Market 1999-2001Development in China’s Software Market 1999-2001
Year 1999 2000 2001
Software Sales Total $2.1b $2.8b $3.5b
Increase 27.5% 30.7% 23.9%
Software Category Software Sales Total
Increase (%)
Platform Software $1.1b 16.4
Intermediate Software $0.2b 59.6
Application Software $2.2b 25.3
Total $3.5b 23.9
Development in China’s Software Market 2001

39
Human Capital in ChinaHuman Capital in China 2,00,000 – 3,00,000 people employed in software companies;
High demand Supply gap – supply: 50,000 & Demand: 3,50,000 ( Gartner)
Most IT professionals are comfortable in reading & writing English, but not in spoken English. About 20 million people undergoing English language training
Severe shortage of experience IT professionals, especially project managers. They are currently recruited from Hong Kong & Australia
Making a quantum jump in gearing students with IT & English in over last 2&1/2 years. Universities are encouraged to strike R&D alliance with leading International companies and academia
Generates 50-60 thousand IT engineers every year

40
Labor CostsLabor CostsSalaries of software professionalsSalaries of software professionals
Rs./Month Xian Beijing Dalian Shanghai
Entry Level Rs. 15,000 Rs. 24,000 Rs. 15,000 Rs. 24,000
Entry Level from top Univ
Rs. 24,000 Rs. 36,000 n.a. Rs.42,000
3-5 yrs Exp Rs. 35,000 Rs. 48,000 Rs. 33,000 Rs. 48,000

41
Cost of Doing Business Cost of Doing Business Xian Beijing Dalian Shanghai
Rental in S/W Park
Rs./sqmt./month
Rs.216 n.a. Rs. 324 Rs. 252
Telecom leased circuit
(2Mbps, $p.a)
$ 1,12,000 approx
House property cost
(ownership Rs./sqmt)
10,8000-
21,000
18,000- 1,08,000
12,000- 30,000
21,000- 1,50,000
Electricity costs (commercial)
Rs. 2.5 per KWH

42
Telecom boom Year(2001) Growth rate Mobile phones 145ml 60ml/yr Fixed Lines 179ml 9ml lines/month PDAs na 3ml/year
Investment - US$ 24b in year 2000 & US$ 31b in year 2001
Internet - 33 ml users * by year 2004 with an average growth rate of 54%
PC population est 16 ml growing @ 11ml/year, (Domestic 3 ml/ yr) Opportunities in Technology Development, Software & Services.
Opportunities with ChinaOpportunities with China

43
Opportunities with China Opportunities with China contd…contd…
Banking & Financial Service
Huge opportunities with an economy size of $1.04tl in-•Security products •Banking products •Support services
To bring in large scale effectiveness in Database Management, Transaction and Credit Control
All banks are SOEs and supplies are from mlCs.

44
Opportunities with China Opportunities with China contd…contd…
Management Solutions 11 ml business establishments – SOEs & MNCs Competitive Pressure Huge market for product of Logistics & SMEs
IT Training & Education Education Software accounts for 10-15% of total software
sales Edu S/W accounts for mearly half of all software sales in
the major urban centres ( eg, Beijing , Guangzhou) Increasing number of students in higher education Estimated 200 million English learners

45
Opportunities with China Opportunities with China contd…contd… Penetration into Japan & SE Asia E-Governance initiatives & Golden projects IT services :
System Integration ($ 3bl) • IT consultantsOutsourcing, maintenance support
Broad Band content development : 2 Mb/desktop (E China)Entertainment • CommerceCommunication • Transaction
Infrastructure providerLAN (1.4ml) & WAN (0.45ml)Basic Fiber ProviderGateways
Major collaborative arrangement for Content Development for Bandwidth (Transaction, Entertainment & Commerce)

46
Opportunities with China Opportunities with China contd…contd…Investment in Domestic MarketInvestment in Domestic Market
Competitive SI vendor in Public Sector LAS CS&S eBIS Taiji Powerise Nantian Newsky AsianInfo Computer &
Technologies
Golden Projects Golden Bridge – national public economic information network
Golden Custom – foreign trade & economic information system
Golden Card – automatic payment system and electronic currency engineering
Golden Taxation – electronic taxation system
Golden Agriculture – integrated management & information service system
Golden Enterprises – enterprise production and logistics information service system
Golden Intelligence – research and education computer network and human resource engineering
Golden Macro – national macro-economics decision support system
Golden Information – national statistics information engineering
Golden Hygiene – national medical information network

47
Opportunities with China Opportunities with China contd…contd…
Hardware & Chip Design
Manufacturing from Korea and Taiwan getting into Pudong In collaboration with MNCs and their R&D
laboratories
Embedded Technology for – intelligent appliances eg Haier Online industry automations
Bring their Hardware manufacturers into India

48
Broad StrategyBroad Strategy Doing business with China
It is important to engage with China & integrate with it through -
– Cooperation - Competition– Mutual Investments
Long-term approach Investment in relationship & establishment of Goodwill Master the language for communication, IT products Strategy for protecting domain knowledge
Competitiveness China – India Comparison
Wage Structure Comparable at Junior LevelIndia - Advantage at senior Level
Education Level Comparable at Junior LevelIndia - Advantage at senior Level
English Language & Ability to Programme
India - Advantage

49
Strategy OptionsStrategy Options Telecom/Banking institutions – Joint Ventures with mlCs/
Local Giants
SMEs and Domestic Corporations - wholly owned subsidiaries with local Management
E-governance projects – Joint Venture with companies led by Chinese SOEs/ Hardware companies/ Software companies/Beijing University/Software & Hitech Parks/ Provincial Governments
IT education –Universities/Colleges/Software Technology Development Parks/Franchisee (Problem of Piracy)

50
Potential leading IT PartnersPotential leading IT PartnersSoftware Hardware Communication
NEU-Soft Legend China Telecom,
Founder Electronics
Founder China Mobile
CS&S Great Wall Computer Group
China Railway Telecom
Kingdee Kanka China Unicom
UFSoft Hauwei Jitong
Kingsoft ZTE Technologies CNC

51
Possible locationPossible location
Pudong – Chip DesignShenzen – Corporate solutionBeijing – Banking / Finance / Telecom /
SecurityShanghai – SMEs, Management SoftwareUniversities – IT Education & TrainingDalian, Xian – Hitech industries
52
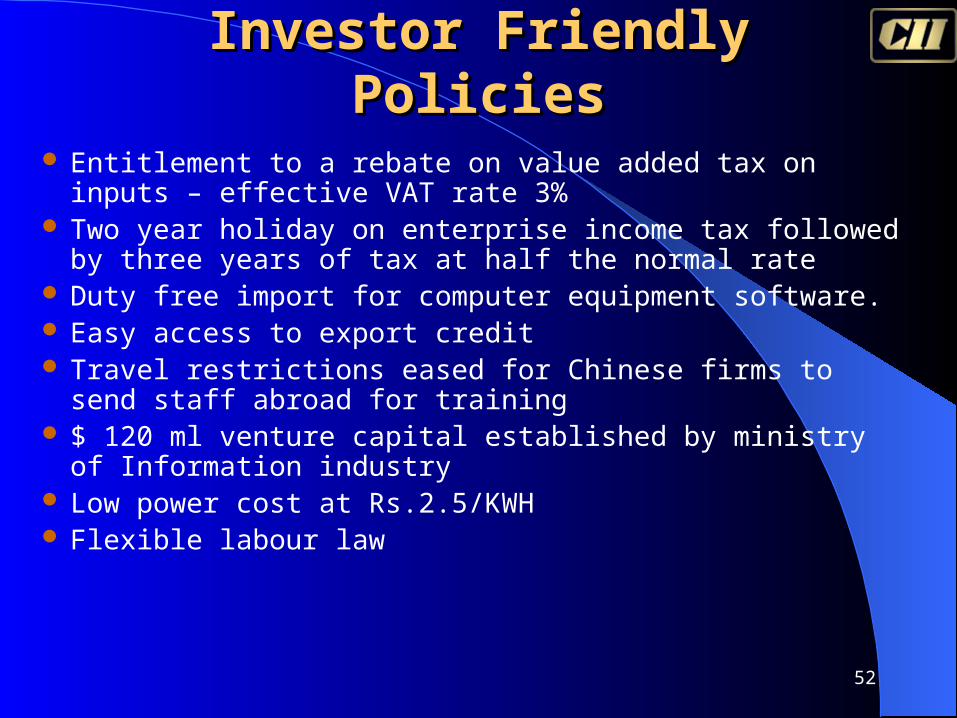
Investor Friendly PoliciesInvestor Friendly Policies
Entitlement to a rebate on value added tax on inputs – effective VAT rate 3%
Two year holiday on enterprise income tax followed by three years of tax at half the normal rate
Duty free import for computer equipment software. Easy access to export credit Travel restrictions eased for Chinese firms to send staff abroad
for training $ 120 ml venture capital established by ministry of Information
industry Low power cost at Rs.2.5/KWH Flexible labour law
53
Thorns under the bed of RosesThorns under the bed of Roses
Chinese lag far behind Indian firms in their customer-service ethic and understanding of foreign clients
Concentration in domestic market has a disadvantage of being late-starters to capture the overseas & export market
Piracy - China suffers from a high piracy rate of 91%, which is an important psychological barrier. India has successfully tackled piracy.
China is many years away from developing the marketing skills required to sell packaged software abroad.

54
Publications on “Doing Business in Publications on “Doing Business in China”China”
Trading and Investment Locations in East China
General Handbook of Information Export Strategy for the China market The pharmaceuticals market The economic environment The Dairy industry market Chemicals industry & market

55
Important Chinese ContactsImportant Chinese ContactsShanghai Municipal Foreign Economic Relations & Trade Commission (SMFERTC)
Room No 2207, New Town Mansion
#55, Lou Shan Guan Road, Shanghai- 200335 (PRC)
Tel : 86 21 62752200 Extn: 216 Fax: 86 21 62751919
Contact Ms Zhou Li Ying, Director (FAO)
China Council for Promotion of International Trade (CCPIT)
(Shanghai Branch), # 28, Jin Lin Xi Lu, Shanghai – 200021 (PRC)
Tel : 86 21 63865572 Fax: 86 2163869915
Contact: Mr Robert Zhao, Chief Liaison Officer
China Council for Promotion of International Trade (CCPIT)
(Pudong Branch)
#135, Dong Fang Road, Shanghai – 200120
Tel : 86 21 50810960/ 50812666 / 50811575 Fax: 86 2150815423
Mobile 13801669814 Email: [email protected]
Contact: Mr Zhao Feng, Liaison & Investment Dept
Shanghai Federation of Industry & Commerce (SFI&C)
Shanghai Chamber of Commerce
17-F, #55, Yan An East Road, Shanghai 200002 (PRC)
Tel : 86 21 63373169/ (D) 63373417 Fax:86 21 63373416
Contact: Ms Fan Tian Ping, Chief Liaison Dept
Email: [email protected]

56
Important Chinese ContactsImportant Chinese ContactsForeign Affairs Office, ShanghaiMunicipal People’s Government
# People’s Mansion, 200, People’s Avenue (at People’s Square)
Tel: 86 21 62552103 Fax: 86 21 62552102
Contact: Mr Fan Yufei
Foreign Affairs Office, Shanghai Municipal People’s Government
(Party Guest Division) 1418 Nanjing Xi Lu, Shanghai (PRC)
Tel : 86 21 62565900 (D) 62158270
Contact: Ms Yin Hui, Party Guest Division
Foreign Affairs Office, Shanghai Municipal People’s Government, Protocol Division
# 1418 Nanjing West Road, Shanghai (PRC) 200040
Tel: 86 21 62561033/62565900
Fax: 86 21 62530127 Mobile: 1390708806
Contact : Mr Jin Yi
China Council for Promotion of International Trade (CCPIT)
(Jiangsu Branch), # 29, Beijing Dong Lu, Jiangsu – 210008 (PRC)
Tel : 86 21 2258414 Fax: 86 25 2233048
Contact: Ms Qiu Xiao Ping, Liaison Dept
China Council for Promotion of International Trade (CCPIT)
(Zejiang Branch) # 470, Yan An Lu, Zhejiang – 310006 (PRC)
Tel : 86 571 5063262 Fax: 86 571 5150098
Email: [email protected]
Contact: Mr Wang Yu Fu, Chief Liaison Dept
Shanghai Municipal People’s Congress
# People’s Mansion 200, People’s Avenue (at People’s Square)
Tel : 86 21 63119149 Fax: 86 2163586540
Contact: Ms Wu Wen (Mobile:13004174154
Ms Ma Yue (Pager: 128x512231)