1 constructing composite indicators: from theory to practice ecfin, november 11-12, 2010 andrea...
TRANSCRIPT
1
Constructing Composite Indicators: From Theory to Practice ECFIN, November 11-12, 2010
Andrea Saltelli
Ranking and rating: Woodo or Science?
Andrea Saltelli, European Commission, Joint Research Centre,
Unit of Applied Statistics and Econometrics
X Conferenza Nazionale di StatisticaRoma
15-16/12/2010

2
Constructing Composite Indicators: From Theory to Practice ECFIN, November 11-12, 2010
Andrea Saltelli
October 2005 992
June 2006 1,440
May 2007 1,900
October 2008 3,030
September 2009
4,420
August 2010 5,240 (5,280 today)
Searching “composite indicators” on Scholar Google:
0
1000
2000
3000
4000
5000
6000
5/28/2005 10/10/2006 2/22/2008 7/6/2009 11/18/2010

3
Constructing Composite Indicators: From Theory to Practice ECFIN, November 11-12, 2010
Andrea Saltelli
David Hand, president of the
UK Royal statistical Society
“League tables […] are an easy target for criticism.
[…] surgeon can refuse to operate on the difficult cases, schools can refuse to enter those pupils likely to do poor in examinations, health authorities can defer making appointments for some patients, so that the waiting lists look smaller, and so on.”

4
Constructing Composite Indicators: From Theory to Practice ECFIN, November 11-12, 2010
Andrea Saltelli
5
Constructing Composite Indicators: From Theory to Practice ECFIN, November 11-12, 2010
Andrea Saltelli
The Stiglitz report, on page 65, mentions: […] a general criticism that is frequently
addressed at composite indicators, i.e. the arbitrary character of the procedures used to
weight their various components.
Adding: […] The problem is not that these weighting procedures are hidden, non-
transparent or non-replicable – they are often very explicitly presented by the authors of the indices, and this is one of the strengths of this
literature. The problem is rather that their normative implications are seldom made explicit
or justified.

6
Constructing Composite Indicators: From Theory to Practice ECFIN, November 11-12, 2010
Andrea Saltelli
[…] The problem is not that these weighting procedures are hidden, non-transparent or non-replicable – they are often very explicitly presented by the
authors of the indices, Disagree: Weighting problems are often not so
evident. E.g. Most composite indicators are built by linear
aggregation which are almost by definition wrong. Can something be done to alleviate the
problem?
7
Constructing Composite Indicators: From Theory to Practice ECFIN, November 11-12, 2010
Andrea Saltelli
Are ubiquitous
Can deceive
Can inform
How can one tell the good from the
bad?
A first case study: University ranking
8
Constructing Composite Indicators: From Theory to Practice ECFIN, November 11-12, 2010
Andrea Saltelli
Rickety Numbers: Volatility of university rankings and policy implications, Michaela
Saisana, Béatrice d'Hombres, Andrea Saltelli, To appear on Research Policy ~2010/2011
Sources (I):
9
Constructing Composite Indicators: From Theory to Practice ECFIN, November 11-12, 2010
Andrea Saltelli
Sources (II):

10
Constructing Composite Indicators: From Theory to Practice ECFIN, November 11-12, 2010
Andrea Saltelli
Joint OECD-JRC handbook.
•5 years of preparation,
•2 rounds of consultation with OECD high level statistical committee,
•finally endorsed March 2008 with one abstention
Sources III

11
Constructing Composite Indicators: From Theory to Practice ECFIN, November 11-12, 2010
Andrea Saltelli 2010 Rule of Law Index (World Justice Project)2010 Global Competitiveness Index (WEF)2010 Regional Competitiveness Index (DG REGIO, JRC)2010 Multidimensional Poverty Assessment Tool (UN IFAD)2010/2008/2006 Environmental Performance Index (Yale & Columbia Uni)2009 Index of African Governance (Harvard Kennedy School)2008 Product Market Regulation Index (OECD)2008 European Lifelong Learning Index (Bertelsmann Foundation, CCL)2007 Alcohol Policy Index (New York Medical College)2007 Composite Learning Index (Canadian Council on Learning)2002/2005 Environmental Sustainability Index (Yale & Columbia University)
Methodology applied to:

12
Constructing Composite Indicators: From Theory to Practice ECFIN, November 11-12, 2010
Andrea Saltelli
Sensitivity Analysis
13
Constructing Composite Indicators: From Theory to Practice ECFIN, November 11-12, 2010
Andrea Saltelli
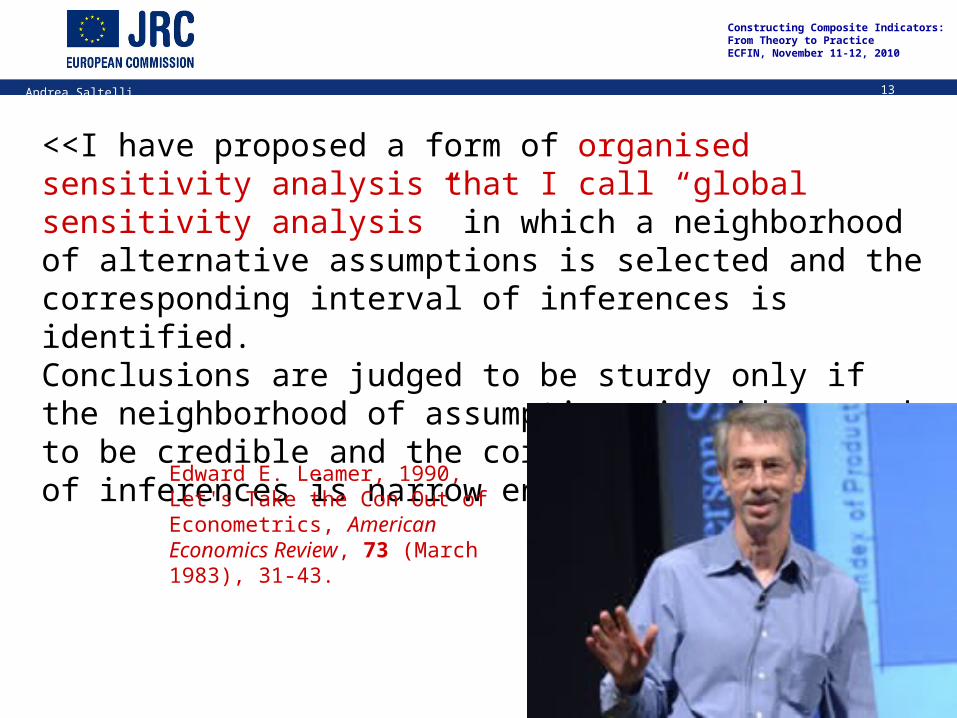
<<I have proposed a form of organised sensitivity analysis that I call “global sensitivity analysis” in which a neighborhood of alternative assumptions is selected and the corresponding interval of inferences is identified. Conclusions are judged to be sturdy only if the neighborhood of assumptions is wide enough to be credible and the corresponding interval of inferences is narrow enough to be useful.>>
Edward E. Leamer, 1990, Let's Take the Con Out of Econometrics, American Economics Review, 73 (March 1983), 31-43.
14
Constructing Composite Indicators: From Theory to Practice ECFIN, November 11-12, 2010
Andrea Saltelli
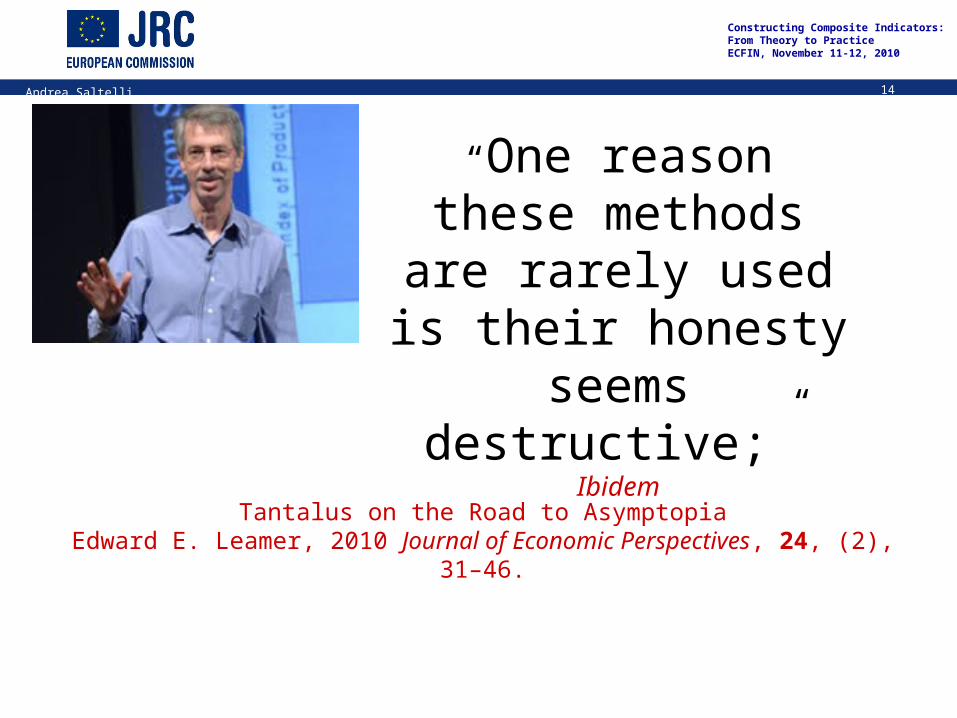
“One reason these methods are rarely
used is their honesty seems destructive;”
Ibidem
Tantalus on the Road to AsymptopiaEdward E. Leamer, 2010 Journal of Economic Perspectives, 24, (2),
31–46.

15
Constructing Composite Indicators: From Theory to Practice ECFIN, November 11-12, 2010
Andrea Saltelli
Peter Kennedy, A Guide to Econometrics.
Anticipating criticism by applying sensitivity analysis. This is one of
the ten commandments of applied econometrics according
to Peter Kennedy:
<<Thou shall confess in the presence of sensitivity.
Corollary: Thou shall anticipate criticism >>
The critique of models <-> Uncertainty
16
Constructing Composite Indicators: From Theory to Practice ECFIN, November 11-12, 2010
Andrea Saltelli
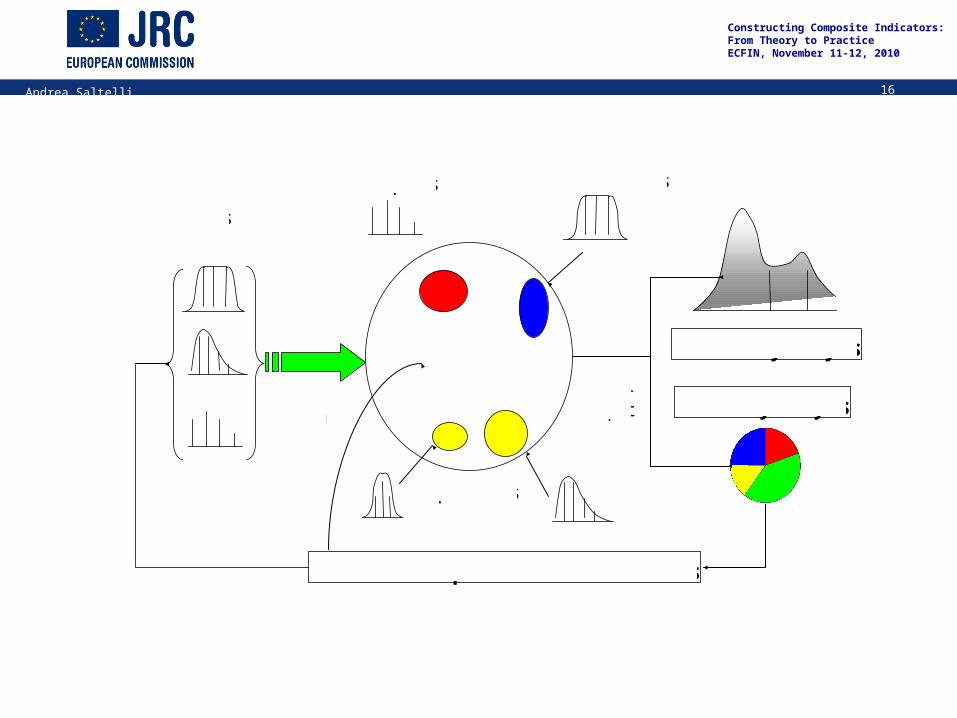
Simulation Model
parameters
data
errors
model structures
uncertainty analysis
sensitivity analysismodel output
feedbacks on input data and model factors
model assumptions
17
Constructing Composite Indicators: From Theory to Practice ECFIN, November 11-12, 2010
Andrea Saltelli
Two international university rankingsSJTU rankingTHES ranking
Robustness (uncertainty & sensitivity analysis)

18
Constructing Composite Indicators: From Theory to Practice ECFIN, November 11-12, 2010
Andrea Saltelli
University rankings are used to judge about the performance of university systems

19
Constructing Composite Indicators: From Theory to Practice ECFIN, November 11-12, 2010
Andrea Saltelli
• Two international university rankings yearly published
+ Very appealing for capturing a university’s multiple missions in a single number
+ Allow one to situate a given university in the worldwide context
- Can lead to misleading and/or simplistic policy conclusions
20
Constructing Composite Indicators: From Theory to Practice ECFIN, November 11-12, 2010
Andrea Saltelli
Questions: can we have confidence in university rankings?
How much do the university ranks depend on the methodology (weighting scheme, aggregation, indicators)?

21
Constructing Composite Indicators: From Theory to Practice ECFIN, November 11-12, 2010
Andrea Saltelli
Criteria Indicator Weight Quality of Education
Alumni of an institution winning Nobel Prizes and Fields Medals
10%
Staff of an institution winning Nobel Prizes and Fields Medals
20%
Quality of Faculty Highly cited researchers in 21 broad
subject categories 20%
Articles published in Nature and Science 20% Research Output Articles in Science Citation Index-
expanded, Social Science Citation Index 20%
Academic performance
Academic performance with respect to the size of an institution
10%
SJTU ranking

22
Constructing Composite Indicators: From Theory to Practice ECFIN, November 11-12, 2010
Andrea Saltelli
METHODOLOGY
6 indicators
Best performing institution =100; score of other institutions calculated as a percentage
Weighting scheme chosen by rankers
Linear aggregation of the 6 indicators
SJTU ranking

23
Constructing Composite Indicators: From Theory to Practice ECFIN, November 11-12, 2010
Andrea Saltelli
PROS and CONS
6 « objective » indicators
Focus on research performance, overlooks other U. missions.
Biased towards hard sciences intensive institutions
Favours large institutions
SJTU ranking

24
Constructing Composite Indicators: From Theory to Practice ECFIN, November 11-12, 2010
Andrea Saltelli
Criteria Indicator Weight
Academic Opinion: Peer review, 6,354 academics 40% Research Quality
Citations per Faculty: Total citation/ Full Time Equivalent faculty 20%
Graduate Employability Recruiter Review: Employers’ opinion, 2,339 recruiters 10%
International Faculty: Percentage of international staff 5% International Outlook
International Students: Percentage of international students 5%
Teaching Quality Student Faculty: Full Time Equivalent faculty/student ratio 20%
THES ranking

25
Constructing Composite Indicators: From Theory to Practice ECFIN, November 11-12, 2010
Andrea Saltelli
METHODOLOGY
6 indicators
z-score calculated for each indicator; best performing institution =100; other institutions are calculated as a percentage
Weighting scheme: chosen by rankers
Linear aggregation of the 6 indicators
THES ranking

26
Constructing Composite Indicators: From Theory to Practice ECFIN, November 11-12, 2010
Andrea Saltelli
PROS and CONS Attempt to take into account teaching quality Two expert-based indicators: 50% of total Subjective indicators, lack of transparency Substantial yearly changes in methodology Measures research quantity
THES ranking

27
Constructing Composite Indicators: From Theory to Practice ECFIN, November 11-12, 2010
Andrea Saltelli
RED=UK
(all under the SJTU=THES line…)

28
Constructing Composite Indicators: From Theory to Practice ECFIN, November 11-12, 2010
Andrea Saltelli
Assumption Alternatives
Number of indicators all six indicators included or
one-at-time excluded (6 options)
Weighting method original set of weights,
factor analysis,
equal weighting,
data envelopment analysis
Aggregation rule additive,
multiplicative,
Borda multi-criterion
Robustness analysis of SJTU and THES
29
Constructing Composite Indicators: From Theory to Practice ECFIN, November 11-12, 2010
Andrea Saltelli
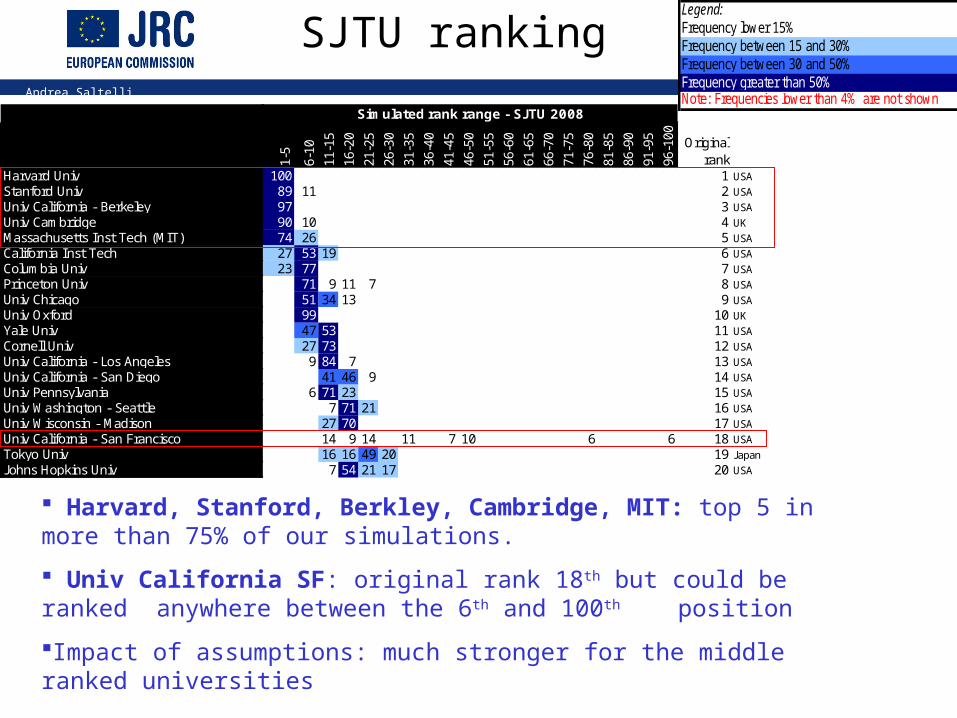
Harvard, Stanford, Berkley, Cambridge, MIT: top 5 in more than 75% of our simulations.
Univ California SF: original rank 18th but could be ranked anywhere between the 6th and 100th position
Impact of assumptions: much stronger for the middle ranked universities
Legend:Frequency lower 15%Frequency between 15 and 30%Frequency between 30 and 50%Frequency greater than 50%Note: Frequencies lower than 4% are not shown
1-5
6-10
11-1
5
16-2
0
21-2
5
26-3
0
31-3
5
36-4
0
41-4
5
46-5
0
51-5
5
56-6
0
61-6
5
66-7
0
71-7
5
76-8
0
81-8
5
86-9
0
91-9
5
96-1
00 Originalrank
Harvard Univ 100 1 USAStanford Univ 89 11 2 USAUniv California - Berkeley 97 3 USAUniv Cambridge 90 10 4 UKMassachusetts Inst Tech (MIT) 74 26 5 USACalifornia Inst Tech 27 53 19 6 USAColumbia Univ 23 77 7 USAPrinceton Univ 71 9 11 7 8 USAUniv Chicago 51 34 13 9 USAUniv Oxford 99 10 UKYale Univ 47 53 11 USACornell Univ 27 73 12 USAUniv California - Los Angeles 9 84 7 13 USAUniv California - San Diego 41 46 9 14 USAUniv Pennsylvania 6 71 23 15 USAUniv Washington - Seattle 7 71 21 16 USAUniv Wisconsin - Madison 27 70 17 USAUniv California - San Francisco 14 9 14 11 7 10 6 6 18 USATokyo Univ 16 16 49 20 19 JapanJohns Hopkins Univ 7 54 21 17 20 USA
Simulated rank range - SJTU 2008
SJTU ranking
30
Constructing Composite Indicators: From Theory to Practice ECFIN, November 11-12, 2010
Andrea Saltelli
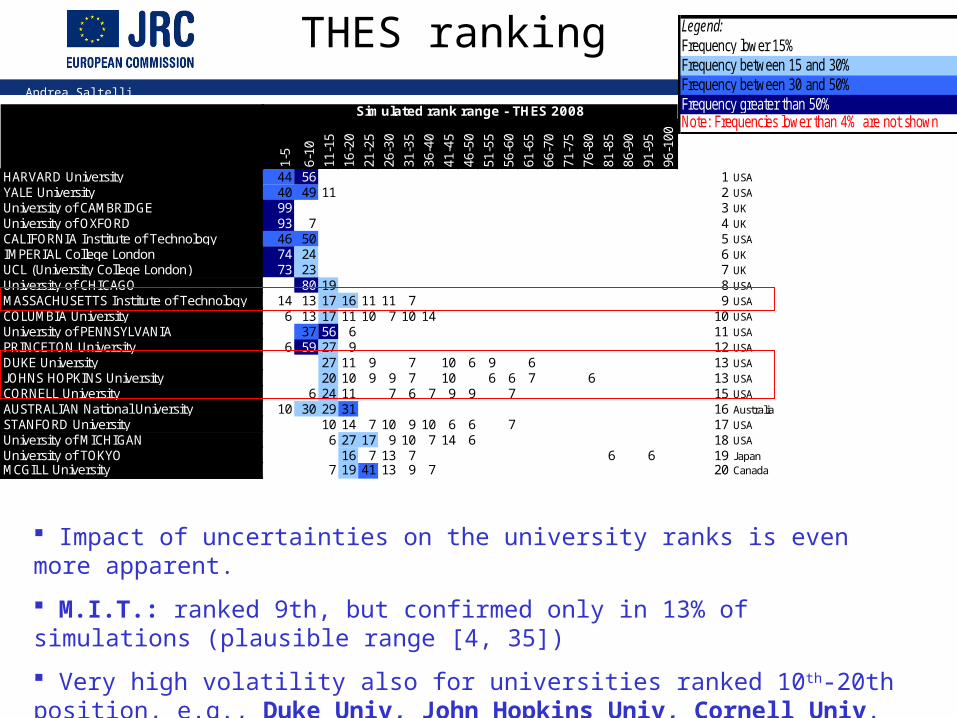
Impact of uncertainties on the university ranks is even more apparent.
M.I.T.: ranked 9th, but confirmed only in 13% of simulations (plausible range [4, 35])
Very high volatility also for universities ranked 10th-20th position, e.g., Duke Univ, John Hopkins Univ, Cornell Univ.
Legend:Frequency lower 15%Frequency between 15 and 30%Frequency between 30 and 50%Frequency greater than 50%Note: Frequencies lower than 4% are not shown
1-5
6-10
11-1
5
16-2
0
21-2
5
26-3
0
31-3
5
36-4
0
41-4
5
46-5
0
51-5
5
56-6
0
61-6
5
66-7
0
71-7
5
76-8
0
81-8
5
86-9
0
91-9
5
96-1
00
HARVARD University 44 56 1 USAYALE University 40 49 11 2 USAUniversity of CAMBRIDGE 99 3 UKUniversity of OXFORD 93 7 4 UKCALIFORNIA Institute of Technology 46 50 5 USAIMPERIAL College London 74 24 6 UKUCL (University College London) 73 23 7 UKUniversity of CHICAGO 80 19 8 USAMASSACHUSETTS Institute of Technology 14 13 17 16 11 11 7 9 USACOLUMBIA University 6 13 17 11 10 7 10 14 10 USAUniversity of PENNSYLVANIA 37 56 6 11 USAPRINCETON University 6 59 27 9 12 USADUKE University 27 11 9 7 10 6 9 6 13 USAJOHNS HOPKINS University 20 10 9 9 7 10 6 6 7 6 13 USACORNELL University 6 24 11 7 6 7 9 9 7 15 USAAUSTRALIAN National University 10 30 29 31 16 AustraliaSTANFORD University 10 14 7 10 9 10 6 6 7 17 USAUniversity of MICHIGAN 6 27 17 9 10 7 14 6 18 USAUniversity of TOKYO 16 7 13 7 6 6 19 JapanMCGILL University 7 19 41 13 9 7 20 Canada
Simulated rank range - THES 2008
THES ranking
31
Constructing Composite Indicators: From Theory to Practice ECFIN, November 11-12, 2010
Andrea Saltelli
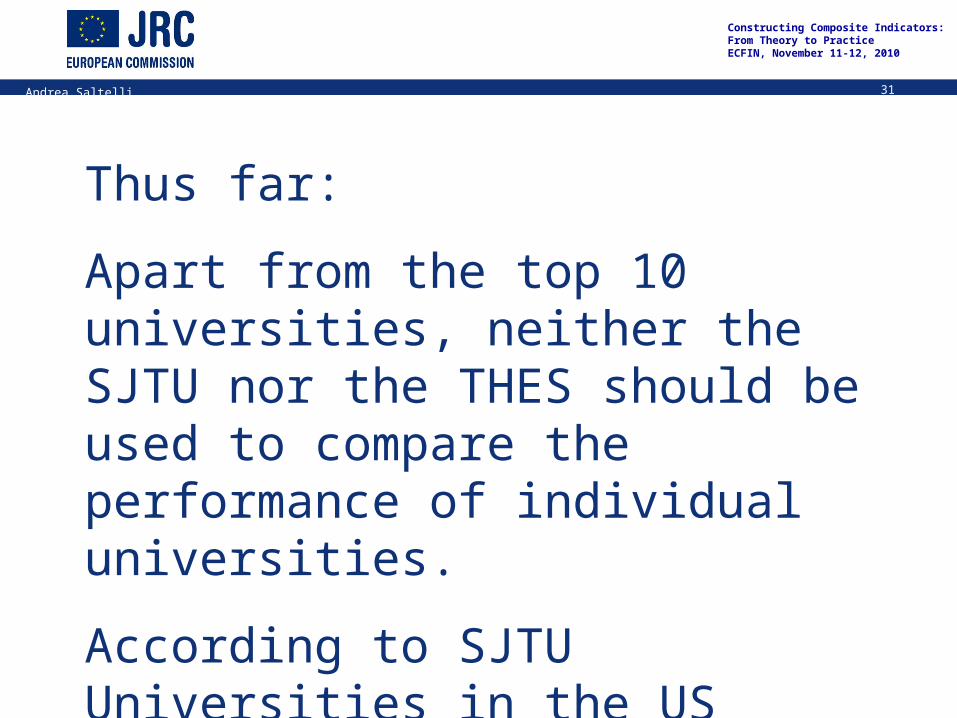
Thus far:
Apart from the top 10 universities, neither the SJTU nor the THES should be used to compare the performance of individual universities.
According to SJTU Universities in the US outperform those in Europe – less so for THES but there is a bias toward UK universities
32
Constructing Composite Indicators: From Theory to Practice ECFIN, November 11-12, 2010
Andrea Saltelli
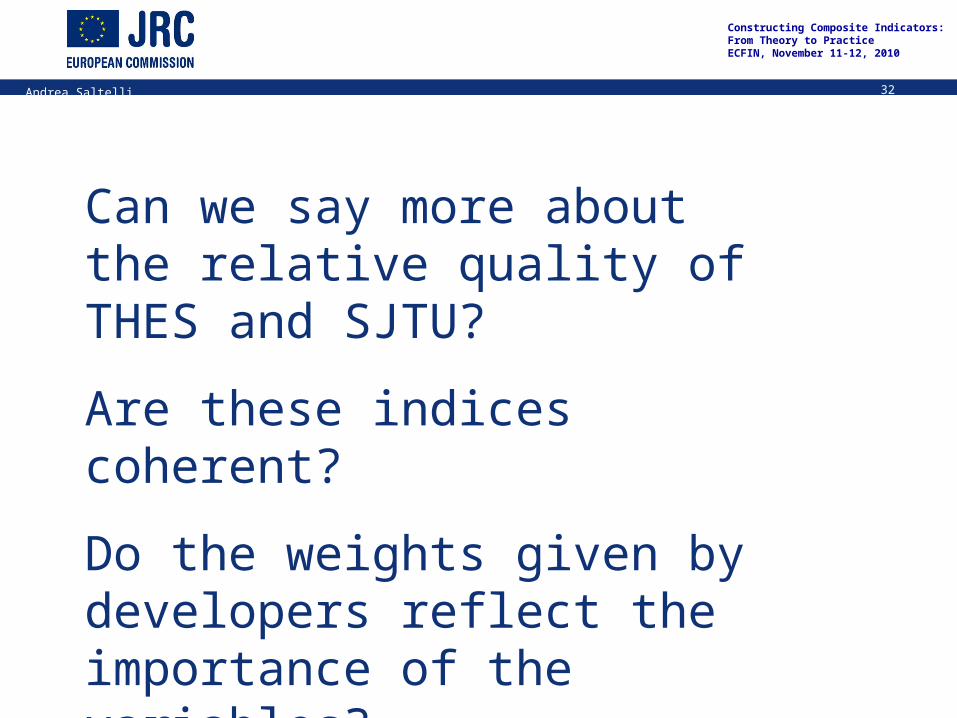
Can we say more about the relative quality of THES and SJTU?
Are these indices coherent?
Do the weights given by developers reflect the importance of the variables?
Let us try a global sensitivity measure

33
Constructing Composite Indicators: From Theory to Practice ECFIN, November 11-12, 2010
Andrea Saltelli
Nobel Alumni
SJTU
34
Constructing Composite Indicators: From Theory to Practice ECFIN, November 11-12, 2010
Andrea Saltelli
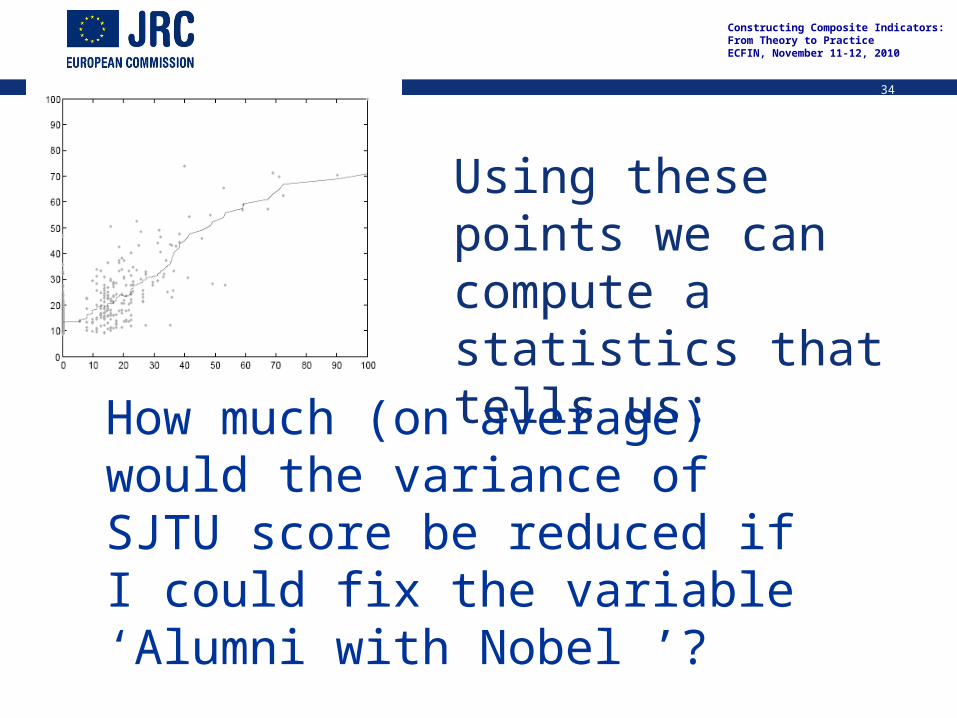
Using these points we can compute a statistics that tells us:
How much (on average) would the variance of SJTU score be reduced if I could fix the variable ‘Alumni with Nobel ’?

35
Constructing Composite Indicators: From Theory to Practice ECFIN, November 11-12, 2010
Andrea Saltelli
This measure Si shall be our ruler for ‘importance’; example:
Si=0.79 I could reduce the variation of the SJTU score by 79% by fixing ‘Nobel Alumni’.

36
Constructing Composite Indicators: From Theory to Practice ECFIN, November 11-12, 2010
Andrea Saltelli
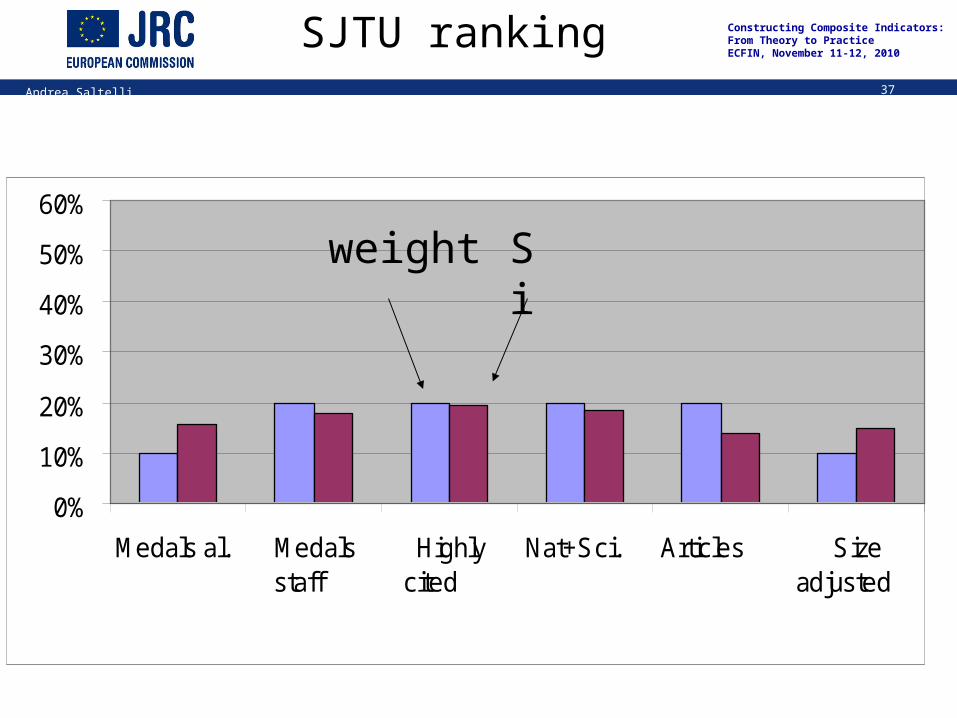
At this point I can compare the importance of a sub-indicator as given by the nominal weight (assigned by developers) with the importance as measured by Si to test the index for coherence.
37
Constructing Composite Indicators: From Theory to Practice ECFIN, November 11-12, 2010
Andrea Saltelli
0%
10%
20%
30%
40%
50%
60%
Medals al. Medalsstaff
Highlycited
Nat+Sci. Articles Sizeadjusted
SJTU ranking
weight Si

38
Constructing Composite Indicators: From Theory to Practice ECFIN, November 11-12, 2010
Andrea Saltelli
0%
5%
10%
15%
20%
25%
30%
35%
40%
45%
Peer review Recruiterreview
Faculty perstudent
Citation perfaculty
Internationalfaculty
Internationalstudent
THES ranking
weight Si

39
Constructing Composite Indicators: From Theory to Practice ECFIN, November 11-12, 2010
Andrea Saltelli
How about pillars
In developing composite indicators pillars often represents normative dimensions which are given by design equal weights.
40
Constructing Composite Indicators: From Theory to Practice ECFIN, November 11-12, 2010
Andrea Saltelli
How about pillars
We can now test when this is the case on the real data.

41
Constructing Composite Indicators: From Theory to Practice ECFIN, November 11-12, 2010
Andrea Saltelli
Index of African governance
0%
5%
10%
15%
20%
25%
30%
Security Rule of Law Participation Economics Development
weight Si

42
Constructing Composite Indicators: From Theory to Practice ECFIN, November 11-12, 2010
Andrea Saltelli
Sustainable society index (NL)
0.00%10.00%
20.00%30.00%40.00%50.00%
60.00%70.00%
PersonalDevelopment
HealthyEnvironment
Well-balancedSociety
SustainableUse of
Resources
SustainableWorld
(1/7)*100 (2/7)*100
43
Constructing Composite Indicators: From Theory to Practice ECFIN, November 11-12, 2010
Andrea Saltelli
Conclusions
-Two methods to test the quality of composite indicators
-Uncertainty modeling and propagations (invasive)
- Check of coherence (non invasive)