1 contribution s of residential coal combustion to the air ... · 6 s. h. pr v t 3, and guohui li...
TRANSCRIPT
Contributions of residential coal combustion to the air quality 1 in Beijing-Tianjin-Hebei (BTH), China: A case study 2
3 4 Xia Li1,3, Jiarui Wu1, Miriam Elser2, Junji Cao1, Tian Feng1, Imad El-Haddad2, Rujin Huang1, Xuexi Tie2, André 5 S. H. Prévôt3, and Guohui Li2* 6 7 1Key Lab of Aerosol Chemistry and Physics, SKLLQG, Institute of Earth Environment, Chinese Academy of 8 Sciences, Xi’an, China 9
2Laboratory of Atmospheric Chemistry, Paul Scherrer Institute, 5232 Villigen, Switzerland 10 3University of Chinese Academy of Science, Beijing, China 11 12 *Correspondence to: Guohui Li ([email protected]) 13 14 15 Abstract: In the present study, the WRF-CHEM model is used to evaluate contributions of the 16
residential coal combustion (RCC) emission to the air quality in Beijing-Tianjin-Hebei (BTH) 17
during persistent air pollution episodes from 9 to 25 January 2014. In general, the predicted 18
temporal variations and spatial distributions of the air pollutants mass concentrations are in 19
good agreement with observations at monitoring sites in BTH. The WRF-CHEM model also 20
reasonably well reproduces the temporal variations of aerosol species compared with the AMS 21
measurements in Beijing. The RCC emission plays an important role in the haze formation in 22
BTH, contributing about 23.1% of PM2.5 (fine particulate matter) and 42.6% of SO2 during the 23
simulation period on average. Organic aerosols dominate PM2.5 from the RCC emission, with 24
a contribution of 42.8%, followed by sulfate (17.1%). The air quality in Beijing is remarkably 25
improved when the RCC emission in BTH and its surrounding areas is excluded in simulations, 26
with a 30% decrease of PM2.5 concentrations. However, when only the RCC emission in 27
Beijing is excluded, the Beijing’s PM2.5 level is decreased by 18.0% on average. Our results 28
suggest that implementation of the residential coal replacement by clean energy sources in 29
Beijing is beneficial to the Beijing’s air quality, but is not expected to bring back the blue sky 30
to Beijing. Should the residential coal replacement be carried out in BTH and its surrounding 31
areas, the air quality in Beijing would be improved remarkably. Further studies need be 32
conducted considering the uncertainties in the emission inventory and meteorological fields. 33
34
35
36
37
38
Page 1
Atmos. Chem. Phys. Discuss., https://doi.org/10.5194/acp-2017-1237Manuscript under review for journal Atmos. Chem. Phys.Discussion started: 26 January 2018c© Author(s) 2018. CC BY 4.0 License.

1 Introduction 39
Over the several past decades, China has experienced rapid economic growth, 40
accompanied by accelerating industrialization and urbanization, which have seriously 41
deteriorated air quality (e.g., R. Zhang et al., 2009; X. Zhang et al., 2012; L. Zhang et al., 2015). 42
Recently, the haze pollution has become the primary concern about the air quality in most key 43
regions and cities in China, especially in Beijing-Tianjin-Hebei (BTH) and Yangtze River Delta 44
(YRD) (e.g., Wang et al., 2005; An et al., 2007; Wang et al., 2014; Chen et al., 2016; Gao et 45
al., 2016). The severe and persistent haze pollution with high concentrations of fine particulate 46
matter (PM2.5) and the consequent low visibility, is mainly caused by heavy anthropogenic 47
emissions and unfavorable synoptic situations (e.g., Seinfeld and Pandis, 2006; Lei et al., 2011; 48
Lv et al., 2016; Wang et al., 2016; Zíková et al., 2016). According to the China’s Ministry of 49
Environment Protection (MEP), the annual mean PM2.5 concentration was 102 µg m-3 in 2013 50
and 93 µg m-3 in 2014 in BTH, far beyond the World Health Organization (WHO) interim 51
target-1 of 35 µg m-3 for the annual mean PM2.5 concentration and also the secondary class 52
standard in the China’s new National Ambient Air Quality Standard (NAAQS, GB3095-2012). 53
Therefore, the Chinese State Council has issued the “Atmospheric Pollution Prevention and 54
Control Action Plan (APPCAP)” in September 2013 to reduce PM2.5 by up to 25% by 2017 55
relative to 2012 levels. Since implementation of the APPCAP, stringent control strategies have 56
been carried out to reduce the pollutants emissions from power plants, industries and the 57
transportation (Sheehan et al., 2014; Liu et al., 2015; Yang et al., 2016). Control strategies have 58
also been implemented to reduce residential emissions to the air quality, but the mitigation 59
effect is still lack of evaluation constrained by observations. 60
The air pollution in China is a typical coal-smoke pollution, which is considered to be 61
associated closely with China’s special energy consumption structure (e.g., Quan et al., 2014; 62
Archernicholls et al., 2016; Liu et al., 2016; Xue et al., 2016). Coal plays a key role in China’s 63
Page 2
Atmos. Chem. Phys. Discuss., https://doi.org/10.5194/acp-2017-1237Manuscript under review for journal Atmos. Chem. Phys.Discussion started: 26 January 2018c© Author(s) 2018. CC BY 4.0 License.

energy structure, and as the most abundant and a relatively cheap energy resource, coal is 64
regarded as a dominant energy supply in China in the foreseeable future. According to the BP 65
statistical review of world energy, from 1980s to the present day, the proportion of coal in 66
China’ primary energy production and consumption has been around 70%, which is much 67
higher than that of around 20% in OECD (Organization for Economic Co-operation and 68
Development) countries. Entering the 21 centuries, the coal consumption in China has 69
increased sharply, and by 2013, China’s coal consumption has accounted for 50.3% of the 70
global coal consumption, which was 4.2 and 6.7 times higher than the United States and the 71
European Union, respectively. In 2013, coal is responsible for 79%, 54%, 40%, 35%, 40%, and 72
17% of the SO2, NOx, PM10, PM2.5, BC, and OC emissions in China, respectively (Ma et al., 73
2016). 74
Residential coal combustion (RCC) is recognized as a significant source of air pollution, 75
affecting both local and regional air quality and posing serious threat to human health and 76
environment by releasing hazardous air pollutants (HAPs), including PM, black carbon (BC), 77
organic carbon (OC), SO2, NOx, CO, CO2, and polycyclic aromatic hydrocarbons (PAHs) (e.g., 78
Wornat et al., 2001; Ge et al., 2004; Zhi et al., 2008; Shen et al., 2010; Cheng et al., 2016; Li 79
et al., 2016). Chemical transport models have been used to investigate the contribution of the 80
RCC emission to the ambient air pollution in China. Using the CMAQ model, Y. Xue et al. 81
(2016) have shown that the contributions of the RCC emission to the mass concentrations of 82
PM10, SO2, NOx, and CO are 11.6%, 27.5%, 2.8%, and 7.3%, respectively, during the winter 83
heating season of 2012 in Beijing. Simulations using the GEOS-CHEM model by Q. Ma et al. 84
(2016) have demonstrated that the coal combustion contributes 40% of the total PM2.5 85
concentration on national average in 2013. Among major coal-burning sectors, industrial coal 86
burning contributes 17% of the PM2.5 concentrations, followed by power plants (9.8%) and 87
domestic sector (4.0%). J. Liu et al. (2016) have used the WRF-CHEM model to simulate the 88
Page 3
Atmos. Chem. Phys. Discuss., https://doi.org/10.5194/acp-2017-1237Manuscript under review for journal Atmos. Chem. Phys.Discussion started: 26 January 2018c© Author(s) 2018. CC BY 4.0 License.

air pollution in BTH in January and February 2010, indicating that annual elimination of 89
residential sources in BTH reduces emissions of primary PM2.5 by 32%, compared with 5%, 90
6%, and 58% of transportation, power plants, and industrial sectors, respectively. 91
In the present study, we use the Weather Research and Forecasting model coupled with 92
chemistry (WRF-CHEM) to evaluate the contribution of the RCC emission to the air quality in 93
BTH during persistent air pollution episodes from 9 to 25 January 2014. The WRF-CHEM 94
model configurations and methodology are described in Section 2. Model results and 95
discussions are represented in Section 3, and conclusions are given in Section 4. 96
97
2 Model and Methodology 98
2.1 WRF-CHEM model and configurations 99
The WRF-CHEM model used in the study is developed by Li et al. (2010, 2011a, b, 2012) 100
at the Molina Center of Energy and the Environment, based on the previous studies (Grell et 101
al., 2005; Fast et al., 2006). The wet deposition follows the method used in the CMAQ module 102
and the dry deposition of chemical species is parameterized following Wesely (1989). The 103
photolysis rates are calculated using the FTUV (fast radiation transfer model), including the 104
aerosol and cloud effects on photolysis (Tie et al., 2003; Li et al., 2005, 2011a). The inorganic 105
aerosols are calculated using ISORROPIA Version 1.7 (Nenes, 1998). The secondary organic 106
aerosol (SOA) is predicted using the volatility basis-set (VBS) modeling method, with 107
contributions from glyoxal and methylglyoxal. Detailed information can be found in Li et al. 108
(2010, 2011b). 109
Persistent air pollution episodes from 9 to 25 in January 2014 in BTH are simulated using 110
the WRF-CHEM model. During the study period, the averaged PM2.5 concentration in BTH is 111
161.9 µg m-3, with a maximum of 323.5 µg m-3. The average temperature and relative humidity 112
in Beijing during the period is −1.7℃ and 32.3%, respectively, and the average wind speed is 113
Page 4
Atmos. Chem. Phys. Discuss., https://doi.org/10.5194/acp-2017-1237Manuscript under review for journal Atmos. Chem. Phys.Discussion started: 26 January 2018c© Author(s) 2018. CC BY 4.0 License.

about 2.8 m s-1. The model simulation domain is shown in Figure 1, and detailed model 114
configurations can be found in Table 1. 115
2.2 Statistical methods for comparisons 116
In the present study, we use the mean bias (MB), root mean square error (RMSE) and 117
index of agreement (IOA) to validate the WRF-CHEM model performance in simulating air 118
pollutants and aerosol species against observations and measurements. IOA describes the 119
relative difference between the model prediction and observation, ranging from 0 to 1, with 1 120
indicating perfect agreement of the prediction with the observation. 121
𝑀𝐵 = $%
𝑃' − 𝑂'%'*$ 122
𝑅𝑀𝑆𝐸 = $%
𝑃' − 𝑂' .%'*$
/0 123
𝐼𝑂𝐴 = 1 − 45675 0859/4567 : 7567 08
59/ 124
Where 𝑃' and 𝑂' are the predicted and observed pollutant concentrations, respectively. 𝑁 is 125
the total number of the predictions used for comparisons, and 𝑃 and 𝑂 represent the average 126
of predictions and observations, respectively. 127
2.3 Pollutants measurements 128
The hourly near-surface CO, SO2, NO2, O3, and PM2.5 mass concentrations released by the 129
China’s Ministry of Environmental Protection can be downloaded from the website 130
http://www.aqistudy.cn/. The sulfate, nitrate, ammonium, and organic aerosols (OA) have been 131
measured by the Aerodyne High Resolution Time-of-Flight Aerosol Mass Spectrometer (HR-132
ToF-AMS) with a novel PM2.5 lens from 9 to 26 January 2014 at the Institute of Remote 133
Sensing and Digital Earth (IRSDE), Chinese Academy of Sciences (40.00°N, 116.38°E) in 134
Beijing (Figure 1) (Williams et al., 2013). The Positive Matrix Factorization (PMF) technique 135
is used with constraints implemented in SoFi (Canonaco et al., 2013) to analyze the sources of 136
OA and five components are separated by their mass spectra and time series. The components 137
Page 5
Atmos. Chem. Phys. Discuss., https://doi.org/10.5194/acp-2017-1237Manuscript under review for journal Atmos. Chem. Phys.Discussion started: 26 January 2018c© Author(s) 2018. CC BY 4.0 License.

include hydrocarbon-like OA (HOA), cooking OA (COA), biomass burning OA (BBOA), coal 138
combustion OA (CCOA), and oxygenated OA (OOA). HOA, COA, BBOA, and CCOA are 139
interpreted for surrogates of primary OA (POA), and OOA is a surrogate for SOA. Detailed 140
information about the HR-ToF-AMS measurements and data analysis can be found in Elser et 141
al. (2016). 142
143
3 Results and discussions 144
3.1 Model performance 145
For the discussion convenience, we have defined the reference simulation in which the 146
emissions from various sources are considered (hereafter referred to as REF), and results from 147
the reference simulation are compared to observations in BTH. 148
3.1.1 Air pollutants simulations in BTH 149
Figure 2 presents the distributions of predicted and observed near-surface mass 150
concentrations of PM2.5, O3, NO2, and SO2 along with the simulated wind fields averaged from 151
9 to 25 January 2014 in BTH. Generally, the predicted PM2.5 spatial pattern is well consistent 152
with the observations at the ambient monitoring sites in BTH. The WRF-CHEM model 153
reasonably well reproduces the high PM2.5 concentrations exceeding 150 µg m-3 in the plain 154
region of BTH. Apparently, during the simulation period, the weak or calm winds in the plain 155
region of BTH facilitate the accumulation of PM2.5, causing severe air pollution. The average 156
simulated PM2.5 concentrations exceed 250 µg m-3 in the south of Hebei, which is generally in 157
good agreement with observations. The observed and simulated O3 concentrations are rather 158
low in the plain region of BTH with the high PM2.5 level, varying from 10 to 30 µg m-3. There 159
are several reasons for the low O3 concentrations in the plain region of BTH. Firstly, during 160
wintertime, the insolation is weak in the north of China, unfavorable for the O3 photochemical 161
production. Additionally, high PM2.5 concentrations and frequent occurrence of clouds during 162
Page 6
Atmos. Chem. Phys. Discuss., https://doi.org/10.5194/acp-2017-1237Manuscript under review for journal Atmos. Chem. Phys.Discussion started: 26 January 2018c© Author(s) 2018. CC BY 4.0 License.

haze days further attenuate the incoming solar radiation in the planetary boundary layer (PBL), 163
decreasing the O3 level. Secondly, calm or weak winds indicate stagnant situations, lacking the 164
O3 transport from outside of BTH. Thirdly, high nitrogen oxides (NOx=NO+NO2) emissions 165
cause titration of O3, which is shown by the high NO2 concentrations in the plain region of 166
BTH. The elevated NO2 and SO2 concentrations are observed and simulated in the plain region 167
of BTH, particularly in cities and their surrounding areas, ranging from 50 to 100 µg m-3 and 168
50 to 150 µg m-3, respectively. It is worth noting that the simulated NO2 is generally distributed 169
evenly in the plain region of BTH, indicating the dominant contribution of area sources. 170
Figure 3 presents the diurnal profiles of observed and simulated near-surface PM2.5, O3, 171
NO2, SO2, and CO mass concentrations averaged over all monitoring sites in BTH from 9 to 172
25 January 2014. The WRF-CHEM model well reproduces the diurnal variations of the PM2.5 173
mass concentrations compared with the observations in BTH during the simulation period. The 174
MB and RMSE is -2.7 and 40.9 µg m-3, respectively, and the IOA is 0.94. During the three haze 175
episodes occurred in BTH, the model generally replicate well the haze developing stage, but 176
tends to underestimate the PM2.5 concentration compared to observations during the haze 177
dissipation stage. One of the most possible reasons is the uncertainty of the simulated 178
meteorological fields, which determine the formation, transformation, diffusion, transport, and 179
removal of the air pollutants in the atmosphere (Bei et al., 2012, 2013). Should the predicted 180
winds be intensified earlier than observations in BTH during the haze dissipation stage, the 181
simulated PM2.5 concentrations would fall off earlier, causing the model underestimation. The 182
predicted NO2 diurnal variations are generally well consistent with the observations, with a MB 183
of 4.2 µg m-3 and an IOA of 0.93. The model also reasonable well yields the SO2 and CO 184
temporal variations with the IOA exceeding 0.85. However, the RMSE for SO2 is rather large, 185
showing considerable dispersions of the SO2 simulations. A great deal of SO2 are emitted from 186
power plants or agglomerated industrial zones, which can be regarded as point sources, so the 187
Page 7
Atmos. Chem. Phys. Discuss., https://doi.org/10.5194/acp-2017-1237Manuscript under review for journal Atmos. Chem. Phys.Discussion started: 26 January 2018c© Author(s) 2018. CC BY 4.0 License.

transport of SO2 is more sensitive to uncertainties of the simulated wind fields. 188
3.1.2 Aerosol species simulations in Beijing 189
Figure 4 presents the temporal profiles of measured and simulated OA, CCOA, sulfate, 190
nitrate, and ammonium concentrations at IRSDE site in Beijing from 9 to 25 January 2014. 191
The model generally performs reasonably well in simulating the diurnal variations of the 192
aerosol species compared to the HR-ToF-AMS measurements, with IOAs exceeding 0.80. As 193
a primary species, OA is primarily determined by direct emissions from various sources, 194
including vehicles, cooking, biomass burning, coal combustion, and transport from outside of 195
Beijing, so uncertainties in emissions and the simulated meteorological fields markedly 196
influence the OA simulations (Bei et al., 2017). Although the IOA for OA is 0.84, the model 197
slightly overestimates the OA concentrations with a MB of 5.1 µg m-3, and the dispersion of 198
OA simulations is also large, with a RMSE of 42.3 µg m-3. In addition, the model fails to 199
reproduce the measured OA peaks during the nighttime on 11 and 17 January 2014, which is 200
perhaps caused by the emission uncertainty. The model also generally tracks the measured 201
diurnal variations of CCOA concentrations, with an IOA of 0.81. The model frequently 202
underestimates or overestimates the CCOA concentrations and is also subject to missing the 203
observed CCOA peaks. The CCOA is mainly emitted from industries and the residential coal 204
combustion. In general, the CCOA emissions from industries have clear diurnal variations, and 205
vice versa for those from residential coal combustion, causing large model biases for the CCOA 206
simulation. The simulated diurnal variations of sulfate, nitrate, and ammonium are also in good 207
agreement with the observations, with IOAs of 0.83, 0.87, and 0.90, respectively. The model 208
considerably overestimates the inorganic aerosol concentrations from 16 to 18 January. One of 209
the possible reasons is the decreased emissions, particularly from industries before the Chinese 210
New Year, which are not reflected in the emission inventory used in the study. 211
Figure 5 presents the contributions of aerosol species to the simulated PM2.5 concentration 212
Page 8
Atmos. Chem. Phys. Discuss., https://doi.org/10.5194/acp-2017-1237Manuscript under review for journal Atmos. Chem. Phys.Discussion started: 26 January 2018c© Author(s) 2018. CC BY 4.0 License.

in BTH and Beijing averaged from 9 to 25 January 2014. The simulated PM2.5 mass 213
concentration averaged during the simulation period is 111.6 and 97.7 µg m-3 in BTH and 214
Beijing, respectively. OA is the dominant constituent of the simulated PM2.5, consisting of 215
around 43% of the PM2.5 mass in BTH. Although the simulated O3 concentration is low, the 216
secondary aerosols, including SOA, sulfate, nitrate, and ammonium still make up about 50% 217
of the PM2.5 mass, in which the contribution of sulfate, nitrate, and ammonium is 11.3%, 12.4%, 218
9.6%, and 7.5%, respectively. Elemental carbon and the unspecified aerosol species account 219
for 7.5% and 16.2% of the PM2.5 mass, respectively. In Beijing, OA, sulfate, nitrate, and 220
ammonium constitutes 44.1%, 10.6%, 14.0%, and 9.1% of the PM2.5 mass, respectively, during 221
the simulation period, which is close to the source apportionment results obtained by Huang et 222
al. (2014) during the wintertime of 2013. It is worth noting that the simulated sulfate 223
contribution to the PM2.5 mass in Beijing is lower than the source apportionment result in 224
Huang et al. (2014), and vice versa for the nitrate aerosol. Implementation of the APPCAP 225
since 2013 September has considerably decreased SO2 emissions in BTH, lowering the sulfate 226
formation. Additionally, the decrease of the sulfate aerosol reduces its competition for 227
ammonia in the atmosphere, facilitating the nitrate formation. 228
The good agreements of the simulated mass concentrations of air pollutants with 229
observations at ambient monitoring sites in BTH and aerosol species with HR-ToF-AMS 230
measurements in Beijing show that the simulated wind fields and emission inventory used in 231
present study are generally reasonable, providing a reliable base for the further evaluation. 232
3.2 Contributions of the RCC emission to the air quality in BTH 233
The contribution of the residential coal combustion (RCC) emission to the air quality in 234
BTH is investigated by the sensitivity study without RCC emissions in BTH and its 235
surrounding areas compared to the reference simulation (hereafter we define the sensitivity 236
simulation as SEN-BTH). Figure 6 shows the spatial distribution of the average contribution 237
Page 9
Atmos. Chem. Phys. Discuss., https://doi.org/10.5194/acp-2017-1237Manuscript under review for journal Atmos. Chem. Phys.Discussion started: 26 January 2018c© Author(s) 2018. CC BY 4.0 License.
of the RCC emission in BTH and its surrounding areas to the PM2.5 concentrations during the 238
simulation period (defined as (REF − SEN-BTH)). The RCC emission plays an important role 239
in the PM2.5 level in the plain area of BTH, with a contribution varying from 30 to 70 µg m-3. 240
Over the mountain areas of BTH, the contribution of the RCC emission to the PM2.5 241
concentration is generally less than 10 µg m-3. 242
Table 2 presents the average change of air pollutants mass concentrations during the 243
simulation period in BTH and Beijing. The average PM2.5 concentration is 111.6 µg m-3 in BTH 244
in the REF case and decreased to be 85.8 µg m-3 in the SEN-BTH case when the RCC emission 245
is excluded. The RCC emission contributes about 23.1% of PM2.5 mass in BTH on average. In 246
addition, the RCC emission is an important SO2 and CO source, contributing about 35.8% of 247
SO2 and 22.5% of CO. The RCC emission does not substantially influence the NO2 level in 248
BTH, with a contribution of 4.2%. When the RCC emission is not considered in the SEN-BTH 249
case, the O3 concentration is slightly increased due to decrease of the NO2 concentration. The 250
PM2.5 concentration is decreased by around 30% in Beijing on average when the RCC emission 251
in BTH is excluded, showing that the air quality in Beijing would be remarkably improved if 252
the residential coal in BTH and its surrounding areas could be replaced by other clean energy 253
sources, such as natural gas or electricity. Furthermore, the RCC emission in BTH and its 254
surrounding areas contributes about 42.6% of SO2 and 26.5% of CO in Beijing. 255
Figure 7 shows the average chemical composition of PM2.5 contributed by the RCC 256
emission in BTH and Beijing during the simulation period. The RCC emission contributes 257
about 25.8 µg m-3 PM2.5 in BTH on average, of which about 42.8% is from OA. The sulfate 258
aerosol constitutes 17.1% of PM2.5 contributed by the RCC emission, exceeding the 259
contribution from unidentified aerosol species (15.8%), black carbon (11.5%), ammonium 260
(9.5%) and nitrate (3.3%) aerosol. The results indicate that the priority to mitigate effects of 261
the RCC emission on the air quality in BTH is to decrease the emissions of OA and SO2 from 262
Page 10
Atmos. Chem. Phys. Discuss., https://doi.org/10.5194/acp-2017-1237Manuscript under review for journal Atmos. Chem. Phys.Discussion started: 26 January 2018c© Author(s) 2018. CC BY 4.0 License.

RCC. In Beijing, OA is still the major contributor to PM2.5 from the RCC emission, accounting 263
for about 48.5% which is more than that averaged in BTH. The sulfate and ammonium 264
contribution to PM2.5 from the RCC emission is 13.3% and 7.2%, respectively, less than those 265
averaged in BTH. The chemical composition of PM2.5 from the RCC emission in Beijing shows 266
more contribution of OA and less contribution of SO2 from Beijing local RCC emission. 267
3.4 Contributions of RCC emissions to the air quality in Beijing 268
As the capital of China, the air quality in Beijing often becomes the focus of attention in 269
China or globally. Beijing is situated at the northern tip of the North China Plain (NCP), one 270
of the most polluted areas in China, caused by rapid industrialization and urbanization (Zhang 271
et al., 2013). In addition, Beijing is surrounded from the southwest to the northeast by the 272
Taihang Mountains and the Yanshan Mountains which block the dispersion of air pollutants 273
when the south or east winds are prevalent in NCP (Long et al., 2016). Therefore, except the 274
contribution of local emissions, the air quality in Beijing is also substantially influenced by the 275
transport of air pollutants from outside (Wu et al., 2017). 276
Since implementation of the APPCAP issued in September 2013, Beijing has carried out 277
aggressive emission control strategies to improve the air quality. Great efforts have been made 278
to replace the coal used in residential living by natural gas or electricity, which is highly 279
anticipated to clean the air in Beijing. However, frequent occurrence of heavy haze with 280
extremely high levels of PM2.5 during the wintertime of 2015 and 2016 has caused controversial 281
issue about the effect of the coal replacement plan in Beijing. Therefore, a further sensitivity 282
study has been performed, in which only the RCC emission in Beijing is excluded (hereafter 283
we define the sensitivity simulation as SEN-PEK) to explore the contribution of the local RCC 284
emission in Beijing to the haze formation. Comparisons of the REF case with the SEN-PEK 285
case show that when the RCC emission is not considered or the residential coal is replaced by 286
other clean energy sources in Beijing, the Beijing’s PM2.5 level decreases from 97.7 to 80.1 µg 287
Page 11
Atmos. Chem. Phys. Discuss., https://doi.org/10.5194/acp-2017-1237Manuscript under review for journal Atmos. Chem. Phys.Discussion started: 26 January 2018c© Author(s) 2018. CC BY 4.0 License.
m-3 or by 18.0% on average during the simulation period. The average decrease of SO2 and CO 288
concentrations is 24.2% and 19.9%, respectively. Therefore, the coal replacement plan in 289
Beijing can improve the air quality in Beijing considerably, but is not as expected to bring back 290
the blue sky to Beijing. 291
It is still disputatious on whether local emissions or transport from outside dominates the 292
air quality in Beijing (Guo et al., 2010, 2014; Li et al., 2015; Zhang et al., 2015; Wu et al., 293
2017). Sensitivity studies show that when only the RCC emission in Beijing is excluded in 294
simulations, the PM2.5 level is decreased by 18%, much less than about 30% decrease caused 295
by the exclusion of the RCC emission in BTH and its surrounding areas, showing the important 296
contribution of trans-boundary transport to the air quality in Beijing. Analyses are further made 297
to examine the contribution of the RCC emission in Beijing to the PM2.5 concentrations under 298
different pollution levels. The simulated hourly near-surface PM2.5 concentrations in REF case 299
during the whole episode in Beijing are first subdivided into 6 bins according to the air quality 300
standard in China for PM2.5 (Feng et al., 2016), i.e., 0~35 (excellent), 35~75 (good), 75~115 301
(lightly polluted), 115~150 (moderately polluted), 150~250 (heavily polluted), and greater than 302
250 (severely polluted) µg m-3. PM2.5 concentrations in REF case and SEN-PEK case as the 303
bin PM2.5 concentrations in REF case following the grid cells are assembled respectively, and 304
an average of PM2.5 concentrations in each bin is calculated. Figures 8 presents the contribution 305
of the RCC emission in Beijing to the local PM2.5 concentrations. Apparently, the mitigation 306
effect is the best under the good and lightly polluted conditions, and the PM2.5 concentration 307
decreases by around 25% when the RCC emission in Beijing is not considered, indicating that 308
the good and light PM2.5 pollution is mainly caused by local emissions. However, with 309
deterioration of the haze pollution from moderately to severely polluted conditions, the PM2.5 310
contribution of the local RCC emission decreases from 20% to 15%, showing the regional 311
transport of PM2.5. 312
Page 12
Atmos. Chem. Phys. Discuss., https://doi.org/10.5194/acp-2017-1237Manuscript under review for journal Atmos. Chem. Phys.Discussion started: 26 January 2018c© Author(s) 2018. CC BY 4.0 License.

313
4 Summary and Conclusions 314
In the present study, persistent air pollution episodes in BTH from 9 to 25 January 2014 315
are simulated using the WRF-CHEM model to evaluate the contributions of the RCC emission 316
to the air quality in BTH. In general, the WRF-CHEM model performs well in simulating the 317
temporal variations and spatial distributions of air pollutants compared to observations over 318
monitoring sites in BTH. The simulated diurnal variations of aerosol species are also in good 319
agreement with the HR-ToF-AMS measurements in Beijing. 320
Sensitivity studies show that, on average, the RCC emission contributes about 23.1% of 321
PM2.5 mass concentrations in BTH during the simulation period and is also an important SO2 322
and CO source, accounting for about 35.8% of SO2 and 22.5% of CO. OA is the major 323
contributor to PM2.5 from the RCC emission, with a contribution of 42.8%, followed by sulfate 324
(17.1%), unidentified aerosol species (15.8%), black carbon (11.5%), ammonium (9.5%) and 325
nitrate (3.3%) aerosol. Exclusion of the RCC emission in BTH and its surrounding areas 326
decreases the PM2.5 concentration by around 30% in Beijing, indicating that the air quality in 327
Beijing will be remarkably improved if the residential coal in BTH and its surrounding areas 328
can be replaced by other clean energy sources. 329
When only the RCC emission in Beijing is excluded in simulations, the Beijing’s PM2.5 330
level decreases by 18.0% on average during the simulation period. Hence, the coal replacement 331
plan in Beijing is beneficial to the Beijing’s air quality, but is not as anticipated to bring back 332
the blue sky to Beijing. The mitigation effect of the coal replacement plan on PM2.5 in Beijing 333
is the best under the good and lightly polluted conditions, decreasing the PM2.5 concentration 334
by around 25%. However, under the heavy or severe haze pollution, the local RCC emission 335
contributes about 15% of PM2.5 in Beijing, showing contributions of the regional transport of 336
PM2.5. 337
Page 13
Atmos. Chem. Phys. Discuss., https://doi.org/10.5194/acp-2017-1237Manuscript under review for journal Atmos. Chem. Phys.Discussion started: 26 January 2018c© Author(s) 2018. CC BY 4.0 License.

This study mainly aims to quantitively evaluate the contributions of the RCC emission to 338
the air quality in BTH. Our results suggest that if the residential coal replacement is only 339
implemented in Beijing, the Beijing’s air quality will not be improved substantially, 340
considering the impact of trans-boundary transport. Implementation of the residential coal 341
replacement in BTH and its surrounding areas can remarkably improve the Beijing’s air quality. 342
Although the WRF-CHEM model reasonably well captures the temporal and spatial variations 343
of air pollutants in BTH and diurnal variations of aerosol species in Beijing, the model biases 344
still exit. Future studies need to be conducted to improve the WRF-CHEM model simulations, 345
considering the rapid changes in anthropogenic emissions since the implementation of the 346
APPCAP. Further sensitivity simulations of various emission mitigation measures also need to 347
be performed to provide efficient emission control strategies to improve the air quality in BTH. 348
349
5 Data availability 350
The real-time O3 and PM2.5 concentrations are accessible to the public on the website 351
http://106.37.208.233:20035/ (China MEP, 2013a). One can also access the historic profiles of 352
the observed ambient air pollutants by visiting http://www.aqistudy.cn/ (China MEP, 2013b). 353
354
Acknowledgements. This work is financially supported by the National Key R&D Plan 355
(Quantitative Relationship and Regulation Principle between Regional Oxidation Capacity of 356
Atmospheric and Air Quality (2017YFC0210000)). Guohui Li is supported by “Hundred 357
Talents Program” of the Chinese Academy of Sciences and the National Natural Science 358
Foundation of China (No. 41661144020). 359
360 361 362 363
Page 14
Atmos. Chem. Phys. Discuss., https://doi.org/10.5194/acp-2017-1237Manuscript under review for journal Atmos. Chem. Phys.Discussion started: 26 January 2018c© Author(s) 2018. CC BY 4.0 License.

References 364
An, X., Zhu, T., Wang, Z., Li, C., and Wang, Y., 2007. A modeling analysis of a heavy air 365 pollution episode occurred in Beijing. Atmospheric Chemistry and Physics, 7(12), 3103-366 3114, doi: 10.5194/acp-7-3103-2007. 367
Archernicholls, S., Carter, E. M., Kumar, R., Xiao, Q., Yang, L., Frostad, J., Forouzanfar, M. 368 H., Cohen, A., Brauer, M., Baumgartner, J., and Wiedinmyer, C., 2016. The regional 369 impacts of cooking and heating emissions on ambient air quality and disease burden in 370 China. Environmental Science and Technology, 50(17), 9416-8423, doi: 371 10.1021/acs.est.6b02533. 372
Bei, N. F., Li, G. H., Zavala, M., Barrera, H., Torres, R., Grutter, M., Gutierrez, W., Garcia, 373 M., Ruiz-Suarez, L. G., Ortinez, A., Guitierrez, Y., Alvarado, C., Flores, I., and Molina, 374 L. T., 2013. Meteorological overview and plume transport patterns during Cal-Mex 2010. 375 Atmospheric Environment, 70, 477-489, doi: 10.1016/j.atmosenv.2012.01.065. 376
Bei, N., Li, G., and Molina, L. T., 2012. Uncertainties in SOA simulations due to 377 meteorological uncertainties in Mexico City during MILAGRO-2006 field campaign. 378 Atmospheric Chemistry and Physics, 12, 11295-11308, doi: 10.5194/acp-12-11295-2012. 379
Bei, N., Wu, J., Elser, M., Feng, T., Cao, J., El-Haddad, I., Li, X., Huang, R., Li, Z., Long, X., 380 Xing, L., Zhao, S., Tie, X., Prévôt, A. S. H., and Li, G., 2017. Impacts of meteorological 381 uncertainties on the haze formation in Beijing-Tianjin-Hebei (BTH) during wintertime: a 382 case study. Atmospheric Chemistry and Physics, 17, 14579-14591, doi: 10.5194/acp-17-383 14579-2017. 384
BP: Statistical Review of World Energy 2016. 385
Canonaco, F., Crippa, M., Slowik, J. G., Baltensperger, U., and Prévôt, A. S. H., 2013. Sofi, 386 an IGOR-based interface for the efficient use of the generalized multilinear engine (ME-387 2) for the source apportionment: ME-2 application to aerosol mass spectrometer data. 388 Atmospheric Measurement Techniques, 6(12), 3649-3661, doi: 10.5194/amt-6-3649-389 2013. 390
Corrigan, A. L., Russell, L. M., Takahama, S., Äijälä, M., Ehn, M., Junninen, H., Rinne, J., 391 Petäjä, T., Kulmala, M., Vogel, A. L., Hoffmann, T., Ebben, C. J., Geiger, F. M., Chhabra, 392 P., Seinfeld, J. H., Worsnop, D. R., Song, W., Auld, J., and Williams, J., 2013. Biogenic 393 and biomass burning organic aerosol in a boreal forest at Hyytiälä, Finland, during 394 HUMPPA-COPEC 2010. Atmospheric Chemistry and Physics, 13, 12233-12256, doi: 395 10.5194/acp-13-12233-2013. 396
Chen, F. and Dudhia, J., 2001. Coupling an advanced land surface-hydrology model with the 397 Penn State-NCAR MM5 modeling system. Part I: Model implementation and sensitivity. 398 Monthly Weather Review, 129(4), 569-585, doi: 10.1175/1520- 399 0493(2001)129<0569:caalsh>2.0.co;2. 400
Chen, Y., Schleicher, N., Cen, K., Liu, X., Yu, Y., Zibat, V., Dietze, V., Fricker, M., Kaminski, 401 U., Chen, Y., Chai, F., Norra, S., 2016. Evaluation of impact factors on PM2.5 based on 402 long-term chemical components analyses in the megacity Beijing, China. Chemosphere, 403 155, 234-42, doi: 10.1016/j.chemosphere.2016.04.052. 404
Page 15
Atmos. Chem. Phys. Discuss., https://doi.org/10.5194/acp-2017-1237Manuscript under review for journal Atmos. Chem. Phys.Discussion started: 26 January 2018c© Author(s) 2018. CC BY 4.0 License.
Cheng, M., Zhi, G., Tang, W., Liu, S., Dang, H., Guo, Z., Du, J. H., Du, X. H., Zhang, W. Q., 405 Zhang, Y. J., and Meng, F., 2016. Air pollutant emission from the underestimated 406 households' coal consumption source in China. Science of the Total Environment, 580, 407 641-650, doi: 10.1016/j.scitotenv.2016.12.143. 408
Chinese State Council. Atmospheric Pollution Prevention and Control Action Plan, 2013 (in 409 Chinese). 410
Chou, M. D. and Suarez, M. J., 1999. A solar radiation parameterization for atmospheric 411 studies, NASA/TM-10460. Nasa Technical memo, 15. 412
Chou, M. D. and Suarez, M. J., 2001. A thermal infrared radiation parameterization for 413 atmospheric studies, NASA/TM-104606. Max J, 19. 414
Elser, M., Huang, R. J., Wolf, R., Slowik, J. G., Wang, Q., Canonaco, F., Li, G., Bozzetti, C., 415 Daellenbach, K. R., Huang, Y., Zhang, R., Li, Z., Cao, J., Baltensperger, U., El-Haddad, 416 I., and Prévôt, A. S. H., 2016. New insights into PM2.5 chemical composition and sources 417 in two major cities in China during extreme haze events using aerosol mass spectrometry. 418 Atmospheric Chemistry and Physics, 16, 3207-3225, doi: 10.5194/acp-16-3207-2016. 419
Fast, J. D., Jr, W. I. G., Easter, R. C., Zaveri, R. A., Barnard, J. C., Chapman, E. G., Grell, G. 420 A., and Peckham, S. E., 2006. Evolution of ozone, particulates, and aerosol direct 421 radiative forcing in the vicinity of Houston using a fully coupled meteorology-chemistry-422 aerosol model. Journal of Geophysical Research-Atmospheres, 111(D21), doi: 423 10.1029/2005JD006721. 424
Feng, T., Li, G., Cao, J., Bei, N., Shen, Z., Zhou, W., Liu, S., Zhang, T., Wang, Y., Huang, R. 425 J., Tie, X., and Molina, L. T., 2016. Simulations of organic aerosol concentrations during 426 springtime in the Guanzhong Basin, China. Atmospheric Chemistry and Physics, 16, 427 10045-10061, doi: 10.5194/acp-16-10045-2016. 428
Gao, M., Carmichael, G. R., Wang, Y., Saide, P. E., Yu, M., Xin, J., Liu, Z., and Wang, Z., 429 2016. Modeling study of the 2010 regional haze event in the North China Plain, 430 Atmospheric Chemistry and Physics, 16(3), 1673-1691, doi: 10.5194/acp-16-1673-2016. 431
Ge, S., Xu, X., Chow, J.C., Watson, J., Sheng, Q., Liu, W., Bai, Z., Zhu, T., and Zhang, J., 432 2004. Emissions of air pollutants from household Stoves: honeycomb coal versus coal 433 cake. Environmental Science and Technology, 38(17), 4612-4618, doi: 434 10.1021/es049942k. 435
Grell, G. A., Peckham, S. E., Schmitz, R., McKeen, S. A., Frost, G., Skamarock, W. C., and 436 Eder, B., 2005. Fully coupled “online” chemistry within the WRF model. Atmospheric 437 Environment, 39, 6957-6975, doi: 10.1016/j.atmosenv.2005.04.027. 438
Guenther, A., Karl, T., Harley, P., Wiedinmyer, C., Palmer, P. I., and Geron, C., 2006. 439 Estimates of global terrestrial isoprene emissions using MEGAN (Model of Emissions of 440 Gases and Aerosols from Nature). Atmospheric Chemistry and Physics, 6, 3181-3210, 441 doi: 10.5194/acp-6-3181-2006. 442
Guo, S., Hu, M., Wang, Z. B., Slanina, J., and Zhao, Y. L., 2010. Size-resolved aerosol water-443 soluble ionic compositions in the summer of Beijing: implication of regional secondary 444 formation. Atmospheric Chemistry and Physics, 10, 947-959, doi:10.5194/acp-10-947-445 2010. 446
Page 16
Atmos. Chem. Phys. Discuss., https://doi.org/10.5194/acp-2017-1237Manuscript under review for journal Atmos. Chem. Phys.Discussion started: 26 January 2018c© Author(s) 2018. CC BY 4.0 License.
Guo, S., Hu, M., Zamora, M. L., Peng, J., Shang, D., Zheng, J., Du, Z. F., Wu, Z., Shao, M., 447 Zeng, L. M., Molina, M. J., and Zhang, R. Y., 2014. Elucidating severe urban haze 448 formation in China. Proceedings of the National Academy of Sciences of the United 449 States of America, 111(49), 17373-17378, doi: 10.1073/pnas.1419604111. 450
Hong, S. Y. and Lim, J. O. J., 2006. The WRF Single-Moment 6-Class Microphysics Scheme 451 (WSM6). Asia-Pacific Journal of Atmospheric Sciences, 42, 129-151. 452
Horowitz, L. W., Walters, S., Mauzerall, D. L., Emmons, L. K., Rasch, P. J., Granier, C., Tie, 453 X. X., Lamarque, J. F., Schultz, M. G., Tyndall, G. S., Orlando, J. J., and Brasseur, G. P., 454 2003. A global simulation of tropospheric ozone and related tracers: Description and 455 evaluation of MOZART, version 2. Journal of Geophysical Research, 108, 4784, doi: 456 10.1029/2002jd002853. 457
Huang, R. J., Zhang, Y., Bozzetti, C., Ho, K. F., Cao, J. J., Han, Y. M. Daellenbach, K. R., 458 Slowik, J. G., Platt, S. M., Canonaco, F., Zotter, P., Wolf, R., Pieber, S. M., Bruns, E. A., 459 Crippa, M., Ciarelli, G., Piazzalunga, A., Schwikowski, M., Abbaszade, G., Schnelle-460 Kreis, J., Zimmermann, R ., An, Z. S., Szidat, S., Baltensperger, U., El Haddad, I., and 461 Prevot, A. S. H., 2014. High secondary aerosol contribution to particulate pollution 462 during haze events in China. Nature, 514(7521), 218-222, doi: 10.1038/nature13774. 463
Janjić, Z. I., 2002. Nonsingular Implementation of the Mellor-Yamada Level 2.5 Scheme in 464 the NCEP Meso Model. Ncep Office Note, 436 pp. 465
Lei, Y., Zhang, Q., He, K. B., and Streets, D. G., 2011. Primary anthropogenic aerosol 466 emission trends for China, 1990-2005. Atmospheric Chemistry and Physics, 11(3), 931-467 954, doi: 10.5194/ acp-11-931-2011. 468
Li, G., Bei, N., Tie, X., and Molina, L. T., 2011a. Aerosol effects on the photochemistry in 469 Mexico City during MCMA-2006/MILAGRO campaign. Atmospheric Chemistry and 470 Physics, 11, 5169-5182, doi: 10.5194/acp-11-5169-2011. 471
Li, G., Lei, W., Zavala, M., Volkamer, R., Dusanter, S., Stevens, P., and Molina, L. T., 2010. 472 Impacts of HONO sources on the photochemistry in Mexico City during the MCMA-473 2006/MILAGO Campaign. Atmospheric Chemistry and Physics, 10, 6551-6567, doi: 474 10.5194/acp-10-6551-2010. 475
Li, G., Zavala, M., Lei, W., Tsimpidi, A. P., Karydis, V. A., Pandis, S. N., Canagaratna, M. R., 476 and Molina, L. T., 2011b. Simulations of organic aerosol concentrations in Mexico City 477 using the WRF- CHEM model during the MCMA-2006/MILAGRO campaign. 478 Atmospheric Chemistry and Physics, 11, 3789-3809, doi: 10.5194/acp-11-3789-2011. 479
Li, G., Zhang, R., Fan, J., and Tie, X., 2005. Impacts of black carbon aerosol on photolysis 480 and ozone. Journal of Geophysical Research Atmospheres, 110, D23206, doi: 481 10.1029/2005JD005898. 482
Li, J., Huang, X., Yang, H., Chuai, X., Li, Y., Qu, J., and Zhang, Z., 2016. Situation and 483 determinants of household carbon emissions in Northwest China. Habitat International, 484 51, 178-187, doi: 10.1016/j.habitatint.2015.10.024. 485
Li, M., Zhang, Q., Kurokawa, J. I., Woo, J. H., He, K., Lu, Z., Ohara, T., Song, Y., Streets, D. 486 G., Carmichael, G. R., Cheng, Y., Hong, C., Huo, H., Jiang, X., Kang, S., Liu, F., Su, H., 487 and Zheng, B., 2017. MIX: a mosaic Asian anthropogenic emission inventory under the 488
Page 17
Atmos. Chem. Phys. Discuss., https://doi.org/10.5194/acp-2017-1237Manuscript under review for journal Atmos. Chem. Phys.Discussion started: 26 January 2018c© Author(s) 2018. CC BY 4.0 License.

international collaboration framework of the MICS-Asia and HTAP. Atmospheric 489 Chemistry and Physics, 17, 935-963, doi: 10.5194/acp-17-935-2017. 490
Li, X., Zhang, Q., Zhang, Y., Zheng, B., Wang, K., and Chen, Y. 2015. Source contributions 491 of urban PM2.5 in the Beijing-Tianjin-Hebei region: Changes between 2006 and 2013 and 492 relative impacts of emissions and meteorology. Atmospheric Environment, 123, 229-239, 493 doi: 10.1016/j.atmosenv.2015.10.048. 494
Liu, F., Zhang, Q., Tong, D., Zheng, B., Li, M., Huo, H., and He, K. B., 2015. High-495 resolution inventory of technologies, activities, and emissions of coal-fired power plants 496 in China from 1990 to 2010. Atmospheric Chemistry and Physics, 15(23), 13299-13317, 497 doi:10.5194/acp-15-13299-2015. 498
Liu, J., Mauzerall, D. L., Chen, Q., Zhang, Q., Song, Y., Peng, W., Klimont, Z., Qiu, X. H., 499 Zhang, S. Q., Hu, M., Lin, W. L., Smith, K. R., Zhu, T., 2016. Air pollutant emissions 500 from Chinese households: a major and underappreciated ambient pollution source. 501 Proceedings of the National Academy of Sciences of the United States of America, 502 113(28), 7756-7761, doi: 10.1073/pnas.1604537113. 503
Long, X., Tie, X., Cao, J., Huang, R., Feng, T., Li, N., Zhao, S., Tian, J., Li, G., and Zhang, 504 Q., 2016. Impact of crop field burning and mountains on heavy haze in the North China 505 Plain: a case study. Atmospheric Chemistry and Physics, 16, 9675-9691, doi: 506 10.5194/acp-16-9675-2016. 507
Lv, B., Zhang, B., and Bai, Y., 2016. A systematic analysis of PM2.5 in Beijing and its sources 508 from 2000 to 2012. Atmospheric Environment, 124, 98-108, doi: 509 10.1016/j.atmosenv.2015.09.031. 510
Ma, Q., Cai, S., Wang, S., Zhao, B., Martin, R. V., Brauer, M., Cohen, A., Jiang, J., Zhou, W., 511 Hao, J., Frostad, J., Forouzanfar, M. H., and Burnett, R. T., 2017. Impacts of coal burning 512 on ambient PM2.5 pollution in China. Atmospheric Chemistry and Physics, 17, 4477-513 4491, doi: 10.5194/acp-17-4477-2017. 514
Ministry of Environmental Protection of China (MEP): 2013 Report on the State of 515 Environment in China, 2014 (in Chinese). 516
Ministry of Environmental Protection of China (MEP): 2014 Report on the State of 517 Environment in China, 2015 (in Chinese). 518
Nenes, A., Pandis, S. N., and Pilinis, C., 1998. ISORROPIA: A new thermodynamic 519 equilibrium model for multiphase multi-component inorganic aerosols. Aquatic 520 Geochemistry, 4, 123-152, doi: 10.1023/a:1009604003981. 521
Quan, J., Tie, X., Zhang, Q., Liu, Q., Li, X., Gao, Y., and Zhao, D. L., 2014. Characteristics 522 of heavy aerosol pollution during the 2012-2013 winter in Beijing, China. Atmospheric 523 Environment, 88(5), 83-89, doi: 10.1016/j.atmosenv.2014.01.058. 524
Seinfeld, J. H. and Pandis, S. N., 2006. Atmospheric Chemistry and Physics: From Air 525 Pollution to Climate Change, 2nd Edition. Wiley. 526
Sheehan, P., Cheng, E., English, A., and Sun, F., 2014. China’s response to the air pollution 527 shock. Nature Climate Change, 4(5):306-309, doi: 10.1038/nclimate2197. 528
Page 18
Atmos. Chem. Phys. Discuss., https://doi.org/10.5194/acp-2017-1237Manuscript under review for journal Atmos. Chem. Phys.Discussion started: 26 January 2018c© Author(s) 2018. CC BY 4.0 License.
Shen, G., Yang, Y., Wang, W., Tao, S., Zhu, C., Min, Y., Xue, M., Ding, J., Wang, B., Wang, 529 R., Shen, H., Li, W., Wang, X., and Russell, A.G., 2010. Emission factors of particulate 530 matter and elemental carbon for crop residues and coals burned in typical household 531 stoves in China. Environmental Science and Technology, 44(18), 7157-7162, doi: 532 10.1021/es101313y. 533
Tie, X., Madronich, S., Walters, S., Zhang, R. Y., Rasch, P., and Collins, W., 2003. Effect of 534 clouds on photolysis and oxidants in the troposphere. Journal of Geophysical Research, 535 108, 4642, doi: 10.1029/2003jd003659. 536
Wang, G. H., Zhang, R. Y., Gomez, M. E., Yang, L. X., Zamora, M. L., Hu, M., Lin, Y., Peng, 537 J. F., Guo, S., Meng, J. J., Li, J. J., Cheng, C. L., Hu, T. F., Ren, Y. Q., Wang, Y. S., Gao, 538 J., Cao, J. J., An, Z. S., Zhou, W. J.,Li, G. H., Wang, J. Y., Tian, P. F., Marrero-Ortiz, W., 539 Secrest, J., Du, Z. F., Zheng, J., Shang, D. J., Zeng, L. M., Shao, M., Wang, W. G., 540 Huang, Y., Wang, Y., Zhu, Y. J., Li, Y. X., Hu, J. X., Pan, B., Cai, L., Cheng, Y. T., Ji, Y. 541 M., Zhang, F., Rosenfeld, D., Liss, P. S., Duce, R. A., Kolb, C. E., and Molina, M. J., 542 2016. Persistent sulfate formation from London fog to Chinese haze. Proceedings of the 543 National Academy of Sciences of the United States of America, 113(48), 13630-13635, 544 doi: 10.1073/pnas.1616540113. 545
Wang, L. T., Wei, Z., Yang, J., Zhang, Y., Zhang, F. F., Su, J., Meng, C. C., and Zhang, Q., 546 2014. The 2013 severe haze over southern Hebei, China: model evaluation, source 547 apportionment, and policy implications, Atmospheric Chemistry and Physics, 14, 3151-548 3173, doi: 10.5194/acp-14-3151-2014. 549
Wang, L. T., Xu, J., Yang, J., Zhao, X. J., Wei, W., Cheng, D. D., Pan, X. M., and Su, J., 550 2012. Understanding haze pollution over the southern Hebei area of China using the 551 CMAQ model. Atmospheric Environment, 56(5), 69-79, doi: 552 10.1016/j.atmosenv.2012.04.013. 553
Wang, X., Carmichael, G., Chen, D., Tang, Y., and Wang, T., 2005. Impacts of different 554 emission sources on air quality during March 2001 in the Pearl River Delta (PRD) 555 region. Atmospheric Environment, 39, 5227-5241, doi: 10.1016/j.atmosenv.2005.04.035. 556
Wesely, M. L., 1989. Parameterization of surface resistances to gaseous dry deposition in 557 regional-scale numerical models. Atmospheric Environment, 23, 1293-1304, doi: 558 10.1016/0004-6981(89)90153-4. 559
WHO, (World Trade Organization), 2005. Air Quality Guidelines for Particulate Matter, 560 Ozone, Nitrogen Dioxide and Sulfur Dioxide. 561
Williams, L. R., Gonzalez, L. A., Peck, J., Trimborn, D., McInnis, J., Farrar, M. R., Moore, K. 562 D., Jayne, J. T., Robinson, W. A., Lewis, D. K., Onasch, T. B., Canagaratna, M. R., 563 Trimborn, A., Timko, M. T., Magoon, G., Deng, R., Tang, D., Blanco, E., Prevot, A. S. H., 564 Smith, K. A., and Worsnop, D. R.: Characterization of an aerodynamic lens for 565 transmitting particles greater than 1 micrometer in diameter into the Aerodyne aerosol mass 566 spectrometer, Atmos. Meas. Tech., 6(11), 3271–3280, 2013. 567
Wornat, M. J., Ledesma, E. B., Sandrowitz, A. K., Roth, M. J., Dawsey, S. M., Qiao, Y. L., 568 and Chen, W., 2001. Polycyclic aromatic hydrocarbons identified in soot extracts from 569 domestic coal-burning stoves of Henan province, China. Environmental Science and 570 Technology, 35(10), 1943-1952, doi: 10.1021/es001664b. 571
Page 19
Atmos. Chem. Phys. Discuss., https://doi.org/10.5194/acp-2017-1237Manuscript under review for journal Atmos. Chem. Phys.Discussion started: 26 January 2018c© Author(s) 2018. CC BY 4.0 License.

Wu, J., Li, G., Cao, J., Bei, N., Wang, Y., Feng, T., Huang, R., Liu, S., Zhang, Q., and Tie, X., 572 2017. Contributions of trans-boundary transport to summertime air quality in Beijing, 573 China. Atmospheric Chemistry and Physics, 17, 2035-2051, doi:10.5194/acp-17-2035-574 2017. 575
Xue, Y. F., Zhou, Z., Nie, T., Wang, K., Nie, L., Pan, T., Wu, X. Q., Tian, H. Z., Zhong, L. H., 576 Li, J., Liu, H. J., Liu, S. H., and Shao, P. Z., 2016. Trends of multiple air pollutants 577 emissions from residential coal combustion in Beijing and its implication on improving 578 air quality for control measures. Atmospheric Environment, 142, 303-312, doi: 579 10.1016/j.atmosenv.2016.08.004. 580
Yang, H., Chen, J., Wen, J., Tian, H., and Liu, X., 2016. Composition and sources of PM2.5, 581 around the heating periods of 2013 and 2014 in Beijing: implications for efficient 582 mitigation measures. Atmospheric Environment, 124, 378-386, doi: 583 10.1016/j.atmosenv.2015.05.015. 584
Zhang, L., Liu, L., Zhao, Y., Gong, S., Zhang, X., Henze, D. K., Capps, S. L., Fu, T. M., 585 Zhang, Q. and Wang, Y., 2015. Source attribution of particulate matter pollution over 586 North China with the adjoint method. Environmental Research Letters, 10(8), 084011, 587 doi: 10.1088/1748-9326/10/8/084011. 588
Zhang, L., Wang, T., Lv, M., and Zhang, Q., 2015. On the severe haze in Beijing during 589 January 2013: unraveling the effects of meteorological anomalies with WRF-Chem. 590 Atmospheric Environment, 104, 11-21, doi: 10.1016/j.atmosenv.2015.01.001. 591
Zhang, Q., He, K., and Huo, H., 2012. Policy: cleaning china's air. Nature, 484(7393), 161-592 162, doi: 10.1038/484161a. 593
Zhang, Q., Streets, D. G., Carmichael, G. R., He, K. B., Huo, H., Kannari, A., Klimont, Z., 594 Park, I. S., Reddy, S., Fu, J. S., Chen, D., Duan, L., Lei, Y., Wang, L. T., and Yao, Z. L., 595 2009. Asian emissions in 2006 for the NASA INTEX-B mission. Atmospheric Chemistry 596 and Physics, 9, 5131-5153, doi: 10.5194/acp-9-5131-2009. 597
Zhang, R., Jing, J., Tao, J., Hsu, S. C., Wang, G., Cao, J., Lee, C. S. L., Zhu, L., Chen, Z., 598 Zhao, Y., and Shen, Z., 2013. Chemical characterization and source apportionment of 599 PM2.5 in Beijing: seasonal perspective. Atmospheric Chemistry and Physics, 13, 7053-600 7074, doi:10.5194/acp-13-7053-2013. 601
Zhang, R., Wang, L., Khalizova, A. F., Zhao, J., Zheng, J., Mc-Grawb, R. L., and Molina, L. 602 T., 2009. Formation of nanoparticles of blue haze enhanced by anthropogenic pollution. 603 Proceedings of the National Academy of Sciences of the United States of America, 106, 604 17650-17654. 605
Zhang, X. Y., Wang, Y. Q., Niu, T., Zhang, X. C., Gong, S. L., Zhang, Y. M., and Sun, J. Y., 606 2012. Atmospheric aerosol compositions in China: spatial/temporal variability, chemical 607 signature, regional haze distribution and comparisons with global aerosols. Atmospheric 608 Chemistry and Physics, 11(14), 26571-26615, doi: 10.5194/acpd-11-26571-2011. 609
Zhi, G., Chen, Y., Feng, Y., Xiong, S., Li, J., Zhang, G., Sheng, G., and Fu, J., 2008. Emission 610 characteristics of carbonaceous particles from various residential coal-stoves in China. 611 Environmental Science and Technology, 42(9), 3310-3315, doi: 10.1021/es702247q. 612
Zíková, N., Wang, Y., Yang, F., Li, X., Tian, M., and Hopke, P. K., 2016. On the source 613
Page 20
Atmos. Chem. Phys. Discuss., https://doi.org/10.5194/acp-2017-1237Manuscript under review for journal Atmos. Chem. Phys.Discussion started: 26 January 2018c© Author(s) 2018. CC BY 4.0 License.

contribution to Beijing PM2.5 concentrations. Atmospheric Environment, 134, 84-95, doi: 614 10.1016/j.atmosenv.2016.03.047. 615
616
617
618
619
620
Page 21
Atmos. Chem. Phys. Discuss., https://doi.org/10.5194/acp-2017-1237Manuscript under review for journal Atmos. Chem. Phys.Discussion started: 26 January 2018c© Author(s) 2018. CC BY 4.0 License.
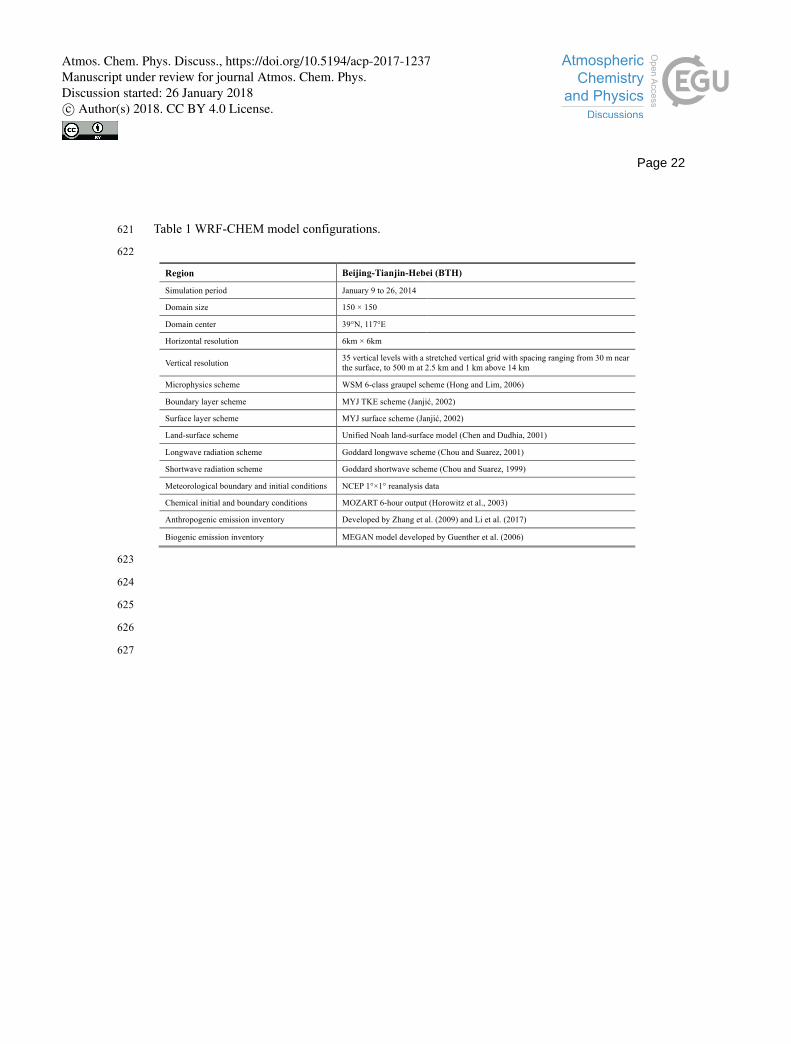
Table 1 WRF-CHEM model configurations. 621
622
Region Beijing-Tianjin-Hebei (BTH)
Simulation period January 9 to 26, 2014
Domain size 150 × 150
Domain center 39°N, 117°E
Horizontal resolution 6km × 6km
Vertical resolution 35 vertical levels with a stretched vertical grid with spacing ranging from 30 m near the surface, to 500 m at 2.5 km and 1 km above 14 km
Microphysics scheme WSM 6-class graupel scheme (Hong and Lim, 2006)
Boundary layer scheme MYJ TKE scheme (Janjić, 2002)
Surface layer scheme MYJ surface scheme (Janjić, 2002)
Land-surface scheme Unified Noah land-surface model (Chen and Dudhia, 2001)
Longwave radiation scheme Goddard longwave scheme (Chou and Suarez, 2001)
Shortwave radiation scheme Goddard shortwave scheme (Chou and Suarez, 1999)
Meteorological boundary and initial conditions NCEP 1°×1° reanalysis data
Chemical initial and boundary conditions MOZART 6-hour output (Horowitz et al., 2003)
Anthropogenic emission inventory Developed by Zhang et al. (2009) and Li et al. (2017)
Biogenic emission inventory MEGAN model developed by Guenther et al. (2006)
623
624
625
626
627
Page 22
Atmos. Chem. Phys. Discuss., https://doi.org/10.5194/acp-2017-1237Manuscript under review for journal Atmos. Chem. Phys.Discussion started: 26 January 2018c© Author(s) 2018. CC BY 4.0 License.

Table 2 Average mass concentrations of air pollutants in REF case and SEN-BTH case from 9 628 to 25 January 2014 in BTH and Beijing. (Unit: µg m-3 for PM2.5, O3, NO2, SO2 and mg m-3 629 for CO) 630 631
632
633 634 635 636 637
Air pollutants
BTH Beijing
REF SEN-BTH Mass change
Percentage change REF SEN-BTH Mass
change Percentage
change PM2.5 111.6 85.8 25.8 23.1% 97.7 68.9 28.8 29.5%
O3 39.1 39.4 -0.3 -0.8% 39.3 39.8 -0.5 -1.3% NO2 45.7 43.7 2.0 4.3% 51.5 49.4 2.1 4.1% SO2 45.0 28.9 16.1 35.8% 42.2 24.2 18.0 42.6% CO 1.7 1.3 0.4 22.5% 1.5 1.1 0.4 26.5%
Page 23
Atmos. Chem. Phys. Discuss., https://doi.org/10.5194/acp-2017-1237Manuscript under review for journal Atmos. Chem. Phys.Discussion started: 26 January 2018c© Author(s) 2018. CC BY 4.0 License.
Figure Captions 638
639
Figure 1 (a) Map showing the location of Beijing-Tianjin-Hebei and (b) WRF-CHEM model 640 simulation domain with topography. In (b), the filled red circles represent centers of 641 cities with ambient monitoring site and the size of the circle denotes the number of 642 ambient monitoring sites of cities. The filled black rectangle denotes the deployment 643 location of the HR-ToF-AMS in Beijing. 644
Figure 2 Pattern comparisons of simulated (color counters) vs. observed (colored circles) 645 near-surface mass concentrations of (a) PM2.5, (b) O3, (c) NO2, and (d) SO2 646 averaged from 9 to 25 January 2014. The black arrows indicate simulated surface 647 winds. 648
Figure 3 Comparisons of observed (black dots) and simulated (solid red lines) diurnal profiles 649 of near-surface hourly mass concentrations of (a) PM2.5, (b) O3, (c) NO2, (d) SO2, 650 and (d) CO averaged at monitoring sites in BTH from 9 to 25 January 2014. 651
Figure 4 Comparisons of measured (black dots) and simulated (solid red lines) diurnal 652 profiles of (a) organic aerosol (OA), (b) coal combustion organic aerosol (CCOA), 653 (c) sulfate, (d) nitrate, and (e) ammonium in Beijing from 9 to 25 January 2014. 654
Figure 5 Chemical composition of PM2.5 averaged from 9 to 25 January 2014 in (a) BTH and 655 (b) Beijing. 656
Figure 6 Spatial distribution of the average contribution of the RCC emission in BTH and its 657 surrounding areas to PM2.5 concentrations from 9 to 25 January 2014. 658
Figure 7 Chemical composition of PM2.5 from the RCC emission averaged from 9 to 25 659 January 2014 in (a) BTH and (b) Beijing. 660
Figure 8 Average contributions of the RCC emission in Beijing to the Beijing’s PM2.5 661 concentration under different haze pollution levels from 9 to 25 January 2014. 662
663 664 665 666 667
Page 24
Atmos. Chem. Phys. Discuss., https://doi.org/10.5194/acp-2017-1237Manuscript under review for journal Atmos. Chem. Phys.Discussion started: 26 January 2018c© Author(s) 2018. CC BY 4.0 License.

668 669 Figure 1 (a) Map showing the location of Beijing-Tianjin-Hebei and (b) WRF-CHEM model 670 simulation domain with topography. In (b), the filled red circles represent centers of cities 671 with ambient monitoring site and the size of the circle denotes the number of ambient 672 monitoring sites of cities. The filled black rectangle denotes the deployment location of the 673 HR-ToF-AMS in Beijing. 674 675 676 677 678 679
Page 25
Atmos. Chem. Phys. Discuss., https://doi.org/10.5194/acp-2017-1237Manuscript under review for journal Atmos. Chem. Phys.Discussion started: 26 January 2018c© Author(s) 2018. CC BY 4.0 License.

680 681 Figure 2 Pattern comparisons of simulated (color counters) vs. observed (colored circles) 682 near-surface mass concentrations of (a) PM2.5, (b) O3, (c) NO2, and (d) SO2 averaged from 9 683 to 25 January 2014. The black arrows indicate simulated surface winds. 684 685 686 687 688 689
Page 26
Atmos. Chem. Phys. Discuss., https://doi.org/10.5194/acp-2017-1237Manuscript under review for journal Atmos. Chem. Phys.Discussion started: 26 January 2018c© Author(s) 2018. CC BY 4.0 License.

690 691 Figure 3 Comparisons of observed (black dots) and simulated (solid red lines) diurnal profiles 692 of near-surface hourly mass concentrations of (a) PM2.5, (b) O3, (c) NO2, (d) SO2, and (d) CO 693 averaged at monitoring sites in BTH from 9 to 25 January 2014. 694 695 696 697 698
699
Page 27
Atmos. Chem. Phys. Discuss., https://doi.org/10.5194/acp-2017-1237Manuscript under review for journal Atmos. Chem. Phys.Discussion started: 26 January 2018c© Author(s) 2018. CC BY 4.0 License.

700 Figure 4 Comparisons of measured (black dots) and simulated (solid red lines) diurnal 701 profiles of (a) organic aerosol (OA), (b) coal combustion organic aerosol (CCOA), (c) sulfate, 702 (d) nitrate, and (e) ammonium in Beijing from 9 to 25 January 2014. 703 704 705 706 707 708
Page 28
Atmos. Chem. Phys. Discuss., https://doi.org/10.5194/acp-2017-1237Manuscript under review for journal Atmos. Chem. Phys.Discussion started: 26 January 2018c© Author(s) 2018. CC BY 4.0 License.

709 710 Figure 5 Chemical composition of PM2.5 averaged from 9 to 25 January 2014 in (a) BTH and 711 (b) Beijing. 712 713 714 715 716 717
Page 29
Atmos. Chem. Phys. Discuss., https://doi.org/10.5194/acp-2017-1237Manuscript under review for journal Atmos. Chem. Phys.Discussion started: 26 January 2018c© Author(s) 2018. CC BY 4.0 License.

718 719 Figure 6 Spatial distribution of the average contribution of the RCC emission in BTH and its 720 surrounding areas to PM2.5 concentrations from 9 to 25 January 2014. 721 722 723 724 725 726
Page 30
Atmos. Chem. Phys. Discuss., https://doi.org/10.5194/acp-2017-1237Manuscript under review for journal Atmos. Chem. Phys.Discussion started: 26 January 2018c© Author(s) 2018. CC BY 4.0 License.
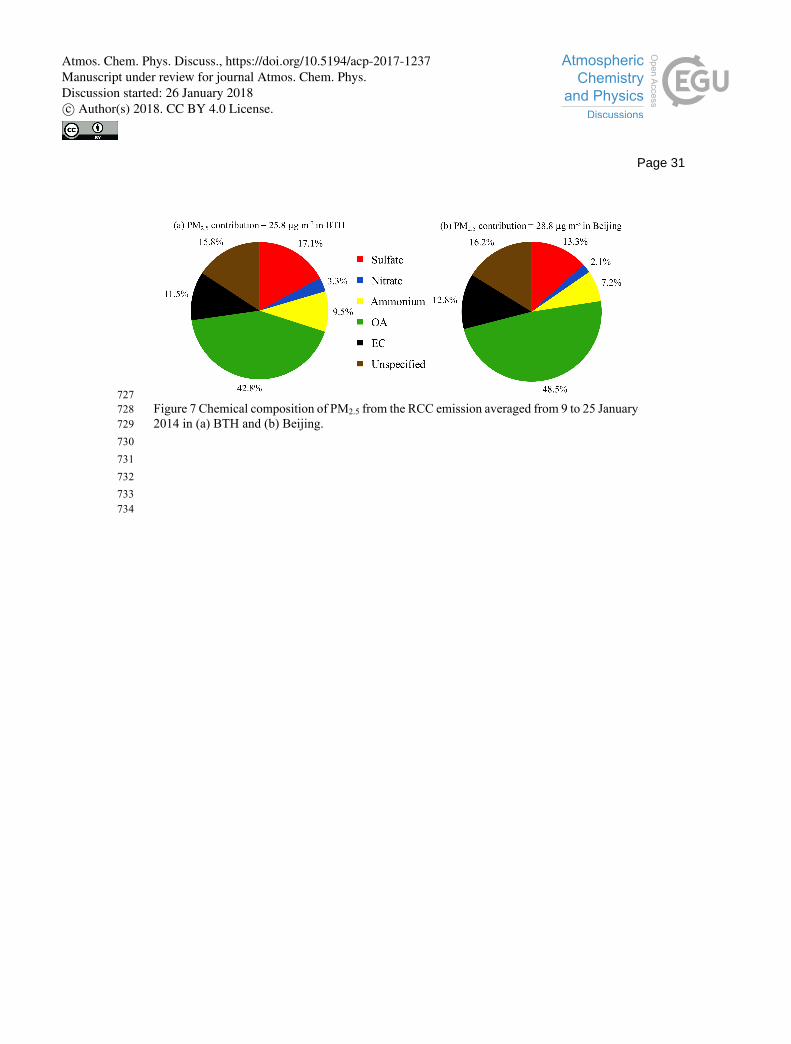
727 Figure 7 Chemical composition of PM2.5 from the RCC emission averaged from 9 to 25 January 728 2014 in (a) BTH and (b) Beijing. 729 730 731 732 733 734
Page 31
Atmos. Chem. Phys. Discuss., https://doi.org/10.5194/acp-2017-1237Manuscript under review for journal Atmos. Chem. Phys.Discussion started: 26 January 2018c© Author(s) 2018. CC BY 4.0 License.

735 736 Figure 8 Average contributions of the RCC emission in Beijing to the Beijing’s PM2.5 737 concentration under different haze pollution levels from 9 to 25 January 2014. 738 739 740 741 742
Page 32
Atmos. Chem. Phys. Discuss., https://doi.org/10.5194/acp-2017-1237Manuscript under review for journal Atmos. Chem. Phys.Discussion started: 26 January 2018c© Author(s) 2018. CC BY 4.0 License.