1 department of community colleges and workforce development mission and goals agency organization...
TRANSCRIPT

1
DEPARTMENT OF COMMUNITY COLLEGES AND WORKFORCE DEVELOPMENT
• Mission and Goals
• Agency Organization and Structure
• Programs
• Performance
• IT Systems
• Audit Report
• Budget Notes
• Affirmative Action
• Statutory Mission and Goals (ORS Chapter 341)
April 15, 2003
Ways & Means Education Subcommittee

2
Mission
Contribute leadership and resources to increase the skills, knowledge and career
opportunities of Oregonians.
The Department of Community Colleges and Workforce Development is structured to integrate services across funding streams to the greatest extent possible.

3
The Agency• The State Board of Education and the
Department of Community Colleges and Workforce Development:– distribute state aid to community colleges– approve new programs and courses– adopt rules for the general governance of community
colleges
• on behalf of the Governor implement and oversee state implementation of Title IB of the Workforce Investment Act
• Statutory Authority (ORS Chapters 326 and 660)

4
Programs Administered
• Community College Support Fund• GED testing• Oregon Youth Conservation Corps• Federal grants:
– Adult Basic Education (WIA)– One-Stop program services (WIA)– Even Start Family Literacy (proposed for transfer in
Governor's budget)– Carl Perkins Technical and Applied Technology
(postsecondary)
5
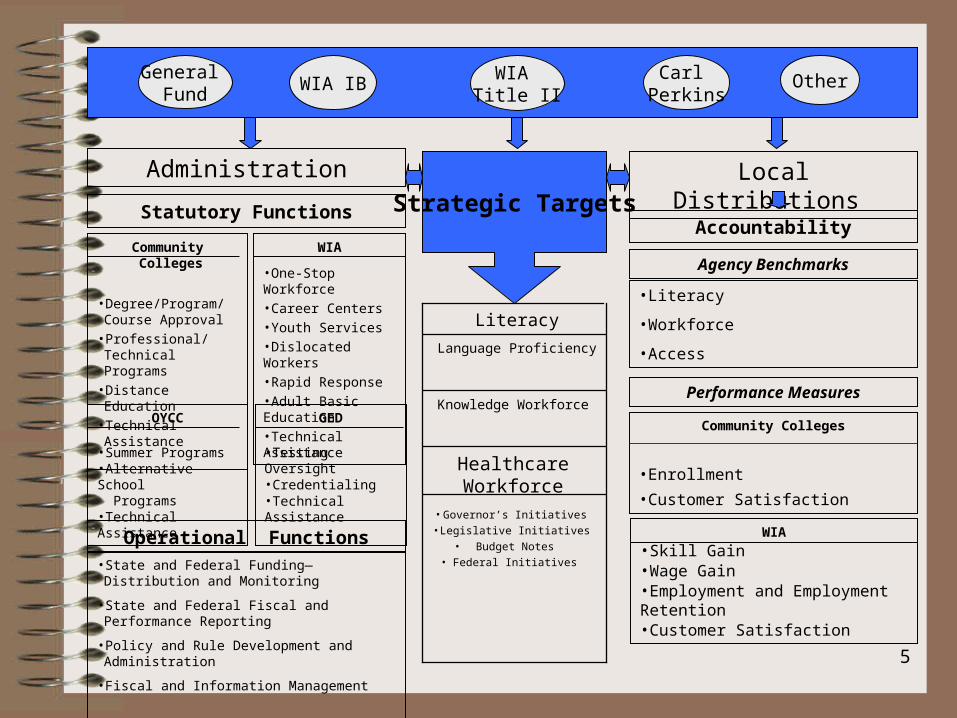
• Governor’s Initiatives
• Legislative Initiatives
• Budget Notes
• Federal Initiatives
Healthcare Workforce
Knowledge Workforce
Language Proficiency
Literacy
Local Distributions
• State and Federal Funding—Distribution and Monitoring
• State and Federal Fiscal and Performance Reporting
• Policy and Rule Development and Administration
• Fiscal and Information Management
GED
•Testing Oversight•Credentialing•Technical Assistance
Administration
Statutory Functions
Operational Functions
Community Colleges
• Degree/Program/Course Approval
• Professional/Technical Programs
• Distance Education• Technical Assistance
WIA
•One-Stop Workforce •Career Centers•Youth Services•Dislocated Workers•Rapid Response•Adult Basic Education•Technical Assistance
OYCC
•Summer Programs•Alternative School Programs•Technical Assistance
Community Colleges
•Enrollment
•Customer Satisfaction
Agency Benchmarks
Performance Measures
•Literacy
•Workforce
•Access
WIA
•Skill Gain•Wage Gain•Employment and Employment Retention•Customer Satisfaction
General Fund
WIA IBWIA
Title IICarl
PerkinsOther
Strategic TargetsAccountability

6
Organizational ChartOREGON STATE BOARD OF EDUCATION
New Principal Executive/Manager H Exec Support Spec 2OWIB Exec. Staff Commissioner Asst. to CommissionerZ7008 973 33x Z7014 015 40x C0119 953 19
Principal Exec/Mgr F Principal Exec/Mgr FAsst. Commissioner - Ops Assistant Commissioner - Prog.
Z7010 214 35x Z7010 994 35x
Principal Exec/Mgr A Principal Exec/Mgr D Principal Exec/Mgr D Principal Exec/Mgr E Principal Exec/Mgr E Oregon YouthAgency Support Manager Finance & Admin. Manager Information Team Manager Strategic Teams Manager Strategic Teams Manager Conservation Corps
Z7000 996 24x X7006 972 31x X7006 951 31I X7008 971 33x X7008 970 33xProgram Technician 2
Administrative Specialist 2 Fiscal Analyst 2 Information Systems Spec 7 Principal Exec/Mgr E Education Program Spec 2 OYCC Executive DirectorAdministrative Specialist Fiscal Analyst Systems Analyst Basic Skills & Literacy Director Instructional Programs Spec. X0813 940 27
C0108 969 19 C1245 991 30 C1487 960 31I Z7008 164 33x C2301 212 33Program Representative 1
Administrative Specialist 1 Fiscal Analyst 1 Information Systems Spec 5 Education Program Spec 2 Education Program Spec 1 OYCC Program CoordinatorAdministrative Specialist Fiscal Analyst Database Analyst Education & Workforce Spec. Education & Workforce Spec. C0816 942 22
C0107 115 17 C1243 961 23 C1485 995 28I C2301 209 33 C2300 998 30Office Specialist 2
Office Specialist 2 Accounting Technician 3 Information Systems Spec 6 Program Technician 2 Program Technician 2 OYCC SupportSecretary Accounting Technician Programmer Education & Workforce Coord Education & Workforce Coord C0104 941 15
C0104 204 15 C0212 962 19 C1486 208 29I C0813 999 27 C0813 966 27
Office Specialist 2 Accounting Technician 2 Information Systems Spec 3 Program Technician 2 Program Technician 2Secretary Accounting Technician Web Coordinator Education & Workforce Coord Education & Workforce Coord
C0104 237 15 C0211 069 17 C1483 968 24I C0813 967 27 C0813 956 27
Office Specialist 2 Planner 3 Program Technician 2 Program Technician 2Secretary Financial Analyst Education & Workforce Coord Education & Workforce Coord
C0104 899 15 C1109 990 29 C0813 967 27 C0813 958 27
Office Specialist 2 Information Systems Spec 6 Principal Contributor 2 Program Technician 2Secretary Programmer WIA Youth Staff Education & Workforce Coord
C0104 248 15 C1486 208 29I Z0852 974 31 C0813 954 27
Office Specialist 2 Principal Contributor 2 Program Technician 2Secretary WIA Liaison Education & Workforce Coord
C0104 997 15 Z0852 975 31 C0813 965 27
Office Specialist 1 Education Program Spec 1 Administrative Specialist 2Receptionist Prof. Tech. Prog. Spec. GED Specialist
C0103 963 12 C2300 976 30 C0108 211 19
Education Program Spec 2GED Essay Readers
C2301 930 33
7
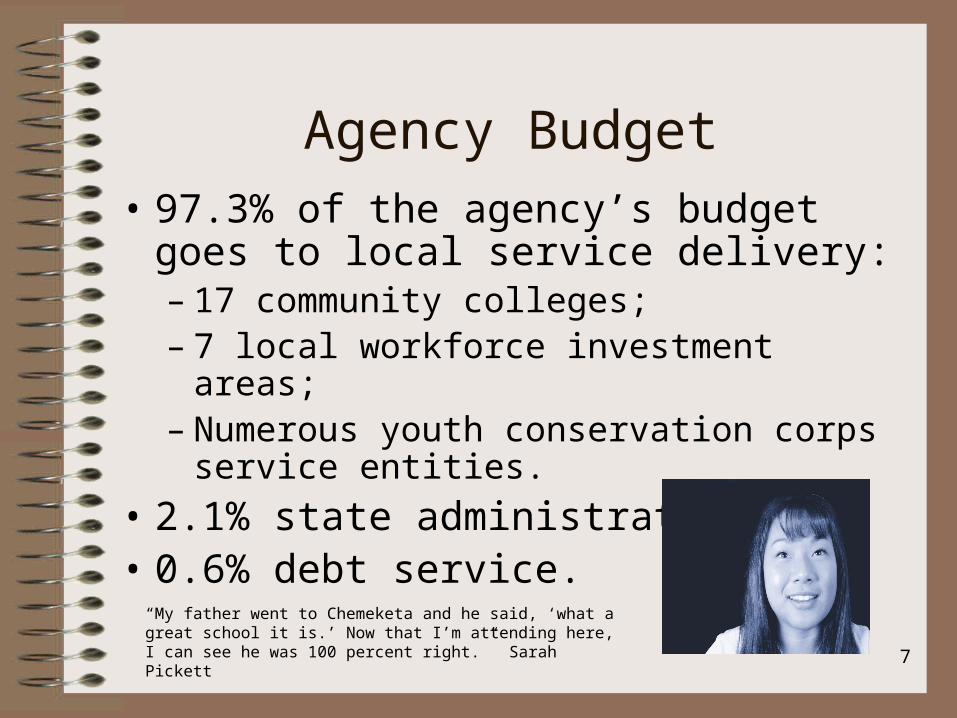
Agency Budget
• 97.3% of the agency’s budget goes to local service delivery:– 17 community colleges;– 7 local workforce investment areas;– Numerous youth conservation corps service
entities.
• 2.1% state administration;• 0.6% debt service.
“My father went to Chemeketa and he said, ‘what a great school it is.’ Now that I’m attending here, I can see he was 100 percent right.” Sarah Pickett

8
Agency Budget
$11,673,319$3,316,055
$540,736,165
Special Payments:97.29%
Debt Service:0.60%
Office Operations:2.12%
Special Payment Recipients:
Community CollegesLocal Workforce AreasAdult Literacy Programs
Correctional FacilitiesOther Service Providers
Administration:47 Positions, 46.7 FTE
Administering:
Community College Support FundWIATitles I and II
GED
Debt Service Payments:
Interest and Principal Paymentson Infrastructure Bonds
Issued in the 1960s and '70s

9
Agency Budget
$129,197,769
$12,835,967
$413,691,803
Federal Funds23.25%
Other Funds2.31%
General Fund74.44%
Other Fund Sources:- Carl D. Perkins
Vocational & App. Tech- General Education Development (GED)- Basic Adult Skills
Inventory System (BASIS)- Amusement Device Taxes
- Bond Revenues- Other Sources
Federal Fund Sources:
- Workforce Investment Act (WIA) Title IB and
Title II
10
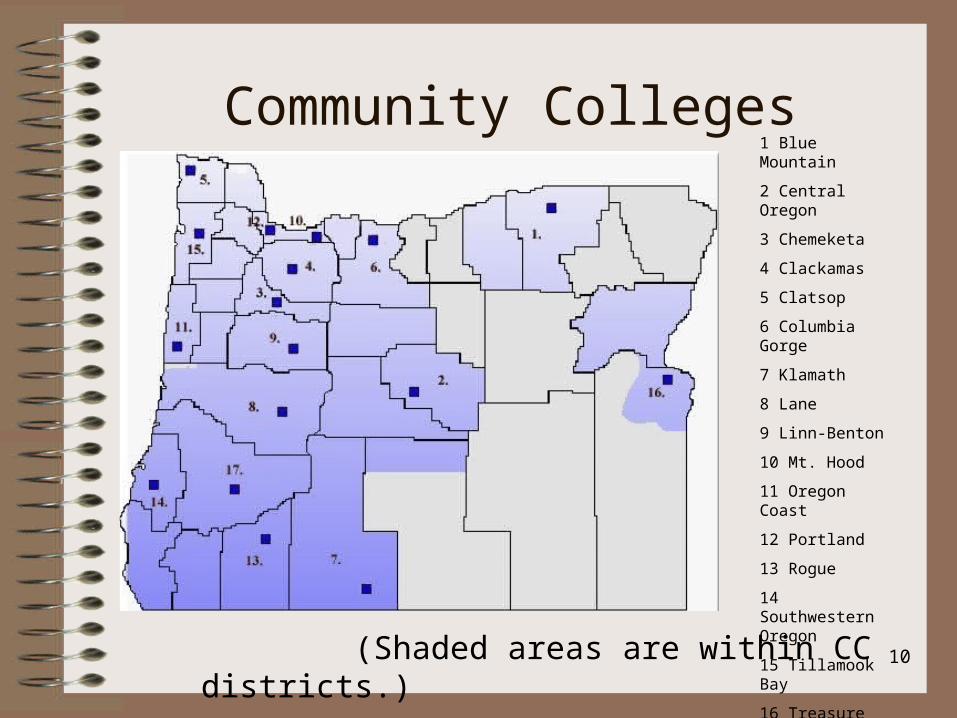
Community Colleges
(Shaded areas are within CC districts.)
1 Blue Mountain
2 Central Oregon
3 Chemeketa
4 Clackamas
5 Clatsop
6 Columbia Gorge
7 Klamath
8 Lane
9 Linn-Benton
10 Mt. Hood
11 Oregon Coast
12 Portland
13 Rogue
14 Southwestern Oregon
15 Tillamook Bay
16 Treasure Valley
17 Umpqua

11
State Funding by College
$0
$20,000,000
$40,000,000
$60,000,000
$80,000,000
$100,000,000
$120,000,000
Sta
te F
un
ds*
2001-03 State Funding 2003-05 Projected State Funding*Formula distributions only
12
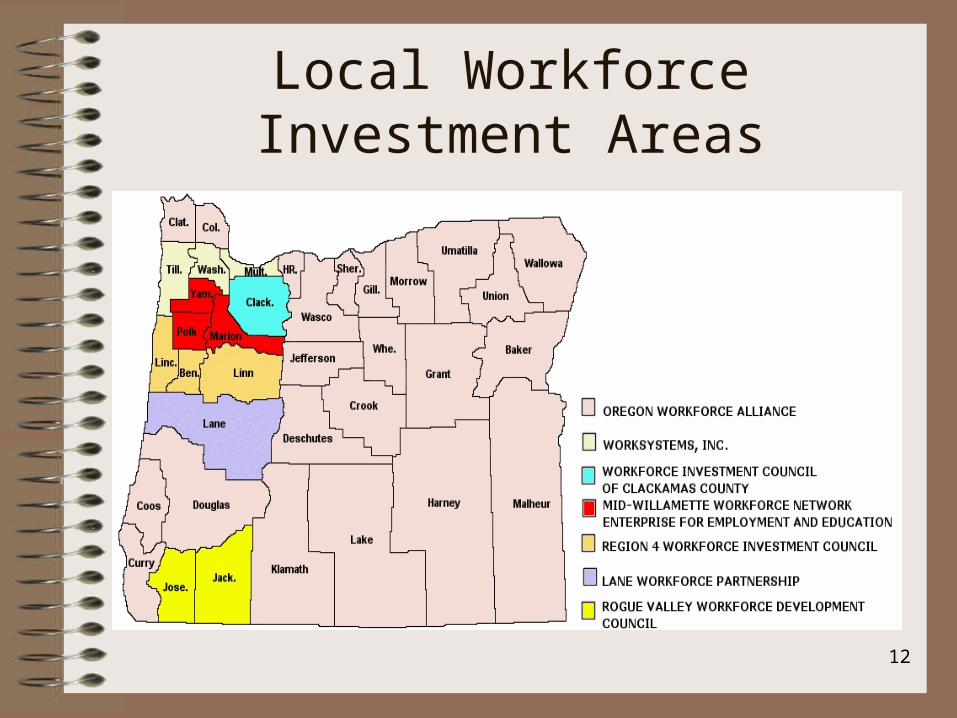
Local Workforce Investment Areas

13
Local Workforce Area Funding
“My kids are very excited I’m going to be a firefighter. I’m excited, too, to get a job in a fire department and develop a family with them and do something I love.” Rayne Pownall
Key to Chart (see page 12 for map of areas):1: Workforce Investment Council of Clackamas County2: Mid-Willamette Workforce Network3: Lane Workforce Partnership 4: Region 4 Workforce Investment Council 5: Rogue Valley Workforce Development Council 6: Oregon Workforce Alliance7: worksystems, inc.
$0
$5,000,000
$10,000,000
$15,000,000
$20,000,000
$25,000,000
$30,000,000
$35,000,000
1 2 3 4 5 6 7
Fed
eral F
un
din
g
Adult Youth Dislocated Worker
14
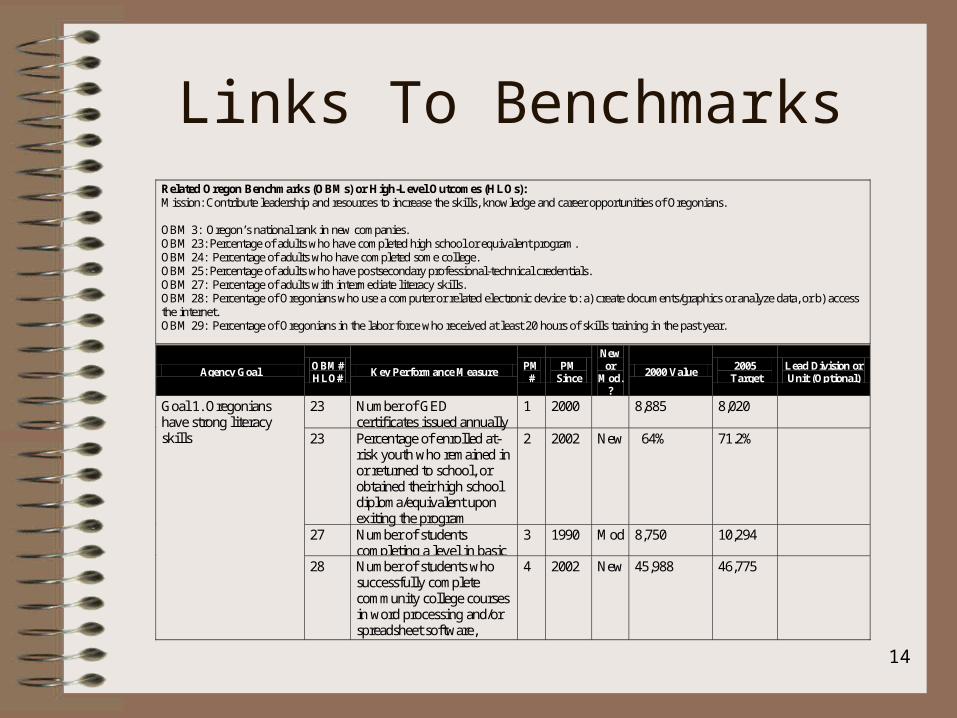
Links To Benchmarks
Related Oregon Benchmarks (OBMs) or High-Level Outcomes (HLOs): Mission: Contribute leadership and resources to increase the skills, knowledge and career opportunities of Oregonians. OBM 3: Oregon’s national rank in new companies. OBM 23: Percentage of adults who have completed high school or equivalent program. OBM 24: Percentage of adults who have completed some college. OBM 25: Percentage of adults who have postsecondary professional-technical credentials. OBM 27: Percentage of adults with intermediate literacy skills. OBM 28: Percentage of Oregonians who use a computer or related electronic device to: a) create documents/graphics or analyze data, or b) access the internet. OBM 29: Percentage of Oregonians in the labor force who received at least 20 hours of skills training in the past year.
Agency Goal OBM# HLO#
Key Performance Measure PM
# PM
Since
New or
Mod.?
2000 Value 2005
Target Lead Division or Unit (Optional)
23 Number of GED certificates issued annually
1 2000 8,885 8,020
23 Percentage of enrolled at-risk youth who remained in or returned to school, or obtained their high school diploma/equivalent upon exiting the program
2 2002 New 64% 71.2%
27 Number of students completing a level in basic skills or ESL
3 1990 Mod 8,750 10,294
Goal 1. Oregonians have strong literacy skills
28 Number of students who successfully complete community college courses in word processing and/or spreadsheet software, and/or in the use of internet
4 2002 New 45,988 46,775

15
Links To Benchmarks Agency Goal
OBM# HLO#
Key Performance Measure PM
# PM
Since
New or
Mod.?
2000 Value
2005 Target
Lead Division or Unit (Optional)
3 Oregon SBDC clients who have business startups as a percent of the national average for SBDC-assisted business startups
5 2002
New Not available
15% for OR*
29 Percent of participants ranking WIA funded current workforce trainings good or better
6 2002 New 89% 90%
29 Percent of companies ranking training they received through community college Business and Industry Training System (BITS) as good or better
7 2000 93% 93%
25 Percent of community college students passing national licensing and certification tests
8 2000 94% 94%
Goal 2. Oregon’s workforce is well trained and has access to a wide variety of training programs.
25 Number of professional-technical degrees and certificates awarded
9 2002 New 3,703 4,178
24 Oregon’s rank for community college tuition and fees among all western states
10 2000 Mod 3rd highest (out of 14)
8th highest (out of 14)
24 Number of high school students enrolled in community college credit programs
11 2000 16,022 22,116
Goal 3. All Oregonians have access to excellent, affordable community college services
24 Racial and ethnic minorities enrolled in community colleges as a percent of the state average
12 2000 Afr.Am 105% AsianAm. 115% Native Am.140% Hispan.Am145%
100% or more for all minorities
* A comparable national percentage is unavailable at this time

16
Community College Pledge to Oregon
Student Goals– Maintain open-door policy
– Maintain status as most affordable
– Provide access for ethnic minorities
– College access through distance delivery
Workforce goals– Meet training needs of
communities
– Help small businesses succeed
– Provide customized training
– Maintain high employer satisfaction with customized training
“The TED Center helped us with recruiting employees and providing the training for us. Our (new) plant here has simply come up quicker than any other start-up plant we’ve had. We’re one of the highest rated plants in Weyerhaeuser.” John Falk

17
Community College Pledge to Oregon
Accountability goals– Serve a high percentage of
Oregonians
– Provide a bridge between education sectors
– Provide GED services
– Help high school students get to college early
Quality goals– Maintain public approval
of community college services
– Prepare students for professional licensure exams
– Primary college choice of high school grads
– CC students successful at OUS institutions
“If you could have seen my parents’ faces when I told them I got a scholarship to go to college…it was like a miracle.” Lucino Anaya

18
Performance Measures:Customer Satisfaction - 2002
Progress Board Population Survey -Top Ten Public Services
50% 55% 60% 65% 70% 75% 80% 85% 90% 95% 100%
Providing K-12 Education
Maintaining highways, roads , bridges
Managing Growth and Sprawl
Developing Mass Transit
Protecting Natural Resources
Controlling Crime
Four-year College/University Education
Maintaining Clean Air and Water
Community College Education
Providing Parks and Open Spaces
Serv
ices
Approval RatingSource: Oregon Progress Board

19
Performance Measures: Workforce Investment Act Title IB
Performance Goals Program Year 2000 Program Year 2001
Services Core Indicator of Performance
Goal Actual Goal Actual Entered Employment Rate 73% 78% 74% 74% Retention Rate 83% 82% 83% 87% Earnings Gain $3,500 $3,781 $3,500 $2,073
Adults
Attainment of Educational or Occupational Skills Credential
60% 77% 60% 87%
Entered Employment Rate 78% 79% 79% 88% Retention Rate 88% 91% 89% 92% Earnings Replacement Rate 95% 108% 96% 87%
Dislocated Workers
Attainment of Educational or Occupational Skills Credential
60% 80% 60% 92%
Participant Customer
Satisfaction
68% 78% 69% 77%
Employer Customer
Satisfaction
68% 70% 69% 73%
Nearly 29,000 people were served in 2001-02.

20
Performance Measures: Workforce Investment Act Title IB
Performance Goals Program Year 2000 Program Year 2001
Services Core Indicator of Performance
Goal Actual Goal Actual Entered Employment Rate 66% 71% 66% 69% Retention Rate 74% 67% 75% 84% Earnings Gain $3,000 $3,904 $3,100 $2,833
Youth Aged 19 - 21
Attainment of Educational or Occupational Skills Credential
50% 74% 50% 64%
Attainment of Secondary School Diplomas or Equivalents
40% 52% 45% 66%
Attainment of Basic, Work Readiness and/or Occupational Skills Credential
65% 70% 68% 82%
Youth Aged 14 - 18
Placement and Retention in Post-Secondary Education or Training, or Placement in Military, Employment, or Apprenticeships
55% 54% 55% 61%
Nearly 29,000 people were served in 2001-02.

21
Adult Education And Family Literacy 2001-2002 Performance
Performance Measures Average Performance
Target
Actual Adults Completing at Least One Level
or Achieving Outcome
I Demonstrated Improvement in Literacy Skills:
Adult Basic Skills Development 37% 46% 5,937 Secondary Education 39% 56% 876 English Language Literacy 21% 21% 3,085 II High School Completion 40% 46% 2,653 III Entered Postsecondary
Education or Training 20% 32% 503
IV Entered Employment 28% 51% 869 V Retained Employment 39% 25% 345

22
Carl Perkins Professional Technical Programs
Performance Measures 2001-02
Plan 87.88 % 1P1. Academic Achievement - The rate at which postsecondary Perkins concentrators achieve a GPA of 2.0 or better on a four point scale in academic courses. Actual 91.12 %
Plan 92.87 % 1P2. Technical Skills Attainment - The rate at which Perkins concentrators make satisfactory progress. Actual 94.20 %
Plan 56.79 % 2P1. The rate at which postsecondary Perkins concentrators become completers (graduate or receive a one year certificate.) Actual 54.07 %
Plan 86.00 % 3P1. Placement in Postsecondary Education or Employment.
Actual *88.07 %
Plan 90.13 % 3P2. Retention in or Completion of Postsecondary Education or Retention in Employment. Actual 89.14 %
Plan 9.39 % 4P1. Access - The rate at which postsecondary Perkins concentrators access programs preparing for training and employment in career or occupations with significant under-representation by gender. Actual 16.49 %
Plan 14.50 % 4P2. The rate at which postsecondary Perkins concentrators complete programs preparing for training and employment in career or occupations with significant under-representation by gender. Actual 18.85 %

23
Data Systems & Performance Measures
GED Data Base GED certificates issued, participant demographics, test scores, etc.
WIA Performance Data System One-stops; services to at-risk youth, dislocated workers, adults
Oregon Community College Unified Reporting System (OCCURS)
Community college students and courses; federal Perkins reporting
Tracking of Programs and Students Data System(TOPS)
Basic skills student information; skill gains

24
Information Systems
Registered Participantsin These Systems
OCCURS406,434
GED10,644
TOPS26,314
WIAMIS28,790
GED Testing Service Certificates (6,030
issued)
Local Workforce Areas (LWA’s)
Adult Basic Education
Community Colleges
Agency Website
U.S. Dept. of Education
U.S. Dept. of Education
U.S. DOE
U.S. Dept. of Labor
Public
25
CCWD Audits
• The Department of Community Colleges and Workforce Development was included in the Secretary of State’s statewide audits of Federal Compliance and Internal Control for the years 1999-2000, 2000-01, and 2001-02. No findings were identified for the agency as a result of these audits.
• CCWD was included in the Secretary of State’s 2003 Follow-up Review of Internal Auditing Functions in State Agencies. We were one of 11 agencies identified as not having an internal audit position budgeted. As reflected in the lack of findings cited above, CCWD has taken steps to continue sufficient separation of duties to limit the potential for fraud.
26
Affirmative Action
• The current workforce consists of 73 percent females and 27 percent males
• The management/professional ratio is 66 percent female and 34 percent male; support staff is 100 percent female
• Persons of color make up four percent of the workforce and two percent is certified disabled.
• CCWD is underrepresented in the Disabled, African American, and Hispanic groups
• CCWD is at or above parity goals in the Women and Native American groups, and near parity in the of Asian/Pacific Islander group

27
Partners• Department of Human Services• Employment Department• Oregon University System• Department of Education• Department of Corrections• Economic and Community Development Department
• Multitude of county and local service delivery entities.
“I had been working for Caterpiller for eight years when I got notice the plant was going to close. I could have gotten back into another engineering job, but this new (vineyard management) career has been such a positive experience for me.” Rob Clarke