1 downtown at work pittsburgh downtown partnership march 2007 prepared by: strategic metrics group ...
TRANSCRIPT
1
DOWNTOWN AT WORK
Pittsburgh Downtown PartnershipMarch 2007
Prepared by: STRATEGIC METRICS GROUP
www.strategicmetricsgroup.com 412.480.4332
2
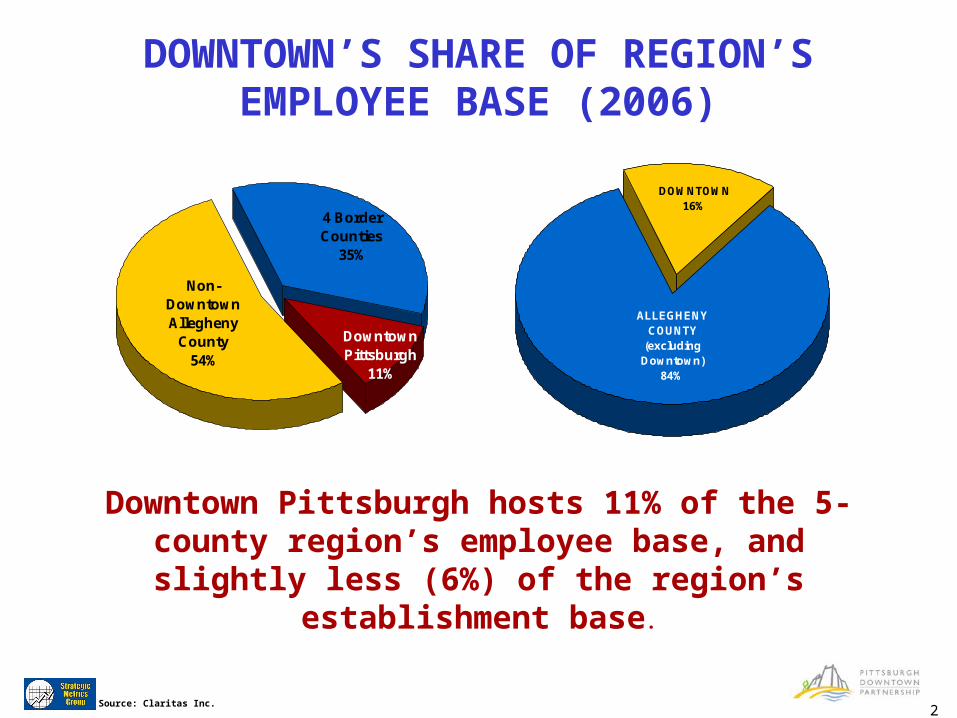
DOWNTOWN’S SHARE OF REGION’SEMPLOYEE BASE (2006)
4 Border Counties
35%
Non-Downtown Allegheny
County54%
Downtown Pittsburgh
11%
Downtown Pittsburgh hosts 11% of the 5-county region’s employee base, and slightly less (6%) of
the region’s establishment base.
Source: Claritas Inc.
ALLEGHENY COUNTY
(excluding Downtown)
84%
DOWNTOWN16%

3
DOWNTOWN PITTSBURGH5 Census Tracts
Washington
Pittsburgh
North
Shore
South
Shore
Golden
Triangle
Uptown
Strip
4
SUMMARY
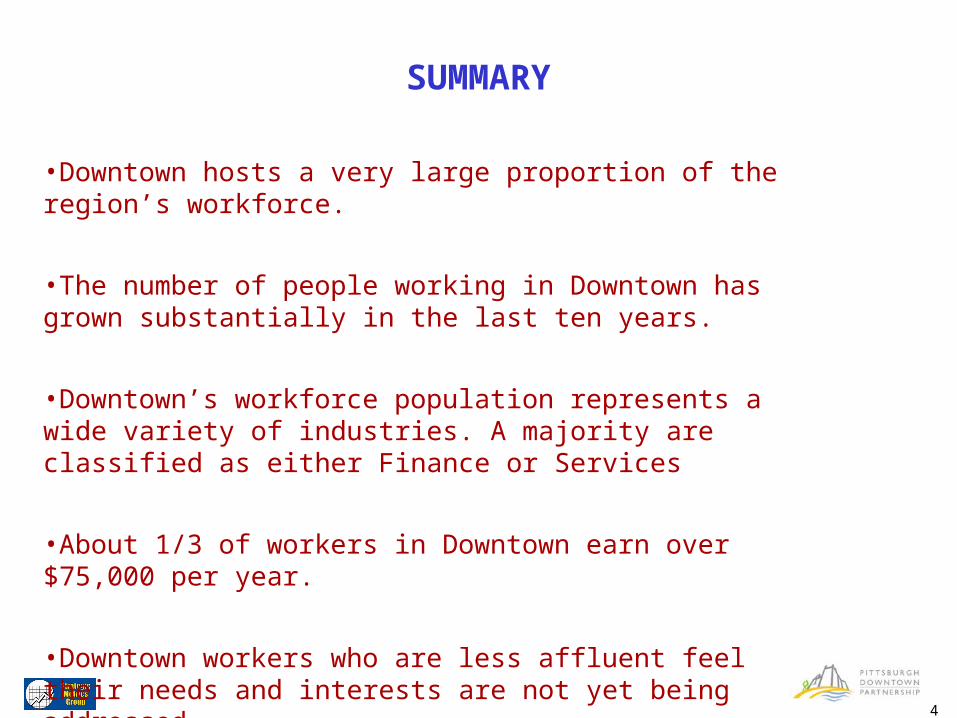
•Downtown hosts a very large proportion of the region’s workforce.
•The number of people working in Downtown has grown substantially in the last ten years.
•Downtown’s workforce population represents a wide variety of industries. A majority are classified as either Finance or Services
•About 1/3 of workers in Downtown earn over $75,000 per year.
•Downtown workers who are less affluent feel their needs and interests are not yet being addressed

5
111,557
136,928
0
25,000
50,000
75,000
100,000
125,000
150,000
175,000
1996 2006
+ 25,371
(+ 23%)
2.07% CAGR
Source: Claritas Inc.
DOWNTOWN EMPLOYEES
The Downtown Employee Count Has Grown At An Annual Rate Of About 2% Since 1996.
6
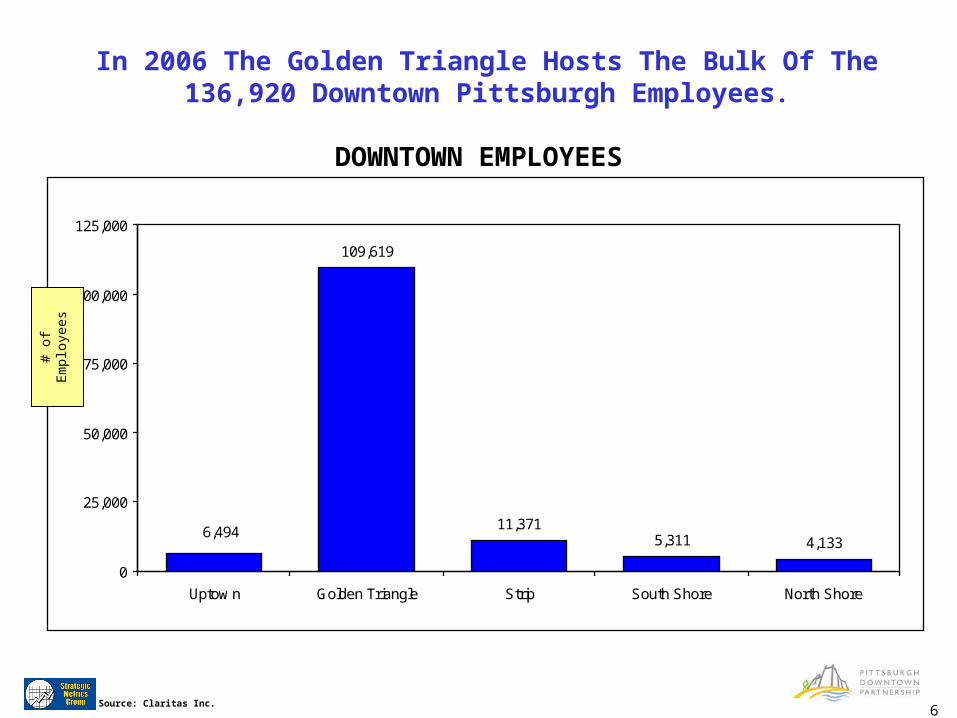
DOWNTOWN EMPLOYEES
109,619
11,3715,311 4,133
6,494
0
25,000
50,000
75,000
100,000
125,000
Uptow n Golden Triangle Strip South Shore North Shore
In 2006 The Golden Triangle Hosts The Bulk Of The 136,920 Downtown Pittsburgh Employees.
# of
Em
ploy
ees
Source: Claritas Inc.
7
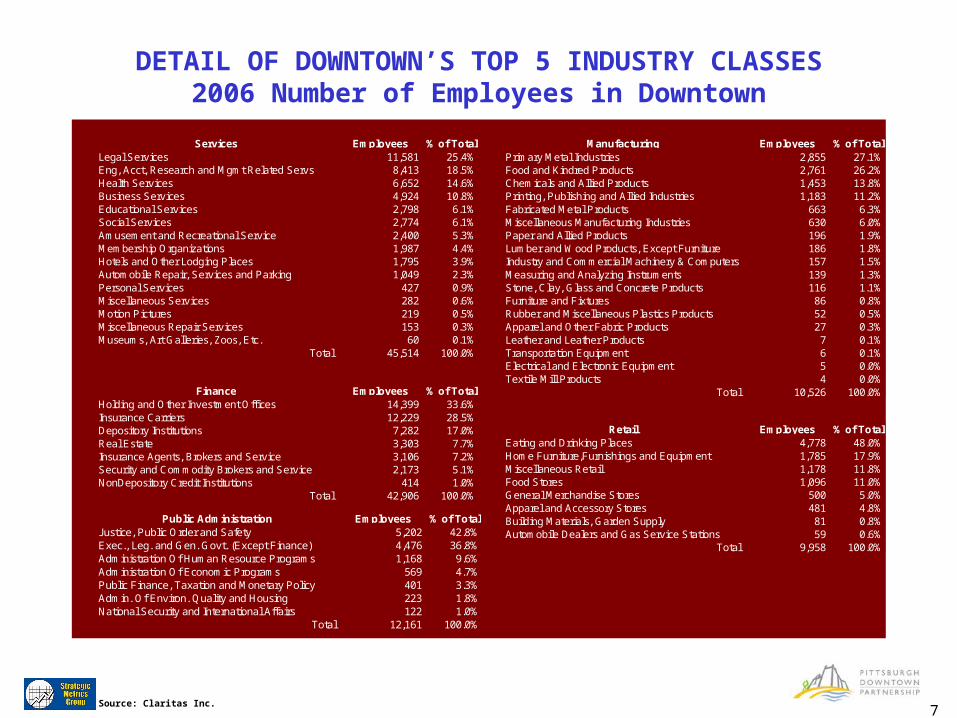
DETAIL OF DOWNTOWN’S TOP 5 INDUSTRY CLASSES2006 Number of Employees in Downtown
Services Employees % of TotalLegal Services 11,581 25.4%Eng, Acct, Research and Mgmt Related Servs 8,413 18.5%Health Services 6,652 14.6%Business Services 4,924 10.8%Educational Services 2,798 6.1%Social Services 2,774 6.1%Amusement and Recreational Service 2,400 5.3%Membership Organizations 1,987 4.4%Hotels and Other Lodging Places 1,795 3.9%Automobile Repair, Services and Parking 1,049 2.3%Personal Services 427 0.9%Miscellaneous Services 282 0.6%Motion Pictures 219 0.5%Miscellaneous Repair Services 153 0.3%Museums, Art Galleries, Zoos, Etc. 60 0.1%
Total 45,514 100.0%
Finance Employees % of TotalHolding and Other Investment Offices 14,399 33.6%Insurance Carriers 12,229 28.5%Depository Institutions 7,282 17.0%Real Estate 3,303 7.7%Insurance Agents, Brokers and Service 3,106 7.2%Security and Commodity Brokers and Service 2,173 5.1%NonDepository Credit Institutions 414 1.0%
Total 42,906 100.0%
Public Administration Employees % of TotalJustice, Public Order and Safety 5,202 42.8%Exec., Leg. and Gen. Govt. (Except Finance) 4,476 36.8%Administration Of Human Resource Programs 1,168 9.6%Administration Of Economic Programs 569 4.7%Public Finance, Taxation and Monetary Policy 401 3.3%Admin. Of Environ. Quality and Housing 223 1.8%National Security and International Affairs 122 1.0%
Total 12,161 100.0%
Manufacturing Employees % of TotalPrimary Metal Industries 2,855 27.1%Food and Kindred Products 2,761 26.2%Chemicals and Allied Products 1,453 13.8%Printing, Publishing and Allied Industries 1,183 11.2%Fabricated Metal Products 663 6.3%Miscellaneous Manufacturing Industries 630 6.0%Paper and Allied Products 196 1.9%Lumber and Wood Products, Except Furniture 186 1.8%Industry and Commercial Machinery & Computers 157 1.5%Measuring and Analyzing Instruments 139 1.3%Stone, Clay, Glass and Concrete Products 116 1.1%Furniture and Fixtures 86 0.8%Rubber and Miscellaneous Plastics Products 52 0.5%Apparel and Other Fabric Products 27 0.3%Leather and Leather Products 7 0.1%Transportation Equipment 6 0.1%Electrical and Electronic Equipment 5 0.0%Textile Mill Products 4 0.0%
Total 10,526 100.0%
Retail Employees % of TotalEating and Drinking Places 4,778 48.0%Home Furniture,Furnishings and Equipment 1,785 17.9%Miscellaneous Retail 1,178 11.8%Food Stores 1,096 11.0%General Merchandise Stores 500 5.0%Apparel and Accessory Stores 481 4.8%Building Materials, Garden Supply 81 0.8%Automobile Dealers and Gas Service Stations 59 0.6%
Total 9,958 100.0%
Source: Claritas Inc.
8
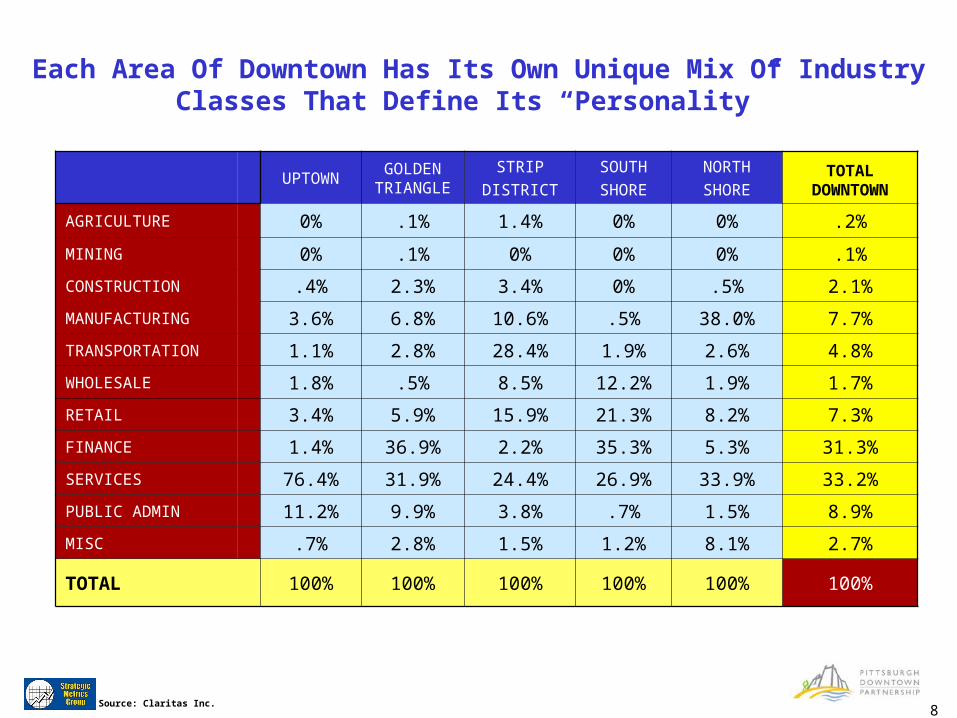
Each Area Of Downtown Has Its Own Unique Mix Of Industry Classes That Define Its “Personality”
UPTOWNGOLDEN
TRIANGLESTRIP
DISTRICT
SOUTH
SHORE
NORTH
SHORETOTAL
DOWNTOWN
AGRICULTURE 0% .1% 1.4% 0% 0% .2%
MINING 0% .1% 0% 0% 0% .1%
CONSTRUCTION .4% 2.3% 3.4% 0% .5% 2.1%
MANUFACTURING 3.6% 6.8% 10.6% .5% 38.0% 7.7%
TRANSPORTATION 1.1% 2.8% 28.4% 1.9% 2.6% 4.8%
WHOLESALE 1.8% .5% 8.5% 12.2% 1.9% 1.7%
RETAIL 3.4% 5.9% 15.9% 21.3% 8.2% 7.3%
FINANCE 1.4% 36.9% 2.2% 35.3% 5.3% 31.3%
SERVICES 76.4% 31.9% 24.4% 26.9% 33.9% 33.2%
PUBLIC ADMIN 11.2% 9.9% 3.8% .7% 1.5% 8.9%
MISC .7% 2.8% 1.5% 1.2% 8.1% 2.7%
TOTAL 100% 100% 100% 100% 100% 100%
Source: Claritas Inc.
9
15222
0103.00
0201.00
2205.00
1921.00
Allegheny
Washington
15136
15201
15203
15204
15205
15207
15210
15211
15212
15213
15214
15216
15219
15220
15224
15233
15261
0203.00
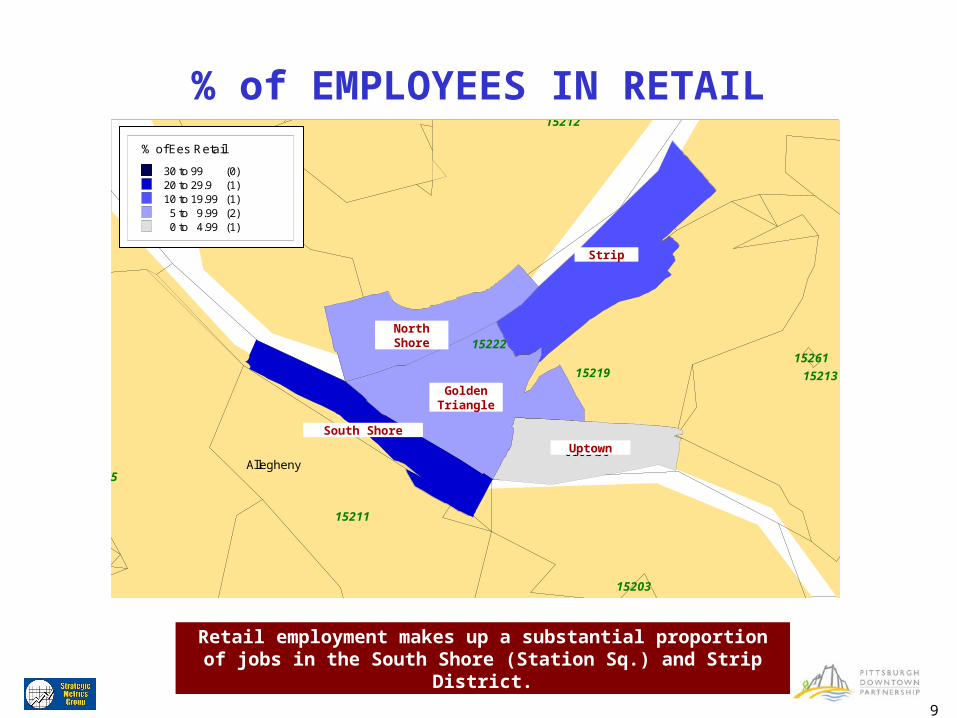
% of EMPLOYEES IN RETAIL
Retail employment makes up a substantial proportion of jobs in the South Shore (Station Sq.) and Strip District.
% of Ees Retail
30 to 99 (0)20 to 29.9 (1)10 to 19.99 (1)5 to 9.99 (2)0 to 4.99 (1)
% of Ees Wholesale
30 to 99 (0)20 to 29.9 (0)10 to 19.99 (1)5 to 9.99 (1)0 to 4.99 (3)
% of Ees Transportation
30 to 99 (0)20 to 29.9 (1)10 to 19.99 (0)5 to 9.99 (0)0 to 4.99 (4)
% of Ees Manufactuing
30 to 99 (1)20 to 29.9 (0)10 to 19.99 (1)5 to 9.99 (1)0 to 4.99 (2)
Percent Of Employees In Transportation
20 to 29.9 (1)0 to 9.9 (4)
North Shore
South Shore
Golden Triangle
Strip
Uptown
10
15222
0103.00
0201.00
2205.00
1921.00
Allegheny
Washington
15136
15201
15203
15204
15205
15207
15210
15211
15212
15213
15214
15216
15219
15220
15224
15233
15261
0203.00
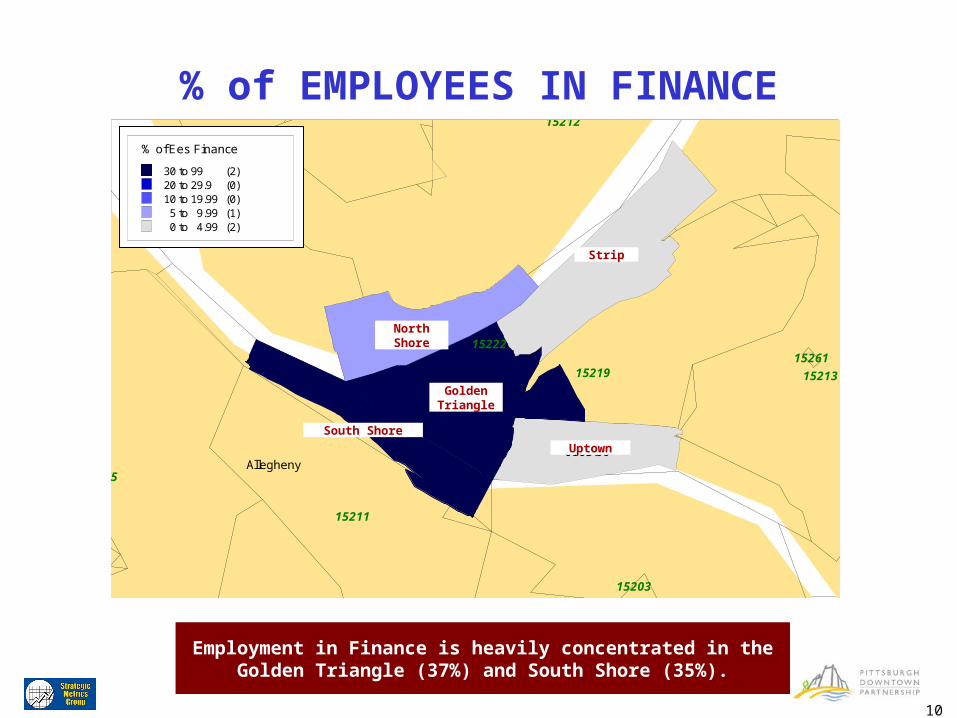
% of EMPLOYEES IN FINANCE
Employment in Finance is heavily concentrated in the Golden Triangle (37%) and South Shore (35%).
% of Ees Finance
30 to 99 (2)20 to 29.9 (0)10 to 19.99 (0)5 to 9.99 (1)0 to 4.99 (2)
% of Ees Retail
30 to 99 (0)20 to 29.9 (1)10 to 19.99 (1)5 to 9.99 (2)0 to 4.99 (1)
% of Ees Wholesale
30 to 99 (0)20 to 29.9 (0)10 to 19.99 (1)5 to 9.99 (1)0 to 4.99 (3)
% of Ees Transportation
30 to 99 (0)20 to 29.9 (1)10 to 19.99 (0)5 to 9.99 (0)0 to 4.99 (4)
% of Ees Manufactuing
30 to 99 (1)20 to 29.9 (0)10 to 19.99 (1)5 to 9.99 (1)0 to 4.99 (2)
Percent Of Employees In Transportation
20 to 29.9 (1)0 to 9.9 (4)
North Shore
South Shore
Golden Triangle
Strip
Uptown

11
15222
0103.00
1921.00
2205.00
0201.00
Allegheny
Washington
15136
15201
15203
15204
15205
15207
15210
15211
15212
15213
15214
15216
15219
15220
15224
15233
15261
0203.00
% of EMPLOYEES IN SERVICES
The Services category is by far the most common in all tracts. More than 3/4 of all employees in the Uptown area are classified
in this category.
% of Ees Services
30 to 99 (3)20 to 29.9 (2)10 to 19.99 (0)5 to 9.99 (0)0 to 4.99 (0)
% of Ees Finance
30 to 99 (2)20 to 29.9 (0)10 to 19.99 (0)5 to 9.99 (1)0 to 4.99 (2)
% of Ees Retail
30 to 99 (0)20 to 29.9 (1)10 to 19.99 (1)5 to 9.99 (2)0 to 4.99 (1)
% of Ees Wholesale
30 to 99 (0)20 to 29.9 (0)10 to 19.99 (1)5 to 9.99 (1)0 to 4.99 (3)
% of Ees Transportation
30 to 99 (0)20 to 29.9 (1)10 to 19.99 (0)5 to 9.99 (0)0 to 4.99 (4)
% of Ees Manufactuing
30 to 99 (1)20 to 29.9 (0)10 to 19.99 (1)5 to 9.99 (1)0 to 4.99 (2)
Percent Of Employees In Transportation
20 to 29.9 (1)0 to 9.9 (4)
North Shore
South Shore
Golden Triangle
Strip
Uptown

12
15222
0103.00
0201.00
2205.00
1921.00
Allegheny
Washington
15136
15201
15203
15204
15205
15207
15210
15211
15212
15213
15214
15216
15219
15220
15224
15233
15261
0203.00
% of EMPLOYEES IN PUBLIC ADMINISTRATION
Employment in Public Administration is less than 10% in all districts with the exception of Uptown (11%) where the City and
County buildings are located.
% of Ees Public Admin.
30 to 99 (0)20 to 29.9 (0)10 to 19.99 (1)5 to 9.99 (1)0 to 4.99 (3)
% of Ees Services
30 to 99 (3)20 to 29.9 (2)10 to 19.99 (0)5 to 9.99 (0)0 to 4.99 (0)
% of Ees Finance
30 to 99 (2)20 to 29.9 (0)10 to 19.99 (0)5 to 9.99 (1)0 to 4.99 (2)
% of Ees Retail
30 to 99 (0)20 to 29.9 (1)10 to 19.99 (1)5 to 9.99 (2)0 to 4.99 (1)
% of Ees Wholesale
30 to 99 (0)20 to 29.9 (0)10 to 19.99 (1)5 to 9.99 (1)0 to 4.99 (3)
% of Ees Transportation
30 to 99 (0)20 to 29.9 (1)10 to 19.99 (0)5 to 9.99 (0)0 to 4.99 (4)
% of Ees Manufactuing
30 to 99 (1)20 to 29.9 (0)10 to 19.99 (1)5 to 9.99 (1)0 to 4.99 (2)
Percent Of Employees In Transportation
20 to 29.9 (1)0 to 9.9 (4)
North Shore
South Shore
Golden Triangle
Strip
Uptown

13
15222
0103.00
0201.00
2205.00
1921.00
Allegheny
Washington
15136
15201
15203
15204
15205
15207
15210
15211
15212
15213
15214
15216
15219
15220
15224
15233
15261
0203.00
% of EMPLOYEES IN MANUFACTURING
Jobs classified as Manufacturing are most heavily concentrated on the North Shore (38%).
% of Ees Manufactuing
30 to 99 (1)20 to 29.9 (0)10 to 19.99 (1)5 to 9.99 (1)0 to 4.99 (2)
Percent Of Employees In Transportation
20 to 29.9 (1)0 to 9.9 (4)
North Shore
South Shore
Golden Triangle
Strip
Uptown

14
While Golden Triangle Accounts For The Bulk Of The Employee Growth In The Last 10 Years Both The South And North Shore Areas Have Grown At
A Much Faster Pace.
Source: Claritas Inc.
88,549
9,5912,801 2,9946,494
109,619
11,3715,311 4,133
7,622
0
25,000
50,000
75,000
100,000
125,000
Uptown Golden Triangle Strip South Shore North Shore
1996 2006
# of
Em
ploy
ees
Total Employees by Downtown Area
15
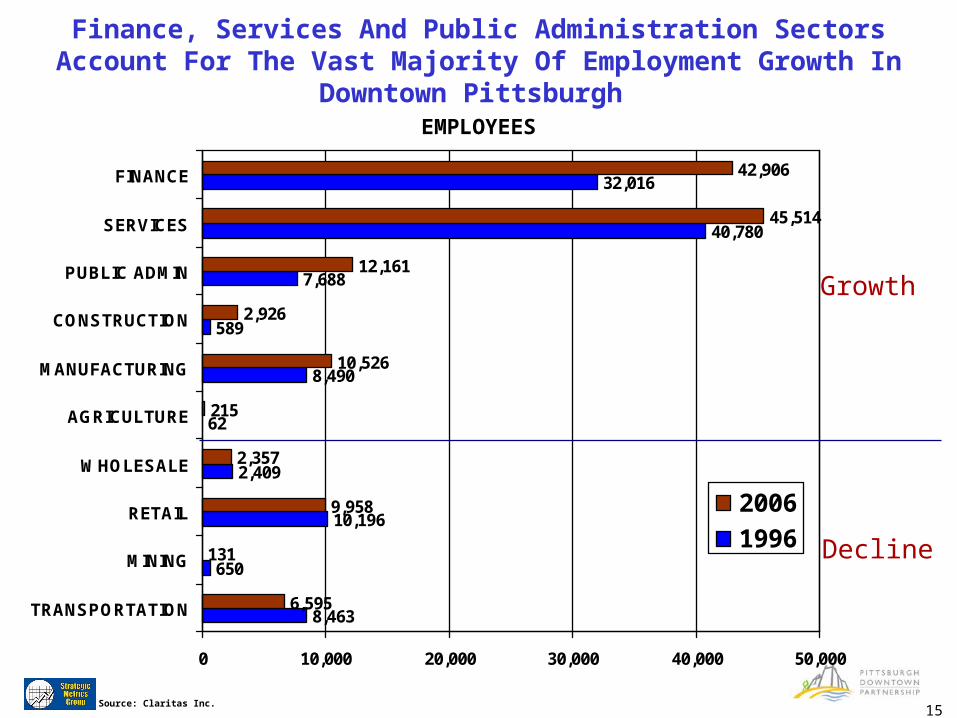
EMPLOYEES
Source: Claritas Inc.
8,463
650
10,196
2,409
62
8,490
589
7,688
40,780
32,016
6,595
131
9,958
2,357
215
10,526
2,926
12,161
45,514
42,906
0 10,000 20,000 30,000 40,000 50,000
TRANSPORTATION
MINING
RETAIL
WHOLESALE
AGRICULTURE
MANUFACTURING
CONSTRUCTION
PUBLIC ADMIN
SERVICES
FINANCE
2006
1996
Growth
Decline
Finance, Services And Public Administration Sectors Account For The Vast Majority Of Employment Growth In Downtown Pittsburgh
16
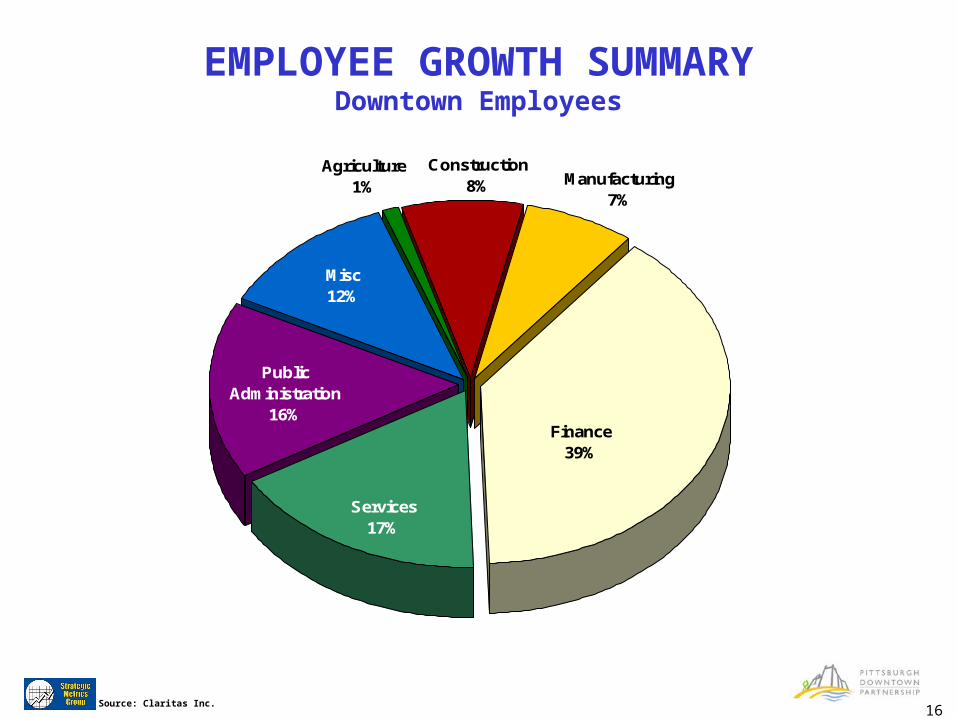
Finance39%
Agriculture1% Manufacturing
7%
Construction8%
Misc12%
Public Administration
16%
Services17%
EMPLOYEE GROWTH SUMMARYDowntown Employees
Source: Claritas Inc.

17Source: Claritas Inc.
Breakdown of FINANCE Industry Class
Real Estate9%
Depository39%
Insur Carrier17%
Non Depository1%
Holdings& Other
Investment34%
Depository Institutions 5,624 Holdings/Other Investment Offices 4,844 Insurance Carriers 2,440 Real Estate 1,331 Non Depository Credit Institutions 165 Security & Commodity Brokers (1,553) Insurance Agents & Brokers (1,961)
TOTAL (Net) 10,890
Employee growth in FINANCE is driven by Depository Institutions and Holdings & Other Investment Offices
Percent of Growth

18Source: Claritas Inc.
Breakdown of SERVICE Industry Class
Membership4%
Eng,Acctg,Mgt17%
Health13%
Auto Repair / Parking
9%
Amusement24%
Misc. Repair1%
Social3%
Misc.4%
Legal25%
Amusement / Rec. 1,790 Legal Services 1,771 Eng,Acctg,Mgmnt 1,238 Health Service 931 Auto Repair/Parking 629 Membership Org. 277 Misc. Services 270 Social Services 191 Misc. Repair 87 Museums / Galleries (6) Motion Pictures (19) Hotel / Other Lodging (222) Personal Service (238) Educational Service (347) Business Services (1,618) TOTAL (Net) 4,734
Legal Services, Amusement & Recreation (such as theaters) account for half of the growth in SERVICES
Percent of Growth
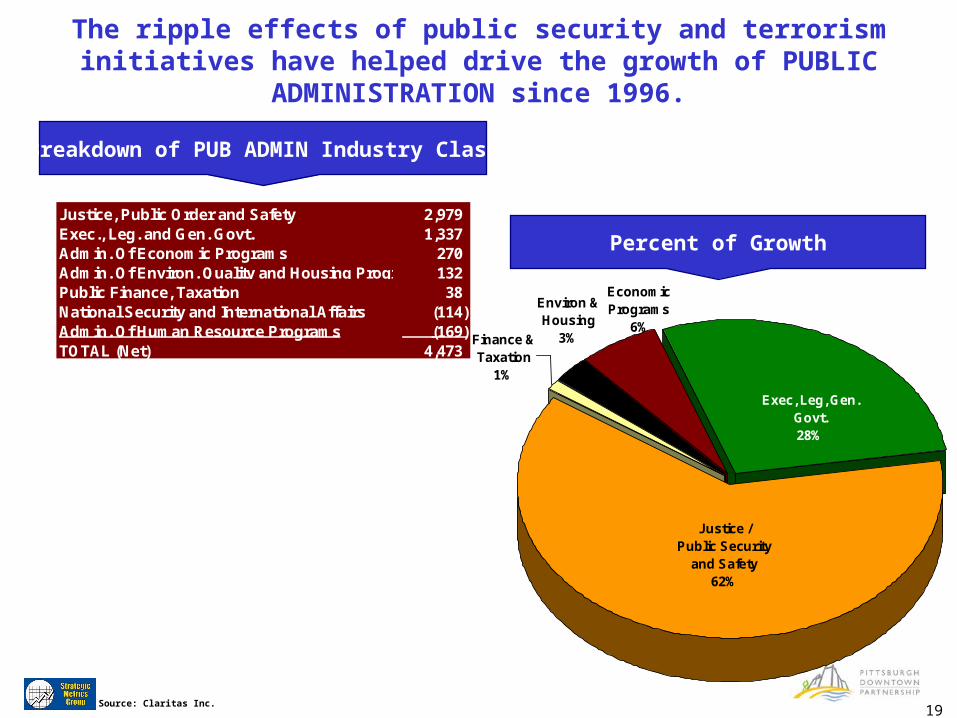
19Source: Claritas Inc.
Breakdown of PUB ADMIN Industry Class
Environ & Housing
3%
Exec, Leg, Gen. Govt.28%
Finance & Taxation
1%
Justice /Public Security
and Safety62%
EconomicPrograms
6%
Justice, Public Order and Safety 2,979 Exec., Leg. and Gen. Govt. 1,337 Admin. Of Economic Programs 270 Admin. Of Environ. Quality and Housing Programs 132 Public Finance, Taxation 38 National Security and International Affairs (114) Admin. Of Human Resource Programs (169) TOTAL (Net) 4,473
The ripple effects of public security and terrorism initiatives have helped drive the growth of PUBLIC ADMINISTRATION since 1996.
Percent of Growth
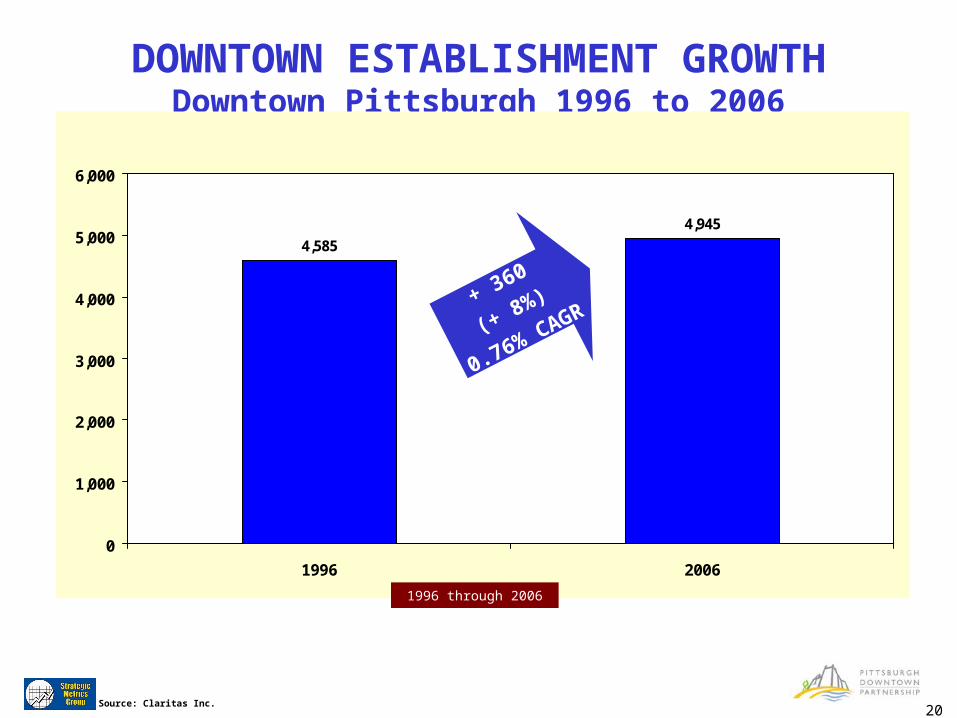
20
DOWNTOWN ESTABLISHMENT GROWTHDowntown Pittsburgh 1996 to 2006
4,585
4,945
0
1,000
2,000
3,000
4,000
5,000
6,000
1996 2006
1996 through 2006
+ 360
(+ 8%)
0.76% CAGR
Source: Claritas Inc.
21
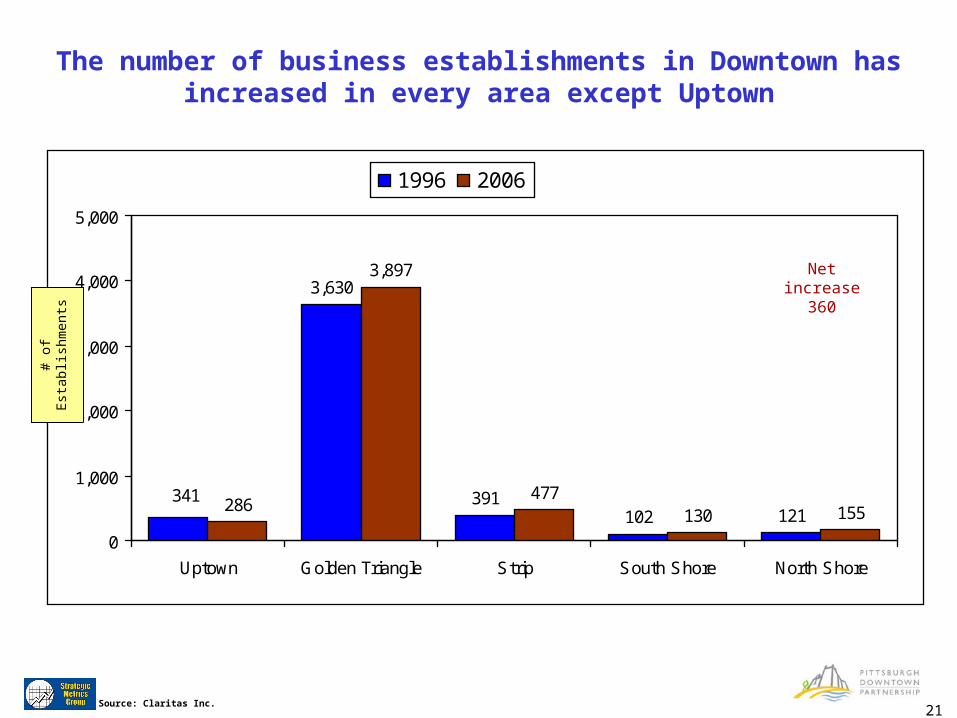
3,630
391102 121
286
3,897
477130 155
341
0
1,000
2,000
3,000
4,000
5,000
Uptown Golden Triangle Strip South Shore North Shore
1996 2006
# of
Est
ablis
hmen
ts
Source: Claritas Inc.
Net increase 360
The number of business establishments in Downtown has increased in every area except Uptown

22
ESTABLISHMENTS
Source: Claritas Inc.
764
162
227
14
106
4
51
337
524
2,388
696
106
184
7
106
11
64
357
611
2,550
0 3000
RETAIL
WHOLESALE
MANUFACTURING
MINING
TRANSPORTATION
AGRICULTURE
CONSTRUCTION
PUBLIC ADMIN.
FINANCE
SERVICES
2006
1996
Growth
Decline
Finance And Services Account For Close To 250 More Business Establishments In Downtown Compared To 1996.

23
DOWNTOWN WORKER INCOMETotal Annual Household Income
12%
31%
23%
15%18%
0%
15%
30%
45%
Less $25K $25K - $49K $50K - $74K $75K - $99K $100K +
12%
31%
23%
15%18%
0%
15%
30%
45%
Less $25K $25K - $49K $50K - $74K $75K - $99K $100K +
% o
f R
espo
nden
tsOne Third Of Downtown Workers Earn Incomes In Excess Of
$75,000 Per Year
Source: PDP 2003 Commuter Needs Study, 2005 Transit Study, 2006 Pedestrian Traffic Study, .
24
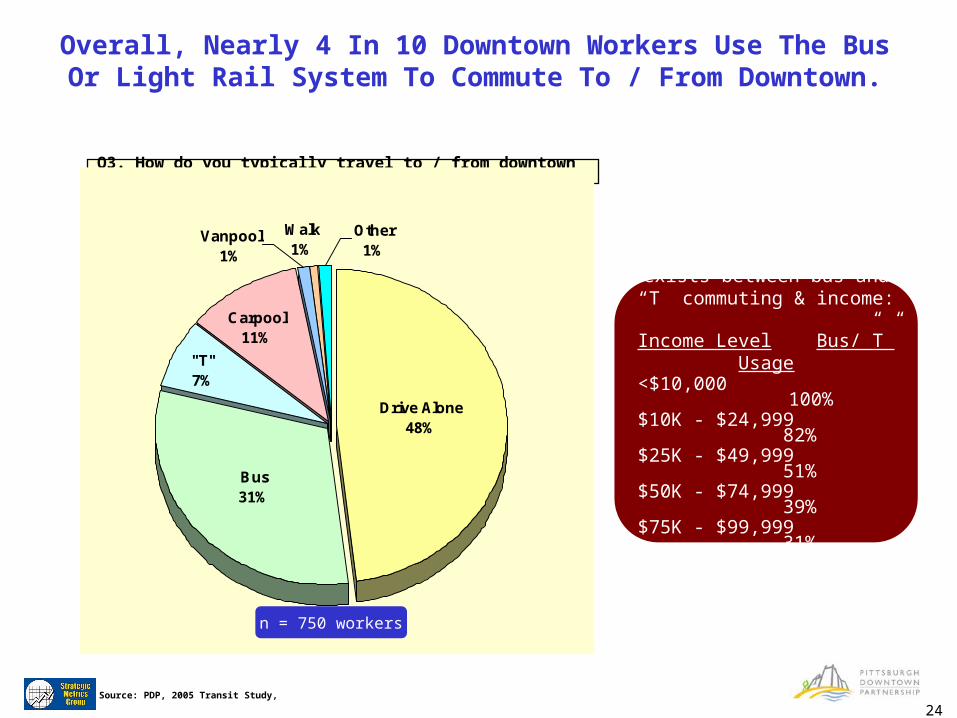
Q3. How do you typically travel to / from downtown Pittsburgh?
"T"7%
Bus31%
Drive Alone48%
Walk1%
Other1%
Vanpool1%
Carpool11%
Strong correlation exists between bus and “T” commuting & income:
Income Level Bus/”T” Usage<$10,000 100%$10K - $24,999 82%$25K - $49,999 51%$50K - $74,999 39%$75K - $99,999 31%$100,000 + 19%
n = 750 workers
Source: PDP, 2005 Transit Study,
Overall, Nearly 4 In 10 Downtown Workers Use The Bus Or Light Rail System To Commute To / From Downtown.

25
27
29
19
15
11
35
29
18
11
7
0
5
10
15
20
25
30
35
40
<$20,000 $20,000-$34,999 $35,000 - $49,999 $50,000-$74,999 $75,000+
Downtown
Rest Of City OfPittsburgh
Per
cent
Wages Of Downtown Workers Are Higher Than Those In Other Areas Of The City
Source: 2000 US Census - Census Transportation Planning Package .

26
26
30
18
15
12
30
20
25
14
12
23
28
18
15 15
34
28
17
13
8
27
31
23
13
6
0
5
10
15
20
25
30
35
40
<$20,000 $20,000-$34,999 $35,000 - $49,999 $50,000-$74,999 $75,000+
Golden Triangle
South Shore
North Shore
Uptown
Strip District
Per
cent
Wages Of Workers On The North Shore Skew Higher Than Other Areas Of Downtown
Source: 2000 US Census - Census Transportation Planning Package .

27
DOWNTOWN WORKER HH INCOME
12%
31%
23%
15%
18%
0%
15%
30%
45%
Less $25K $25K - $49K $50K - $74K $75K - $99K $100K +
% o
f R
espo
nden
ts1/3 Of Downtown Workers Have HH Incomes
In Excess Of $75,000 Per Year
Source: PDP 2003 Commuter Needs Study, 2005 Transit Study, 2006 Pedestrian Traffic Study, .
Total Annual Household Income

28
FOCUS GROUP KEY FINDINGS
People Genuinely Like Being Downtown
workers and students had good things to say enjoy being close to many different and exciting
things appreciate the convenience and excitement that
working in Downtown offers
29
FOCUS GROUP KEY FINDINGS
Shopping Downtown Needs To Be Unique It is no surprise that most Downtown workers feel that the options available to them for retail
shopping are severely limited. Many express the desire to have conveniently located stores that are similar to those they find near where they live, (e.g. Target, Giant Eagle). However, stores located in Downtown that are otherwise ubiquitous might serve only the convenience item needs of workers. Most like the idea of a centralized shopping district in Downtown.

30
FOCUS GROUP KEY FINDINGS
Addressing Needs of the Broader Downtown Work Force. Downtown Pittsburgh’s workforce is far from homogenous with a wide range of age and socio-
economic groups present each day. The perceptions of what are both positive and negative aspects of working downtown appear to be strongly driven by the income level and occupation of the individual. Those with higher incomes are much more positive about what working Downtown has to offer. The Cultural District and the restaurants, galleries and theaters there is seen as a great example of what Downtown can be. However, the perception exists that the needs and interests of those with less disposable income have not yet been adequately addressed.

31
FOCUS GROUP KEY FINDINGS
Desire for More Police Presence In most of the sessions, it was mentioned that Downtown has specific areas that present issues of
concern with safety. Market Square, Fifth and Wood and others were cited as areas that many simply avoid. This is especially true at night. Most who do enjoy staying Downtown for evening activities limit themselves to the Cultural District and other areas that they deem safe. Higher visibility of Police presence is something many would like to see.
32
FOCUS GROUP KEY FINDINGS
Parking is Expensive The high cost of parking in downtown was also an issue expressed by all of the groups. This is
obviously not a simple problem to address, but the perception does exist and represents a potential obstacle for many who would consider spending more time Downtown after work.
33
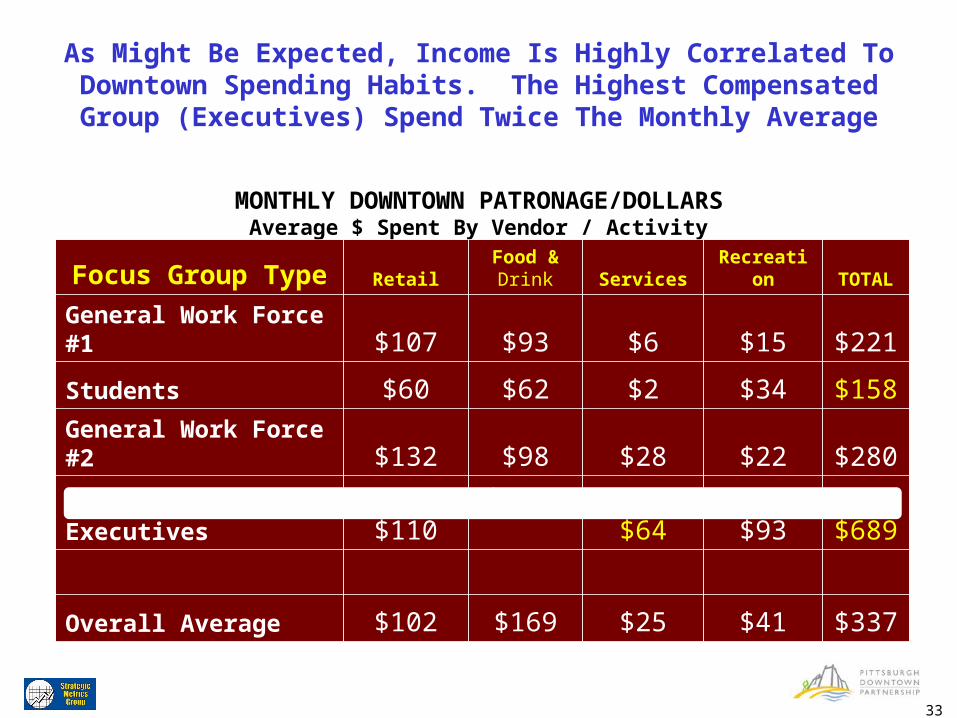
MONTHLY DOWNTOWN PATRONAGE/DOLLARSAverage $ Spent By Vendor / Activity
Focus Group Type RetailFood & Drink Services Recreation TOTAL
General Work Force #1 $107 $93 $6 $15 $221
Students $60 $62 $2 $34 $158
General Work Force #2 $132 $98 $28 $22 $280
Executives $110 $422 $64 $93 $689
Overall Average $102 $169 $25 $41 $337
As Might Be Expected, Income Is Highly Correlated To Downtown Spending Habits. The Highest Compensated Group (Executives)
Spend Twice The Monthly Average

34
What Does All Of This Mean?

35
EXECUTIVE SUMMARY
137,000 people work at 5,000 business establishments located across the 5 census tracts (Uptown, Golden Triangle, Strip District, South Shore, North Shore) that collectively define Downtown Pittsburgh.
The Golden Triangle is home to the majority of Downtown’s employees and establishments. This area alone accounts for 80% of Downtown’s employees and 78% of its business establishments.
Positive momentum is taking place in Downtown Pittsburgh. Over the past 10 years the number of Downtown business establishments has grown .08% annually. Over this same time period the number of employees working in Downtown has risen at an annual rate of almost 2.1%.
Services (33%) and Finance (31%) account for almost two-thirds of Downtown’s 2006 workforce. The Finance segment is responsible for more net employee growth since 1996 than any other industry class. Legal Services, part of the broader Services category, is another key growth sector boosting Downtown’s employee count since 1996.

36
EXECUTIVE SUMMARY
The North and South Shore sections of Downtown appear poised to drive growth in the future. Both areas have added employees and grown impressively (relative to their size) since 1996 and hold vast potential for even more development.
Workers enjoy their daily Downtown experience and most agree there is positive change and prudent redevelopment taking place.
Redevelopment efforts will have a greater chance of success if they addresses the needs of a wide range of socio-economic levels among workforce and students.