1 economics 776 experimental economics first semester 2007 topic 7: market experiments assoc. prof....
TRANSCRIPT

1
Economics 776 Experimental Economics
First Semester 2007Topic 7: Market Experiments
Assoc. Prof. Ananish Chaudhuri
Department of Economics
University of Auckland

2
Market Experiments
• The aim here is – to understand the equilibration process in
markets• what causes faster/slower convergence to
equilibrium
– Examine efficienty properties of different market institutions
• We will focus on two of these – Competitive Markets– Posted Offer Markets
3
An Experimental Study of Competitive Market Behavior - Smith (1962)
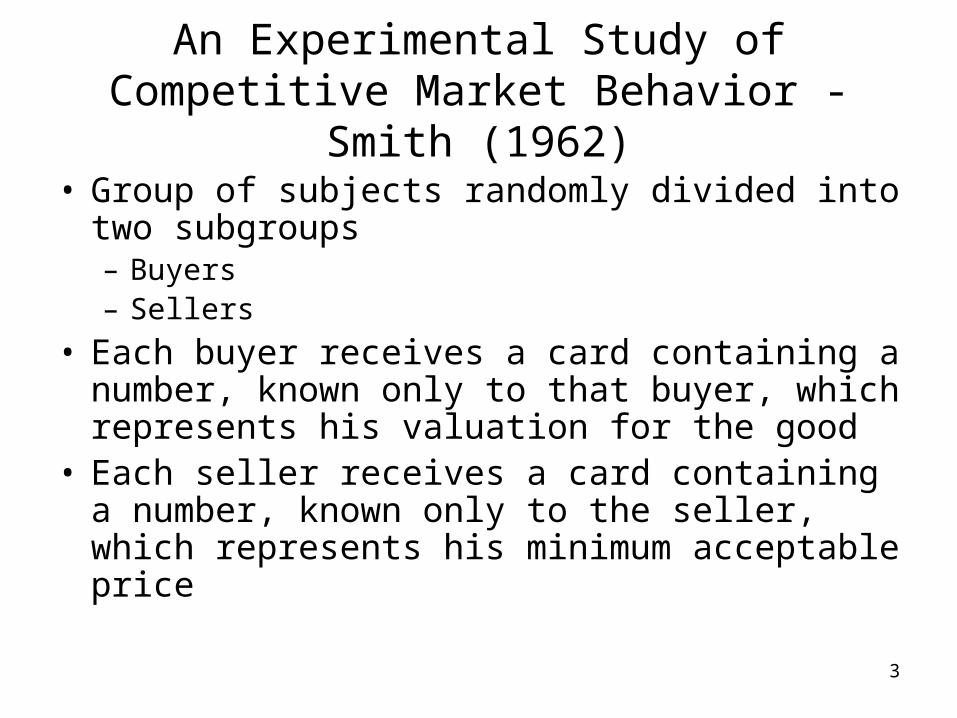
• Group of subjects randomly divided into two subgroups– Buyers– Sellers
• Each buyer receives a card containing a number, known only to that buyer, which represents his valuation for the good
• Each seller receives a card containing a number, known only to the seller, which represents his minimum acceptable price
4
An Experimental Study of Competitive Market Behavior - Smith (1962)
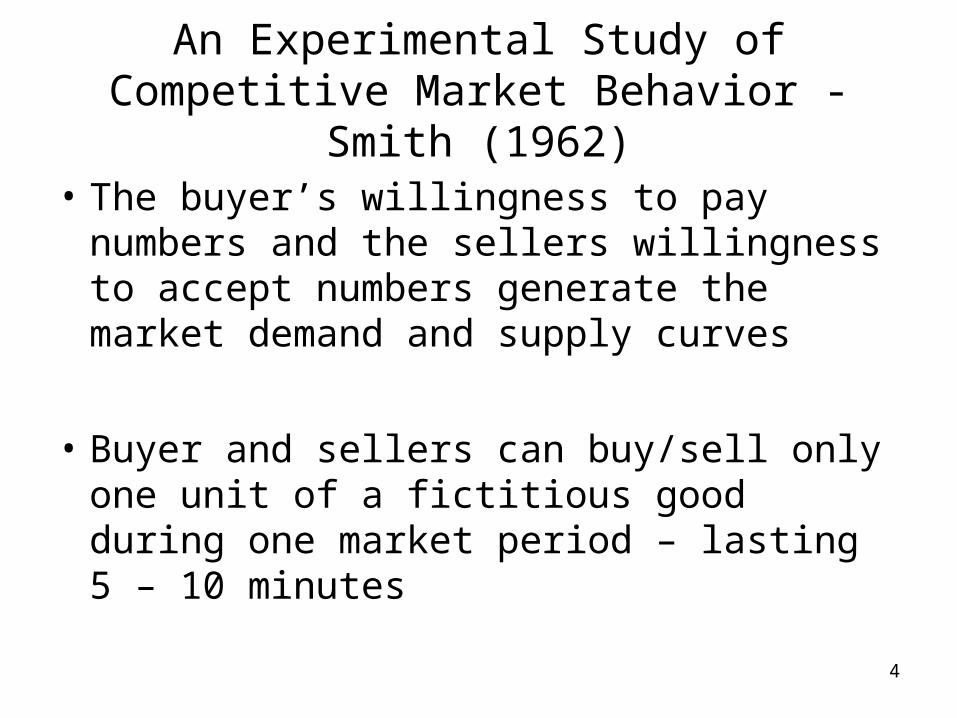
• The buyer’s willingness to pay numbers and the sellers willingness to accept numbers generate the market demand and supply curves
• Buyer and sellers can buy/sell only one unit of a fictitious good during one market period – lasting 5 – 10 minutes

5
An Experimental Study of Competitive Market Behavior - Smith (1962)
• As soon as a contract is accepted, the contract price is recorded together with the minimum supply price of the seller and the maximum demand price for the buyer
• This sets the stage to study price behaviour under a particular set of demand and supply functions

6
$2.00
Q = 6
7
An Experimental Study of Competitive Market Behavior - Smith (1962)
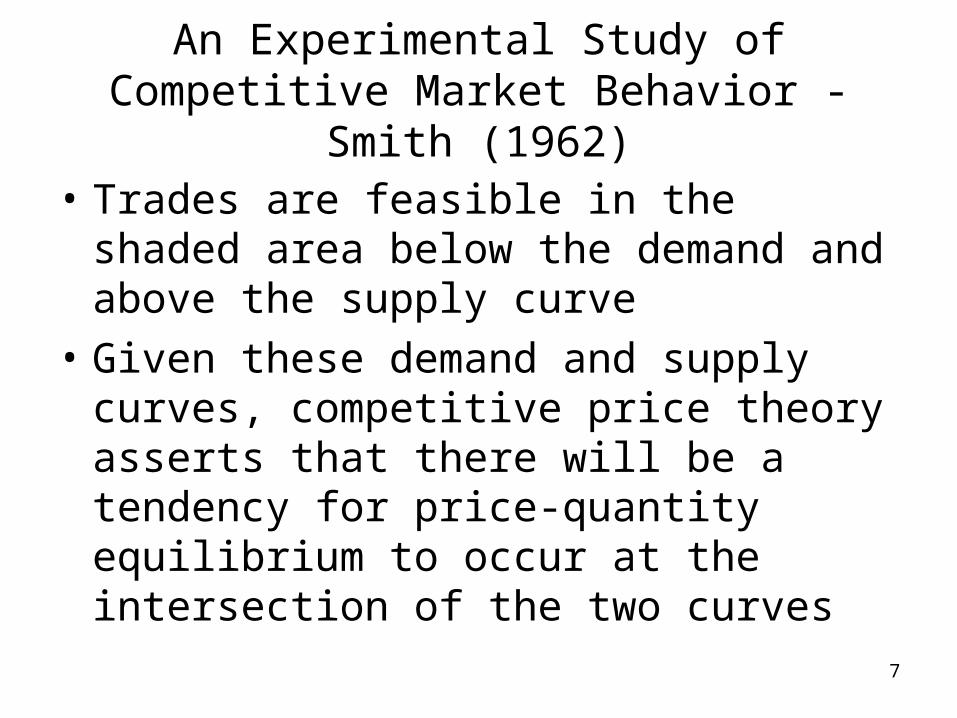
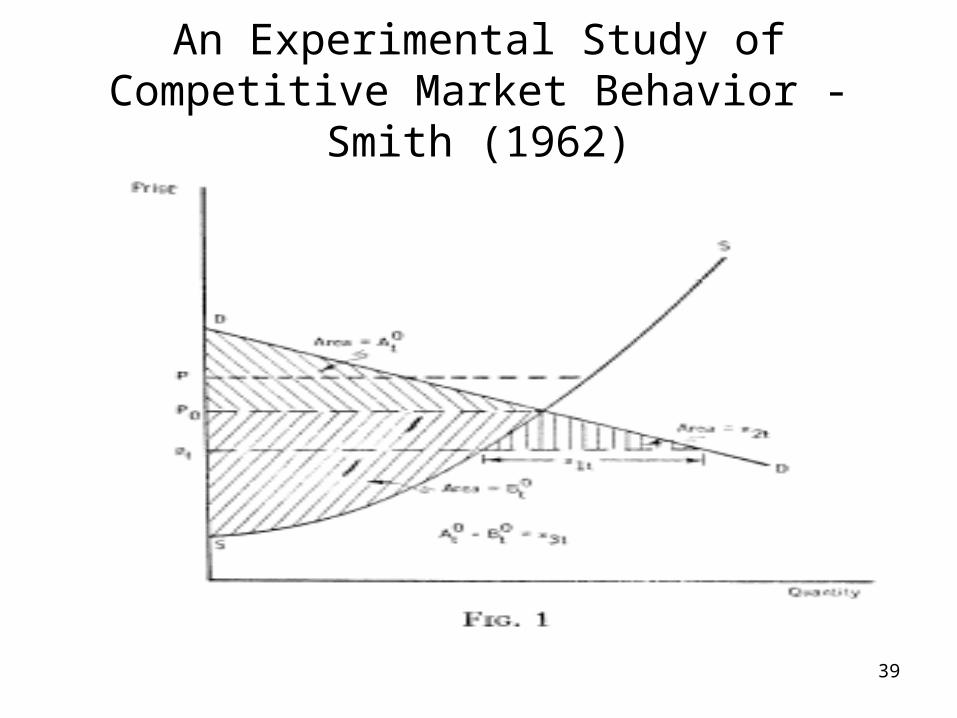
• Trades are feasible in the shaded area below the demand and above the supply curve
• Given these demand and supply curves, competitive price theory asserts that there will be a tendency for price-quantity equilibrium to occur at the intersection of the two curves

8
An Experimental Study of Competitive Market Behavior - Smith (1962)
• But there is no guarantee that the equilibrium defined by the intersection of these sets will prevail
• The mere fact that these demand supply schedules exist in the background of a market does not guarantee that any meaningful relationship exists between those schedules and what is observed in the market they are presumed to represent

9
An Experimental Study of Competitive Market Behavior - Smith (1962)
• Thus in Figure 1 the $3.20 buyer can buy from the $3.20 seller, the $3.00 buyer from the $3.00 seller without violating any restrictions imposed on buyers and sellers
• These experiments conform in several important ways to many kinds of real markets such as a commodity or stock exchanges
10
An Experimental Study of Competitive Market Behavior - Smith (1962)
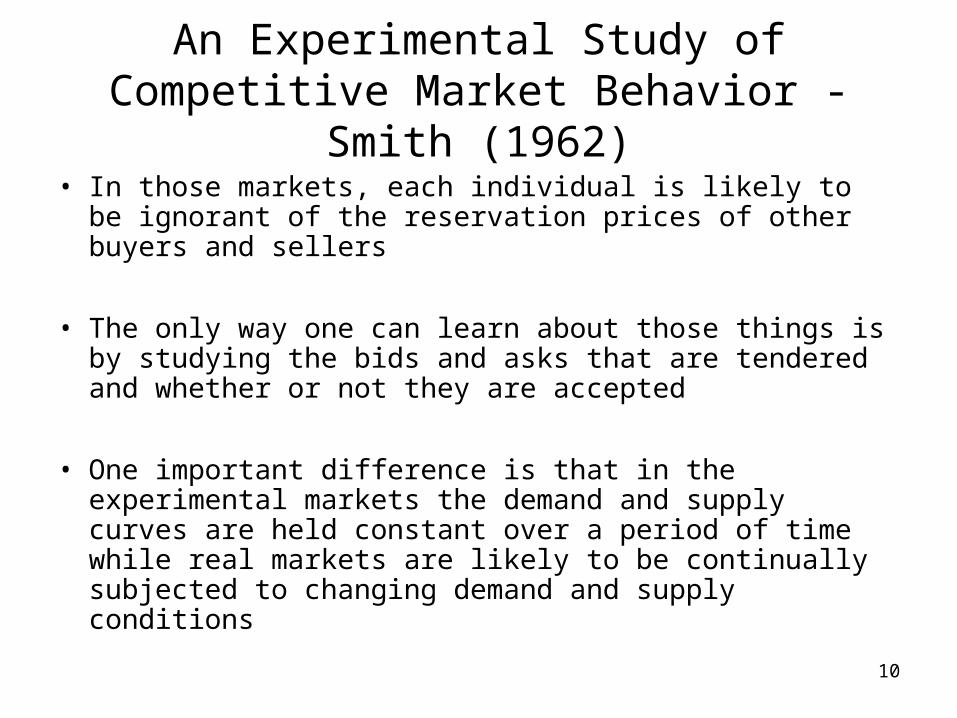
• In those markets, each individual is likely to be ignorant of the reservation prices of other buyers and sellers
• The only way one can learn about those things is by studying the bids and asks that are tendered and whether or not they are accepted
• One important difference is that in the experimental markets the demand and supply curves are held constant over a period of time while real markets are likely to be continually subjected to changing demand and supply conditions
11
An Experimental Study of Competitive Market Behavior - Smith (1962)
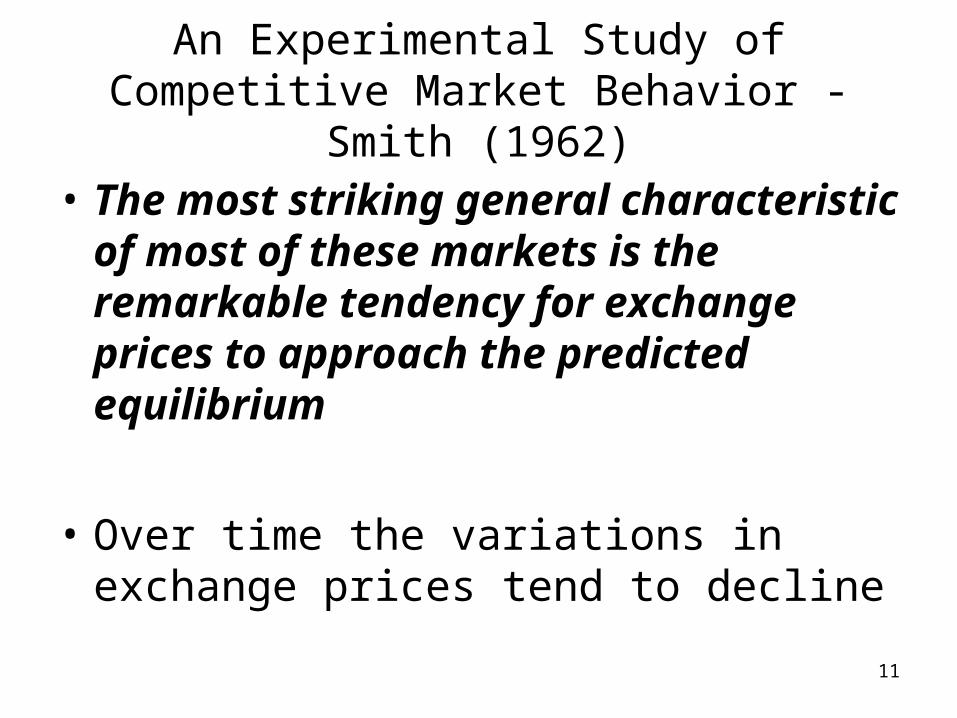
• The most striking general characteristic of most of these markets is the remarkable tendency for exchange prices to approach the predicted equilibrium
• Over time the variations in exchange prices tend to decline
12
An Experimental Study of Competitive Market Behavior - Smith (1962)
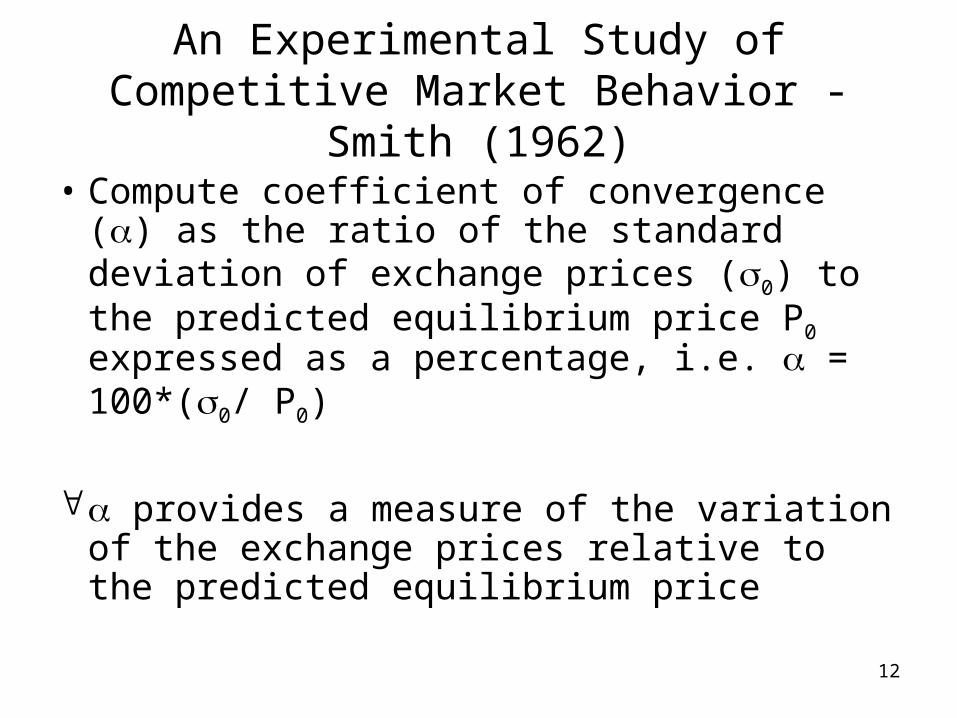
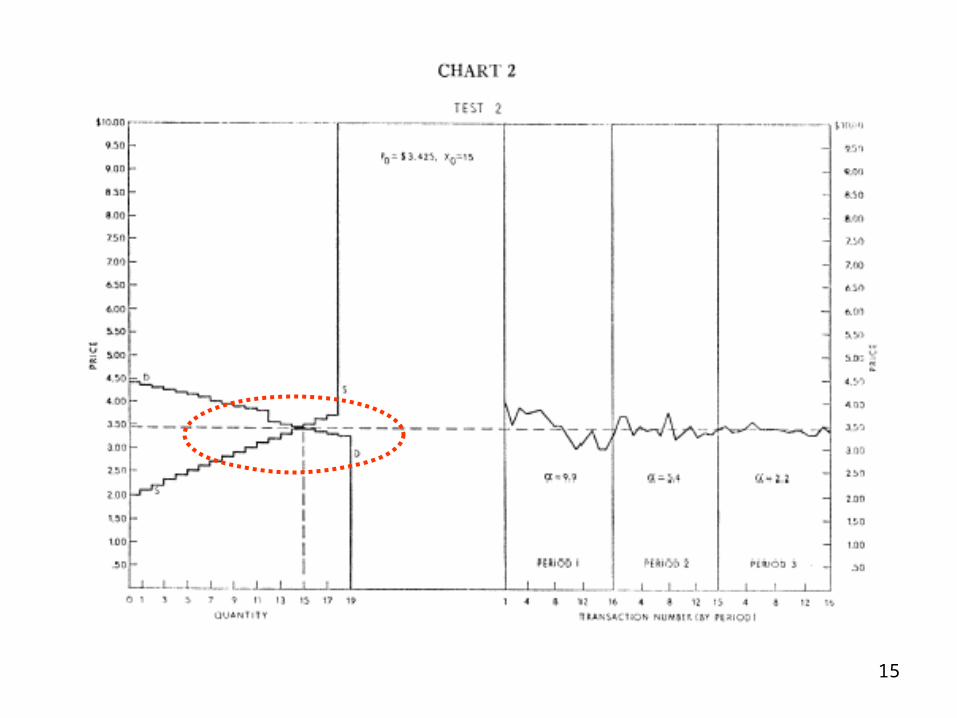
• Compute coefficient of convergence () as the ratio of the standard deviation of exchange prices (0) to the predicted equilibrium price P0 expressed as a percentage, i.e. = 100*(0/ P0)
provides a measure of the variation of the exchange prices relative to the predicted equilibrium price

13
14
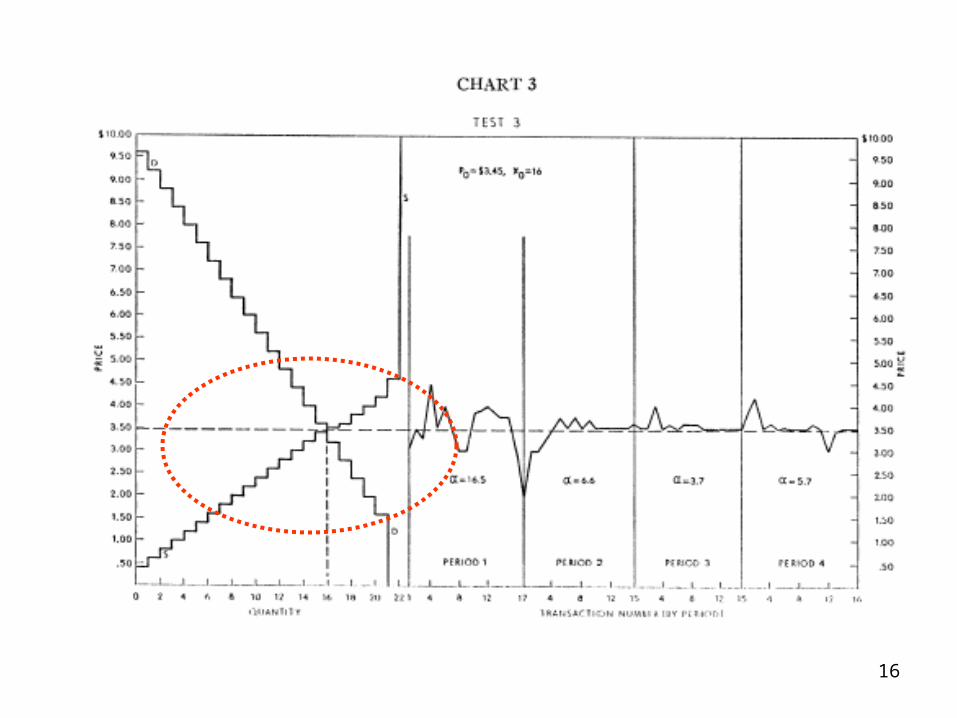
An Experimental Study of Competitive Market Behavior - Smith (1962)
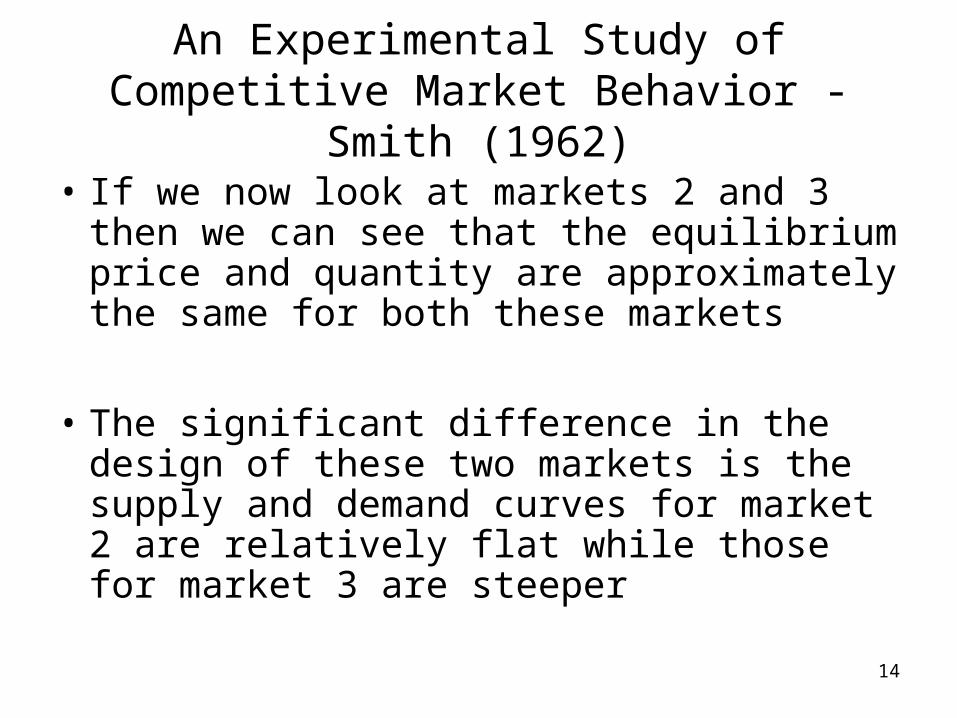
• If we now look at markets 2 and 3 then we can see that the equilibrium price and quantity are approximately the same for both these markets
• The significant difference in the design of these two markets is the supply and demand curves for market 2 are relatively flat while those for market 3 are steeper
15
16

17
An Experimental Study of Competitive Market Behavior - Smith (1962)
• The Walrasian hypothesis states that – the rate of increase in the exchange price is an
increasing function of the excess demand at that price
• Thus we would expect prices to converge to equilibrium much more quickly in market 2 compared to market 3
• Convergence to the equilibrium is quicker and much less erratic in market 2 than in market 3
18
An Experimental Study of Competitive Market Behavior - Smith (1962)
• In market 4 the supply curve is infinitely elastic (horizontal) with the same minimum acceptable price of $3.10 for each seller
• According to the Walrasian hypothesis this market should converge rapidly towards the equilibrium since there is considerable excess supply at prices slightly above the equilibrium
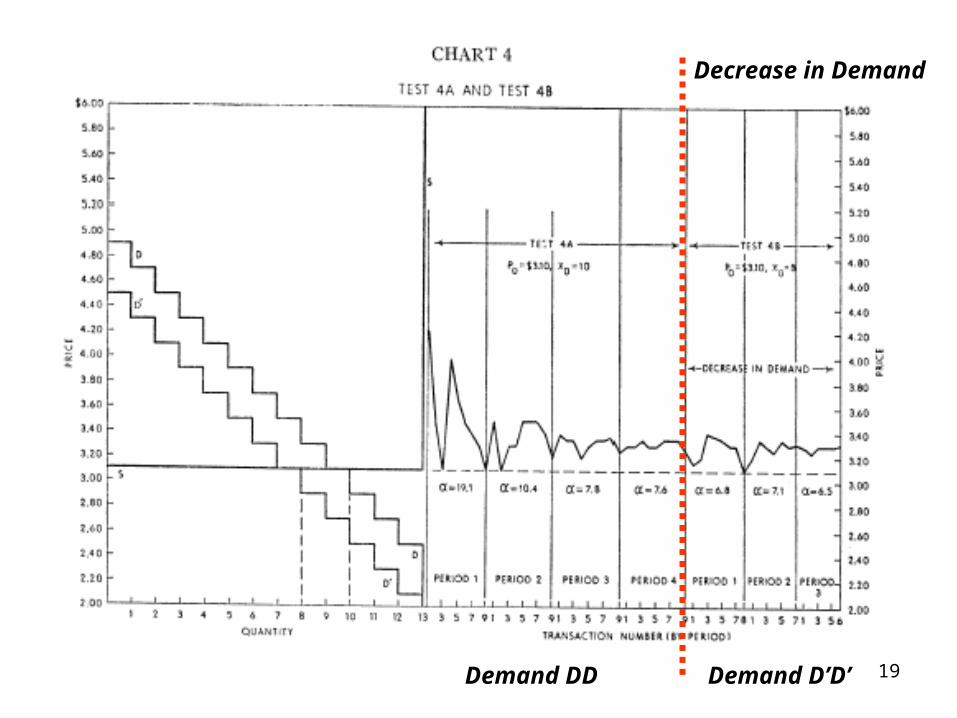
19Demand DD Demand D’D’
Decrease in Demand
20
An Experimental Study of Competitive Market Behavior - Smith (1962)
• However while the market does converge relatively quickly but it converges to a price that is above the equilibrium price
• Furthermore in market 4B which introduces a reduction in demand from DD to D’D’, we do not see any change in the equilibrium price

21
An Experimental Study of Competitive Market Behavior - Smith (1962)
• The prices approach the equilibrium from above since prices below the equilibrium is not an option in this market
• These results suggest that convergence to equilibrium may depend not only on the intersection of demand and supply schedules but also one their shapes
22
An Experimental Study of Competitive Market Behavior - Smith (1962)
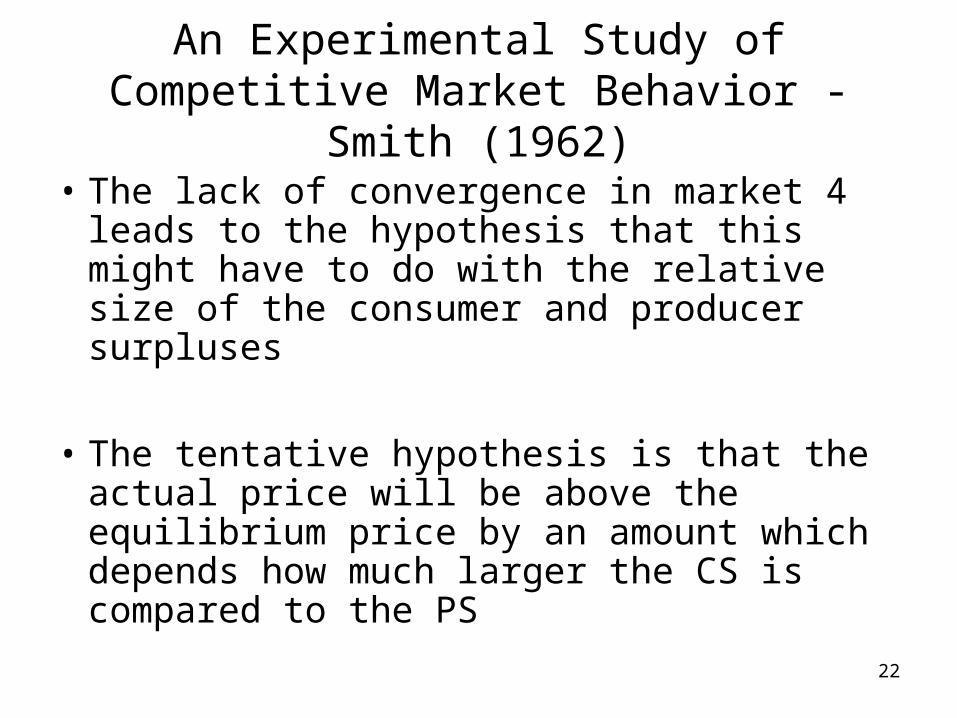
• The lack of convergence in market 4 leads to the hypothesis that this might have to do with the relative size of the consumer and producer surpluses
• The tentative hypothesis is that the actual price will be above the equilibrium price by an amount which depends how much larger the CS is compared to the PS

23
An Experimental Study of Competitive Market Behavior - Smith (1962)
• In market 3 CS > PS and while prices do converge they do so slowly and usually from above
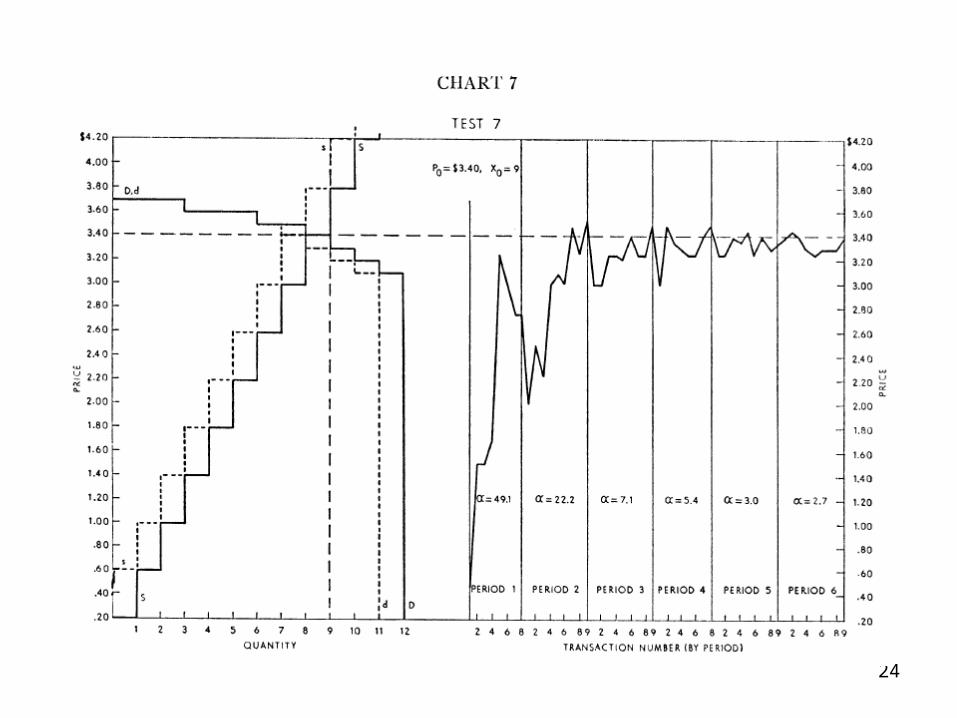
• Next we look at market 7 which does the reverse of what market 4 did
• Here producer surplus is much larger than consumer surplus
24
25
An Experimental Study of Competitive Market Behavior - Smith (1962)
• It is clear that convergence is slow and occurs from below
• Thus it appears clear that the relative magnitude of consumer and producer surpluses affects the speed of convergence to equilibrium

26
An Experimental Study of Competitive Market Behavior - Smith (1962)
• Market 5 looks at convergence when there are shifts in demand and supply
• Again prices seem to converge quickly following a shock

27Increase in demand and reduction in supply – higher eqlbm. P and Q
28
An Experimental Study of Competitive Market Behavior - Smith (1962)
• Market 6 looks at whether the presence of intra-marginal buyers and sellers near the equilibrium affect that equilibrium
• Here the demand curve falls continuously in one-unit steps while the supply curve becomes perfectly inelastic at a price of $4

29Reduction in demand after period 4

30
An Experimental Study of Competitive Market Behavior - Smith (1962)
• The tentative hypothesis is that the large rent enjoyed by the marginal seller with still larger rents for the intra-marginal sellers may affect convergence to equilibrium
• Again the conjecture regarding the effect of a divergence between consumer and producer surplus on the approach to equilibrium is confirmed

31
An Experimental Study of Competitive Market Behavior - Smith (1962)
• Convergence is slow and from below
• But the presence of intra-marginal sellers who enjoy large rents do not prevent convergence to equilibrium
• Convergence happens even with a downward shirt in the demand curve following period 4
32
An Experimental Study of Competitive Market Behavior - Smith (1962)
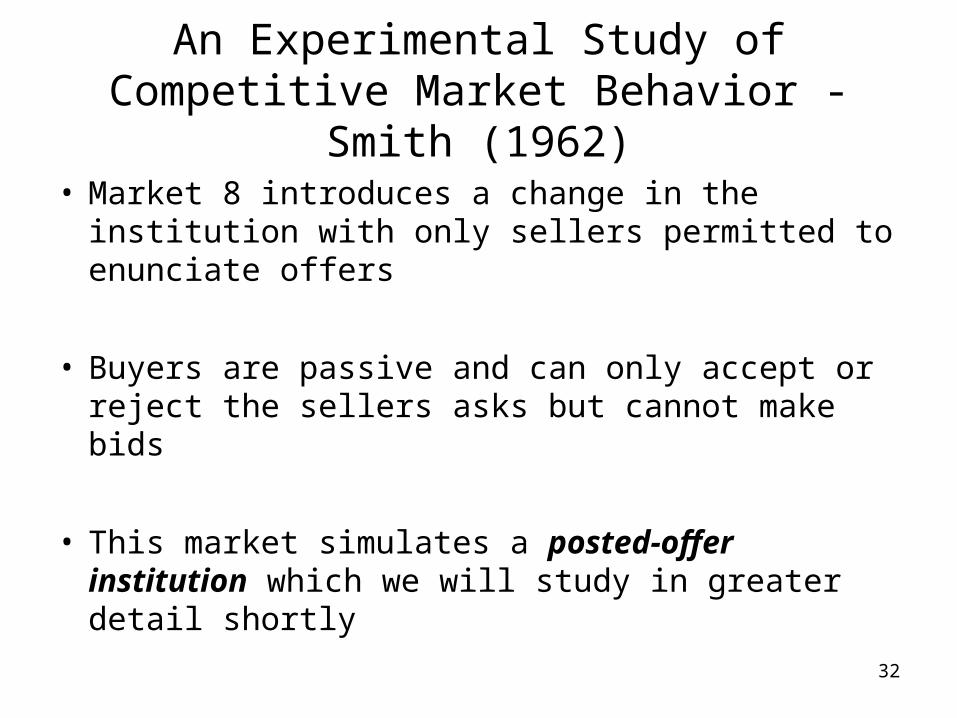
• Market 8 introduces a change in the institution with only sellers permitted to enunciate offers
• Buyers are passive and can only accept or reject the sellers asks but cannot make bids
• This market simulates a posted-offer institution which we will study in greater detail shortly

33Only sellers make offers
Both buyers and Sellers make offers
34
An Experimental Study of Competitive Market Behavior - Smith (1962)
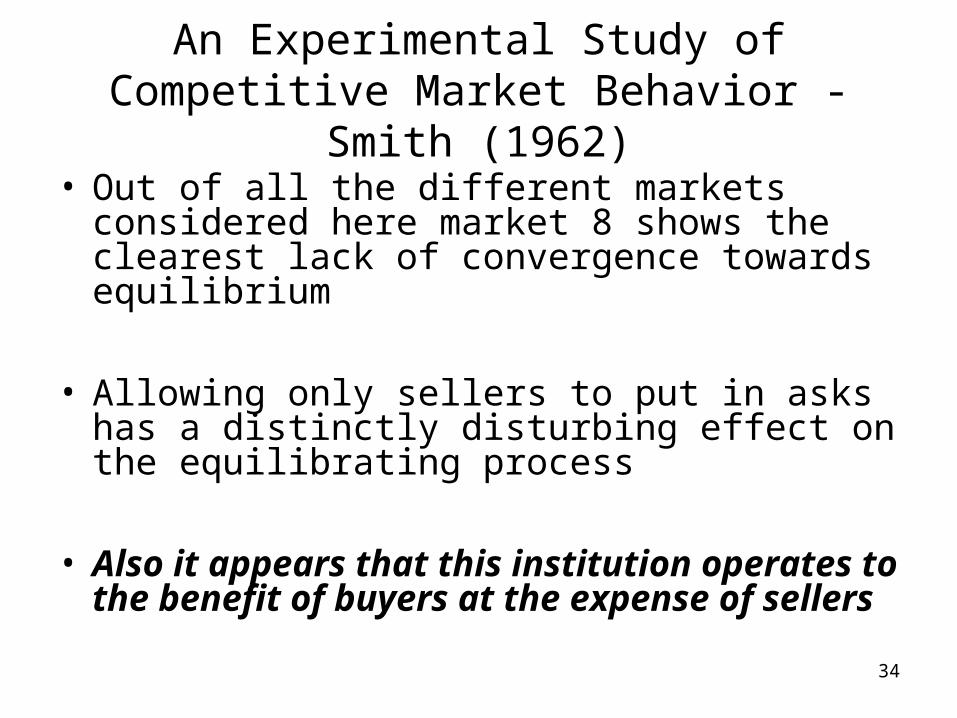
• Out of all the different markets considered here market 8 shows the clearest lack of convergence towards equilibrium
• Allowing only sellers to put in asks has a distinctly disturbing effect on the equilibrating process
• Also it appears that this institution operates to the benefit of buyers at the expense of sellers
35
An Experimental Study of Competitive Market Behavior - Smith (1962)
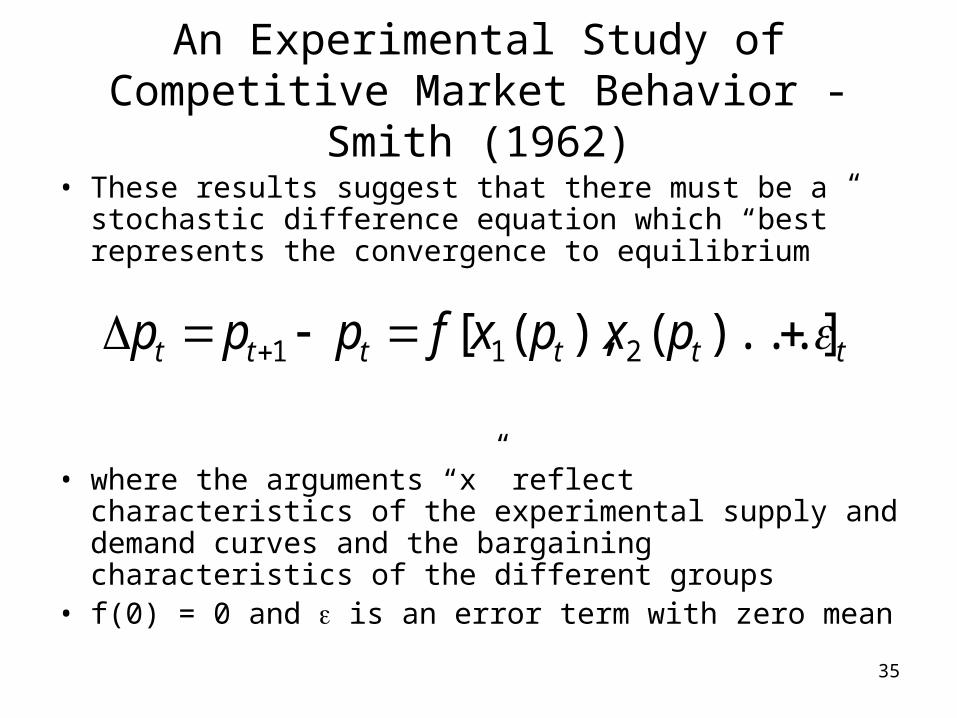
• These results suggest that there must be a stochastic difference equation which “best” represents the convergence to equilibrium
• where the arguments “x” reflect characteristics of the experimental supply and demand curves and the bargaining characteristics of the different groups
• f(0) = 0 and is an error term with zero mean
tttttt pxpxfppp )...](),([ 211
36
An Experimental Study of Competitive Market Behavior - Smith (1962)
• Four specific forms of this difference equation are studied
• These are – Walrasian– Excess rent– Modified Walrasian– Modified excess rent

37
An Experimental Study of Competitive Market Behavior - Smith (1962)
• Walrasian:
• where xit is the excess demand prevailing at price pt at which the t-th transaction occurred
tt xp 11101
38
An Experimental Study of Competitive Market Behavior - Smith (1962)
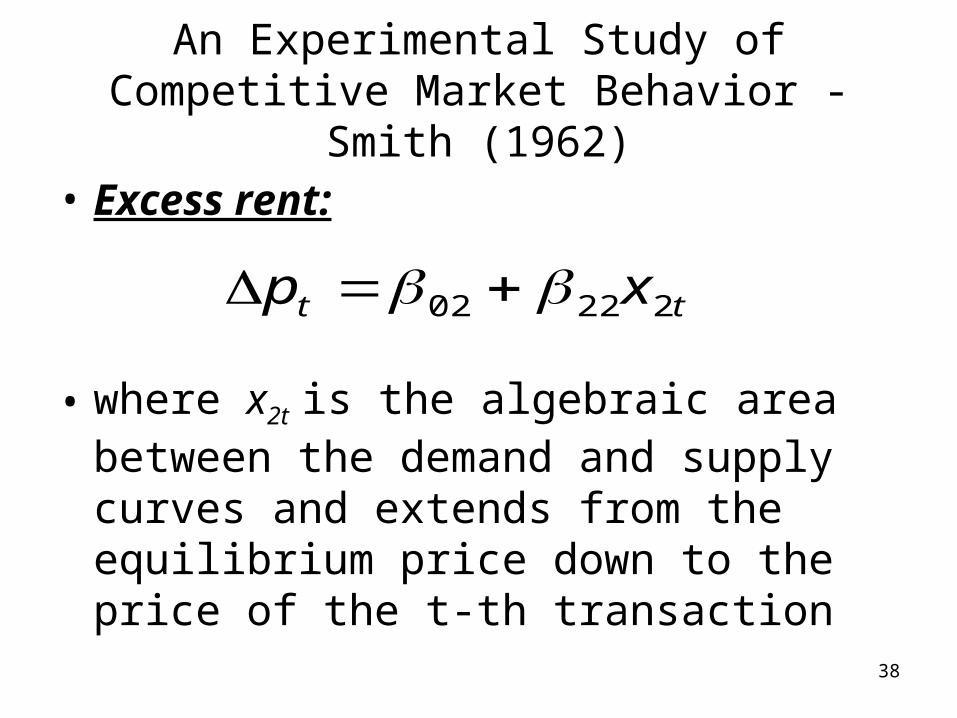
• Excess rent:
• where x2t is the algebraic area between the demand and supply curves and extends from the equilibrium price down to the price of the t-th transaction
tt xp 22202
39
An Experimental Study of Competitive Market Behavior - Smith (1962)

40
An Experimental Study of Competitive Market Behavior - Smith (1962)
• Modified Walrasian:
• where xit is the excess demand prevailing at price pt at which the t-th transaction occurred
• where x3t = A0t – B0
t, the algebraic difference
between the equilibrium consumer surplus and producer surplus
ttt xxp 33311303

41
An Experimental Study of Competitive Market Behavior - Smith (1962)
• Modified excess rent:
• where x2t is the algebraic area between the demand and supply curves and extends from the equilibrium price down to the price of the t-th transaction
• where x3t = A0t – B0
t, the algebraic difference between the
equilibrium consumer surplus and producer surplus
ttt xxp 33422404

42
An Experimental Study of Competitive Market Behavior - Smith (1962)
• Regression results provide support for both the Walrasian hypothesis as well as the excess rent hypothesis
• In discriminating between these two one can look at (1) their ability to predict zero price change in equilibrium and (2) the standard errors of those predictions
• By and large using a number of non-parametric tests the evidence favours the excess rent hypothesis
43
An Experimental Study of Competitive Market Behavior - Smith (1962)
• The excess rent hypothesis would seem to have some plausibility from the individual decision-making point of view
• Once a contract price has been struck, each trader compares that price to his reservation price – the difference being a “profit” or rent which is achievable
• And to present a degree of bargaining resistance in the auction process which is greater the smaller is this rent

44
An Experimental Study of Competitive Market Behavior - Smith (1962)
• Thus if equilibrium buyer’s rent exceeds seller’s rent, any early tendency for contract prices to remain above equilibrium (and balance the rents achieved on both sides) might be expected to break down as it becomes evident that the “paper” rents at those prices might be unattainable by all of the sellers
• This argument suggests that the propensity of sellers to reduce their offers when the price is above the equilibrium is related to their attempts to obtain some – even if it is a “small” amount - rent rather than to a direct influence of excess supply
45
CONCLUSIONS: An Experimental Study of Competitive Market Behavior - Smith (1962)
• Even where numbers are “small” there are strong tendencies for a supply and demand competitive equilibrium to be attained as long as there is no collusion and bids and asks are publicly announced
• Changes in the conditions of demand and supply cause changes in the volume of transactions per period and the price. These changes correspond reasonably well with the predictions of price theory

46
CONCLUSIONS: An Experimental Study of Competitive Market Behavior - Smith (1962)
• Markets where only sellers can make price quotations exhibit weaker equilibrating tendencies than markets where both buyers and sellers can make price quotations
• The excess rent hypothesis seems to be a better predictor of the mechanism of market adjustment rather than the Walrasian hypothesis which relates the adjustment process to the magnitude of excess demand/excess supply

47
Effect of Market Organization on Competitive Equilibrium – Smith (1964)
• Smith (1962) suggested that a “posted offer” market where only sellers can make price quotations and buyers can either accept or reject those quotations does not equilibrate as easily as markets where both buyers and sellers can make price quotations
• Smith (1964) looks at this in greater depth
48
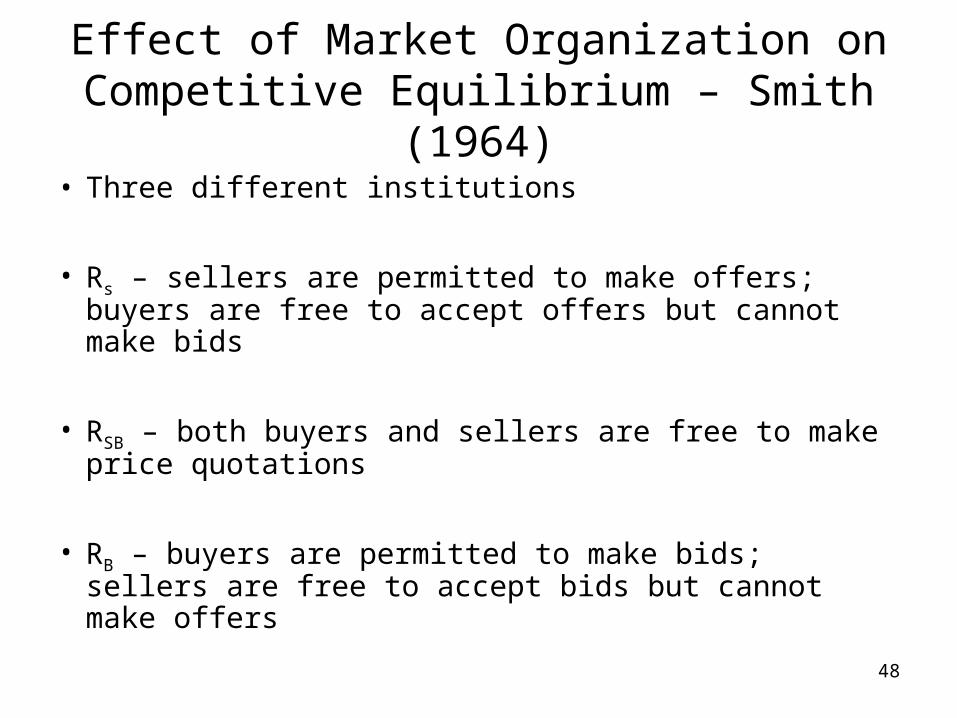
Effect of Market Organization on Competitive Equilibrium – Smith (1964)
• Three different institutions
• Rs – sellers are permitted to make offers; buyers are free to accept offers but cannot make bids
• RSB – both buyers and sellers are free to make price quotations
• RB – buyers are permitted to make bids; sellers are free to accept bids but cannot make offers

49
50

51
52

53
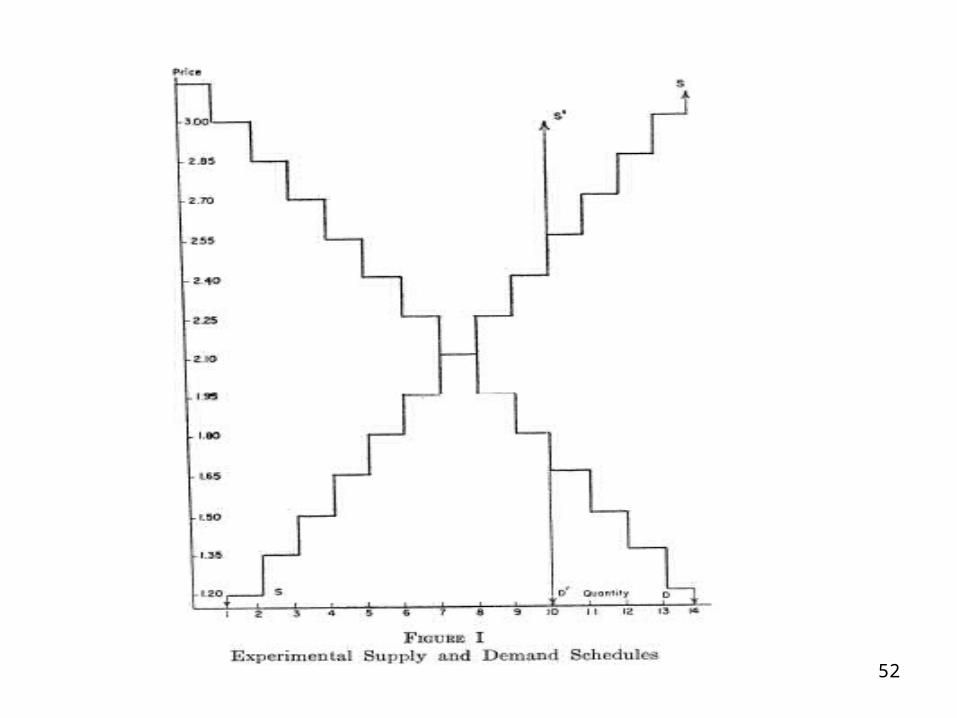
• In each session there are an equal number of buyers and sellers
• Given the underlying demand and supply curves the equilibrium consumer and producer surplus are equal

54

55

56

57
58

59
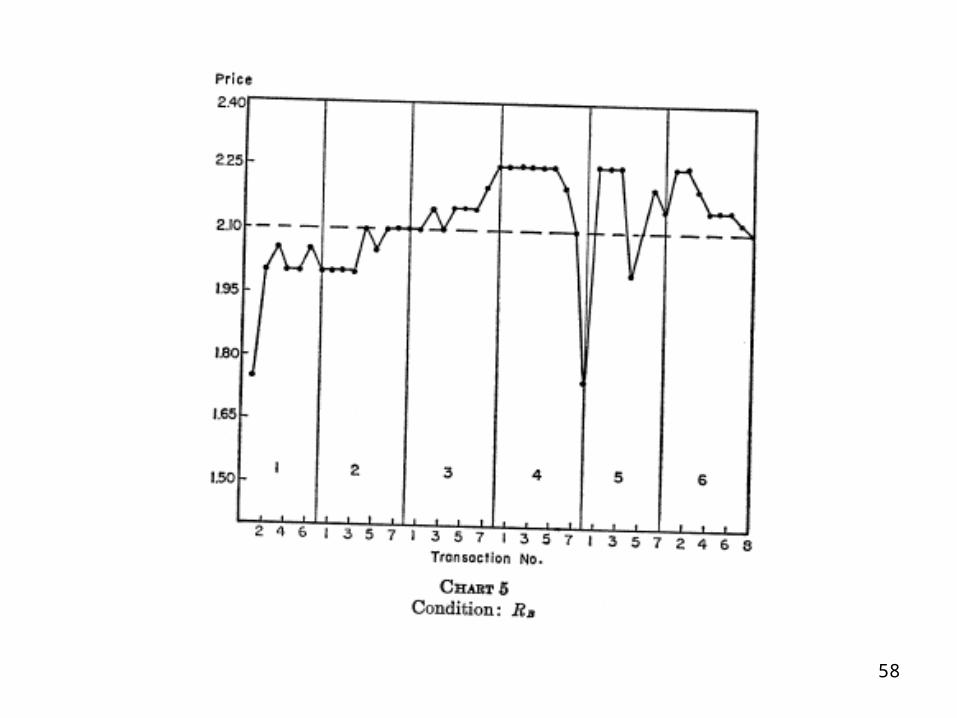
• No support for the hypothesis that the initial prices are the highest in Rs
• However the data upholds a general hypothesis that across all periods
PtS < Pt
SB < PtB
• That is the ordering relationship holds for all periods
60
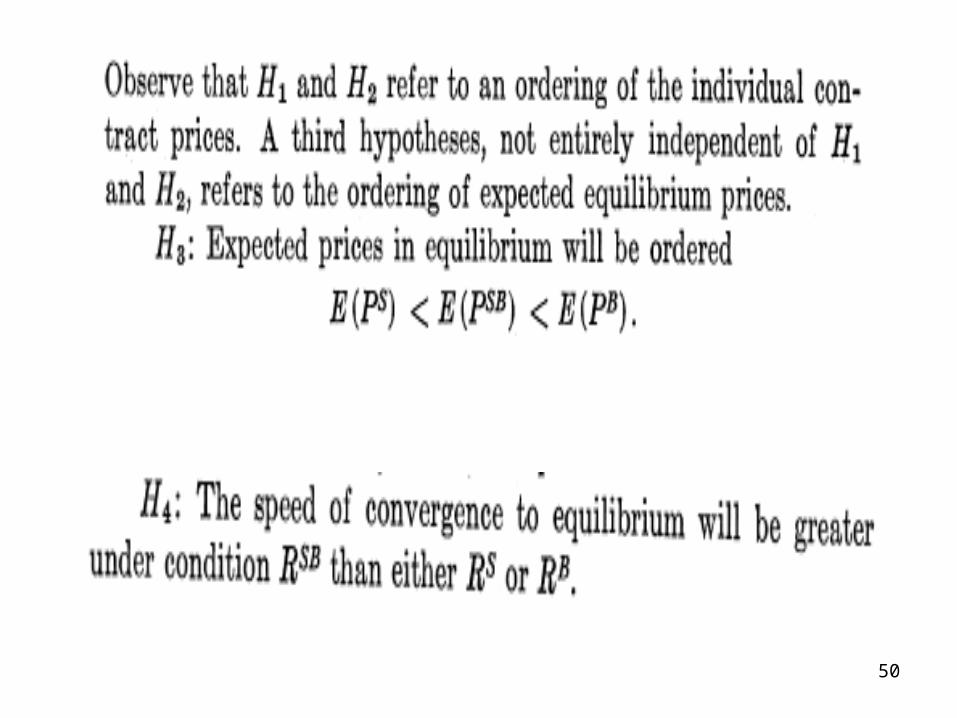
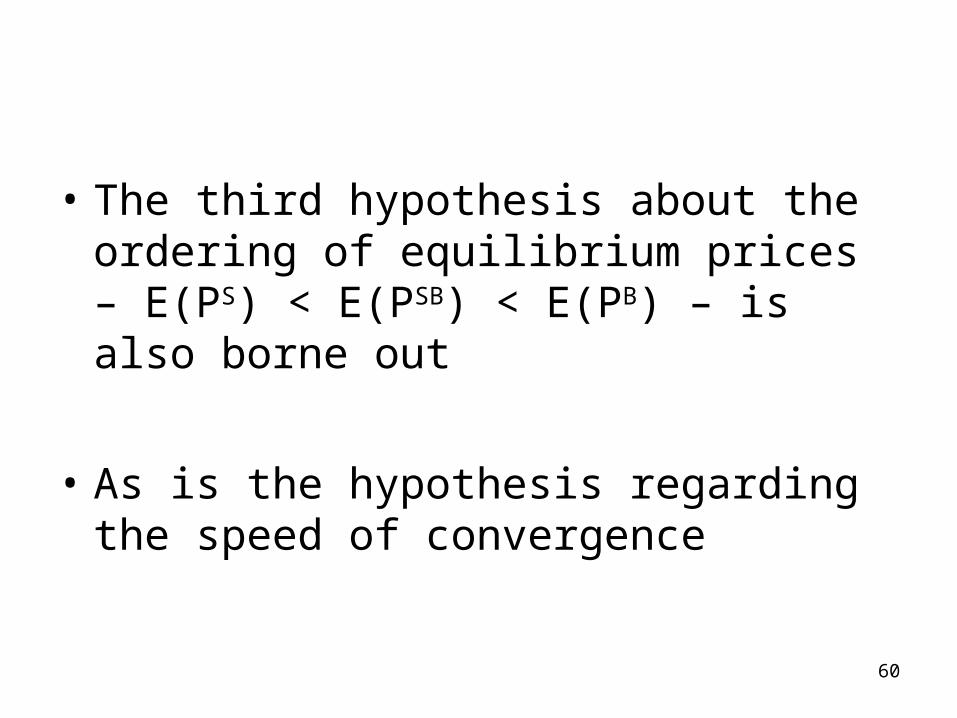
• The third hypothesis about the ordering of equilibrium prices – E(PS) < E(PSB) < E(PB) – is also borne out
• As is the hypothesis regarding the speed of convergence

61
Ketcham, Smith and Williams (1984)
• Compares performance of a “posted offer” institution compared to a “double auction”
• Previous research that we have looked at suggests that double auction markets exhibit two important characteristics
– Rapid convergence of prices to the competitive equilibrium
– Highly efficient allocations

62
Ketcham, Smith and Williams (1984)
• Subjects have up to 5 units to buy/sell in each period
• For each unit, the buyer (seller) has a marginal valuation (cost)
• These valuations/costs yield the aggregate market demand and supply curves
63
Ketcham, Smith and Williams (1984)
• The double auction incorporates – a “bid-ask spread reduction rule”– A “rank queue”
• Subjects earn 10 cent commission on each trade in Design 1 but not in Design 2– Provides an incentive to engage in trade at
low profit
64
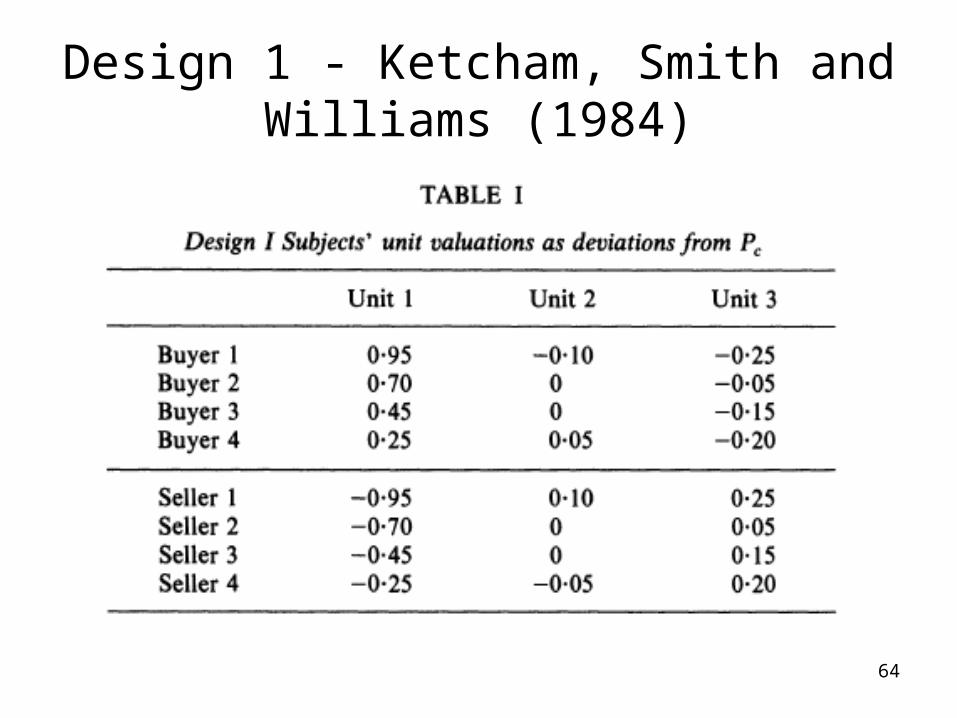
Design 1 - Ketcham, Smith and Williams (1984)
65
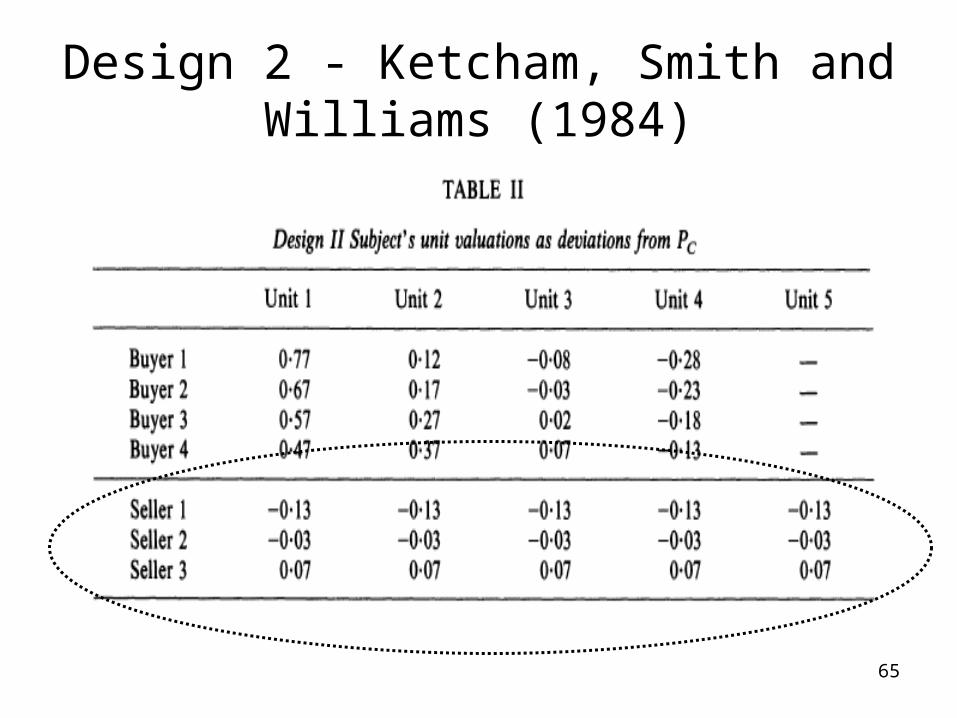
Design 2 - Ketcham, Smith and Williams (1984)

66

67
68
Ketcham, Smith and Williams (1984)
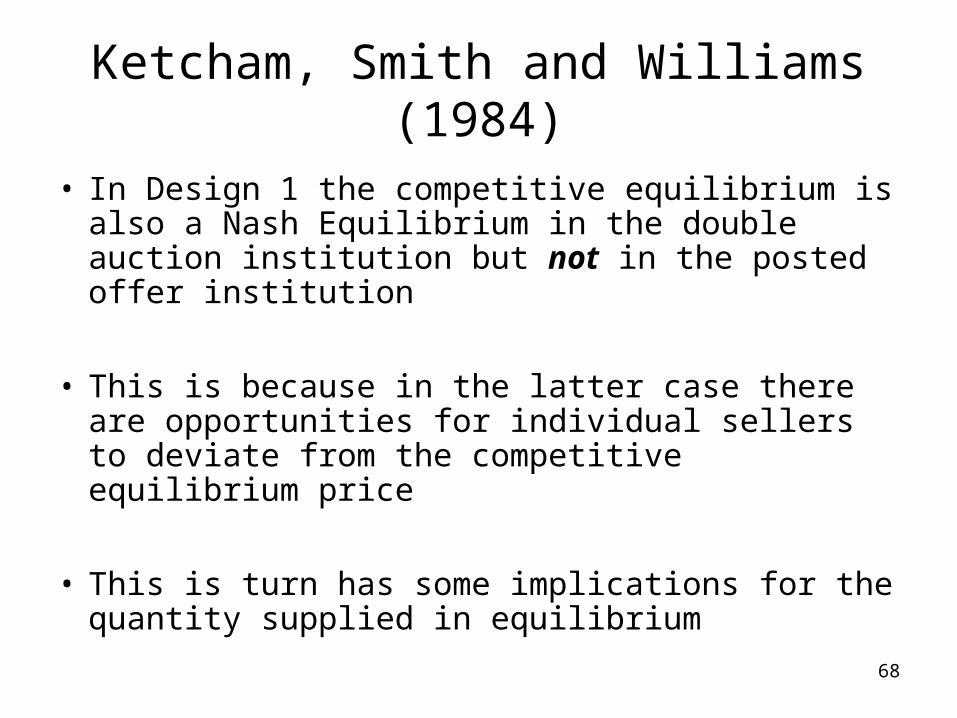
• In Design 1 the competitive equilibrium is also a Nash Equilibrium in the double auction institution but not in the posted offer institution
• This is because in the latter case there are opportunities for individual sellers to deviate from the competitive equilibrium price
• This is turn has some implications for the quantity supplied in equilibrium

69
Ketcham, Smith and Williams (1984)
• In Design 2, each seller has a constant cost and subjects do not get a commission
• The market structure in Design 2 is a variation of a triopoly wher the highest cost seller is cut out of the market above the CE price
70
Ketcham, Smith and Williams (1984)
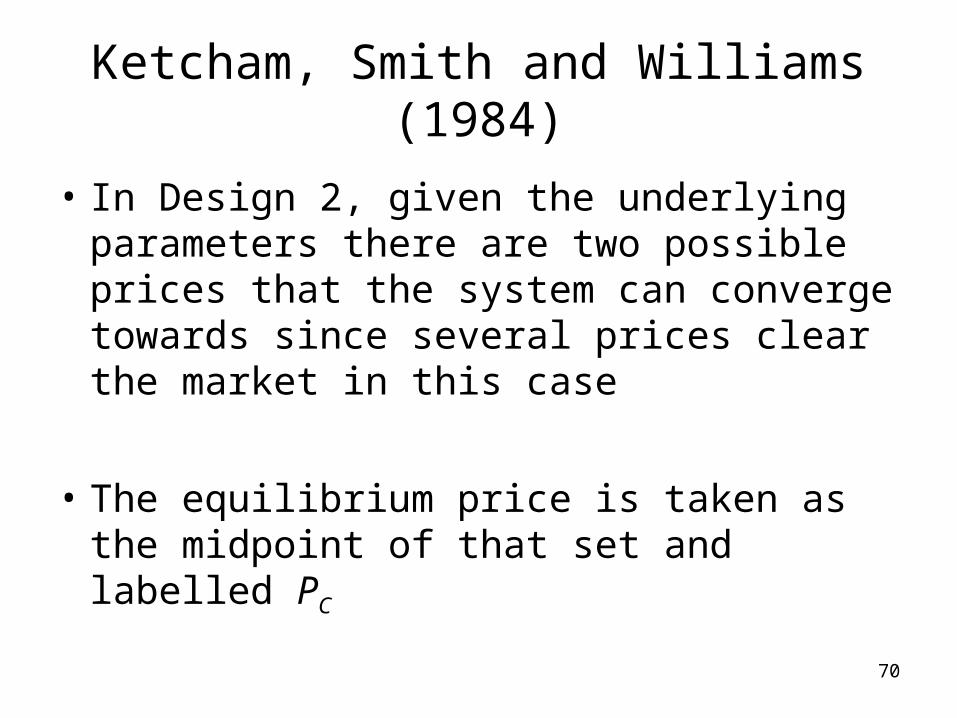
• In Design 2, given the underlying parameters there are two possible prices that the system can converge towards since several prices clear the market in this case
• The equilibrium price is taken as the midpoint of that set and labelled PC

71
Ketcham, Smith and Williams (1984)
• Alternatively the market might approach a “limit price” equilibrium where the highest cost seller is just excluded from the market
– This price is labelled PL
– With constant costs, this limit price will equal the unit cost of the highest cost seller
72
Ketcham, Smith and Williams (1984)

73
74
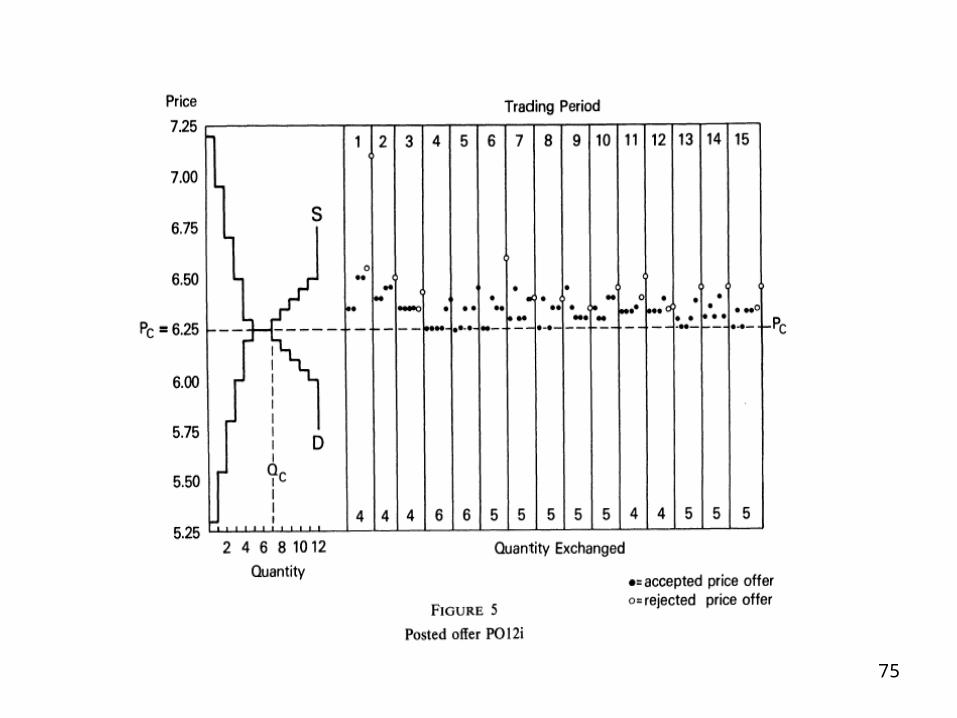
75

76

77
DoubleAuction
PostedOffer
78
Ketcham, Smith and Williams (1984)
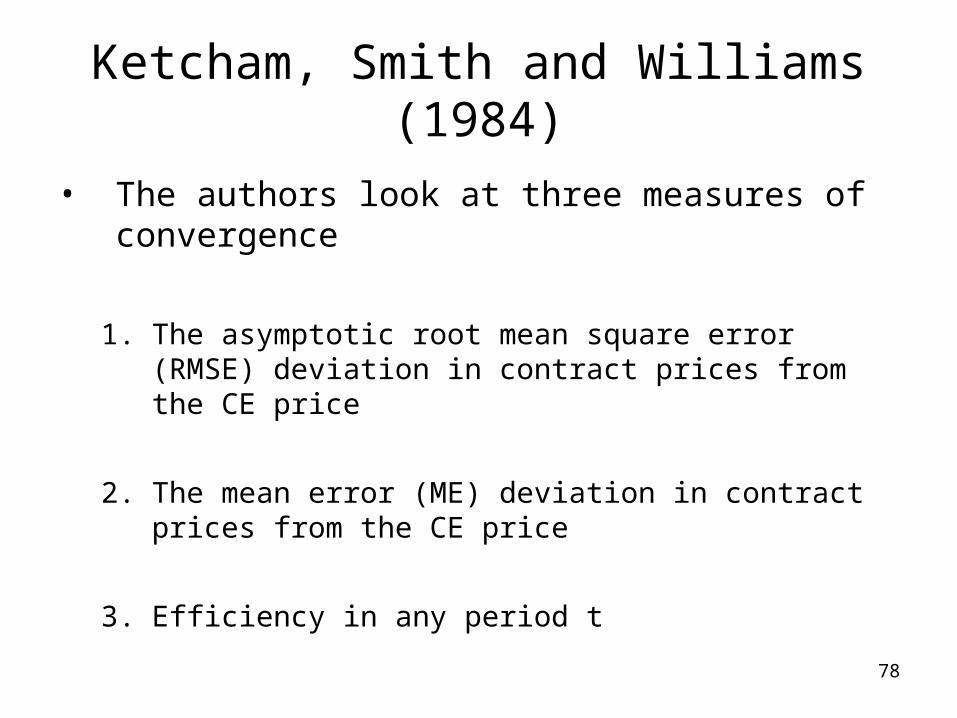
• The authors look at three measures of convergence
1. The asymptotic root mean square error (RMSE) deviation in contract prices from the CE price
2. The mean error (ME) deviation in contract prices from the CE price
3. Efficiency in any period t

79
RMSE
• Let r(t) be the RMSE of contract prices in period t i.e.
• Then the asymptotic RMSE is given by
•

80
Mean error deviation

81
Ketcham, Smith and Williams (1984)

82

83
Ketcham, Smith and Williams (1984)

84
P = 0 if DA, 1 if POD = 1 if Design 1, 2 if Design 2
85
Ketcham, Smith and Williams (1984)
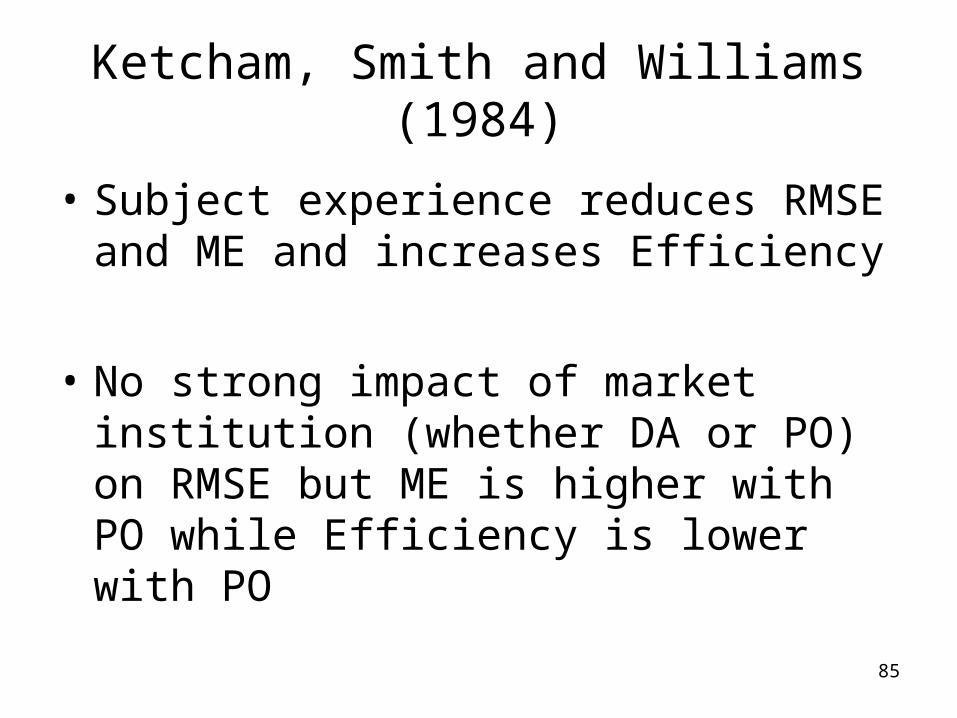
• Subject experience reduces RMSE and ME and increases Efficiency
• No strong impact of market institution (whether DA or PO) on RMSE but ME is higher with PO while Efficiency is lower with PO

86
Signalling and Tacit Collusion
• In DA the signalling opportunities are the same for buyers and sellers (if information is public)
• The opportunity cost of signalling is insignificant
• Consequently signalling occurs frequently but there is little evidence that this leads to collusive outcomes on either side of the market
87
Signalling and Tacit Collusion
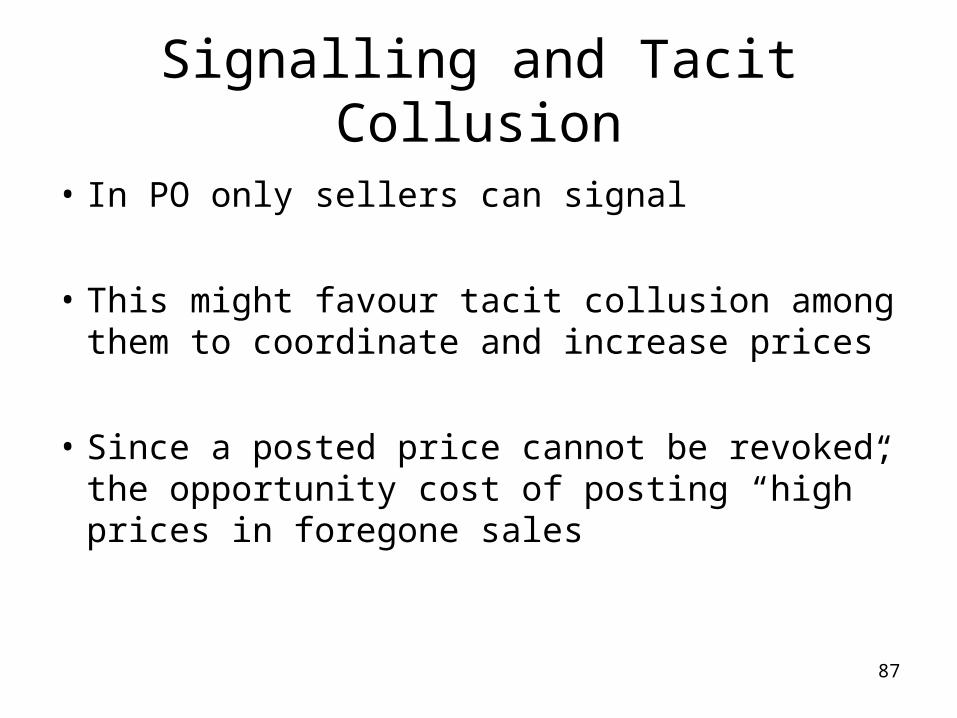
• In PO only sellers can signal
• This might favour tacit collusion among them to coordinate and increase prices
• Since a posted price cannot be revoked, the opportunity cost of posting “high” prices in foregone sales
88
Signalling and Tacit Collusion
• This reduces the incentive of the individual seller to signal and may promote “free riding” – each seller wants the others to signal
• Signalling is quite common in PO markets
• In Figure 5 note the repeated attempts by one or more sellers to signal a price increase with high unaccepted price offers

89
90
Ketcham, Smith and Williams (1984)
• In Design 2 the presence of a third seller with constant cost at PL increases the opportunity for tacit collusion
• If prices are at or below this price then this seller typically engages in price signalling by raising her posted offer
• By doing so this seller has nothing to lose
91
Ketcham, Smith and Williams (1984)
• Given that cost information is private the other two sellers do not know that this action is costless to the third seller
• This is shown in Figure 9 where the highest cost seller engaged in price signalling in period 10 – 12, 15 – 19, 21 – 23 and 25

92

93
Ketcham, Smith and Williams (1984)
• Findings suggest that prices tend to be higher and efficiency lower in PO markets compared to DA markets
• This institutional effects interact with other design parameters such as subject experience
• Subject experience increases both efficiency and speed of convergence towards the competitive price
• Price signalling and tacit collusion is common in the PO institution