1 environmental biological monitoring
TRANSCRIPT
1 Environmental biological monitoring
M E Conti
1 Introduction
The problem of environmental quality control is strictly related to the implemen-tation of adequate experimental methods for the assessment of the actual state ofhealth of ecosystems.
Ecotoxicology, as opposed to traditional toxicology, relates to a series ofeffects and responses to the contaminants of the ecosystem under study.Therefore, interpretation of the experimental data concerning the presence ofcontaminants in a given ecosystem requires data processing that is adequate tocomplex systems.
By effect we mean the kind of reaction shown by the ecosystem (not necessarilyof a toxic nature); by response we mean the quantification (e.g. the percentage) ofthe kind of effect. The effects on the organisms may concern the reproductivesystem, motility, growth rate, etc.
Ecosystems, that consist of a biotic and an abiotic compartment, may respondin very different ways, and the onset of toxicity phenomena, as is known, may notoccur until after some time.
However, we can assume that very low doses of contaminants do notgenerate negative effects on the organisms (biotic component). Everycontaminant has a threshold, though, beyond which detoxification phenomenaoccur: these are just defense mechanisms that organisms may develop in thepresence of these contaminants. Such mechanisms are often noticed in thedifferent branches of the phylogenetic tree of the various species. In thisrespect, one of the most studied mechanisms is the one concerning metalloth-ioneins (MTs) (proteins containing cysteine), which are able to link toxicmetals [1].
The expression “actual state of health” we used in the first paragraph ofthis chapter aims at stressing the necessity of an evolution of scientific knowl-edge in the field of ecotoxicology and more importantly the necessity ofemploying alternative methods of environmental quality evaluation. Thesemethods, such as biomonitoring, the use of biomarkers and biosensors in theenvironmental field, represent a sphere of important prospects of futuredevelopments.
WITPress_BMTA_ch001.qxd 11/26/2007 12:58 Page 1
www.witpress.com, ISSN 1755-8336 (on-line) WIT Transactions on State of the Art in Science and Engineering, Vol 30, © 2008 WIT Press
doi:10.2495/978-1-84564-002-6/01

2 Traditional monitoring and biomonitoring
Traditional monitoring methods, as valuable and unsurpassed as they are in thesphere of Environmental Chemistry, do have some shortcomings:
1. considerably high costs2. methodological problems3. problems with the release of contaminants on an intermittent basis4. effects on biological species5. numerous and extensive samplings
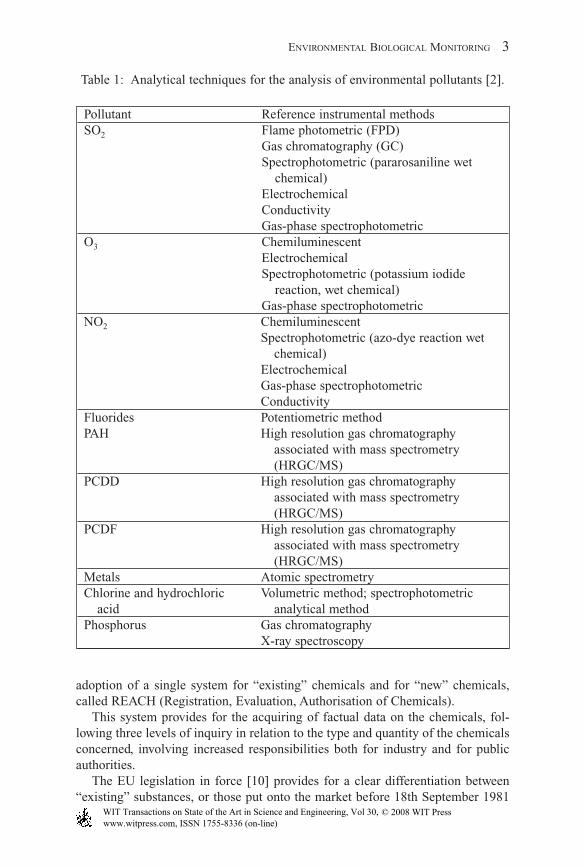
Table 1 reports traditional analytical techniques for the analysis of environmentalpollutants [2].
Biomonitoring has significant advantages over traditional analysis of abioticmatrices (water, sediments). Besides providing information on the bioavailabilityof contaminants, it simplifies the chemical analysis, eliminating the problem ofthe assessment of very low levels of contaminants; it prevents the risk of misin-terpretations caused by sudden fluctuations in the environmental parameters atthe time of sampling; thus, providing a measurement over time of the level ofenvironmental contamination; it does not require numerous, extensive, andprolonged samplings in the areas under study. All the above goes to show theimportance of biomonitoring as a means to control environmental quality.
The use of cosmopolite organisms to assess pollution has developed notablyduring the last few decades. Such organisms assume environmental contaminantsand may be used as indicators of the bioavailability of a given contaminant overtime, allowing – in certain cases – comparison between contamination levels ingeographically different areas [2].
It is in this context the Organisation for Economic Co-operation andDevelopment (OECD) countries have taken many initiatives for examiningpotentially dangerous products by proposing general programs for the monitoringand evaluation of environmental impact [2–7].
From an ecotoxicological perspective, we can consider as contaminants orproducers of environmental stress, all chemical compounds that are fundamentallyreleased into the environment as a result of human activities, and which causedamage to living organisms [2, 8].
3 European Union legislative framework on chemicals [9]
The chemicals that can be released into the environment are more than 100,000.There is a considerable lack of knowledge regarding most of them. It is in this con-text and framework that the enactment of an important document of the EuropeanCommission, the White Paper – Strategy for a future Chemicals Policy [9] is situated.
To cope with the obvious inadequacy of the knowledge relating to the envi-ronmental and toxicological properties of many of the chemicals present on theEuropean market, the strategy proposed by the White Paper provides for the
2 BIOLOGICAL MONITORING: THEORY & APPLICATIONS
WITPress_BMTA_ch001.qxd 11/26/2007 12:58 Page 2
www.witpress.com, ISSN 1755-8336 (on-line) WIT Transactions on State of the Art in Science and Engineering, Vol 30, © 2008 WIT Press
adoption of a single system for “existing” chemicals and for “new” chemicals,called REACH (Registration, Evaluation, Authorisation of Chemicals).
This system provides for the acquiring of factual data on the chemicals, fol-lowing three levels of inquiry in relation to the type and quantity of the chemicalsconcerned, involving increased responsibilities both for industry and for publicauthorities.
The EU legislation in force [10] provides for a clear differentiation between“existing” substances, or those put onto the market before 18th September 1981
ENVIRONMENTAL BIOLOGICAL MONITORING 3
Table 1: Analytical techniques for the analysis of environmental pollutants [2].
Pollutant Reference instrumental methodsSO2 Flame photometric (FPD)
Gas chromatography (GC)Spectrophotometric (pararosaniline wet
chemical)ElectrochemicalConductivityGas-phase spectrophotometric
O3 ChemiluminescentElectrochemicalSpectrophotometric (potassium iodide
reaction, wet chemical)Gas-phase spectrophotometric
NO2 ChemiluminescentSpectrophotometric (azo-dye reaction wet
chemical)ElectrochemicalGas-phase spectrophotometricConductivity
Fluorides Potentiometric methodPAH High resolution gas chromatography
associated with mass spectrometry (HRGC/MS)
PCDD High resolution gas chromatography associated with mass spectrometry(HRGC/MS)
PCDF High resolution gas chromatography associated with mass spectrometry(HRGC/MS)
Metals Atomic spectrometryChlorine and hydrochloric Volumetric method; spectrophotometric
acid analytical methodPhosphorus Gas chromatography
X-ray spectroscopy
WITPress_BMTA_ch001.qxd 11/26/2007 12:58 Page 3
www.witpress.com, ISSN 1755-8336 (on-line) WIT Transactions on State of the Art in Science and Engineering, Vol 30, © 2008 WIT Press

and “new” ones put on the market subsequently. The latter (around 2,900) havehad to pass a health and environmental risk assessment, based on the results ofexperimental tests supplied by the manufacturing companies.
The system of notifying “new” substances involves the obligation on the partof manufacturing or importing companies to present to the relevant nationalauthorities a number of detailed items of information about the physico-chemical,toxicological, and environmental properties of the substances – informationwhich has been specified in detail in the various directives that have several timesmodified the EEC/67/548 directive [11].
For the other substances, which were already on the market before 18thSeptember 1981 – the 100,106 substances defined as “existing” and listed in theEuropean Inventory of Existing Commercial Chemical Substances – the availableinformation is, by contrast, still scarce if not actually non-existent. They represent99% of the volume of the substances marketed (these are 100,106 substances, com-prising industrial chemicals, substances obtained from metals, minerals, and otherproducts present in nature such as petroleum, substances derived from animals andplants, food additives, active substances of pesticides, fertilisers, medicines and cos-metics, natural monomers and polymers, and some waste products or by-products).
Of these 100 thousand substances, according to data supplied by the industry,around 2,500 chemicals with a high volume of production (over 1,000 tons/year),15,000–20,000 chemicals with a “low” volume of production (between 10 and1,000 tons/year) and almost 80,000 chemicals in quantities lower than 10 tons/year are manufactured or imported on the European market.
The chemicals manufactured or imported in the EU in quantities above one ton/year (including those with a high volume of production) amount overall to around30,000 and for only about a hundred of these – those considered “priority” accord-ing to the regulation (EEC) no. 793/93 – is a risk assessment program provided,involving manufacturers, national authorities, and the European commission.
The White Paper presented by the European Commission starts thereforefrom the observation that some tens of thousands of chemical substances aremanufactured or imported on the European market, for which we do not yetknow the toxicological and environmental properties.
The slowness of the assessment program for the “priority substances,” atpresent under way, was criticized both in the White Paper and in the reportwhich the Commission presented at the end of 1998 [12]; from this document, itemerges that only 19 assessment reports were completed by the end of 1998 outof over 100 substances indicated as priority and that the time needed from whena chemical is inserted in a priority list to the completion of the report on theconclusions of the assessment varies on average from two to four years.
If this slowness is due in part to the complexity of the examination required, aswell as to the meagerness of the resources devoted to assessment activities, it isalso true that the subdivision of responsibilities between manufacturing compa-nies and national authorities does not facilitate the speeding-up of the program.
While in the case of “new” chemicals, industry has everything to gain from coop-erating with national authorities, supplying all the necessary data so that the prod-ucts may be assessed and marketed as quickly as possible, in the case of “existing”
4 BIOLOGICAL MONITORING: THEORY & APPLICATIONS
WITPress_BMTA_ch001.qxd 11/26/2007 12:58 Page 4
www.witpress.com, ISSN 1755-8336 (on-line) WIT Transactions on State of the Art in Science and Engineering, Vol 30, © 2008 WIT Press
chemicals that are already on sale, the onus of proof falls de facto on the public author-ities with no specific obligations for companies about the data to be supplied in orderto allow an appropriate risk assessment. Proving an “unacceptable” risk for humanhealth and for the environment therefore rests entirely with the public authorities.
The EU is in the process of making the most fundamental changes to its legis-lation on the management of chemicals for over 30 years. Final political agreementwas reached at the Environment Council on 18th December 2006 after a severeperiod of negotiations between the key stakeholders (the European Union, MemberStates, the European Parliament, and in particular the Chair of its EnvironmentCommittee, Directorates-General, Environment and Enterprise of the EuropeanCommission, and others (i.e. industry, non-governmental organizations).
The final REACH text (more than 800 pages) was published in the OfficialJournal of the European Union on 30 December 2006 and can be found at:http://europa.eu.int/eur-lex/lex/JOHtml.do?uri=OJ:L:2006:396:SOM:EN:HTMLREACH entered into force on 1 June 2007; it now replaces over 40 existingDirectives and Regulations.
Another important issue is the one concerning the discussion of the problemsinherent in assessing the environmental risk of persistent organic pollutants (POPs),which was the subject of a recent international convention in the United NationsEnvironment Programme (UNEP) (Stockholm Convention on POPs, 2001) [13].
3.1 Categories of contaminants
The compounds released into the environment as a consequence of human activi-ties can be classified in two main categories: biodegradable substances andconservative substances [14].
Biodegradable substances represent the larger volume of human-generatedwastes (domestic wastes, industrial wastes, etc.) and, depending on their origin,they are disposed of in the air, the soil, or water. They consist of organic material(rich in C, N, and P) liable to bacterial degradation through oxidative processesthat reduce these organic compounds to soluble inorganic compounds (CO2, H2O,and H3N). If the release of these compounds is very high, anaerobic activityoccurs, with ensuing origination of degradation products (H2S, HN, H4C) thatnot only give off unpleasant smells, but are also toxic for many organisms.
Generally, uncontrolled release of biodegradable waste products, especiallyinto water bodies, causes eutrophication phenomena and subsequently a decreasein the quantity of oxygen present in the medium in question; it can also bringabout the production of toxic degradation compounds.
Conservative substances are not decomposed by bacteria or other short-termprocesses. These substances are typically very reactive toward plants and animals,sometimes causing considerable damages. There are three main categories:
1. heavy metals (Pb, Cd, Hg, Cr, Cu, Zn …);2. halogenated hydrocarbons (HHC), dichlorodiphenyltrichloroethane (DDT),
and polychlorinated biphenyls (PCBs);3. radioactive compounds.
ENVIRONMENTAL BIOLOGICAL MONITORING 5
WITPress_BMTA_ch001.qxd 11/26/2007 12:58 Page 5
www.witpress.com, ISSN 1755-8336 (on-line) WIT Transactions on State of the Art in Science and Engineering, Vol 30, © 2008 WIT Press
The components of these categories can be regulated by animals and plants tohighly variable degrees, depending on the species, but always in an interval commonto all species.
Halogenated compounds and metals are not eliminated; they accumulate overtime in the tissues of the organism concerned and stay there permanently.
For instance, in aquatic systems, those organisms that are predators of bioac-cumulators may have a diet rich in these conservative substances, which some-times causes very high concentration levels of these compounds. Hence, therearises an exposure risk for trophically superior organisms (among which man)with subsequent problems concerning the release of these substances into the foodchain [15].
4 Kinds of biomonitoring [2]
In general, bioindicators are organisms that can be used mostly for the identi-fication and qualitative determination of human-generated environmentalfactors [15–17], while biomonitors are organisms mostly used for the quantita-tive determination of contaminants and can be classified as being sensitive oraccumulative.
Sensitive biomonitors may be of the optical type and are used as integrators ofthe stress caused by contaminants, and as preventive alarm systems. They arebased upon such optical effects as morphological changes in abundance behaviorrelated to the environment or upon such chemical and physical aspects as alter-ation in the activity of different enzyme systems as well as in photosynthetic orrespiratory activities.
Accumulative bioindicators have the ability to store contaminants in theirtissues and are used for the integrated measurement of the concentration of suchcontaminants in the environment. Bioaccumulation is the result of the equilibriumprocess of biota compound intake/discharge from and into the surrounding envi-ronment. Bioaccumulation is the enrichment of a substance in the organismsthrough every pathway (respiration, food, dermal exposure).
The first studies of bioindicators date back to the 1960s. Beginning with thetheoretical calculations of Stöcker [18] and Phillips [19, 20], we can define themain characteristics of a bioaccumulator.
Bioaccumulators must [2]:
• accumulate the pollutant without, however, being killed by the levels withwhich it comes into contact;
• have a wide geographical distribution;• be abundant, sedentary, or of scarce mobility, as well as being representative of
the collection area;• be available all year round and allow for the collection of sufficient tissues for
analysis;• be easy to collect and resistant to laboratory conditions, as well as being usable
in laboratory studies of contaminant absorption, if necessary;
6 BIOLOGICAL MONITORING: THEORY & APPLICATIONS
WITPress_BMTA_ch001.qxd 11/26/2007 12:58 Page 6
www.witpress.com, ISSN 1755-8336 (on-line) WIT Transactions on State of the Art in Science and Engineering, Vol 30, © 2008 WIT Press

• have a high concentration factor (CF) for the contaminant under study, and thusallow direct analysis with no prior increase in concentration;
• have a simple correlation between the quantity of contaminant contained in theorganism and the average contaminant concentration in the surrounding envi-ronment;
• have the same contaminant content level correlation with the surroundingenvironment in every site studied and under any condition. This must be truefor all organisms examined.
5 Reference levels, concentration factor,and biomagnification
An ecosystem must be understood as an entity that is relatively stable over timeand having functional autonomy where there is an energy flow between organismsbelonging to a complex trophic network.
The interactions that may occur among organisms are numerous and thereforealso complex ones. When performing biomonitoring and traditional monitoringprograms it is very important to consider these factors. Slobodkin [21] distin-guished three different kinds of interaction among organisms:
1. Alterations of an indirect type that is when an organism alters the physicalenvironment of another organism. For instance, the trees in a wood castshadows and therefore reduce the photosynthetic activity of the surroundingplants;
2. Alterations (of an indirect type) of the physico-chemical environment, such asthe increase in oxygen concentration, as a result of photosynthesis, in lakeecosystems on the part of unicellular algae. This oxygen is available for therespiratory activity of other organisms;
3. Exchange of chemical compounds, elements, or energy among organisms;many wild animals, for instance, constitute the food of both big and smallpredators, while the seeds of many plants provide several species of birds andmammals with energy, proteins, and vitamins (alterations of a direct type).
So, biomonitoring can be considered alongside traditional monitoring as it allowsenvironmental quality assessment over wide geographical areas and an integratedmeasurement over time of the presence of contaminants.
For a variety of reasons, it is of fundamental importance to define the refer-ence levels for pollutants in an ecosystem when making biological monitoringstudies to:
1. evaluate the state of conservation or degradation;2. predict the incidence of possible future human activities in order to establish
the necessary interventions;3. control evolution over time, using monitoring programs, if necessary.
ENVIRONMENTAL BIOLOGICAL MONITORING 7
WITPress_BMTA_ch001.qxd 11/26/2007 12:58 Page 7
www.witpress.com, ISSN 1755-8336 (on-line) WIT Transactions on State of the Art in Science and Engineering, Vol 30, © 2008 WIT Press
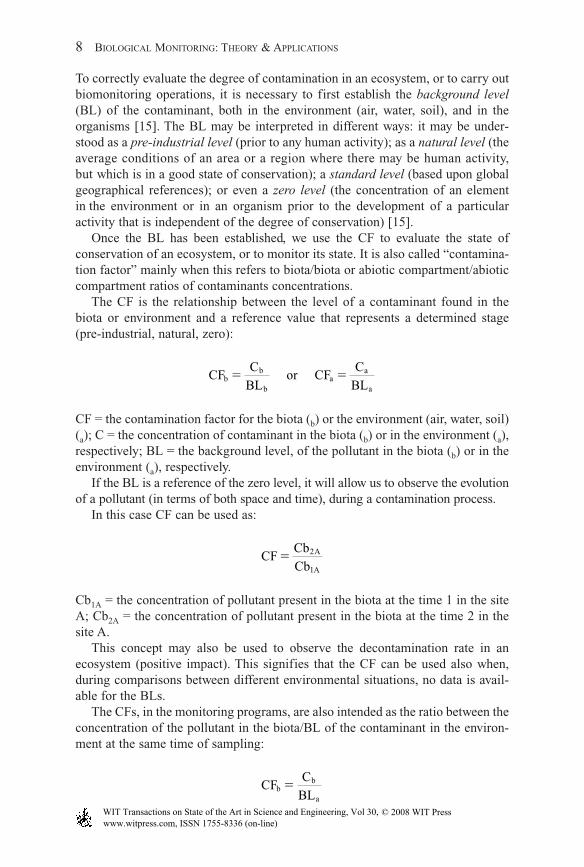
To correctly evaluate the degree of contamination in an ecosystem, or to carry outbiomonitoring operations, it is necessary to first establish the background level(BL) of the contaminant, both in the environment (air, water, soil), and in theorganisms [15]. The BL may be interpreted in different ways: it may be under-stood as a pre-industrial level (prior to any human activity); as a natural level (theaverage conditions of an area or a region where there may be human activity,but which is in a good state of conservation); a standard level (based upon globalgeographical references); or even a zero level (the concentration of an elementin the environment or in an organism prior to the development of a particularactivity that is independent of the degree of conservation) [15].
Once the BL has been established, we use the CF to evaluate the state ofconservation of an ecosystem, or to monitor its state. It is also called “contamina-tion factor” mainly when this refers to biota/biota or abiotic compartment/abioticcompartment ratios of contaminants concentrations.
The CF is the relationship between the level of a contaminant found in thebiota or environment and a reference value that represents a determined stage(pre-industrial, natural, zero):
CF = the contamination factor for the biota (b) or the environment (air, water, soil)(a); C = the concentration of contaminant in the biota (b) or in the environment (a),respectively; BL = the background level, of the pollutant in the biota (b) or in theenvironment (a), respectively.
If the BL is a reference of the zero level, it will allow us to observe the evolutionof a pollutant (in terms of both space and time), during a contamination process.
In this case CF can be used as:
Cb1A = the concentration of pollutant present in the biota at the time 1 in the siteA; Cb2A = the concentration of pollutant present in the biota at the time 2 in thesite A.
This concept may also be used to observe the decontamination rate in anecosystem (positive impact). This signifies that the CF can be used also when,during comparisons between different environmental situations, no data is avail-able for the BLs.
The CFs, in the monitoring programs, are also intended as the ratio between theconcentration of the pollutant in the biota/BL of the contaminant in the environ-ment at the same time of sampling:
CFC
BLb
b
a
�
CFCb
CbA
A
� 2
1
CFC
BLor CF
C
BLb
b
ba
a
a
� �
8 BIOLOGICAL MONITORING: THEORY & APPLICATIONS
WITPress_BMTA_ch001.qxd 11/26/2007 12:58 Page 8
www.witpress.com, ISSN 1755-8336 (on-line) WIT Transactions on State of the Art in Science and Engineering, Vol 30, © 2008 WIT Press

For example, the Pb concentration measured in a mollusc tissue vs. the Pbconcentration in the seawater soluble fraction. This reflects the concentration capa-bilities of the biomonitor with respect to the surrounding environment. It is gener-ally correlated with the bioavailable fraction of the contaminant in the environment.
The system for environmental classification is realised by starting with the CFsobtained for each contaminant present in the environment or organisms. Whenevaluating the CFs obtained, it is also necessary to take into account the uncer-tainties that derive from the following: sampling; space, and time variations forthe samples; the age and condition of the organisms, etc. In general, a CF that isabove a given number (generally 1.5, 2, or 3 times the BL), is taken to be the min-imum level under which it is no longer possible to refer to certain contamination.The qualification of a contamination situation may follow a linear scale, or, inhigh-level pollution conditions, a scale of the exponential type. Of course, the CFof each contaminant varies according to the species.
It is generally assumed that the release of the compound during the time unit isproportional to its concentration in the tissues. In these conditions, the higherthe absorption constant of the contaminant and the lower the release constant,the higher the CF will be: the CF is the result of the processes of intake/dischargeof the contaminant on the organism tissues. When using the CF as an indicatorfor the assessment of the quality of an ecosystem, we must take into account thepossibility of self-regulation phenomena (detoxification) on the organism tissueswhich might alter the CF values.
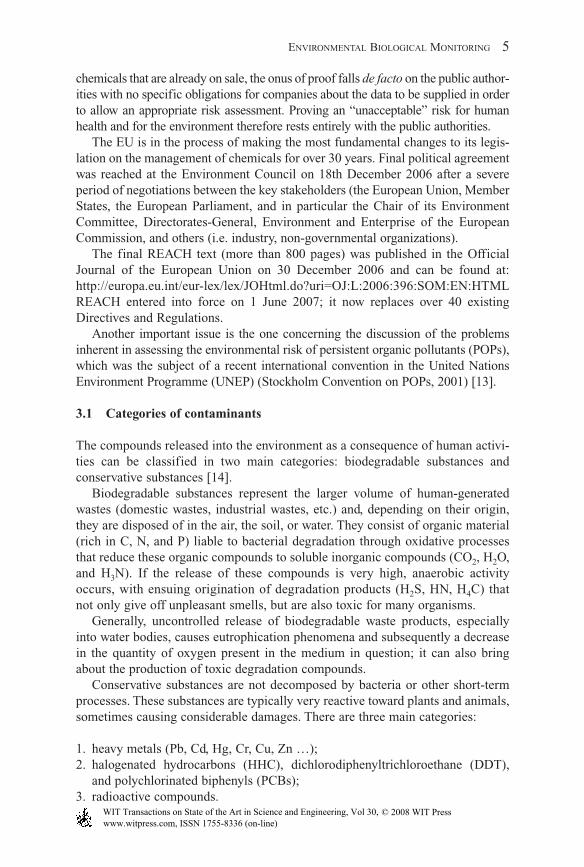
The accumulation efficiency of an organism can be measured performingaccumulation kinetics experiments, by keeping the contaminant concentrationin water or air steady at levels that are not harmful to the organism itself, so as todetermine the accumulation (or the mass growth) of the organism in terms of time(saturation curve). A contaminant can enter an organism through respiration(reversible process) or through food. Fig. 1 shows a general outline of the bioac-cumulation phenomena.
ENVIRONMENTAL BIOLOGICAL MONITORING 9
respiration
gill,leaf,
breathingsurface fluids
accumulation
gastro– intestinal tract
food
other ways
metabolism
excretion
Figure 1: The outline of bioaccumulation phenomenon.
WITPress_BMTA_ch001.qxd 11/26/2007 12:58 Page 9
www.witpress.com, ISSN 1755-8336 (on-line) WIT Transactions on State of the Art in Science and Engineering, Vol 30, © 2008 WIT Press
Bioaccumulation is thus understood as the intake of a contaminant through allpossible pathways. Bioconcentration, on the other hand, is the direct intake of acontaminant exclusively through respiration.
The concentration of a number of compounds (as for instance mercury) accu-mulates every time it passes through the food chain. This phenomenon is knownas biomagnification or concentrations along food chains.
However, biomagnification is a relatively rare phenomenon. One shoulddemonstrate that the food pathway for the intake of a contaminant is clearlypredominant over the others (especially respiration). Moreover, the accumulationof contaminant should increase with the passage from prey to predator, which isnot always the case.
Some contaminants have much higher transfer efficiency than others: in theseinstances the losses through the passage from a compartment to another along thetrophic chain are negligible. Such is the case of dichlorodiphenyldichloroethane(DDD), an insecticide of the DDT family, that was studied by Hunt and Bischoffin 1960 [22]. It was observed that the concentration of DDD increased as aconsequence of the passage from water to aquatic organisms and from prey topredator. The concentration increased even more in the passage from fish to fish-eating birds (Aechmophorus occidentalis) situated at the top of the trophic chain.
In particular, the authors found that the DDD levels in the water of the ClearLake, California were 0.02 ppm; in plankton 5.3 ppm ca.; in small fish 10 ppm;in predatory fish 1,500 ppm and in the western grebe fat 1,600 ppm. All thishighlighted the biomagnification phenomenon.
The biomagnification of hydrophobic substances with a high resistance todegradation, such as DDT or PCBs, can be ascribed to the different physiologyof the various organisms. If we consider that the air/water partition coefficients(KAW) (at 20 °C) of DDT and PCBs are 10�2–10�3 we can infer that their waterconcentration is 100–1,000 times higher than air concentration. Therefore, thetransfer capacity of the contaminant from and to water organisms is two–threeorders of magnitude higher than it is in air. As a matter of fact, aquatic organismsprovided with gill have to extract the oxygen they need from water, when theoxygen concentration in water is 1/27 compared to air concentration (in equilibriumconditions at 20 °C). The gill must therefore work incessantly in order to extracta sufficient amount of dissolved oxygen from the water, which entails also a highexchange efficiency of the contaminants. For fish, the deposit compartment ofcontaminants is non-polar lipids that are easily assimilated by predators. Thisincreases the possibility of biomagnification phenomena.
Therefore, assimilability is the decisive factor for biomagnification. We canobserve that the levels of hexachlorobenzene (HCB), DDT, and PCBs in the grassof a meadow have values that can be compared to those present in fish, althoughthe concentration of these contaminants are 100–1,000 times lower than those thatcan be found in the aquatic compartments. The above-mentioned contaminantsaccumulate in wax and possibly also in the cutin present in grass. These elementsare not easily assimilated by ruminants, and therefore there is no biomagnifi-cation, due to the low transfer efficiency of the contaminant from the grass to
10 BIOLOGICAL MONITORING: THEORY & APPLICATIONS
WITPress_BMTA_ch001.qxd 11/26/2007 12:58 Page 10
www.witpress.com, ISSN 1755-8336 (on-line) WIT Transactions on State of the Art in Science and Engineering, Vol 30, © 2008 WIT Press
the ruminant. The accumulation of contaminants in the waxes of terrestrialplants reduces sensibly biomagnification in herbivores [23].
Being lipophilic, contaminants often accumulate in the fat tissues of theorganisms. The CF of an organism grows in proportion to the growth of KOW,which is defined as the water/n-octanol partition coefficient. This partitioncoefficient is used because it is highly assimilable to lipids; it has a long hydro-carbon chain and has an alcoholic terminal function.
The measurement of the KOW is considered to be very important, since severalAmerican, European, and Japanese environmental bureaus require them as indi-cators for the assessment of the quality of new compounds that are being put ontothe market.
However, some recent works stress the fact that there has been a high levelof uncertainty in reported octanol–water partition coefficients and aqueoussolubilities (SW) for DDT and dichlorodiphenyldichloroethylene (DDE) over thelast six decades [24]. There was found four orders of magnitude variation in theKOW and Sw database values for these hydrophobic organic compounds. The wholedata quality seems to need to be reconsidered [24].
Biomagnification, however infrequent, can occur with methylmercury, theorganic form of mercury found in water ecosystems, where it is very stable.Methylmercury is highly photolabile and is therefore found in places with scarceluminosity.
We all remember the tragic accident at Minamata Bay (Japan), where achemical industry employing Hg2+ as a catalyst in the production process ofpolyvinyl chloride used to discharge wastes contaminated with mercury intothe sea. Methylmercury bioaccumulated in fish, and fish was the staple food forthe people living along the coast. The concentration of mercury in the fish washigher than 100 ppm (in the USA the recommended limit for mercury in fish forhuman food use is 0.5 ppm).
During 1950s, thousands of people living in Minamata suffered from mercurypoisoning and hundreds of them died.
Another more recent disastrous accident is the one involving the petrochemicalindustry Enichem of Priolo, (Sicily): up to 2001, mercury used to be illegally dis-posed of in the sea. The levels of mercury measured in the sea were 20,000 timeshigher than the ones allowed. Congenital deformities in fetuses had been reportedfor some time in the area.
The KOW of methylmercury is ca. 1, which means that its hydrophobicity isvery low and its bioaccumulation capacity is virtually negligible. However, itpenetrates cellular membranes easily (since it does not differentiate lipids fromwater, as indicated by its KOW � 1) thus forming stable complexes with thiolicgroups of the proteins inside the cells where it builds up.
Transfer efficiency from a trophic level to the next can be measured by thetrophic transfer coefficient (TTC), which is the ratio between the concentrationof the contaminant in the tissues of the consumer and the concentration in thetissues of the food (prey) [25]. Therefore, if the TTC value is lower or equal toone, there occurs no biomagnification phenomenon. If it is higher than one,
ENVIRONMENTAL BIOLOGICAL MONITORING 11
WITPress_BMTA_ch001.qxd 11/26/2007 12:58 Page 11
www.witpress.com, ISSN 1755-8336 (on-line) WIT Transactions on State of the Art in Science and Engineering, Vol 30, © 2008 WIT Press
there is biomagnification. Suedel et al. [25] detected TTC values as high as 100for methylmercury (full-blown biomagnification). For several organic compoundsstudied (atrazine, chloro-dioxines, polycyclic aromatic hydrocarbons (PAHs)) thetests for biomagnification had negative results (TTC � 1). Other contaminants(DDT, DDE, and PCBs) show TTC values ranging between 0.1 and 10. PCBs(highly hydrophobic) have TTC values as high as 10 in the passage from small tobig fish, and it reaches an enrichment factor of 100 in the passage to dolphinsand fish-eating birds [26, 27].
Another example of accumulation in the trophic chain is the one concerningradioactive depositions over the Mediterranean area after April 1986 (Chernobylaccident). The rapid removal of Cs-137 from water by biological activity hastransferred this radionuclide to the pelagic and benthic communities [28]. Transferof Cs-137 along the marine trophic chain in the Po delta (Adriatic sea) was foundin 1990. Levels of Cs-137 (Bq/kg wet weight) were: 0.07 for plankton; 0.5 forMerluccius merluccius, and 0.6 for Sardina pilchardus [29].
6 Sampling problems
Before the assessment of the BL of contamination of an ecosystem, it is necessaryto clearly define the area under study and the area that can be affected by apossible source of impact.
The area of influence depends on several factors:
1. the magnitude of the impact (e.g. volume of the pollutants released in theatmosphere);
2. the characteristics of the receiving body (e.g. wind direction);3. the time scale that will be used.
The area of influence of a group of contaminants varies depending with time.Another problem is the representativeness of the samples and the intensity of thesampling. When establishing the number of samples, it is necessary to considerthe size of the area of influence and the actual presence of the species under studyin the area concerned.
The necessary number of samples changes with each kind of material that isanalyzed (atmosphere, sediments, biota) and with each contaminant studied, sincethey have different affinities both regarding their bioconcentration capacity andtheir distribution in the ecosystem. As a general rule, the less we know about acontaminant, the more samples we need.
Bros and Cowell [30] developed a technique that employs the standard error(SE) of the mean to resolve statistical power in order to determine the number ofsamples needed based on number of species, number of individuals, biomass,diversity, and evenness. This method uses a Monte Carlo simulation procedure togenerate a range of sample sizes vs. power. As the number of samples is increased,the rate of increase of SE declines, and eventually becomes near to zero level; the
12 BIOLOGICAL MONITORING: THEORY & APPLICATIONS
WITPress_BMTA_ch001.qxd 11/26/2007 12:58 Page 12
www.witpress.com, ISSN 1755-8336 (on-line) WIT Transactions on State of the Art in Science and Engineering, Vol 30, © 2008 WIT Press

point where this occurs corresponds to the minimum number of samples required.Generally, the less abundant the pollutant, the greater the number of samplesrequired to assess its level.
When quantifying the BL of a contaminant in a given organism, we refer tothe mean concentration of the contaminant in the tissues of the organism. It isimportant to take into account the condition index (age, sex and maturity, size,etc.) of the population under study. These elements can alter significantly theconcentration of the pollutant in the organism. For example, in molluscs theconcentration of the contaminant depends on the weight (size). Therefore, inbiomonitoring studies using molluscs, the concentration/weight factor is deter-minant and important for the processing of data (see further on).
The BL can also refer to the natural concentration of the pollutant in a givenorgan (brain, liver, pancreas, thallus, etc.) or to an analytical fraction that corre-sponds to a given extraction process (intra-extracellular, lipid fraction, etc.). Thisis because those organs, beside having a particular bioaccumulation ability,present less difficulties when chemical analyses are performed; or also for thedifferent biological meaning that this localized bioaccumulation takes on. Thedata obtained this way are generally more stable than those obtained from theanalysis of the whole organism.
6.1 Sample collection
The methods and materials used to collect, store, and transport samples should beconsidered carefully. Sampling devices and their materials of construction shouldhave to be evaluated under specified conditions. Contamination by samplingdevices and materials can contribute relatively large errors in comparison toanalytical procedure, especially when the analytes of interest are at low concen-trations. Sampling protocol should be based on labile analytes to be measured.The term labile is hence regarded as the metal forms with the highest probabilitythat the analyte concentration change prior to analysis.
Composite sampling defined as combining portions of multiple samples is ofadvantage in a monitoring program. Even when each individual test sample con-tinues to be the material of study used in many biomonitoring studies compositesampling frequently replaces collection of individual specimens [31].
Composite samples are often used to reduce the cost of analyzing a largenumber of samples and also to diminish intersample variance due to hetero-geneity of the sampled material. Statistical evaluation of the results obtained incomposite samples indicate less mean square error in the frequency of analyteoccurrence than in the approach of sampling and analyzing one individual fromeach one of the multiple populations collected.
Another advantage of composite sampling is that it may also increase theamount of sample available for analysis, especially when each individual furnishestoo little quantities of material of study.
After sample collection, appropriate conditioning and storage precautions areof concern in order to minimize the risks of analyte loss or contamination.
ENVIRONMENTAL BIOLOGICAL MONITORING 13
WITPress_BMTA_ch001.qxd 11/26/2007 12:58 Page 13
www.witpress.com, ISSN 1755-8336 (on-line) WIT Transactions on State of the Art in Science and Engineering, Vol 30, © 2008 WIT Press

For speciation studies of biological materials more stringent conditions haveto be fulfilled during sample collection, pretreatment, and storage. It is of rele-vance to maintain the integrity of the chemical species during and after sampling.Changes in parameters such as temperature, ionic strength, pH, redox potential,oxygen level, irradiation with UV light, etc., to which the samples are exposed,can influence the distribution of chemical species.
The choice of sample storage containers is also a critical factor, being deepfreezing samples an appropriate technique to perform immediately after collectionto minimize bacterial or enzyme degradation.
6.2 Sample preparation
Until the middle of the last decade sample preparation procedures for biologicalmaterials fell into two categories. Firstly, analytical methods with minimumsample treatment (nearly intact sample) and secondly, those methods where animportant sample treatment such as separation, extraction, or destruction of theorganic matter is necessary before determinations can be carried out.
Sample preparation in inorganic analytical chemistry is generally concernedwith digestions, which principally serve to liberate target compounds from thesample matrix and convert the various chemical forms of the analyte to a uniformspecies [31].
Analysis of plant materials and animal tissues usually involves destruction oforganic matter. Wet acid and dry ashing techniques are commonly used for thispurpose but the former has been gaining more acceptance during the last years.Digestion by refluxing in boiling concentrated acids such as nitric acid or nitric/perchloric acids is the conventional technique used in biomonitoring studies butspecial microwave heating for acid digestions has lastly increased the speed andefficiency of the operation (for more details on digestion procedures see Chapter 5).
Sample preparation in organic analytical chemistry mainly comprises extrac-tions, which serve to isolate components of interest from a sample matrix becausemost analytical instrumentation cannot handle the matrix. Extraction techniquesusing large amounts of organic solvents in analyte laboratories such as theSoxhlet extraction method are still used. However, several disadvantages ofsolvent extraction in routine analysis are known: sample preparation is timeconsuming, employ multi-step procedures with high risk of analyte loss and arerather expensive [31].
In biomonitoring the main drawback of the entire process would probably bethat most of the analysis time is consumed by sampling and sample preparation,mainly because of the large number of samples to handle and process. Microwaveassisted extraction (MAE) techniques are an interesting alternative for separationof organometallic compounds in environmental and biological samples. Extractionin an open microwave oven is of great advantage for dissolving samples becauseit offers reducing extraction time and reagents, thus reducing contaminationproblems. Furthermore, procedures for sequential extraction using microwaveheating under controlled conditions were also established [31].
14 BIOLOGICAL MONITORING: THEORY & APPLICATIONS
WITPress_BMTA_ch001.qxd 11/26/2007 12:58 Page 14
www.witpress.com, ISSN 1755-8336 (on-line) WIT Transactions on State of the Art in Science and Engineering, Vol 30, © 2008 WIT Press
In the last years a novel technique, solid phase microextraction (SPME),regarded as a sorbent extraction technique and a solvent-free sample preparation,has been applied for trace element speciation in environmental and biologicalsamples. One of the main advantages of SPME in metal speciation is that it is anon-exhaustive technique permitting equilibrium of the target compound betweenthe free and bound-to-matrix forms be practically undisturbed during the extrac-tion procedure [31].
Volatile and non-volatile organometallic compounds can be collected by fibersplaced into a tip of the SPME system at the entry of gas chromatography (GC) andliquid chromatography (LC) instruments, respectively, used for their separation.Only a soft digestion of the sample to drive the analytes into the liquid phase isneeded for immersion of the tip, though in other cases the fiber is in contact withthe gas phase of the headspace in the chamber containing the sample solution [31].
6.3 The use of certified reference materials
National and international marine monitoring programs have been initiated world-wide to assess the quality of the marine environment. In environmental analysisReference Materials (RMs) play an important role to achieve quality in the results;therefore, an appropriate use of reference standards must be emphasized.
Definitions of some useful terms related to RMs are given in ISO Guides[32–34]. RM is a material or substance one or more of whose property valuesare sufficiently homogeneous and well established to be used for the calibrationof an apparatus, the assessment of a measurement method, or for assigning valuesto materials whereas a Certified Reference Material (CRM) is a ReferenceMaterial, accompanied by a certificate, one or more of whose property values arecertified by a procedure which establishes its traceability to an accurate realiza-tion of the unit in which the property values are expressed, and for which eachcertified value is accompanied by an uncertainty at a stated level of confidence.
Traceability implies that a measurement result should be related to stated ref-erences, and therefore, the value reported in the certificate of a CRM is traceable.So, when CRM are used in a method the user has to demonstrate its traceability.Traceability is defined as a property of the result of a measurement or the valueof a standard whereby it can be related, with a stated uncertainty, to stated refer-ences, usually national or international standards, through an unbroken chain ofcomparisons.
Certification of a Reference Material is a procedure that establishes the value(s)of one or more properties of a material or substance by a process ensuring trace-ability to an accurate realization of the units in which the property values areexpressed, and that leads to the issuance of a certificate.
The large array of matrices encountered in the environment makes necessarythe use of a very wide variety of RMs derived from different sources, relatedto the intended purpose of the user. Advantages and choices of CRM as well asthe procedure for carrying out the measurement are described in the InternationalOrganization for Standardization (ISO) Guides [32–34].
ENVIRONMENTAL BIOLOGICAL MONITORING 15
WITPress_BMTA_ch001.qxd 11/26/2007 12:58 Page 15
www.witpress.com, ISSN 1755-8336 (on-line) WIT Transactions on State of the Art in Science and Engineering, Vol 30, © 2008 WIT Press
CRM chosen must adequately match the material to be analyzed, and it alsoimplies that the levels of the analytes or target compounds have to be similar tothose of the real samples used for analysis. Traceability of CRM will be question-able when the matrix and analyte contents are too different from those of theanalyzed sample.
The contents of trace, minor, and major elements in CRM for the quality controlof marine and estuarine monitoring programs include biological, sediment, andseawater samples. Technical information and purchasing conditions are providedfrom the main suppliers by request.
Usually, most elements exert their biological and environmental impact ascomponents of macromolecules, or linked to small organic compounds, or accord-ing to a specific oxidation state. Therefore, not only total element determinationsare of interest any longer but also identification and quantification of elementspecies (speciation).
In the last twenty years, speciation analysis in the environmental and lifesciences has mainly focused on the analysis of relatively stable organometalliccompounds such as some organic forms of mercury, tin, or arsenic, and oxidationstates: Cr (III)/Cr(VI).
Today, there is a great interest in speciation studies of many other elementspresent in the marine environment and biota. It is also necessary that availability,and distribution, transport, transformation, and fate of chemical species ofelements regarded as toxic, rather than of the total amount of the elements, bestudied in very complex systems and samples taken from biotic and abioticsources. Unfortunately, there is a limited number of available CRM to fit thesepurposes. Existing CRM are intended to be used for trace element speciation andfractionation purposes. Explanation of these two fundamental concepts has beenextensively treated in a publication of the International Union of Pure and AppliedChemistry (IUPAC) [35].
7 Determination of background levels (BLs)
The determination of BLs [15] is fundamental to determine the degree of enrich-ment of the contaminants in the environment or in the biota. Generally, the dataused as BLs come from two different sources:
1. mean values used as general reference levels2. values determined in their area of study
Both procedures are valid and the choice between them depends on the goal oneis trying to achieve. Using general reference levels local variations will beignored. On the other hand, using the pre-industrial levels of the areas concerned,local variations will actually be emphasized.
However, for an exact environmental assessment and/or monitoring of a givengeographical area, it is generally preferred to use the values determined in the
16 BIOLOGICAL MONITORING: THEORY & APPLICATIONS
WITPress_BMTA_ch001.qxd 11/26/2007 12:58 Page 16
www.witpress.com, ISSN 1755-8336 (on-line) WIT Transactions on State of the Art in Science and Engineering, Vol 30, © 2008 WIT Press
specific area of study, even though this entails higher costs, sampling andlaboratory work. In this approach, it is important to minimize the effect of thevariability of the samples in the selected sites.
The difficulty with these methods of approach to study lies in the ability todistinguish between the variability due to contamination and natural variability,as well as to report data on a regional scale. The key for a correct definition ofBL is to select unpolluted sites. This selection can be performed by choosing:
1. for each contaminant the sites that are not polluted by this particularcontaminant;
2. the sites those are also free from contamination of typically polluting elements.
When selecting uncontaminated stations, before sampling a geographical area, itis necessary to follow a number of preliminary procedures [15].
In accordance with the information available, a series of stations (or sites) canbe selected that are considered representative of natural levels. This decisionentails a high degree of risk if there are no exhaustive preliminary data on the areaof study.
The selection of the sites can be made using multifactorial techniques. Withthis method, clean stations are selected after being grouped through multifactorialanalysis (principal component analysis (PCA), dendrograms, etc.) applied to amatrix of data that are linked to the quality of each ecological station.
Elements of segregation can be used, together or separately, such as the physico-chemical parameters of the environment, the concentration of the pollutants in theenvironment and organisms, the frequency of the species of bioindicators, etc.
However, this method presents some problems. The results can be difficult tointerpret and may have low grouping levels, especially if the majority of thesamples have low levels of contamination. Furthermore, contamination is distrib-uted along different gradients that depend on the natural variability of the physico-chemical conditions of the environment (air, soil, water). This method is moreeffective when the areas of study present more homogeneous environmentalconditions and the contamination points are more punctual and intense.
Another method for the selection of clean sites involves bioindicators. Ecologicalstations are selected on the basis of a possible manifestation of stress in one orseveral species of environmental quality indicators.
The stress to be measured may be biochemical, physiological, or structural(e.g. chlorophyll degradation). Usually, several bioindicators are used belongingto different biological species present in that environmental compartment andresponding to pollutants in a complementary way. This method allows the evalu-ation of the degree of natural preservation of the selected sites with a reasonabledegree of approximation.
When the contaminant type is known, some indicators can be used moreeffectively and this allows the use of less costly methods. If the contaminants arenot known and the information on the tolerance level of the species is scarce, amultiple survey and possibly toxicity tests are necessary.
ENVIRONMENTAL BIOLOGICAL MONITORING 17
WITPress_BMTA_ch001.qxd 11/26/2007 12:58 Page 17
www.witpress.com, ISSN 1755-8336 (on-line) WIT Transactions on State of the Art in Science and Engineering, Vol 30, © 2008 WIT Press
A multiple level survey entails the study of possible indicators and changes inthe behavior of the organisms. The indicators have to show biochemical, genetic,morphological, or physiological changes (biomarkers). The behavior indexes aredetermined by the changes of given species, dynamic populations, or communities(e.g. freshwater macroinvertebrates).
The biomonitoring of communities provides information on the magnitude andthe ecological effects of the contaminants in an ecosystem. The cause/effectrelationships are difficult to establish and the knowledge in this respect is stilldubious, since there are many factors affecting the community-contaminantssystem. Therefore, the use of bioindicators at different organizational levels (forinstance: individuals, species, communities, ecosystems) is more advisable.
If the choice of the uncontaminated stations concerns a given contaminant,there are different statistical methods that can be used, such as the use of datapopulations with a coefficient of variation (CV) of approximately 60%. Thismethod is used for the assessment of the natural geochemical BL in soils andconsists on the progressive elimination of the higher values of the contaminantunder study until a CV of 60% is reached. Such population distribution is con-sidered normal [14, 15].
Many ecotoxicological studies use the determination of homogeneous popula-tions within a number of data belonging to a given site, employing graphs anddiagrams. These studies rely on the analysis of distribution curves of cumulativefrequencies transformed in a log-normal distribution (cumulative frequencycurves). It is thus possible to distinguish homogeneous populations (straightlines in the diagram) that correspond with the different contamination levels:base level, middle level, and contaminated. The problem with this method is thatit is necessary to have a significant amount of data in order to have a valid graph-ical interpretation of the populations.
Another method involves normal populations. In order to solve the problem ofsize in the number of data – which is a common problem in most works, modalanalysis methods are also applied. Such methods are often used in demographystudies employing adequate software. For instance, NORMSEP (SEParation ofthe NORMally distributed components of size-frequency samples) is a programthat transforms the frequency of the concentrations obtained into a distribution ofnormal components, thus allowing a differentiation between the various homo-geneous populations that may coexist with the complete series of data. Thanks tothis method it is possible to work even with a reduced number of samples.
The use of regression techniques is applied between a stable element that isnot affected by anthropic activity and the rest of the contaminants. In this instance,the clean stations will be those presenting a confidence level of 95% of the regres-sion line. However, the use of this approach can contribute to eliminate someuncertainties as to a clear separation between clean and contaminated sites. Inview of this, in order to have a statistically meaningful regression, it is necessaryto have a high number of samples [36, 37].
The systematics of environmental classification is obtained starting from theCFs obtained for each contaminant in the environment or in the organisms.
18 BIOLOGICAL MONITORING: THEORY & APPLICATIONS
WITPress_BMTA_ch001.qxd 11/26/2007 12:58 Page 18
www.witpress.com, ISSN 1755-8336 (on-line) WIT Transactions on State of the Art in Science and Engineering, Vol 30, © 2008 WIT Press
When evaluating CFs, it is important to consider all uncertainties due to sampling,space, and time variability of the samples, age, and condition index of the organ-isms, etc.
The various elements of the uncertainty of measurement in the different steps(sampling, pretreatment, analytical steps) must be duly evaluated within theframework of the approach that has been adopted for the study.
Generally, two approaches are used for the evaluation of uncertainty:
1. the theoretical “bottom-up” approach recommended by international organi-zations. This method requires the evaluation, expressed as standard deviations,of all factors that will contribute to the final value (e.g. volumetric flaskcorrections, standard weight corrections, pipet volume corrections, signaluncertainty, etc.).
2. the practical “top-down” approach from the relative standard deviationderived from an interlaboratory study by the Harmonized IUPAC/Associationof Official Analytical Chemists (AOAC) protocol [38].
The formal definition of uncertainty given by the ISO Guide [39] is as follows:“Parameter associated with the result of a measurement, that characterizes thedispersion of the values that could reasonably be attributed to the measurand.”
Recently, Conti et al. [38] analyzed theoretical and practical aspects of uncer-tainty in environmental laboratory analysis.
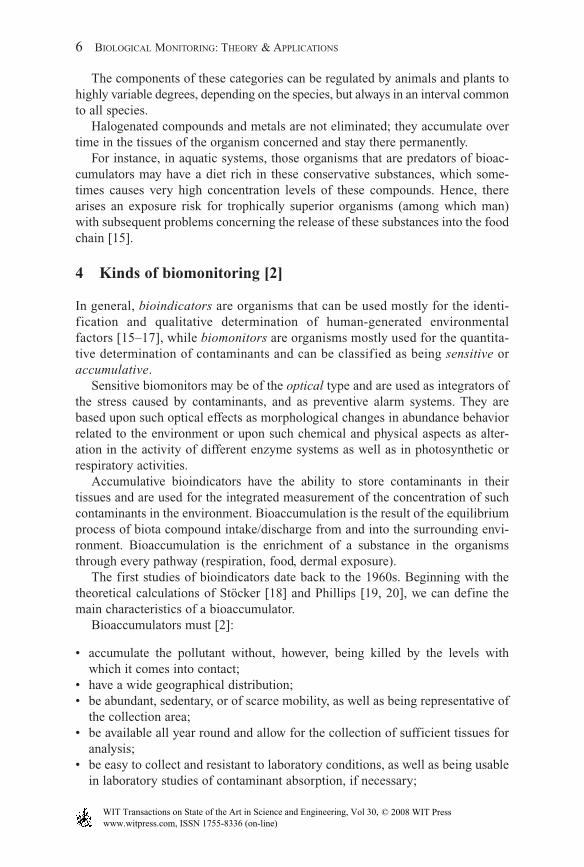
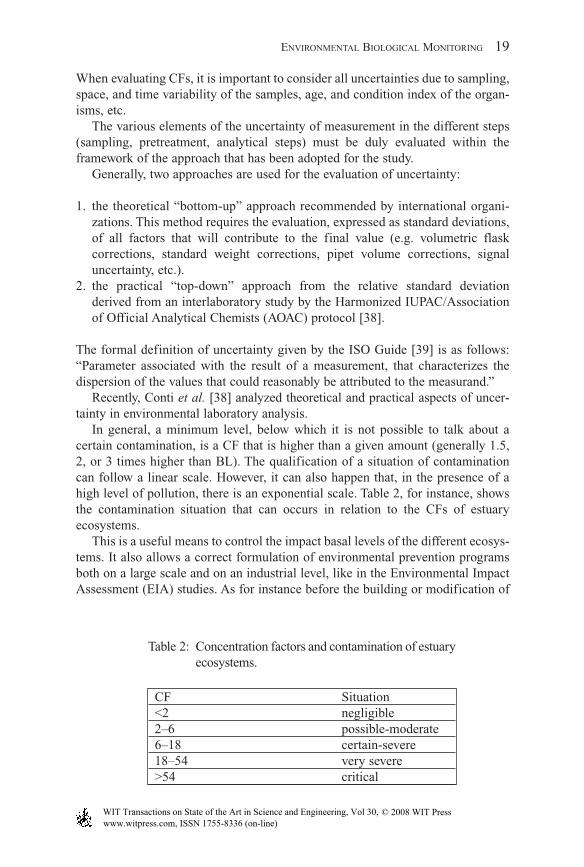
In general, a minimum level, below which it is not possible to talk about acertain contamination, is a CF that is higher than a given amount (generally 1.5,2, or 3 times higher than BL). The qualification of a situation of contaminationcan follow a linear scale. However, it can also happen that, in the presence of ahigh level of pollution, there is an exponential scale. Table 2, for instance, showsthe contamination situation that can occurs in relation to the CFs of estuaryecosystems.
This is a useful means to control the impact basal levels of the different ecosys-tems. It also allows a correct formulation of environmental prevention programsboth on a large scale and on an industrial level, like in the Environmental ImpactAssessment (EIA) studies. As for instance before the building or modification of
ENVIRONMENTAL BIOLOGICAL MONITORING 19
Table 2: Concentration factors and contamination of estuaryecosystems.
CF Situation<2 negligible2–6 possible-moderate6–18 certain-severe18–54 very severe>54 critical
WITPress_BMTA_ch001.qxd 11/26/2007 12:58 Page 19
www.witpress.com, ISSN 1755-8336 (on-line) WIT Transactions on State of the Art in Science and Engineering, Vol 30, © 2008 WIT Press

big industrial plants (refineries, thermal power plants, steelworks, etc.) or largeinfrastructure works (public buildings, motorways, etc.).
8 Levels of organization
In short, in order for an organism to be considered a valid bioindicator, it musthave a wide geographical distribution, be available all year round, and be alsovery tolerant to the contaminant (without being killed by it), be easy to sampleand store, and, more importantly, it must have a positive correlation between thecontaminant concentration accumulated in its organism and the concentration ofthat same contaminant in the surrounding environment [2].
20 BIOLOGICAL MONITORING: THEORY & APPLICATIONS
Table 3: Organization levels and measures connected with biomonitoringstudies [15].
-individual-organism-genetic mutations-reproductive success-physiology-metabolism-oxygen consumption, photosynthesis rate-enzyme/protein activation/inactivation-hormones
-growth and develop-resistance to disease-tissue/organ damage-bioaccumulation
-population-survival/mortality-sexual rate-abundance/biomass-behavior (migration)-predation rate-decrease/increase population
-community-organism (or organisms) abundance-biomass-organism (or organisms) density-abundance (variety), number of species, width class, or other functional-groups, per area or volume, or number of individuals
-variety/relative abundance of species-ecosystem
-mass nutrients
WITPress_BMTA_ch001.qxd 11/26/2007 12:58 Page 20
www.witpress.com, ISSN 1755-8336 (on-line) WIT Transactions on State of the Art in Science and Engineering, Vol 30, © 2008 WIT Press

The identification of cosmopolite indicators allows a comparison between theabsolute levels of some contaminants (e.g. metals) of organisms belonging todifferent geographical areas. Bioindicators are a very valid tool because they canaccumulate contaminants such as heavy metals from the aqueous medium up totens of thousands of times as much as BLs.
Measurements associated with biomonitoring are possible at various levels oforganization: individual, population, community, and ecosystem. A synthesis ofthese by now commonly used methods is reported in table 3.
The identification of cosmopolite indicators allows a comparison between theabsolute levels of some contaminants (e.g. metals) of organisms belonging todifferent geographical areas. Bioindicators are a very valid tool because they canaccumulate contaminants such as heavy metals from the aqueous medium up totens of thousands of times as much as BL.
References
[1] Conti M.E. (2002) Gli indicatori ed i marcatori biologici in Ecotossicologia.Università degli Studi di Roma, in: Facoltà di Farmacia (Ed.), La Sapienza.Centro Stampa d’Ateneo, Rome, pp. 124–141.
[2] Conti M.E., Cecchetti G. (2001) Biological monitoring: lichens as bioindi-cators of air pollution assessment – a review. Environmental Pollution, 114,471–492, Reprinted (or higher parts taken) with a kind permission ofElsevier.
[3] Connell D. (1999) Introduction to Ecotoxicology. Blackwell, Oxford, UK,pp. 184.
[4] Tessier A., Campbell P.G.C., Bisson M. (1980) Trace metal speciation in theYamaska and St. François Rivers (Quebec). Canada Journal Earth Science,17, 90–105.
[5] Krumgalz B.S. (1989) Unusual grain size effect on trace metals and organicmatter in contaminated sediments. Marine Pollution Bulletin, 20(12),608–611.
[6] Herman R. (1987) Environmental transfer of some organic micropollutants.Ecological Studies, 61, 68–99.
[7] Bero A.S., Gibbs R.J. (1990) Mechanisms of pollutant transport in theHudson Estuary. The Science of the Total Environment, 97/98, 9–22.
[8] Moriarty F. (1999) Ecotoxicology: The Study of Pollutants in Ecosystems.Academic Press, London, pp. 350.
[9] Zaghi C., Conti M.E., Cecchetti G. (2002) White paper on chemicals andStockholm convention on persistent organic pollutants: perspectives forenvironmental risk management. International Journal of Risk Assessmentand Management, 3(2–3–4), 234–245, Reprinted (or higher parts taken)with a kind permission of Inderscience Publishers.
[10] European Commission White Paper (2001) Strategy for a Future ChemicalsPolicy, COM, 88 final.
ENVIRONMENTAL BIOLOGICAL MONITORING 21
WITPress_BMTA_ch001.qxd 11/26/2007 12:58 Page 21
www.witpress.com, ISSN 1755-8336 (on-line) WIT Transactions on State of the Art in Science and Engineering, Vol 30, © 2008 WIT Press
[11] Directive 67/548/EEC relating to the classification, packaging and labellingof dangerous substances as amended, directive 88/379/EEC and newdirective 99/45/EC relating to the classification of dangerous preparations,directive 76/769/EEC relating to restrictions on the marketing and use ofcertain dangerous substances and preparations, regulation (EEC) 793/93on evaluation and control of risks of existing substances.
[12] European Commission Working Document SEC (1998)1986 final.[13] Stockholm Convention on Persistent Organic Pollutants (2001) URL:
http://www.cham.unep.ch/pops.[14] Carballeira A., Carral E., Puente X., Villares R. (2000) Extensive control of
litoral contamination. Nutrients and heavy metals in sediments and organ-isms on Galicia coast (NW Spain), in: Conti M.E., Botrè F. (Eds.), Thecontrol of marine pollution: current status and future trends. InternationalJournal of Environment and Pollution, 1–6, 534–572.
[15] Conti M.E. (2002) Il monitoraggio biologico della qualità ambientale. ed.Seam, Rome, p. 185.
[16] Hertz J. (1991) Bioindicators for monitoring heavy metals in the environ-ment, in: Merian E. (Ed.), Metals and their Compounds in the Environment,VCH, Weinheim, 221–232.
[17] Tonneijk A.E.G., Posthumus A.C. (1987) Use of indicator plants for bio-logical monitoring of effects of air pollution: the Dutch approach. VDI Ber,609, 205–216.
[18] Stöcker G. (1980) Zu einigen theoretischen und metodischen. Aspekten derBioindikation, in: Schubert R., Schuh J. (Eds.), Methodisce und theoretischegrundlangen der bioindikation (Bioindikation 1), Martin-Luther-Universität,Halle (Saale), GDR, pp. 10–21.
[19] Phillips D.J.H. (1977) The use of biological indicator organisms to monitortrace metal pollution in marine and estuarine environments. A review.Environmental Pollution, 13, 281–317.
[20] Phillips D.J.H. (1980) Quantitative Aquatic Biological Indicators: Their Useto Monitor Trace Metal and Organochlorine Pollution. Applied SciencePublishers, London, p. 488.
[21] Slobodkin L. (1961) Growth and Regulation of Animal Populations. Holt,Rinehart & Winston, New York.
[22] Hunt E.G., Bischoff A.I. (1960) Inimical effects on wildlife of periodicDDD application to Clear Lake. California Fish Game, 46(1), 91–106.
[23] Bacci E., Gaggi C. (1998) Bioconcentrazione, bioaccumuloebiomagnificazione, in: Vighi M., Bacci E. (Eds.), Ecotossicologia. UTET,Torino, pp. 143–152.
[24] Renner R. (2002) The Kow controversy. Environmental Science andTechnology, 36(21), 411A–413A.
[25] Suedel B.C., Boraczek J.A., Peddicord R.K., Clifford P.A., Dillon T.M.(1994). Trophic transfer and biomagnification potential of contaminants inaquatic ecosystems. Reviews of Environmental Contamination andToxicology, 136, 21–89.
22 BIOLOGICAL MONITORING: THEORY & APPLICATIONS
WITPress_BMTA_ch001.qxd 11/26/2007 12:58 Page 22
www.witpress.com, ISSN 1755-8336 (on-line) WIT Transactions on State of the Art in Science and Engineering, Vol 30, © 2008 WIT Press
[26] Focardi S., Leonzio C., Fossi C., Rosi C., Marsili L. (1991) Delfinidispiaggiati lungo le coste toscane e laziali: livelli di idrocarburi clorurati.S.IT.E. Atti, 12, 197–200.
[27] Focardi S., Marsili L., Fabbri F., Carlini R. (1990) Preliminary study ofchlorinated hydrocarbon levels in Cetacea stranded along the Tyrrheniancoast of Latium (Central Italy), in: Evans P.G.H., Aguilar A., Smeenk C.(Eds.), European Research on Cetaceans, Cambridge 4, pp. 108–110.
[28] Fowler S.W., Buat-Menard P., Yokoyama Y., Ballestra S., Holm E., NguyenH.V. (1987) Rapid removal of Chernobyl fallout from Mediterranean surfacewaters by biological activity. Nature, 329(6134), 56–58.
[29] Nonnis Marzano F., Triulzi C. (2000) Evolution of radiocontamination inthe Mediterranean Sea in the period 1985–1995. International Journal ofEnvironment and Pollution, 13(1–6), 608–616.
[30] Bros W.E., Cowell B.C. (1987) A technique for optimizing sample size(replication). Journal Experimental Marine Biology Ecology, 144, 63–71.
[31] Conti M.E., Tudino M.B., Muse J.O., Cecchetti G.F. (2002) Biomonitoring ofheavy metals and their species in the marine environment: the contributionof atomic absorption spectroscopy and inductively coupled plasma spec-troscopy. Research Trends in Applied Spectroscopy, 4, 295–324, Reprinted(or higher parts taken) with a kind permission of Research Trends.
[32] International Organization for Standardization – ISO Guide 33. (2000) Usesof certified reference materials.
[33] International Organization for Standardization – ISO Guide 35. (2006)Reference materials – General and statistical principles for certification.
[34] International Organization for Standardization – ISO Guide 32. (1997)Calibration in analytical chemistry using certified reference materials.
[35] Templeton D.M., Ariese F., Cornelis R., Danielsson L.-G., Muntau H., VanLeeuwen H.P., Aobinski R. (2000) Guidelines for terms related to chemicalspeciation and fractionation of elements. Definitions, structural aspects, andmethodological approaches (IUPAC recommendations). InternationalUnion of Pure and Applied Chemistry, 72(8), 1453–1470.
[36] Conti M.E., Cucina D., Mecozzi M. (2007) Regression analysis modelapplied to biomonitoring studies. Environmental Modeling Assessment DOI: 10.1007/s10666-007-9113-7 (in press).
[37] Conti M.E., Iacobucci M., Cecchetti G., Alimonti A. (2007) Influence ofweight on the content of heavy metals in tissues of Mytilus galloprovincialis(Lamarck, 1819): a forecast model. Environmental Monitoring AssessmentDOI: 10.1007/s10661-007-9875-z (in press).
[38] Conti M.E., Muse J.O., Mecozzi M. (2005) Uncertainty in environmentalanalysis theory and laboratory studies. International Journal of RiskAssessment and Management, 5(2–4), 311–335.
[39] Guide to the expression of uncertainty in measurement (GUM). ISO,Geneva, 1993 (Reprinted 1995). Italian version: Ente Nazionale Italiano diUnificazione (UNI). UNI CEI ENV 13005. Guida all’espressione dell’in-certezza di misura, Milano, UNI, 2000.
ENVIRONMENTAL BIOLOGICAL MONITORING 23
WITPress_BMTA_ch001.qxd 11/26/2007 12:58 Page 23
www.witpress.com, ISSN 1755-8336 (on-line) WIT Transactions on State of the Art in Science and Engineering, Vol 30, © 2008 WIT Press