1 extraction of natural products from plants – an introduction · pdf file6 1 extraction...
TRANSCRIPT

1
1 Extraction of Natural Products from Plants – An Introduction Hans - J ö rg Bart
1.1 Introduction
The history of the extraction of natural products dates back to Mesopotamian and Egyptian times, where production of perfumes or pharmaceutically - active oils and waxes was a major business. In archeological excavations 250 km south of Baghdad extraction pots (Figure 1.1 ) from about 3500 BC were found [1] , made from a hard, sandy material presumably air - dried brick earth. It is supposed that in the circular channel was the solid feed, which was extracted by a Soxhlet - like procedure with water or oil. The solvent vapors were condensed at the cap, possibly cooled by wet rags. The condensate then did the leaching and was fed back through holes in the channel to the bottom.
Several Sumerian texts also confi rm that a sophisticated pharmaceutical and chemical technology existed. In the oldest clay tablets of 2100 BC (Figure 1.2 ), found 400 km south of Baghdad, is a description of a simple batch extraction: “ purify and pulverize the skin of a water snake, pour water over the amashdubkasal plant, the root of myrtle, pulverize alkali, barley and powered pine tree resin, let water (the extract) be decanted; wash it (the ailing organ) with the liquid; rub tree oil upon it, let saki be added ” [2] .
The pulverization, admixture of NaCl, alkali (potash) or as reported also KNO 3 , shows some basic knowledge of chemical engineering [3] . Also well - documented are recipes to obtain creams and perfumes, from the time of the Assyrian king Tukulti - Ninurta I, 1120 BC. The natural feedstock was crushed in a mortar, and then leached in boiled water for one day. New feed was then added gaining higher concentrations. After percolation, oil was added while increasing the temperature. After cooling, the top oil extract can be removed, and the use of demisters (sieves of clay fi lled with wool or hair) is also reported [4 – 6] .
In a papyrus of 1600 BC, beer and wine were used as alcoholic solvents [7] , which give the distinct advantages of achieving a higher solubility for a solute when pro-ducing perfumes. Otherwise up to 40 repetitive extraction procedures as above were necessary to give a high yield. There was not much development until medieval times, when pure ethanol became available as a solvent in about 900 AD [3] .
Industrial Scale Natural Products Extraction, First Edition. Edited by Hans-Jörg Bart, Stephan Pilz.© 2011 Wiley-VCH Verlag GmbH & Co. KGaA. Published 2011 by Wiley-VCH Verlag GmbH & Co. KGaA.

2 1 Extraction of Natural Products from Plants – An Introduction
After this short historical review we should consider the language used. In German “ natural plant extraction ” is equivalent to “ phyto - extraction ” , which in English terms means extraction (of e.g., metal ions from soil) achieved by plants. The term “ natural products ” is perhaps also something of a misnomer [8] . A natural
Figure 1.1 Extraction pot (oil or water).
1
2
3
4
5
6
7
8
Figure 1.2 Sumerian text (2100 BC).
1.1 Introduction 3
product is a chemical compound or substance produced by a living organism. They may be extracted from tissues of terrestrial plants, marine organism or micro - organism fermentation [9] . In that respect any biological molecule is a natural product, but in general the term is reserved for secondary metabolites (carotinoids, phytosterines, saponines, phenolic compounds, alkaloids, glycosinates, terpenes etc.), produced by an organism. They are not essential for normal growth, develop-ment or reproduction and its survival.
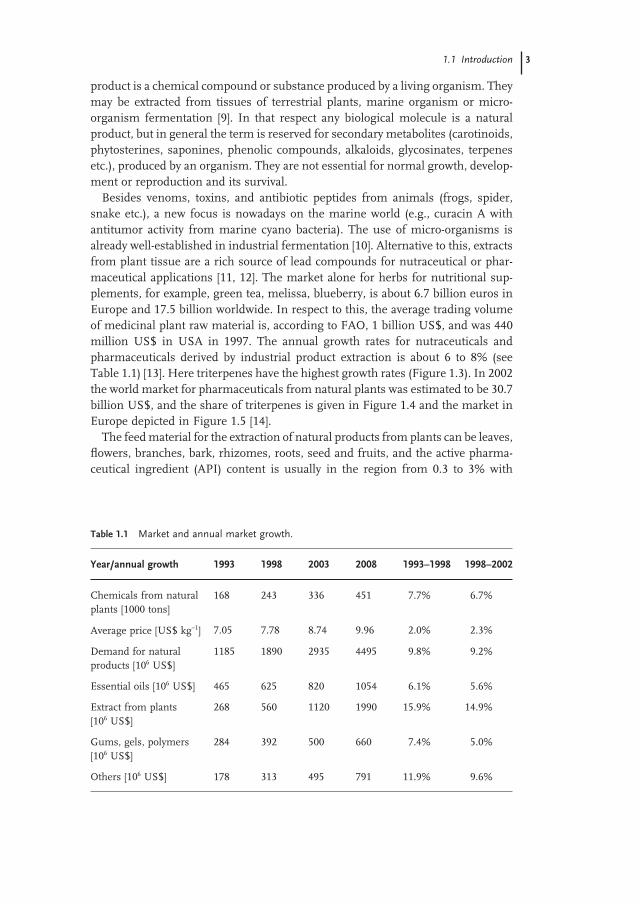
Besides venoms, toxins, and antibiotic peptides from animals (frogs, spider, snake etc.), a new focus is nowadays on the marine world (e.g., curacin A with antitumor activity from marine cyano bacteria). The use of micro - organisms is already well - established in industrial fermentation [10] . Alternative to this, extracts from plant tissue are a rich source of lead compounds for nutraceutical or phar-maceutical applications [11, 12] . The market alone for herbs for nutritional sup-plements, for example, green tea, melissa, blueberry, is about 6.7 billion euros in Europe and 17.5 billion worldwide. In respect to this, the average trading volume of medicinal plant raw material is, according to FAO, 1 billion US$, and was 440 million US$ in USA in 1997. The annual growth rates for nutraceuticals and pharmaceuticals derived by industrial product extraction is about 6 to 8% (see Table 1.1 ) [13] . Here triterpenes have the highest growth rates (Figure 1.3 ). In 2002 the world market for pharmaceuticals from natural plants was estimated to be 30.7 billion US$, and the share of triterpenes is given in Figure 1.4 and the market in Europe depicted in Figure 1.5 [14] .
The feed material for the extraction of natural products from plants can be leaves, fl owers, branches, bark, rhizomes, roots, seed and fruits, and the active pharma-ceutical ingredient ( API ) content is usually in the region from 0.3 to 3% with
Table 1.1 Market and annual market growth.
Year/annual growth 1993 1998 2003 2008 1993 – 1998 1998 – 2002
Chemicals from natural plants [1000 tons]
168 243 336 451 7.7% 6.7%
Average price [US$ kg − 1 ] 7.05 7.78 8.74 9.96 2.0% 2.3%
Demand for natural products [10 6 US$]
1185 1890 2935 4495 9.8% 9.2%
Essential oils [10 6 US$] 465 625 820 1054 6.1% 5.6%
Extract from plants [10 6 US$]
268 560 1120 1990 15.9% 14.9%
Gums, gels, polymers [10 6 US$]
284 392 500 660 7.4% 5.0%
Others [10 6 US$] 178 313 495 791 11.9% 9.6%

4 1 Extraction of Natural Products from Plants – An Introduction
Figure 1.5 Natural plant extracts in Europe (2002).
Gingko 17%
EUROPA
St. John’s-wort 13%
Sabal 13%
Valerian 10%
Gingseng 10%
Garlic 10%
Echinacea 9%
Horse chestnut 8%
Cimicifuga 5%
Monk’s peper 5%
Figure 1.3 Annual growth rates (1997 – 2002).
12
10
8
6
4
2
0Terpenes Glycosides Alkaloids Others
Figure 1.4 Market share of active pharmaceutical ingredients.
5.013,5
4.045
9.230
Terpenes Glycosides Alkaloids Others
12.400

1.1 Introduction 5
Figure 1.6 Methods for recovery of secondary metabolites.
Extraction
PLANTMATERIALDistillation
SteamDistillation
Pressing
Table 1.2 API in plants.
Leaves Bark Roots Seed/fruits
Belladonna Chinchona Licorice Senna Hyoscyamus Rauwolfi a Oenothera Duboisia Ipecac Horse chestnut Digitalis Berberis Sabal Senna Ginseng Catharanthus Valerian Ginkgo Echinacea purpurea Cimifuga Hawthorn
seasonal fl uctuations in period and producing area. Table 1.2 gives an overview, where the API can be found in the plant materials. The recovery of secondary metabolites is depicted in Figure 1.6 . The most economic route is via (cold) press-ing, mainly for oily constituents. Volatile compounds can be removed either by conventional (vacuum) distillation or hydrodistillation. The vapors from steam distillation are condensed and a two - phase distillate (oil and water) is obtained. The boiling point of this practically immiscible oil – water mixture is always below 100 ° C, since each constituent independently exerts its own vapor pressure as if the other constituent is not present and thus high boiling thermosensitive oils (e.g., lavender oil and other fragrances) can be effi ciently prepared. In the following we will concentrate on solids extraction in order to generate a primary crude extract.

6 1 Extraction of Natural Products from Plants – An Introduction
1.2 Cultivation
The production chain with natural products has three major parts to consider. The fi rst is agricultural, followed by, for example, extraction to get a concentrated raw extract, and in pharmaceutical applications (not with cosmetics and nutraceu-ticals) a fi nal purifi cation step is necessary in order to get an ultrapure product. All the steps combined contribute to the overall yield and determine the fi nal economics.
To highlight the importance of including the complete production chain, we can consider growing a crop of plants containing oleanoic acid. This is found in several plants (almond hulls, privet, rosemary, thyme, clove, lavender, olive, haw-thorn, periwinkle etc.) with a content less than 1% in dry mass. Higher values were observed only with a different kind of sage. The value varies with location and local climate (e.g., Germany versus Greece), types of soil (sandy, thus irriga-tion needed), distance between the growing rows and cultivar. With the latter, higher content is with plants from scions obtained through vegetative reproduc-tion ( Salvia offi cinalis ) compared with those from sowing ( S. lavendulifolia ). However, planting with scions is very labor - intensive, which has quite an impact in respect to labor costs, and sowing is then the alternative. Optimal conditions for sage are with warm and wind - protected sites, with a light soil containing compost and water. Dry periods are no major problem and the plants should grow in rows (distance 25 – 50 cm) as depicted in Figure 1.7 [15] . Usually, the useful life is four to fi ve years and for soil recovery a four - year interval is recom-mended. If the plants are used to gain pharmaceutical extracts, all cultivation steps (sowing, manuring etc.) must be documented and with pest management any pesticide (date, dosage etc.) must be registered. With sage the use of herbicides is forbidden and two cuts per year are recommended. After air classifi cation the leaves are dried and according to the Deutsches Arzneibuch only 2% impurities are
Figure 1.7 Cultivation tests of sage at DLR Rheinpfalz.

1.2 Cultivation 7
allowed [16] . A typical yield in an eight - year test cultivation in Saxony is given in Table 1.3 [17] .
In a three - year project, TU Kaiserslautern, DLR ( Dienstleistungszentrum L ä ndlicher Raum ) Rheinpfalz, and the local pharmaceutical industry investigated the cultivation and extraction of sage with respect to the recovery of APIs, like ursolic and oleanoic acid. They have a similar structure, as they are position isomers, since only a CH 3 - group is shifted (Figure 1.8 ). This makes a fi nal separa-tion very diffi cult in order to obtain ultrapure products.
The general trends found in Saxony for the harvested plants could be confi rmed. Interestingly, the overall yield after the fi rst year remained almost constant with all plants, but there is a strong dependency on the triterpene content with harvest time. The fi rst cut in June contains mainly monoterpenes and can be further processed for tea, spice etc. The second cut in September shows an increased triterpene content (maximum here for both acids is about 6%) and even better results could be achieved if the plant is under a poly - tunnel (because of the higher local temperature). In Figure 1.9 triterpene content for S. offi cinalis and S. laven-dulifolia is compared [14] .
Table 1.3 Quality and yield in Salvia offi cinalis under the climate in Saxony.
Fresh leaves a) 1. year: 4 – 12 t/ha 2. year: 8 – 24 t/ha
Dried leaves a) 1. year: 1 – 3 t/ha 2. year: 2 – 4.5 t/ha
Essential oil 1.2 – 2.5% α - thujone 25 – 42% in essence Camphor 12 – 21% in essence Rosmarine acid 0.4 – 3.4% Carnosine derivates 2.3 – 3.4% Flavanoides 0.5 – 1.1%
a) second cut gave 1/3 yield of the fi rst cut.
Figure 1.8 Ursolic (a) and oleanoic acid (b).
CH3CH3
CH3
CH3
CH3CH3
CH3CH3
CH3
CH3
CH3CH3
CH3CH3
HO HO
(a) (b)
H HOH OH
O O

8 1 Extraction of Natural Products from Plants – An Introduction
1.3 Extraction
1.3.1 Solvents
After harvesting the next step in the process chain is the extraction of the desired substance. However, there are several regulations to be considered (see also Chapter 9 ). If the products are to be used with foods then there are regulations in the use of appropriate solvents. According to European Union and governmental regulations [18] the following solvents are allowed:
• water (with admixture of acids or base), • other foodstuffs with solvent properties and • solvents like propene, butane, ethylacetate, ethanol, CO 2 , N 2 O, acetone (the
latter not with olive oil).
With water and foodstuffs it is assumed that the inevitable solvent residue is not harmful. In contrast to this, with industrial solvents maximum residues are defi ned for a certain purpose, as given in Table 1.4 . In Table 1.5 one fi nds the limits when aroma is extracted from natural resources. In any case, for all these solvents the maximum content of arsenic or lead is 1 mg and no toxicologically critical additives are allowed. The use of a mixture of hexane and ethylmethyl ketone is forbidden.
As can be seen from above water, solvents from natural sources (limonene etc.), organic solvents and liquefi ed gases are used in the food industry. Here liquefi ed CO 2 dominates the market and is used for decaffeination of green coffee beans or tea, preparation of leaf extracts, extraction of spices, herbs, essential oils, pungent constituents, natural colorants and antioxidants as well as production of high - value fatty oils [19] (see also Chapter 4 in this book).
Figure 1.9 Triterpene content in Salvia offi cinalis (A, B) and S. lavendulifolia (C,D) after the fi rst (A,C) and second cut (B,D).
A
6
5
4
3
2
1
0
B C D
Ursolic acid
Oleanoic acid
Total

1.3 Extraction 9
Table 1.4 Solvents with foodstuffs and maximal residue content.
Solvent Purpose Max. residue
Hexane Fractionating of fats, oils or cacao butter
1 mg kg − 1 in oil, fat or cacao butter
Defatting of protein containing products respectively fl our
30 mg kg − 1 in defatted soy products, otherwise 10 mg kg − 1
Defatting of corn seed 5 mg kg − 1 in defatted seed Methylacetate
Extraction of for example, caffeine or other bitter constituents from tea or coffee
20 mg kg − 1 in coffee or tea
Production of sugar from molasses
1 mg kg − 1 sugar
Ethylmethylketone Fractionating of oils and fats 5 mg kg − 1 in oil or fat
Extraction of for example, caffeine or other bitter constituents from tea or coffee
20 mg kg − 1 in tea or coffee
Dichloromethane Extraction of for example, caffeine or other bitter constituents from tea and coffee
2 mg kg − 1 in roasted coffee and 5 mg kg − 1 in tea
Methanol For all products 10 mg kg − 1
Propane - 2 - ol For all products 10 mg kg − 1
Table 1.5 Residues in artifi cial fl avored products.
Solvent Max. residue (mg kg − 1 )
Diethylether 2 Hexane 1 Cyclohexane 1 Methylacetate 1 Butane - 1 - ol 1 Butane - 2 - ol 1 Ethylmethylketone 1 Dichloromethane 0.02 Propane - 1 - ol 1 1,1,1,2 - Tetrafl uoroethane 0.02
Similar guidelines, which recommend acceptable amounts for residual solvents in pharmaceuticals also exist as distributed by the European Medicines Agency [20] . Solvents that are known to cause unacceptable toxicities (class 1, e.g., benzene, carbon tetrachloride, 1,2 - dichloroethane, 1,1 - dichloroethane, 1,1,1 - trichloroethane)

10 1 Extraction of Natural Products from Plants – An Introduction
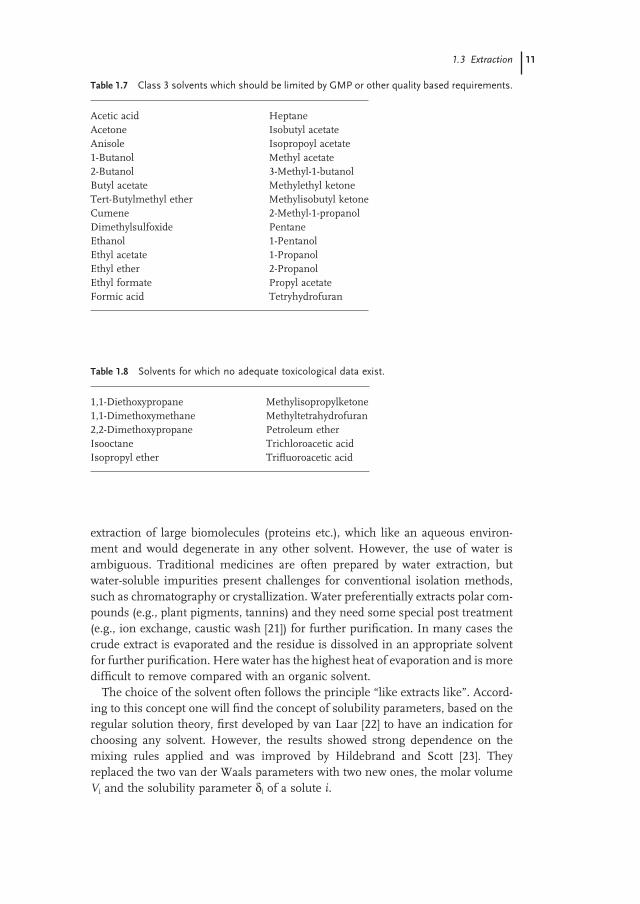
should be avoided in the production of drug substances, excipients, or drug products, unless their use can be strongly justifi ed in a risk – benefi t assessment. Some solvents associated with less severe toxicity (class 2) should be limited in their usage. Here Table 1.6 gives the “ permitted daily exposure ” ( PDE ), which is a guideline for the pharmaceutically acceptable intake of residual solvents in mg/day. Ideally, less toxic solvents (class 3) should be used where practical (Table 1.7 ). However, there remain solvents, which may also be of interest to manufactur-ers of excipients, drug substances, or drug products, as given in Table 1.8 . However, no adequate toxicological data on which to base a PDE was found. Manufacturers should supply justifi cation for residual levels of these solvents in pharmaceutical products.
However, more exotic solvents, like surfactant rich phases or ionic liquids are applied to the extraction of plants (see Chapter 3 ). The latter is a new class of solvents with almost no vapor pressure, and surfactant rich phases enable the
Table 1.6 Class 2 solvents in pharmaceutical products.
Solvent PDE (mg/day)
Acetonitrile 4.1 Chlorobenzene 3.6 Chloroform 0.6 Cyclohexane 38.8 1,2 - Dichloroethene 18.7 Dichloromethane 6.0 1,2 - Dimethoxyethane 1.0 N,N - Dimethylacetamide 10.9 N,N - Dimethylformamide 8.8 1,4 - Dioxane 3.8 2 - Ethoxyethanol 1.6 Ethylene glycol 6.2 Formamide 2.2 Hexane 2.9 Methanol 30.0 2 - Methoxyethanol 0.5 Methylbutylketone 0.5 Methylcyclohexane 11.8 N - Methylpyrrolidone 48.4 Nitromethane 0.5 Pyridine 2.0 Sulfolane 1.6 Tetraline 1.0 Toluene 8.9 1,1,2 - Trichloroethene 0.8 Xylene a) 21.7
a) usually 60% m - xylene, 14% p - xylene, 9% o - xylene with 17% ethyl benzene.
1.3 Extraction 11
extraction of large biomolecules (proteins etc.), which like an aqueous environ-ment and would degenerate in any other solvent. However, the use of water is ambiguous. Traditional medicines are often prepared by water extraction, but water - soluble impurities present challenges for conventional isolation methods, such as chromatography or crystallization. Water preferentially extracts polar com-pounds (e.g., plant pigments, tannins) and they need some special post treatment (e.g., ion exchange, caustic wash [21] ) for further purifi cation. In many cases the crude extract is evaporated and the residue is dissolved in an appropriate solvent for further purifi cation. Here water has the highest heat of evaporation and is more diffi cult to remove compared with an organic solvent.
The choice of the solvent often follows the principle “ like extracts like ” . Accord-ing to this concept one will fi nd the concept of solubility parameters, based on the regular solution theory, fi rst developed by van Laar [22] to have an indication for choosing any solvent. However, the results showed strong dependence on the mixing rules applied and was improved by Hildebrand and Scott [23] . They replaced the two van der Waals parameters with two new ones, the molar volume V i and the solubility parameter δ i of a solute i .
Table 1.7 Class 3 solvents which should be limited by GMP or other quality based requirements.
Acetic acid Heptane Acetone Isobutyl acetate Anisole Isopropoyl acetate 1 - Butanol Methyl acetate 2 - Butanol 3 - Methyl - 1 - butanol Butyl acetate Methylethyl ketone Tert - Butylmethyl ether Methylisobutyl ketone Cumene 2 - Methyl - 1 - propanol Dimethylsulfoxide Pentane Ethanol 1 - Pentanol Ethyl acetate 1 - Propanol Ethyl ether 2 - Propanol Ethyl formate Propyl acetate Formic acid Tetryhydrofuran
Table 1.8 Solvents for which no adequate toxicological data exist.
1,1 - Diethoxypropane Methylisopropylketone 1,1 - Dimethoxymethane Methyltetrahydrofuran 2,2 - Dimethoxypropane Petroleum ether Isooctane Trichloroacetic acid Isopropyl ether Trifl uoroacetic acid

12 1 Extraction of Natural Products from Plants – An Introduction
The solubility parameter δ i is defi ned as:
δ ii
i
= ΔU
V (1.1)
where Δ U i is the internal energy of vaporization and at normal pressures related to the heat of vaporization, Δ H evap , as follows:
Δ ΔU H RTi evap≈ − (1.2)
For multicomponent mixtures the Hildebrand and Scott model is:
RT Vlnγ δ δi i i= −( )2 (1.3)
with the mean solubility parameter of the solvent:
δ ϕ δ==
∑ k k
k
n
1
(1.4)
where φ is the volume fraction of the component k in the mixture which can be calculated from the molar volumes, V i , of all solutes and the solvent. A Flory – Huggins correction considers the effects of different molar volumes:
ln lnγ δ δii
ii
m
i
m
= −( ) + ⎛⎝⎜
⎞⎠⎟ + −V
RT
V
V
V
V
21 (1.5)
with
V x Vm k k
k
n
==
∑1
(1.6)
These effects exceed 10% if the molar volumes of the solutes differ more than 50% with respect to the solvent, V m and otherwise the use of this correction is recommended. The regular solution model is suitable only for non - polar mixtures of molecules that are not too different in size, the activity coeffi cients always exceed unity, and the excess enthalpy is always positive. Nevertheless, even in the absence of any other information the predictive model is quite useful in certain cases. A compilation of solubility parameters is given by Barton [24] . However, literature provides quite a number of solubility parameters [25, 26] , developed in the polymer fi eld etc. However, this concept certainly has a limited application with natural products, which are usually polar, have functional groups and the ability to form hydrogen bonds. Here the concept based on solvatochromic scales is more promising.
At a molecular scale a solvation process will take place in several stages, although only the overall process is measurable. First, a cavity must be created in the solvent to accommodate the solute. Donor – acceptor bounds between the solute and solvent will develop and dipole orientations will be induced in non - polar but polarizable solvent molecules and dipolar solutes. Once this new aggregate is formed the solvated solute may further interact with its surrounding (hydrogen

1.3 Extraction 13
bonding etc.). The Gibbs free energy change for the process of dissolution of a solute i from phase α to β is zero at equilibrium:
0 = = − + +∞ ∞ ∞
∞Δα β
α β α
β
α
βμ μ μ γγ, ,
, , ,
,ln lns ii i i
i
i
iRT
x
x (1.7)
At infi nite dilution the activity coeffi cients approach unity and with the defi nition of the distribution coeffi cient:
Kx
xi
/ i
i
i
i
α βα
β
α
βγγ
= (1.8)
and
lim ln ln , ,, ,
xK K
RT→
∞∞ ∞
= = −0
i/
ii iα β α β
β αμ μ (1.9)
The standard molar Gibbs free energy of solvation, Δμs i,∞ , can be derived from pure
component data using spectroscopic information for determining solvatochromic parameters. A generalized equation for Δμs i,
∞ with a linear dependence on solva-tochromic parameters is:
Δμ δ π α βs i i i i i,*∞ = + + + +C C C C C0 1
22 3 4 (1.10)
Here δ i2 is the cohesive energy density of the solvent which is the square of the
Hildebrand solubility parameter; α i and β i characterize respectively activity and basicity which in general represents the ability to form hydrogen bonds; π i
* defi nes the polarity or polarizability of the solvent.
The estimation of solvatochromic parameters is based on the empirical rule that absorption signals in spectrometry are shifted due to solvent interactions. The estimation of solvatochromic parameters is on an empirical basis which says that the position, ξ , of different solutes (indicators) in spectra of a solvent is a linear function:
ξ π α β= + + +C C C C0 1 2 3i i i* (1.11)
C 0 , . . . , C 3 are properties of the indicator and π * , α i and β i are properties of the solvent. With different analytical methods (NMR, UV - VIS etc.) and different indi-cators the solvatochromic parameters of a solvent can be estimated. These linear relationships not only correlate spectroscopic positions of indicators in dif-ferent solvents, but can also be used to correlate the infl uence of the solvent on reaction equilibria and solubilities. In principle it considers differences in the Gibbs free energy resulting from a change of the electron confi gurations in a molecule.
There exists a number of such linear solvatochromic scales. One of the most widely used is that of Kamlet and Taft which is the basis of the LSER ( linear solva-tion energy relationship s) [27, 28] . The Nernst distribution (concentration ratio of the solute in organic to aqueous phase) according to Kamlet is:
log *D C C V C C C Ci i i i i∞ = + + ∂ + + +0 1 2 3 2 2π α β (1.12)

14 1 Extraction of Natural Products from Plants – An Introduction
Here the cohesive energy density in Equation 1.10 is replaced by the molar volume V i of the solute (as a measure of the size of the cavity to accommodate the solute i in the solvent) and ∂ i is an empirical parameter which takes also account for polarizability π * . A major disadvantage of the methods above is the limited predictivity and applicability of those correlations, since they have not been devel-oped in the fi eld of natural substances. However, a newer approach relies on the equation of state concept as is discussed in Chapter 2 , with promising results in respect to predictability of solubilities.
Besides solubility, which is a key feature in obtaining a crude extract with any solvent, there are additional criteria for solvent selection, similar to those in liquid – liquid extraction.
• Selectivity – high selectivity enables fewer stages to be used. If the feed is a complex mixture where multiple components need to be extracted, group selectivities become important.
• Recoverability of solvent – recovery of the solvent phase should be easy. If evaporation or distillation is used the solvent should have a low heat of evapora-tion, should not form azeotropes, and be easily condensed by cooling water. With liquid CO 2 or other subcritical fl uids only a fl ash is necessary. Ionic liquids cannot be evaporated thus the product must be volatile. However, if alkylated tertiary amines (e.g., trioctylamine) is used in acidic media (e.g., HCl), the ionic liquid forms by itself (e.g., trioctylammoniumchloride). This reaction can be reversed by alkali and the free amine can then be distilled. If surfactant phases are used, a recovery is then with ultrafi ltration.
• Viscosity and melting point – high viscosities reduce the mass transfer effi -ciency and lead to diffi culties with pumping and dispersion. The melting temperature of the solvent should preferably be lower than ambient for ease of handling.
• Surface tension – low surface tension promotes wetting of the solids. Wetting ability is important since the solvent must penetrate the matrix (pores, capil-laries etc.).
• Toxicity and fl ammability – for food processing only nontoxic solvents will be taken into consideration. In general, any hazard associated with the solvent will require extra safety measures. As to this, aliphatic diluents are preferred to aromatic or halogenated ones.
• Corrosivity – corrosive solvents increase equipment cost but might also require expensive pre - and post - treatment of streams.
• Thermal and chemical stability – it is important that the solvent should be thermally and chemically stable as it is recycled. Especially it should resist breakdown during the solvent recovery in an evaporator.
• Availability and costs – solvent should be ready available. It is not the price of the solvent that is important, but the annual cost due to the inevitable operation losses.

1.4 Extraction Techniques 15
• Environmental impact – the solvent should not only be compatible with down-stream process steps, but also with the environment (minimal losses due to evaporation, solubility and entrainment). Removal of solvents from residual plant material (and spent solids) can cause serious problems and post treat-ment may be necessary to reduce the residue level. This is mainly by mechani-cal pressing since further treatment using another solvent is not economic.
1.4 Extraction Techniques
Leaching or solid – liquid extraction is a separation process where often no sharp interface for mass transfer can be defi ned. In many natural product extraction processes the “ solid ” contains or is impregnated by a liquid phase. In the extrac-tion of sucrose from beet the cell walls prevent undesired and high molecular constituents from being extracted. Thus the beet is prepared in long strips in order to minimize damage to the cell walls. If fatty oils are extracted the solute is itself a liquid and will diffuse more easily resulting in a faster mass transfer. The latter is markedly affected if the solute is solid or liquid, incorporated within, chemically combined with, adsorbed upon, or mechanically in a pore structure of the insolu-ble material [29] .
In that respect a pre - treatment to change the initial matrix structure is generally recommended. The classical approach is with grinding (bead milling) to gain smaller particles, which can be more easily penetrated by the solvent. Alternatively, enzymatic treatments, freezing and thawing or very often a swelling process in pure water gives an improvement. In Figure 1.10 ground leaves of S. lavendulifolia were soaked at pH = 7, 3 and 12 and the maximum yield in an alcohol extract was with pure water after four hours [30] . However, soaking of fresh plant material with organic solvents (ethanol, methanol) is recommended, since enzymes will be denatured, preserving the solute undamaged. More drastic approaches use hot
Figure 1.10 Pre - treatment at 298 K (pH = 7, pH = 3 and pH = 12).
1
1.8
1.6
1.4
1.2
1.0
0.8
0.6
0.4
0.2
0.0
2
Yie
ld (
%)
4 6
Pretreatment (h)
8 24 24(pH3) 24(pH12)

16 1 Extraction of Natural Products from Plants – An Introduction
steam or cooking. Materials destined for oil production containing large amounts of proteins (e.g., cottonseeds, soya beans, fl ax seeds, sesame seeds, peanuts) must be cooked in order to coagulate the proteins before oil extraction. Expanding vapors from any pressurized apparatus increase porosity due to explosion, like evapora-tion from the solid cells [31] . An alternative to this is to use pulsed electric fi elds [32] or ultrasound [33] to destroy the cell walls and facilitate extraction. However, this is mainly used in bench - scale equipment [34] , since with such fi elds it is diffi cult to adjust penetration depth and energy effi ciency at larger scales.
In terms of extraction procedures one has to distinguish between batch and continuous operations. The latter are frequently applied with suspensions or slur-ries but apparatuses for continuous solid extraction are also widely used [31, 35] .
Maceration is preferably used with volatile or thermal instable products, it is a “ cold ” extraction of pulverized feed material in any solvent. A well - known example is the extraction of color, tannin and aroma from red grape skins by alcohol during the fermentation process, or is used to produce any perfume stock. This can be supported by enzymatic processes, as discussed in Chapter 7 in this book. If this process is then at higher temperatures it is called digestion, which in daily life everybody is familiar with tea preparation. The main disadvantage of this process is the sometimes long duration (hours) and the solvent consumption in a batch stirred tank.
When the mean diameter of the feed material increases percolation is a widely used technique. The solvent is poured on top of the solid material and allowed to percolate through the bed. However, fi ne powders and plants may swell (e.g., containing mucilages) and can clog the percolator. The apparatus side (see also Chapter 6 in this book) is well established with carrousels, baskets, sliding cells etc. and found in daily life with for example, fi lter coffee preparation.
As mentioned at the beginning, a very effi cient form is Soxhlet extraction [36] which was originally designed for the extraction of a lipid from solid material. The solvent is heated to refl ux (condensed) and percolates the solid material. The dis-advantage is that the solute is always at the boiling temperature of the solvent, which may cause damage of thermolabile compounds. An alternative to this is distillation, which can only be used with volatile compounds. The vapors from steam distillation are condensed and a two - phase distillate (oil and water) is obtained. The boiling point of this practically immiscible oil – water mixture is always beneath 100 ° C, since each constituent independently exerts its own vapor pressure as if the other constituent is not present and thus high boiling thermo-sensitive oils (e.g., lavender oil and other fragrances) can be effi ciently prepared.
The mathematical treatment of mass transfer and co - and counter - current appa-ratus balances is very often found also under “ leaching ” [35] . It is sometimes convenient to use right - angled triangular diagrams to represent the process. In Figure 1.11 a counter - current process is depicted. In a multistage operation the overall apparatus balance is
F E R E+ = +i i 1 (1.13)
or

1.5 Purifi cation 17
P F E R E= − = −1 i i (1.14)
Where F is the feed, E 1 is the loaded and E i the fresh solvent and R i is the raffi nate after the i th stage. All the R i lie on a pseudo - equilibrium curve, which has to be determined experimentally. The true equilibria with solids extraction are often diffi cult to determine, due to the sometimes very slow extraction kinetics (see also Chapter 6 in this book). The construction of the stages is similar to the Hunter – Nash concept with liquid – liquid extraction [37] . However, since the solvent is not soluble in the solid all the tie lines meet at the solid corner. This is depicted in Figure 1.11 with four stages of extraction.
1.5 Purifi cation
The purifi cation methods relay mainly on chromatography and the fi nal product is then obtained by crystallization (see also Chapter 5 in this book). In applications with nutraceuticals, cosmetics and fragrances there is no needs for ultrapure products, which is in strong contrast to the pharmaceutical fi eld. Chromatographic methods are very fl exible due to their separation principles, which are described below.
1.5.1 Chromatography
1.5.1.1 Adsorption Chromatography Adsorption chromatography or liquid – solid chromatography is the oldest form of chromatography. The sample components are adsorbed on the surface of the
Figure 1.11 Right - angled triangular diagram for counter - current solid extraction.
P
Solid Solvent
E4R4
E3
E2
E1
R1
R2
R3
F
Solute
18 1 Extraction of Natural Products from Plants – An Introduction
adsorbent and displace the initially loosely adsorbed solvent molecules. Adsorption chromatography gives best results for non - ionic, organic - soluble samples of inter-mediate molecular weights. Water - soluble substances can also be separated satis-factory, but one of the other methods gives usually better results. The stationary phase (the adsorbent) is often a polar solid (almost always silica or alumina), that is used in connection with a non - polar liquid. The (polar) functional groups of the sample components are then easily attracted by the adsorbent surface and displace the non - polar solute molecules. The quality of the separation strongly depends on the solute used. For low pressure separations also charcoal is used. Here we have a non - polar adsorbent that is used with a non - polar mobile phase. The adsorption depends on the polarizability of the sample molecule and thus compounds of higher refractive index are stronger adsorbed.
1.5.1.2 Partition Chromatography Partition chromatography can be divided into liquid – liquid chromatography ( LLC ) and chromatography on chemically bonded phases . It involves two immiscible liquids, one as the mobile phase and the other being fi xed on a solid support as the station-ary phase. The principle of the separation is an extraction process. The stationary liquid can either be fi xed on the solid by physical adsorption (LLC), which is easy, but leads to a continuous loss of stationary phase, or by chemical bonds, which is now the most often applied method.
In the case of a polar stationary phase (usually on a silica or alumina support) and a non - polar mobile phase, the process is referred to as normal phase ( NP ) (liquid) liquid chromatography, for historical reasons. In the opposite case it is called reversed phase ( RP ) (liquid) liquid chromatography. Partition chromatogra-phy is suitable for a great number of substances in a wide polarity range.
Two special cases of partition chromatography are chiral liquid chromatography , which has gained great economic importance for separating racemates in drug generation, and ion pair chromatography . Ion pair chromatography is a kind of RP chromatography, that is used for the separation of ionic substances. Here the ions to be analyzed or separated are retained on the stationary phase together with their counter - ions that are delivered with the mobile phase. Desorption is often done with an aqueous solution containing a water - soluble organic solvent like methanol. Ion pair chromatography often competes with ion exchange chromatography .
1.5.1.3 Ion Exchange Chromatography Here the two - phase system is made by putting swollen particles of an ion exchanger in contact with an aqueous solution of a mixture of components. If the compo-nents form ions in the solution, then electrostatic interactions take place with the ionogenic functional groups of the ion exchanger, which is accompanied by ion exchange. The strength of the interaction is infl uenced by the charge of the iono-genic component, that is, by the charge on the ion and the dissociation constant. Further on, the process is diffusion limited and thus infl uenced by the diffusion coeffi cient of the ions and therefore by the effective size of the hydrated ions. The various types of ion exchangers can be classifi ed as follows [38, 39] :

1.5 Purifi cation 19
• cation exchangers • anion exchangers • amphoteric and dipolar ion exchangers • chelating ion exchangers • selective (or specifi c) ion exchangers
Cation and anion exchangers are the simplest ion exchange resins. They have cations (or anions respectively) bound to a matrix, that can be exchanged with ionic sample components. Amphoteric ion exchangers contain both cation and anion exchanging groups in their matrix. These ion exchangers are capable of forming internal salts which dissociate in contact with the sample electrolytes and thus can bind both anionic and cationic components. Dipolar ion exchangers are a special kind of amphoteric ion exchangers . In this case, amino acids are bound to the matrix. They form dipoles in an aqueous solution, which interact especially selective with biopoly-mers. Chelating ion exchangers carry functional groups capable of forming a complex bond with metal ions. They bind heavy metals and alkaline earth metals preferen-tially. Selective ion exchangers have a limited binding ability and bind some ions only. Specifi c ion exchangers have a stricter limitation. They react with one type of ion only.
1.5.1.4 Gel Chromatography Gel chromatography is often called size exclusion chromatography ( SEC ) , because here mixtures are separated due to their unequal size. The stationary phase consists of swollen gel particles with a pore size that enables the small molecules of a sample to penetrate into the pores, while medium size molecules only partially enter the pores and the greatest molecules are completely excluded from the pores. Gel chro-matography can be used with a hydrophobic mobile phase, it is then also called gel permeation , and with a hydrophilic mobile phase, then referred to as gel fi ltration .
1.5.1.5 (Bio - ) Affi nity Chromatography Affi nity chromatography is the newest variant of liquid chromatography. This technique exploits the unique biological specifi city of the protein – ligand interac-tion. This concept is realized by binding the ligand to an insoluble support just as in partition chromatography on chemically bonded phases . The ligands may have low or high molecular weight and consist of nucleic acids, enzymes or many other compounds. Using the prepared substance as the column packing, certain pro-teins with an appreciable affi nity for the ligand will be retained. These can be eluted by altering the composition or pH of the mobile phase to favor dissociation and weaken the binding of the ligand.
1.5.2 Continuous Techniques
The mechanical techniques are with batch, semi - continuous and continuous chro-matographic apparatuses [40] . Since batch chromatography is well known and discussed elsewhere [41] , a short review is given on continuous concepts.

20 1 Extraction of Natural Products from Plants – An Introduction
1.5.2.1 True Moving Bed ( TMB ) Chromatography This was the fi rst attempt to achieve a continuous counter - current chromato-graphic process. The solid phase goes down the column due to gravity; when it exits the system, it no longer contains adsorbed products and is thus recycled to the top of the system. The liquid stream follows exactly the opposite direction. It moves upwards and is recycled from the top to the bottom of the column. Feed, containing the components A and B in the binary case, is injected in the middle and fresh desorbent at the bottom.
Provided that the affi nity of A and B for the adsorbent is different (A being the more retained than B), it is possible to adjust the fl ow rates in order to make B move upward with the fl uid stream and A move down with the solid, leading to a spatial separation. This system requires one inlet and two outlet lines (one for the raffi nate containing B and one for the extract with purifi ed A). Figure 1.12 shows the principle of the TMB - process.
However, moving bed systems tend to suffer from:
• diffi culties in achieving packing fl ow control • low mass transfer effi ciencies due to an uneven column packing • packing attrition due to the increased shear forces • relatively low mobile phase velocities to prevent fl uidization of the chromato-
graphic bed.
Because of all these disadvantages, the TMB - process has never been successfully applied. Nevertheless the underlying idea leaded to the development of the widely used simulated moving bed ( SMB ) process. Knowledge of the TMB process helps in understanding and operating an SMB plant.
1.5.2.2 Simulated Moving Bed ( SMB ) Chromatography As will be shown, most of the benefi ts of a true counter - current operation can be achieved by using several fi xed bed columns in series and appropriate shift of the injection and collection points. This is the SMB concept.
Figure 1.12 True moving bed chromatography.
Feed A + B
A (Raffinate)
B (Extract)
Adsorbent Eluent
column
.

1.5 Purifi cation 21
In an SMB plant the inlet and outlet lines are moved step by step between a given number of fi xed - bed columns. The solid is no longer moving. Its fl ow is only simulated by shifting the external lines. In fact, this simulated solid fl ow rate is directly linked to the shift period. Due to the shifting of the inlet/outlet ports in direction of the liquid fl ow the solid is still moving with respect to the external lines.
After the start - up period a quasi stationary state is reached, where the concentra-tion profi les move periodically with respect to the inlets and outlets. For an infi nite number of columns and an infi nitely low shifting time, the profi les are the same is in the TMB process. Figure 1.13 shows the principle of the SMB process.
The feed is pumped continuously into the four - column continuous system, as well as the mobile phase, while two streams of products, the raffi nate and the extract, are recovered continuously. The components entering with the feed must exit with one of the products. By focusing on the view from the feed port it becomes apparent that one fraction moves up - stream from the feed to the extract port and the other moves downstream to the raffi nate port. In order to keep the concentration profi les within these columns it is necessary to switch the feed and outlet ports all together to the left to get a quasi - stationary operation. The triangu-lar theory of Morbidelli allows to calculate the fl ow ratios to obtain pure compo-nents and a stable operation [42] .
Figure 1.13 Simulated moving bed (SMB) chromatography.
22 1 Extraction of Natural Products from Plants – An Introduction
The separation operation is carried out at high concentrations. This allows the full use of the non - linear effects, and especially the displacement effect, to enhance separation and production rate. Due to the counter - current operation, the mass transfer between liquid and solid phase is enhanced leading to a better use of the adsorbent and fi nally to a higher productivity compared to conventional batch processes. Furthermore, the desorbent consumption can be drastically reduced. All these advantages made this process the most widely used among all continuous chromatographic processes. However, the following drawbacks should be recognized:
• high complexity leading to diffi culties in operation and making the design diffi cult and time consuming;
• only two fractions can be collected with a single plant; • long start - up period.
1.5.2.3 Annular Chromatography Here the adsorbent is fi lled between two concentric cylinders which are slowly rotated along their vertical axis. The feed is introduced at a small stationary region at the top of the device. The eluent is also introduced at the top, but is uniformly distributed all along the circumference except the region where the feed is intro-duced [43] .
The rotation affects the separated components to appear as helical bands each of which has a characteristic, stationary exit point. As long as conditions remain constant, the retention time of each component and thus the angular displacement from the fi xed feed entry will also remain constant, so that the separated compo-nents can be collected at fi xed stationary outlets. Hence the separation process is truly continuous. Figure 1.14 shows the principle of this process.
Also the inverse principle, where not the annulus fi led with the stationary phase is rotated, but the feed inlet and the outlet ports. The principle is very similar to the classical batch chromatography in a single column. The time dependent sepa-ration of batch chromatography is transformed in a spatial angle dependent sepa-ration. The productivity of both processes is comparable. The modes of batch chromatography, that is, gradient elution, recycle chromatography, displacement chromatography and frontal analysis can also be applied in annular chromatogra-phy. One main advantage of this process in comparison to other continuous chromatographic processes is the simple feasibility of multicomponent separa-tions [44, 45] .
1.5.2.4 Carrousel Adsorbers Several fi xed columns are located in a circle on a carrousel. The origin is with ionic separation s ( ISEP ) and liquid adsorption or chromatographic separation s ( CSEP ) [46] . The carrousel with up to 30 columns rotates stepwise, while the introduction and withdrawal is done via at fi xed positions via multiport - valves. The connection of the columns with each other and to the inlets and outlets is very fl exible, so that a counter - current operation like in an SMB or a co - current stream similar to annular chromatography can be realized. Figure 1.15 shows the carrousel principle

1.5 Purifi cation 23
with a resin volume from 1 liter to 300 m 3 . The plants are used especially in food industry in large dimensions (carrousel diameters of several meters).
However, there exist other niche techniques like, for example, circular chroma-tography or annular electrochromatography, which offer high numbers of separa-tion stages [47, 48] , but are very limited in throughputs and only applicable to high value pharmaceutical applications.
Figure 1.14 Annular chromatography (a) principle, (b) photo.
(a) (b)
Figure 1.15 Carrousel absorbers (CSEP ® ).

24 1 Extraction of Natural Products from Plants – An Introduction
References
1 Levey , M. ( 1959 ) Chemistry and Chemical Technology in Ancient Mesopotamia , Elsevier , Amsterdam, The Netherlands .
2 Holmyard , E.J. ( 1957 ) Alchemy , A348 Pelican Books , Harmondsworth, Middx, UK .
3 Bla ß , E. , Liebl , T. and H ä berl , M. ( 1997 ) Chem. Ing. Tech. , 69 , 431 .
4 Ebeling , E. ( 1949 ) Orientalia , 17 , 129 . 5 Ebeling , E. ( 1949 ) Orientalia , 18 , 404 . 6 Ebeling , E. ( 1949 ) Orientalia , 19 , 265 . 7 Joachim , H. ( 1973 ) Papyros Ebers:
Das ä lteste Buch ü ber Heilkunde , W. de Gruyter - Verlag , Berlin .
8 Cannell , R.J.P. ( 1990 ) How to approach the isolation of a natural product, in Natural Products Isolation , in Methods in Biotechnology, vol. 4 (ed. R.J.P. Cannell ), Humana Press Inc. , Totowa, NJ, USA , pp. 1 – 52 .
9 http://en.wikipedia.org/wiki/natural_products (accessed 3 March 2009).
10 El - Mansi , E.M.T. (ed.) ( 2007 ) Fermentation Microbiology and Biology , 2nd edn , CRC Press , Boca Raton, USA .
11 Keller , K. , Kn ö ss , W. , Reh , K. and Schn ä delbach , D. ( 2003 ) Phytopharmaka – Begriffsbestimmungen und Hintergr ü nde . Bundesgesundheitsbl - Gesundheitsforsch - Gesundheitsschutz , 46 , 1036 . doi: 10.1007/s00103 - 003 - 0735x
12 Pzyrembel , H. ( 2003 ) Arzneipfl anzen in Nahrungserg ä nzungsmitteln . Bundesgesundheitsbl - Gesundheitsforsch - Gesundheitsschutz , 46 , 1074 . doi: 10.6007/s00103 - 003 - 0738.7
13 B ä cker , W. et al. (eds.) 2004 , http://www.processnet.org/_positionspapiere.html (accessed 1 February 2011).
14 Bart , H. - J. , Bischoff , F. , Ulber , R. and Schmidt , M. ( 2006 ) Vom Naturstoff zum Wertstoff . Paper at “ Gr ü ne Woche Rheinland - Pfalz, ” 17. - 20.1.2006, Ingelheim, Germany .
15 Mahlberg , B. ( 2009 ) DLR - Rheinpfalz, personal communication.
16 Bundesministerium f ü r Gesundheit und Soziale Sicherung (ed.) ( 2009 ) Deutsches Arzneibuch 2009 , (DAB 2009), 6. Ausgabe Grundwerk 2008 mit Nachtrag
6.1 und 6.2. 2009. Amtliche deutsche Ausgabe Deutscher Apotheker Verlag , Stuttgart, Germany .
17 Z ö phel , B. and Kreuter , T. ( 2001 ) Nachwachsende Rohstoffe (Hanf, Flachs, Salbei und Kamille) - Anbau und Betreuung f ü r den Lebensraum Acker in Sachsen , S ä chs. Landesamt f ü r Umwelt und Geologie , Dresden, Germany , pp 1 – 64 .
18 Extraktionsl ö semittelverordnung, B.G.B.L., II Nr. 465/1998 ( 1998 ) Bundeskanzleramt, Vienna.
19 Lack , E. and Simandi , B. ( 2001 ) Super fl uid extraction and fractionating from solid materials , in High Pressure Process Technology: Fundamentals and Applications (eds A. Bertucco and G. Vetter ), Elsevier , Amsterdam, The Netherlands , pp. 537 – 575 .
20 European Medicines Agency , ( 2006 ) ICH Topic Q3C (R3), Impurities: Residual Solvents , (March 1998 CPMP/IHC/382/95) http://www.ema.europa.eu/docs/en_GB/document_library/Scientifi c_guideline/2009/09/WC500002674.pdf (accessed 3 March 2009).
21 Jones , W.P. and Kingkorn , A.D. ( 2006 ) Extraction of plant secondary metabolites , in Natural Products Isolation , (eds S.D. Sarker , Z. Latif and A.I. Gray ), Methods in Biotechnology , Vol. 20 , 2nd edn , Humana Press , Totowa, NJ, USA , pp. 323 – 351 .
22 Van Laar , J.J. ( 1990 ) Z. Phys. Chem. , 72 , 723 .
23 Hildebrand , J.M. and Scott , R.L. ( 1950 ) The Solubility of Nonelectrolytes , 3rd edn , Reinhold , New York, USA .
24 Barton , A.F.M. ( 1991 ) Handbook of Solubility Parameters and Other Cohesion Parameters , 2nd edn , CRC Press , Boca Raton, USA .
25 Hansen , C. ( 2007 ) Hansons Solubility Parameters, A User ’ s Handbook , 2nd edn , CRC Press , Boca Raton, USA .
26 Fedors , R.F. ( 1974 ) Polym. Eng. Sci. , 14 , 2 , 147 .
27 Kamlet , M.J. , Abont , J.L.M. and Taft , R.W. ( 1981 ) Prog. Phys. Org. Chem. , 13 , 483 .

References 25
28 Kamlet , M.J. , Abont , J.L.M. , Abraham , M.M. and Taft , R.W. ( 1983 ) J. Org. Chem. , 48 , 2877 .
29 Dahlstrom , D.A. , et al. ( 1997 ) Liquid - solids operation and equipment , in Perry ’ s Chemical Engineer ’ s Handbook , 7th edn (eds R.H. Peny and D.W. Green ), Mc Graw Hill , New York, USA , pp. 1 – 59 .
30 Bart , H. - J. and Schmidt , M. ( 2007 ) Chem. Ing. Tech. , 79 , 5 , 663 .
31 Eggers , R. and Jaeger , R.T. ( 2003 ) Extraction systems , in Extraction Optimization in Food Engineering (eds C. Tzia and G. Liadakis ), Marcel Dekker , New York , pp. 95 – 136 .
32 Savova , M. , Bart , H. - J. and Seikova , I. ( 2005 ) J. Univ. Chem. Techn. Metallurgy , 40 , 251 .
33 Cseke , L.J. , et al. (ed.) ( 2006 ) Natural Products from Plants , 2nd edn , CRC Press , Boca Raton, USA .
34 Ganeva , V. , et al. ( 2004 ) Biotechnol. Lett. , 26 , 933 .
35 Coulson , J.M. , Richardson , J.F. , Backhurst , J.R. and Harker , J.H. ( 1995 ) Chemical Engineering , vol. 2 , 4th edn , Pergamon Press , Oxford, UK .
36 Soxhlet , F. ( 1879 ) Polytechnisches J. , (Dingler ’ s) 232 , 461 .
37 Hunter , T.G. and Nash , A.W. ( 1934 ) J. Chem. Soc. , 53 .
38 Marr , R. and Bart , H. - J. ( 1992 ) Chem. Ing. Tech. , 54 , 119 .
39 Ladisch , M.L. ( 2001 ) Bioseparation Engineering, Principles, Practice and
Economics , Wiley Interscience , New York, USA .
40 Schulte , M. , Wekenbourg , K. and Strube , J. ( 2007 ) Continuous chromatography in the downstream processing of products of biotechnology and natural origin , in Bioseparation and Bioprocessing , vol. 61 , 2nd edn (ed. G. Subramanian ), Wiley - VCH Verlag GmbH , Weinheim, Germany , pp. 225 – 255 .
41 Guichon , G. ( 2002 ) Basic principles of chromatography , in Ullmann ’ s Encyclopedia of Industrial Chemistry , 6th edn , Wiley - VCH Verlag GmbH , Weinheim, Germany , pp. 1 – 31 .
42 Sorti , G. , Mazzotti , M. , Morbidelli , M. and Carra , S. ( 1993 ) AIChE J. , 39 , 471 .
43 DeCarli , J.P. , II , Carta , G. and Byers , C.H. ( 1990 ) AIChE J. , 36 , 1220 .
44 Bart , H. - J. , Wolfgang , J. , Prior , A. and Byers , C. ( 1998 ) Chem. Ing. Tech. , 70 , 142 .
45 Reissner , K. , Prior , A. , Wolfgang , J. and Bart , H. - J. ( 1997 ) J. Chromatogr. A , 763 , 49 .
46 Calgon Carbon Corporation , ( 2009 ) Ion Exchange Technologies . http://www.calgoncarbon.com/ion_exchange/index.html (accessed 29 November 2010).
47 Bart , H. - J. ( 2009 ) Vorrichtung f ü r kont. Kapillarelektrochromatographie. German Patent Application, 102009013899.4.
48 Barker , P.E. ( 1966 ) Brit. Chem. Engng. , 11 ( 3 ), 203 .
