1 financial statement analysis. 3-2 standardized financial statements common-size balance sheets...
TRANSCRIPT

1
Financial Statement Analysis
3-2
Standardized Financial Statements
• Common-Size Balance Sheets– Compute all accounts as a percent of total assets
• Common-Size Income Statements– Compute all line items as a percent of sales
• Standardized statements make it easier to compare financial information, particularly as the company grows
• They are also useful for comparing companies of different sizes, particularly within the same industry

3
• Prufrock corporation balance sheet
4
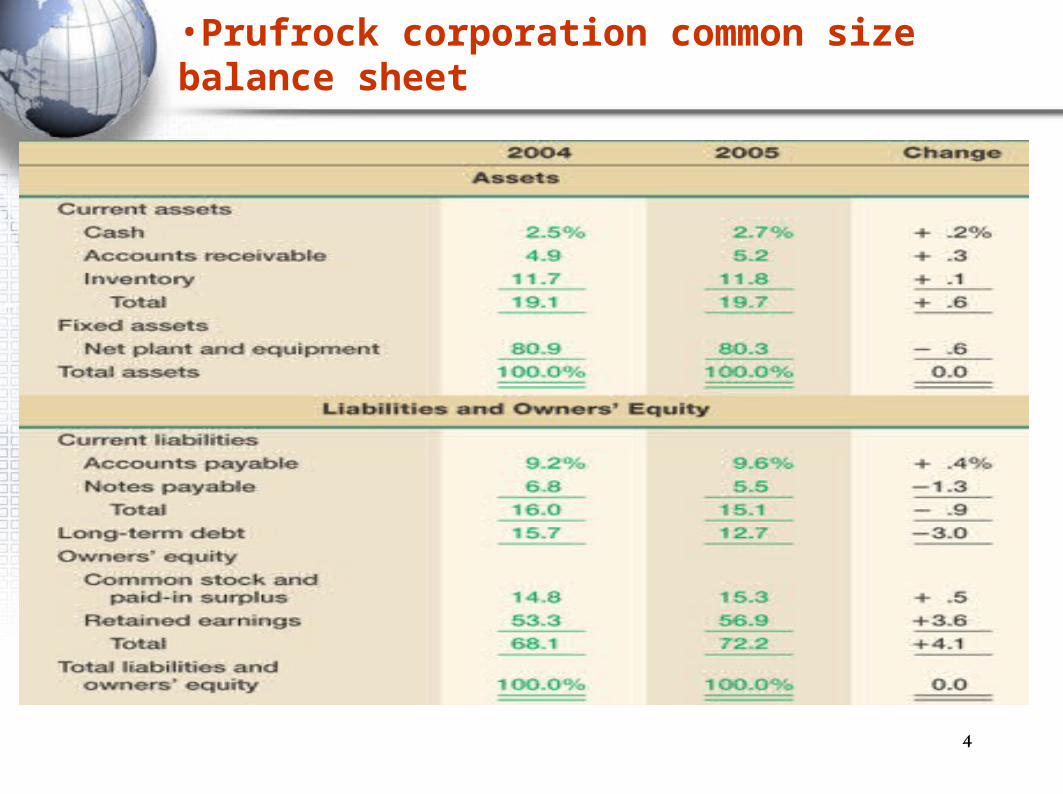
•Prufrock corporation common size balance sheet

3-5
Common-Size Balance Sheet
• Notice that total change has to be zero because the beginning and ending numbers must add up to 100 percent.
• Also notice that the statement is relatively easy to read and compare (for example: CA increased from 19.1 to 19.7%, CL decreased from 15.7 to 12.7%)
6
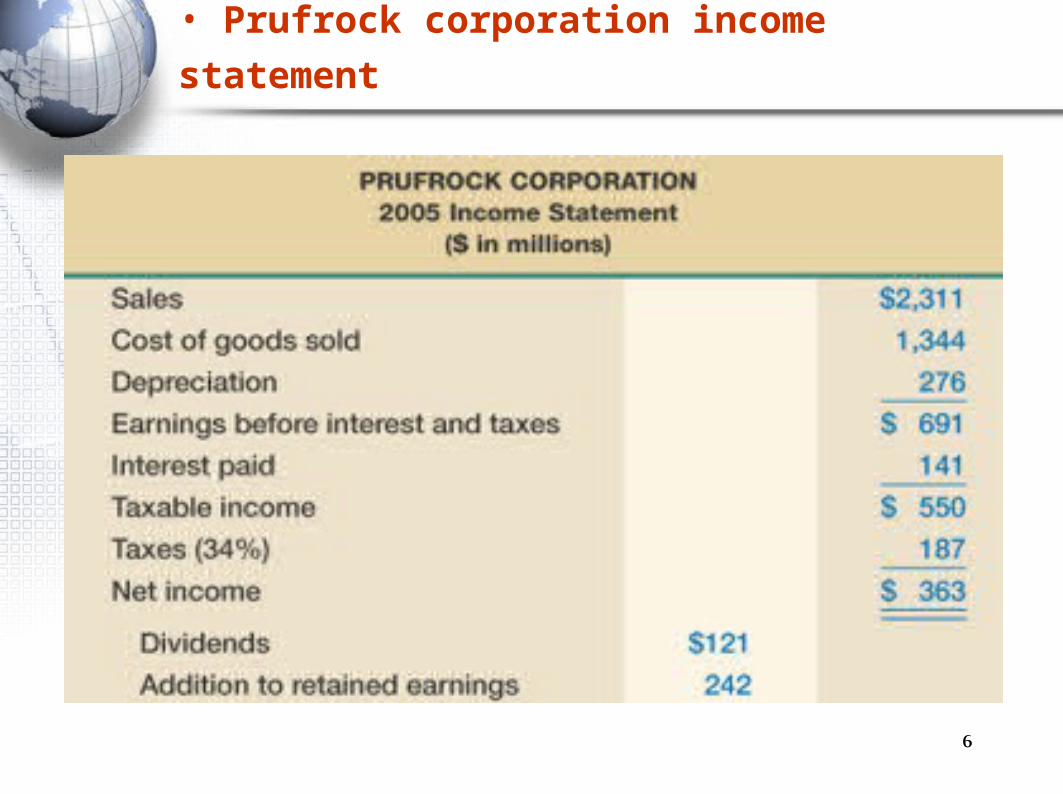
• Prufrock corporation income statement

7
•Prufrock common- income statement
3-8
Common-Size Income Statements
• Common-Size Income Statement tells us what happens to each dollar in sales (for example: we pay taxes $.061 of each $1 in sales)
• Notice that the percentages are useful in comparisons, such as cost control.

3-9
Common-Base Year Financial Statements
• Common-Base Year Financial Statements (Trend Analysis): Select a base year and then express each item or account as a percent of the base-year value of that item. This is useful for picking up trends through time.
•
3-10
Combined Common-Size and Base
• Combined Common-Size and Base (Year Analysis):Express each item in base year as a percent of either total assets or sales. Then, compare each subsequent year’s common-size percent to the base-year percent (abstracts from the growth in assets and sales).
3-11
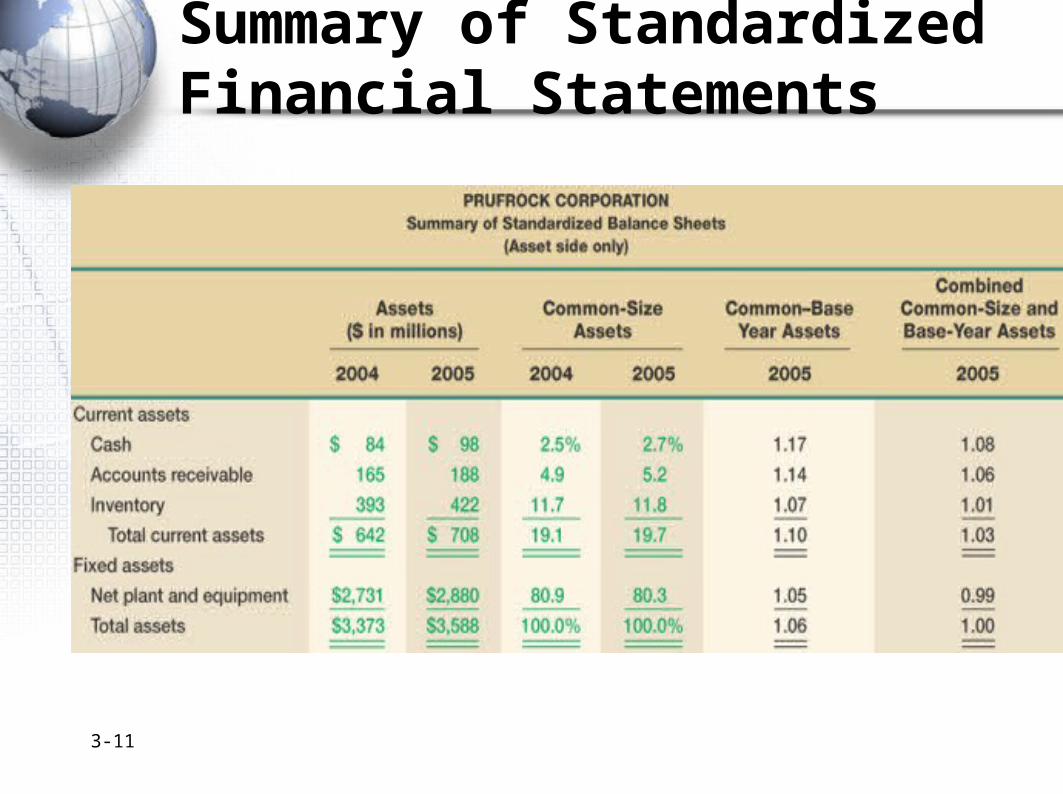
Summary of Standardized Financial Statements

12
Financial Statement Analysis
• Another way of avoiding the problem involved in comparing of different sizes is to calculate and compare financial ratios.
• Ratio analysis is a quick and easy way of analyzing a firm’s financial statements.
• Financial ratio itself is not meaningful without comparing it to a benchmark. Benchmarks can be a rival firm’s financial ratio or an industry average.
13
Financial Statement Analysis
Ratio analysis– Financial ratios: Relationships determined from a
firms financial information and used for comparison purposes.
– Ratios also allow for better comparison through time or between companies.
– As we look at each ratio, ask yourself what the ratio is trying to measure and why is that information is important.
– Ratios are used both internally and externally.

14
Categories of Financial Ratios
1. Short-term solvency, or liquidity, ratios: The ability to pay bills in the short-run.
2. Long-term solvency, or financial leverage, ratios: The ability to meet long-term obligations.
3. Asset management, or turnover, ratios: Efficiency of asset use.
4. Profitability ratios: Efficiency of operations and how that translates to the “bottom line”.
5. Market value of ratios: How the market values the firm relative to the book values.

15
1. Liquidity Ratios
– Provide information about the firm’s liquidity.
– It is also called liquidity measures and primary concern is the ability of the firm to pay it’s bills over the short run without undue stress.
– It focus on current asset and current liability.

16
1. Liquidity Ratios
– This ratio is interesting to short term creditors.
– This ratio is important to firms because they deal with banks and other short term lenders.
– A disadvantage: current assets and current liabilities can and do change fairly so that today’s amount may not be a reliable guide to the future.

17
1. Liquidity Ratios
A) Current ratio: measures short term liquidity.
Current Ratio = current assets / current liabilities
708/540 =1.31 times• It mean that the company has 1.31 in CA for every 1$ in
CL.• The higher this ratio the better but sometimes it means inefficiency
in using cash and other short tem assets– Standard: 2:1– The unit of measurement is either dollar or times– Any current ratio less than 1 means negative networking
capital

18
1. Liquidity Ratios
B) The quick ratio: is quite a bit lower than the current ratio• Quick Ratio = (current assets – inventory) /
current liabilities
)708 – 422 / (540. = 53 times
– Standard 1:1• Because inventory i the least liquid CA, so
it omit inventory from CA, it mean that the company has .53 in CA except the inventory for every 1$ in CL.

19
1. Liquidity Ratios
C) Cash Ratio = cash / current liabilities
98 / 540. = 18 times
– Normally a very short term creditor interested in this ratio. This company carries a low cash balance, although the cash ratio has increased substantially from the previous year (.03 in 2002).
– This may be an indication that they are aggressively investing in assets that will provide higher
20
1. Liquidity Ratios
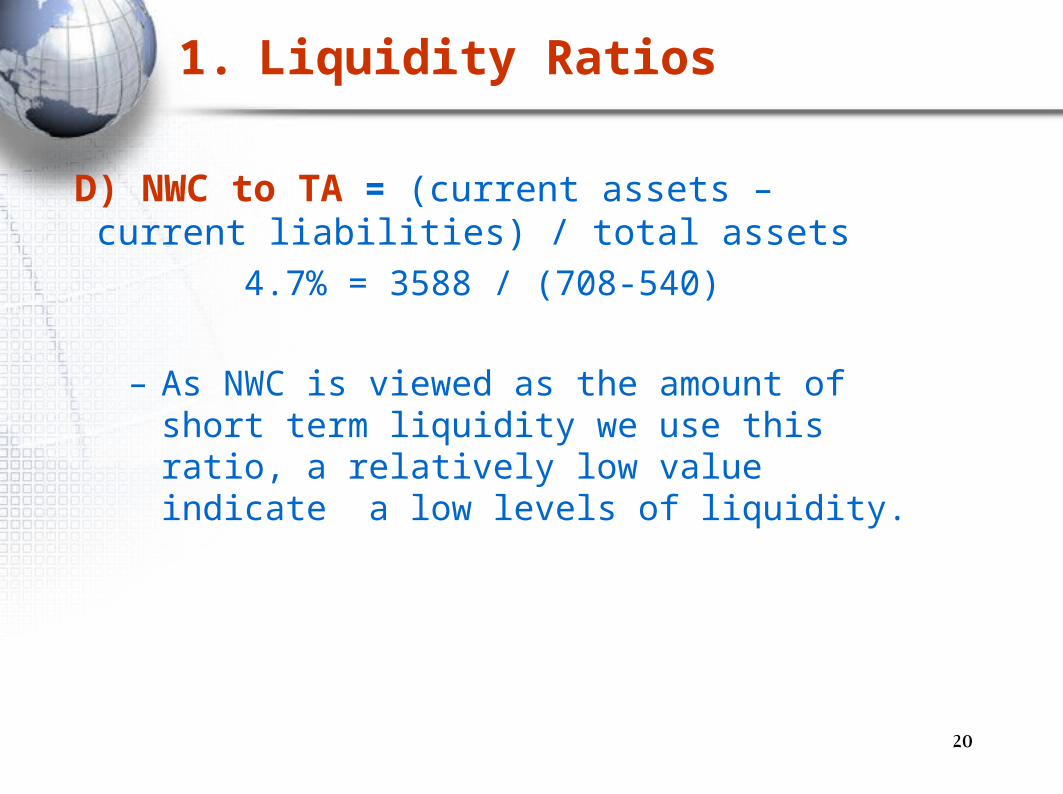
D) NWC to TA = (current assets – current liabilities) / total assets
)708-540 / (3588 = 4.7%
– As NWC is viewed as the amount of short term liquidity we use this ratio, a relatively low value indicate a low levels of liquidity.

21
1. Liquidity Ratios
E) Interval Measure = current assets / average daily operating costs
708) / 1344/365 = (192 days
– It give an indicator for how long could the company business keep running in case of strike.
– Note that average daily operating costs generally exclude depreciation expense since it is not a cash expense and interest since it is not an operating expense

22
2. financial leverage
A) Total debt ratio = (total assets – total equity) / total assets
)3588-2591 / (3588. = 28 times
– Standard 1:1
– It accounts the % of (all debt of all maturities to all creditors) to the assets, it mean that the company has a .28$ in debt for every 1$ in assets.
– .28 in debt and (1-.28= .72 ) in equity

23
2. financial leverage
B) debt/equity ratio = (total assets – total equity) / total equity
)3588-2591 / (2591. = 38 times
Or = Total Debt / Total Equity = .28/.72 = .38
equity multiplier = 1 + debt/equity ratio 1. + 38 = 1.38 times
Or = total assets / total equity = 3588/2591 = 1.38
24
2. financial leverage
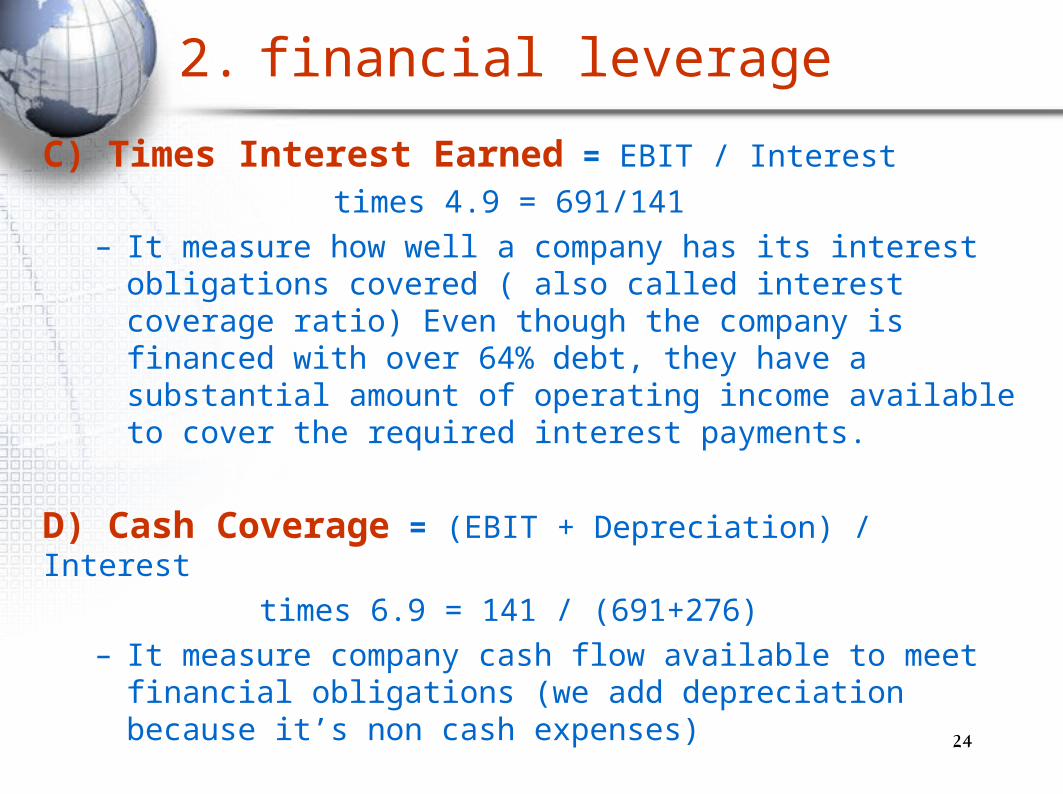
C) Times Interest Earned = EBIT / Interest
691/141 = 4.9 times– It measure how well a company has its interest obligations
covered ( also called interest coverage ratio) Even though the company is financed with over 64% debt, they have a substantial amount of operating income available to cover the required interest payments.
D) Cash Coverage = (EBIT + Depreciation) / Interest
)691+276 / (141 = 6.9 times– It measure company cash flow available to meet financial
obligations (we add depreciation because it’s non cash expenses)
25
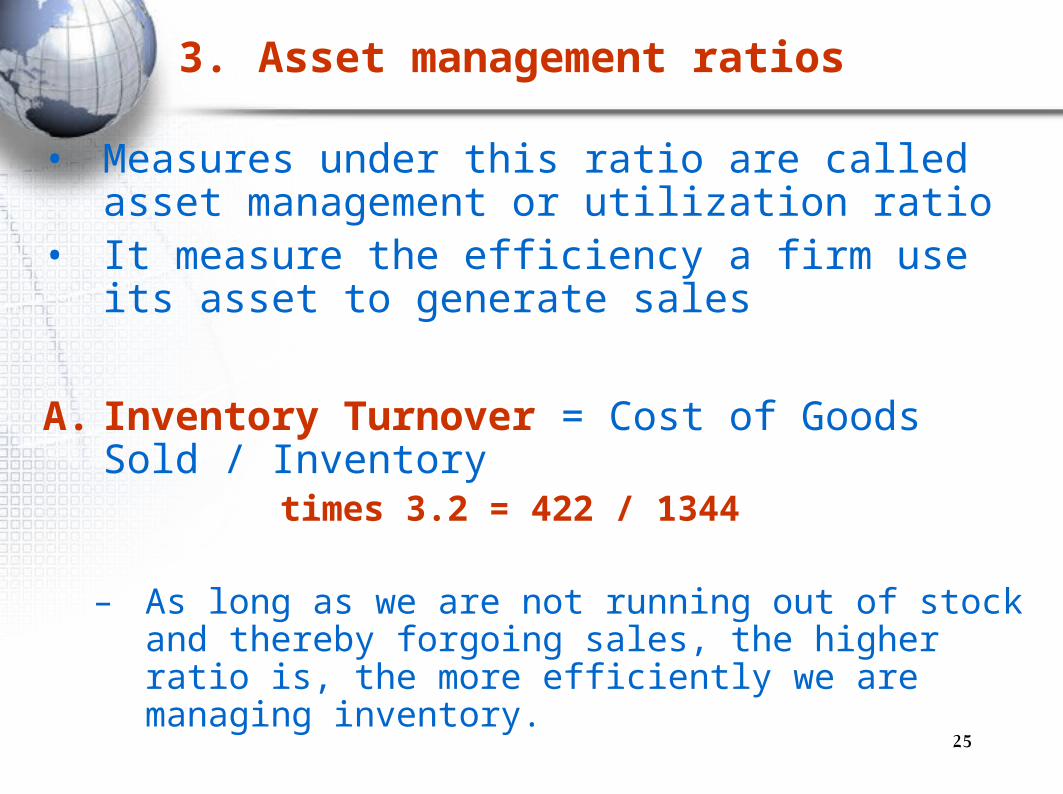
3. Asset management ratios
• Measures under this ratio are called asset management or utilization ratio
• It measure the efficiency a firm use its asset to generate sales
A. Inventory Turnover = Cost of Goods Sold / Inventory
1344 / 422 = 3.2 times
– As long as we are not running out of stock and thereby forgoing sales, the higher ratio is, the more efficiently we are managing inventory.

26
3. Asset management ratios
• Inventory turnover can be computed using either ending inventory or average inventory when you have both beginning and ending figures. It is important to be consistent with whatever benchmark you are using to analyze the company’s strengths or weaknesses.
Days’ Sales in Inventory = 365 / Inventory Turnover
365 / 3.2 = 114 days
– This mean that inventory sits 114 days on average before it sold.

27
3. Asset management ratios
B. Receivables Turnover = Sales / Accounts Receivable
2311/188 = 12.3 times– The company collect its outstanding credit accounts
and reloaded the money 12.3 times during the year. Days’ Sales in Receivables = 365 / Receivables Turnover
365 / 12.3 = 30 days– This ratio may also be called “average collection
period” or “days’ sales outstanding.” – It mean that the company collects on its credit sales
in 30 days on average
28
3. Asset management ratios
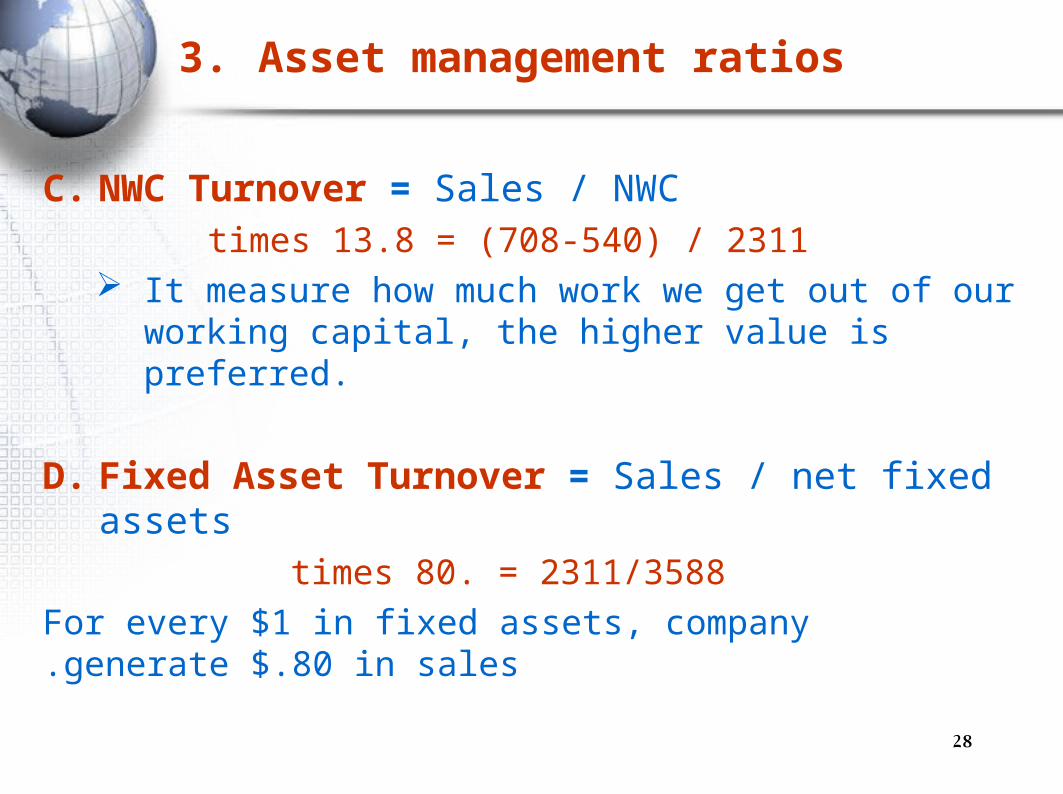
C. NWC Turnover = Sales / NWC2311) / 708-540 = (13.8 times
It measure how much work we get out of our working capital, the higher value is preferred.
D. Fixed Asset Turnover = Sales / net fixed assets 2311/3588. = 80 times
For every $1 in fixed assets, company generate $.80 in sales.
29
3. Asset management ratios
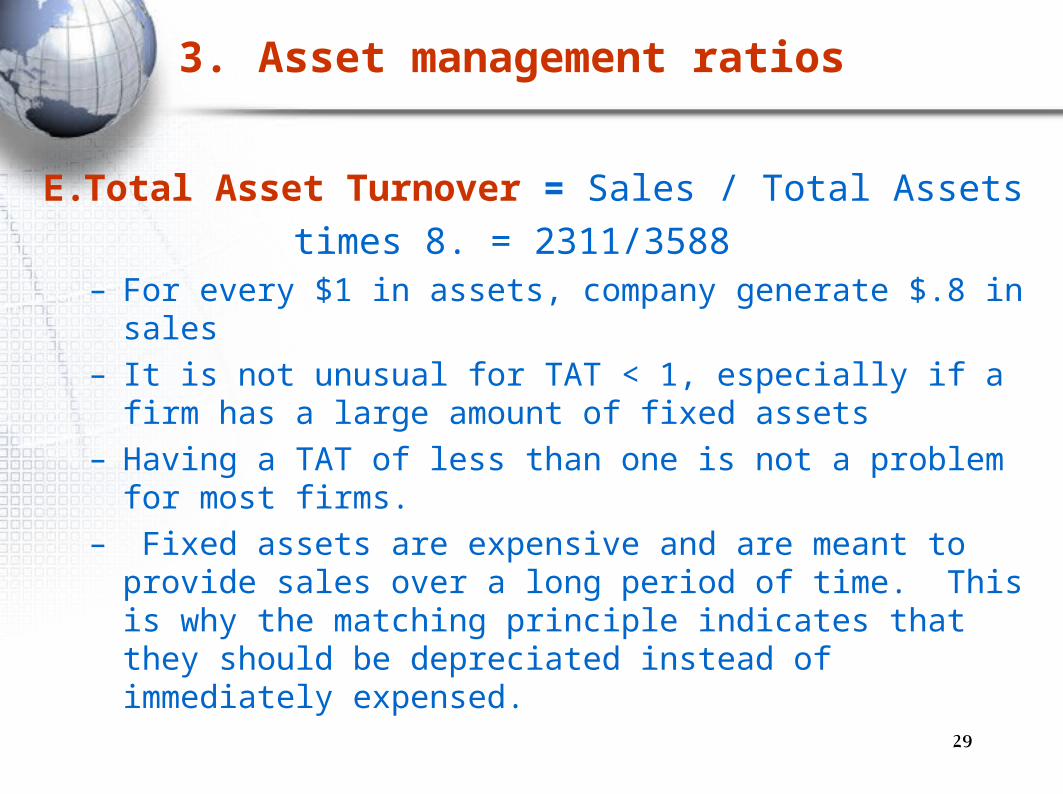
E. Total Asset Turnover = Sales / Total Assets
2311/3588. = 8 times– For every $1 in assets, company generate $.8 in
sales– It is not unusual for TAT < 1, especially if a firm has a
large amount of fixed assets– Having a TAT of less than one is not a problem for
most firms. – Fixed assets are expensive and are meant to provide
sales over a long period of time. This is why the matching principle indicates that they should be depreciated instead of immediately expensed.
30
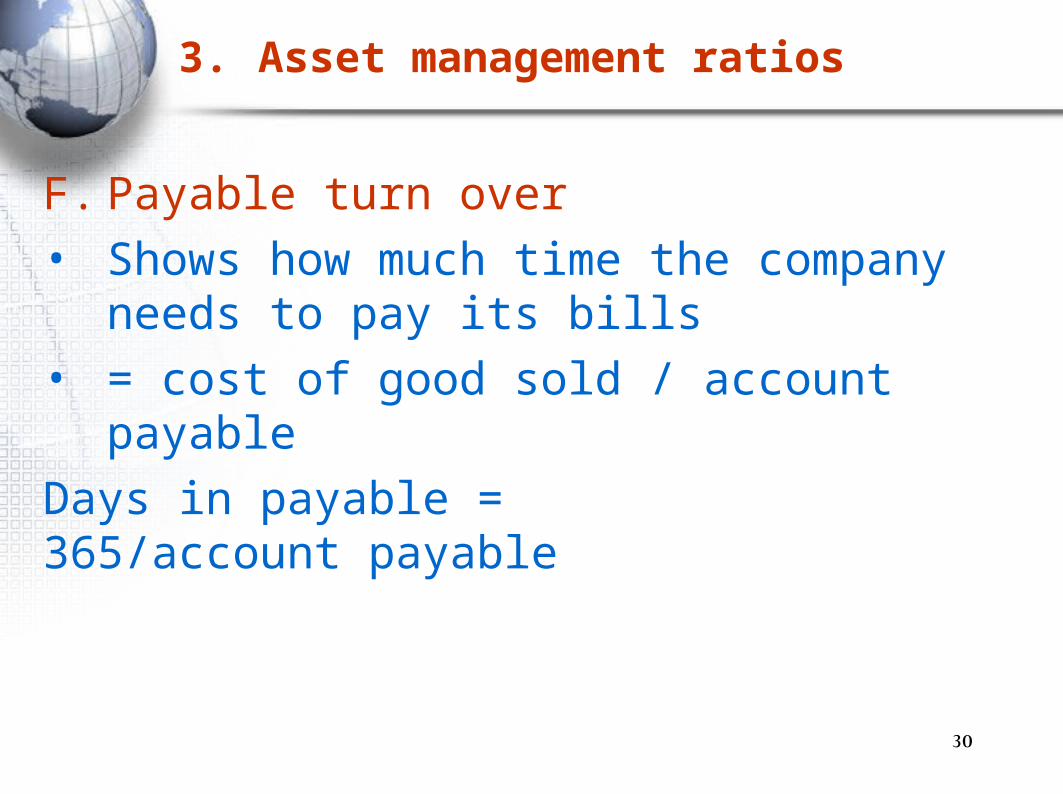
3. Asset management ratios
F. Payable turn over • Shows how much time the company needs to
pay its bills• = cost of good sold / account payable
Days in payable = 365/account payable

31
4. Computing Profitability Measures
A. Profit Margin = Net Income / Sales
363 / 2311 = 15.7%
– The company generate around 16 cents in profit for every dollar in sales, the higher percentage is preferred Profit margin.
– It tells how much the firm earns for every dollar in sales.

32
4. Computing Profitability Measures
B. Return on Assets (ROA) = Net Income / Total Assets
363 / 3588 = 10.12%
– Measure of profit per dollar of assets. The company generate around 10 cents in profit for every dollar of assets.
– ROA is sometimes referred to as ROI (return on investment).
33
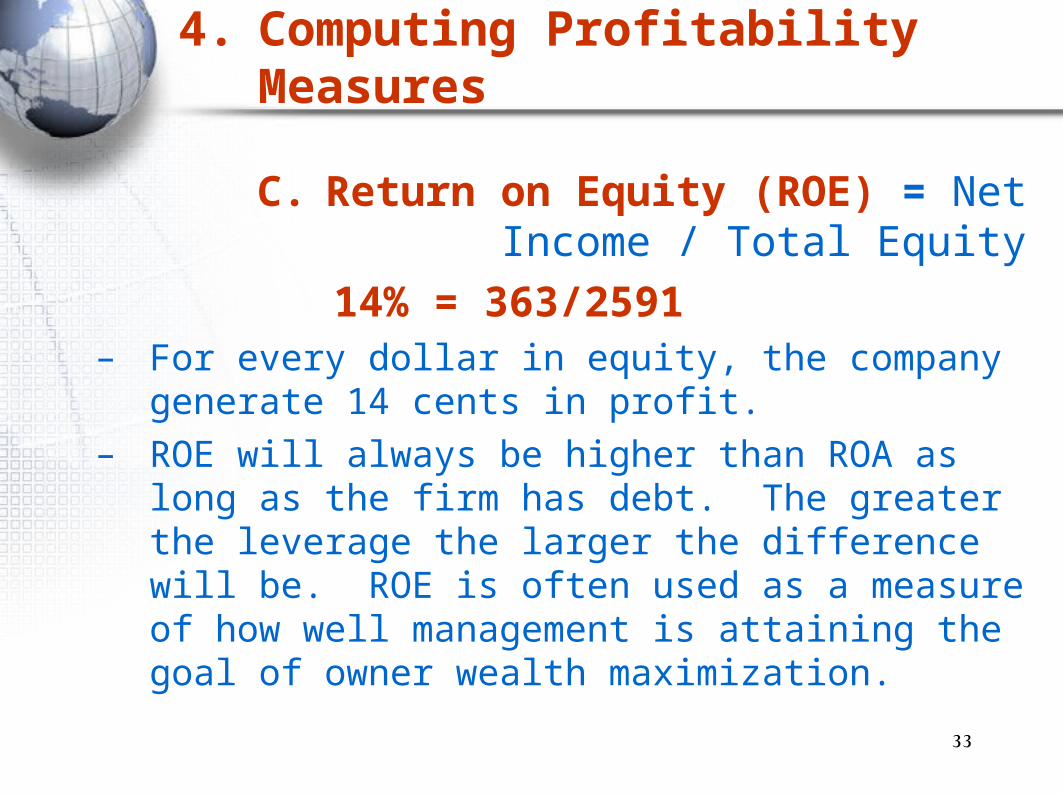
4. Computing Profitability Measures
C. Return on Equity (ROE) = Net Income / Total Equity
363/2591 = 14%– For every dollar in equity, the company generate 14
cents in profit.– ROE will always be higher than ROA as long as the
firm has debt. The greater the leverage the larger the difference will be. ROE is often used as a measure of how well management is attaining the goal of owner wealth maximization.

34
5. Computing Market Value Measures
• Market Price = $88 per share
• Shares outstanding = 33 million
A. Earnings per share = net income / shares outstanding
363/33 = $11
B. Dividends per Share or DPS = Dividends/ shares outstanding
121/33 = $3.6

35
5. Computing Market Value Measures
C. Price-earnings ratio (PE) = Price per share / Earnings per share
88/11 = 8 times
– The company shares sell for eight times earning, or have PE multiple of 8.
– It measure how much investors are willing to pay per dollar of current earnings.
– Higher PEs often take to mean the firm has significant prospectus for future growth

36
5. Computing Market Value Measures
D. Price-Sales Ratio = Price per share / Sales per share
88)/2311/33 = (1.26
E. Market-to-book ratio = market value per share / book value per share
88) / 2591/33 = (1.12 times– It compares the market value of firm’s investment to
their cost.– A value less than 1 could mean that the firm has not
been successful overall in creating value for its stockholders.

37
5. Computing Market Value Measures
• Tobin’s Q = Market value of firm’s assets / Replacement cost of firm’s assets
= Market value of firm’s debt and equity / Replacement cost of firm’s assets
– It focuses on what the firm is worth today relative to what it would cost to replace it today.
– High ratio tend to be those with attractive investment opportunities or significant competitive advantages.
– But it is difficult to estimate the replacement cost

38
• Standardized Financial Statements
• Common-Size Balance Sheets
– Compute all accounts as a percent of total assets.
• Common-Size Income Statements
– Compute all line items as a percent of sales
• Standardized statements make it easier to compare financial information, particularly as the company grows.
• They are also useful for comparing companies of different sizes, particularly within the same industry.
39
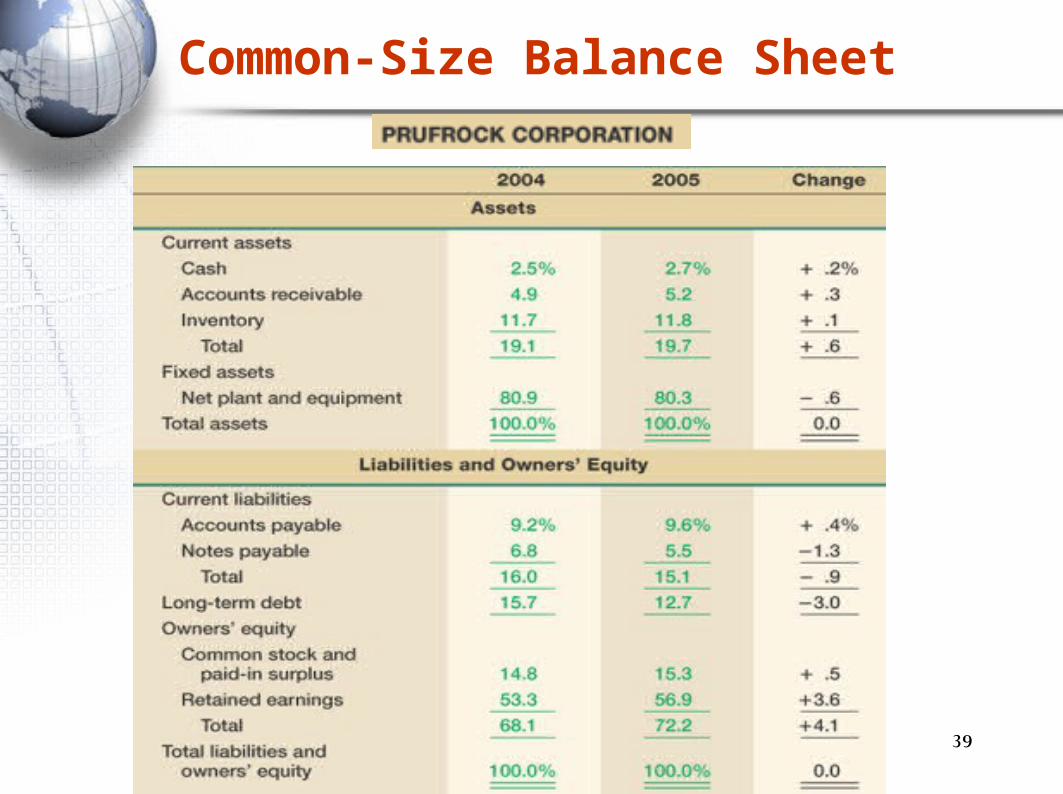
Common-Size Balance Sheet

40
• Common-Size Balance Sheet
• Notice that total change has to be zero because the beginning and ending numbers must add up to 100 percent.
• Also notice that the statement is relatively easy to read and compare (for example: CA increased from 19.1 to 19.7%, CL decreased from 15.7 to 12.7%)

41
• Common-Size Income Statements

42
• Common-Size Income Statements
• Common-Size Income Statement tells us what happens to each dollar in sales (for example: we pay taxes $.061 of each $1 in sales)
• Notice that the percentages are useful in comparisons, such as cost control.

43
• problem of Financial Ratio Analysis
Seasonal factors can distort ratios.
Window dressing” techniques can make statements and ratios look better.
Different operating and accounting practices distort comparisons
Sometimes hard to tell if a ratio is “good” or “bad”.
Difficult to tell whether company is, on balance, in strong or weak position

44