1 financial statement analysis curriculum designed for xyz inc. presented by : obsal
TRANSCRIPT

1
Financial Statement AnalysisFinancial Statement AnalysisCurriculum designed forXYZ inc.
Presented by : OBSAL
2
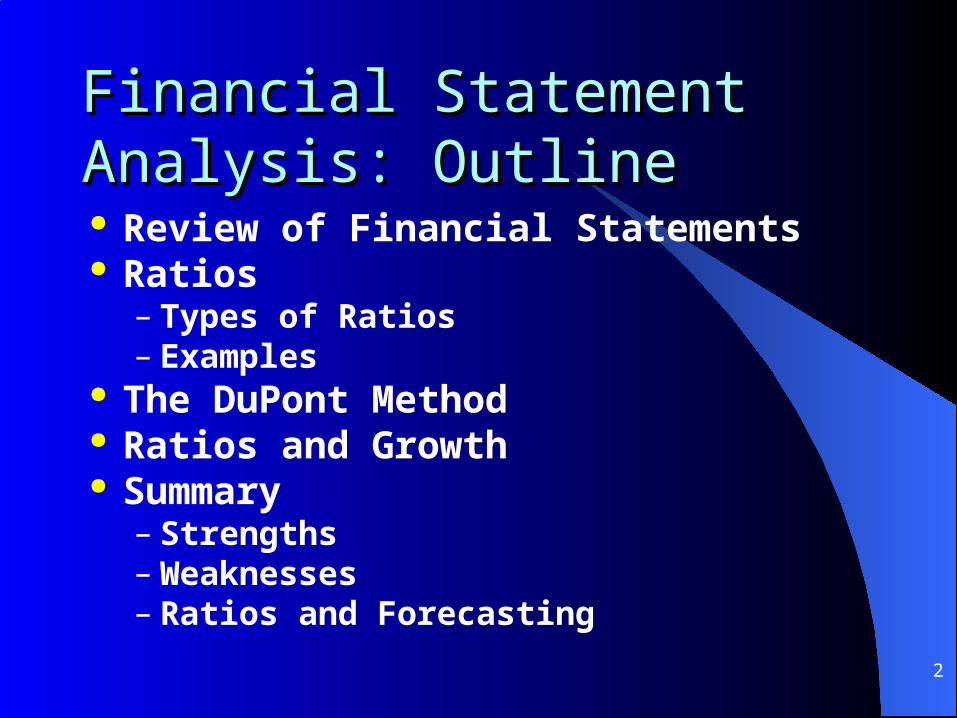
Financial Statement Analysis: Financial Statement Analysis: OutlineOutline Review of Financial Statements Ratios
– Types of Ratios– Examples
The DuPont Method Ratios and Growth Summary
– Strengths– Weaknesses– Ratios and Forecasting
3
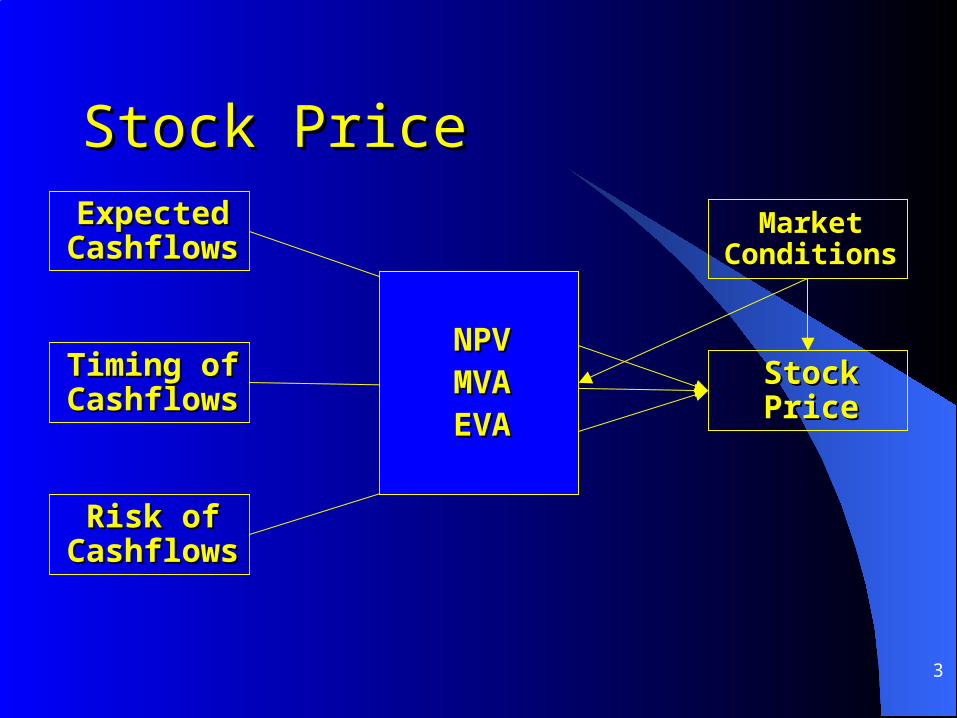
Stock PriceStock Price
Risk ofRisk ofCashflowsCashflows
Timing of Timing of CashflowsCashflows
ExpectedExpectedCashflowsCashflows
Stock PriceStock Price
Market Market ConditionsConditions
NPVNPVMVAMVAEVAEVA

4
Financial AnalysisFinancial Analysis
Assessment of the firm’s financial conditions
Done to find firm’s financial strengths and weaknesses
Primary Tools:– Financial Statements– Comparison of financial ratios to past,
industry, sector and all firms

5
Financial StatementsFinancial Statements
Balance Sheet Income Statement Cashflow Statement Statement of Retained Earnings
6
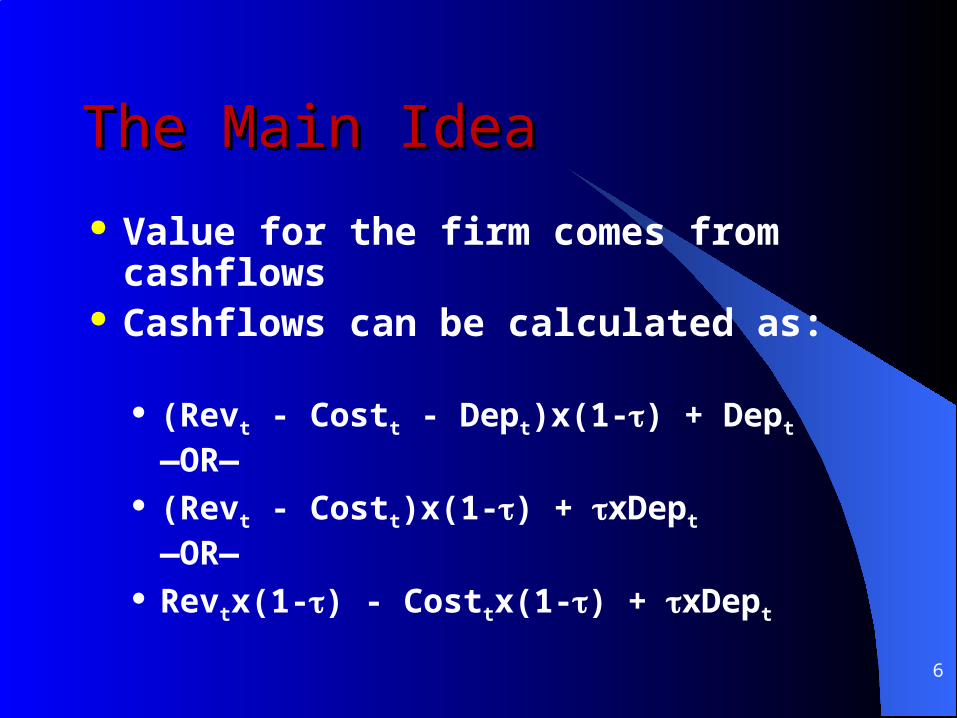
The Main IdeaThe Main Idea
Value for the firm comes from cashflows Cashflows can be calculated as:
(Revt - Costt - Dept)x(1-) + Dept
—OR— (Revt - Costt)x(1-) + xDept
—OR— Revtx(1-) - Costtx(1-) + xDept

7
Review: Major Balance Sheet Review: Major Balance Sheet ItemsItems
Assets Current assets:
– Cash & securities
– Receivables
– Inventories Fixed assets:
– Tangible assets
– Intangible assets
Liabilities and Equity Current liabilities:
– Payables
– Short-term debt Long-term
liabilities Shareholders'
equity

8
An Example: XYZ inc.An Example: XYZ inc.Abbreviated Balance SheetAbbreviated Balance Sheet Assets:
– Current Assets: $7,681.00
– Non-Current Assets: $3,790.00
– Total Assets: $11,471.00 Liabilities:
– Current Liabilities: $5,192.00
– LT Debt & Other LT Liab.: $971.00
– Equity: $5,308.00
– Total Liab. and Equity: $11,471.00

9
Review: Major Income Review: Major Income Statement ItemsStatement Items Gross Profit = Sales - Costs of Goods Sold EBITDA
= Gross Profit - Cash Operating Expenses EBIT = EBDIT - Depreciation - Amortization EBT = EBIT - Interest NI or EAT = EBT- Taxes Net Income is a primary determinant of the
firm’s cashflows and, thus, the value of the firm’s shares

10
An Example: XYZ inc.An Example: XYZ inc.Abbreviated Income StatementAbbreviated Income StatementSales $25,265.00Costs of Goods Sold -$19,891.00Gross Profit $5,374.00Cash operating expense -$2,761.00EBITDA 2,613.00Depreciation & Amortization -$156.00Other Income (Net) -$6.00EBIT $2,451.00Interest -$0.00EBT $2,451.00Income Taxes -$785.00Special Income/Charges -$194.00Net Income (EAT) $1,666.00

11
Objectives of Ratio AnalysisObjectives of Ratio Analysis Standardize financial information for
comparisons Evaluate current operations Compare performance with past
performance Compare performance against other
firms or industry standards Study the efficiency of operations Study the risk of operations
12
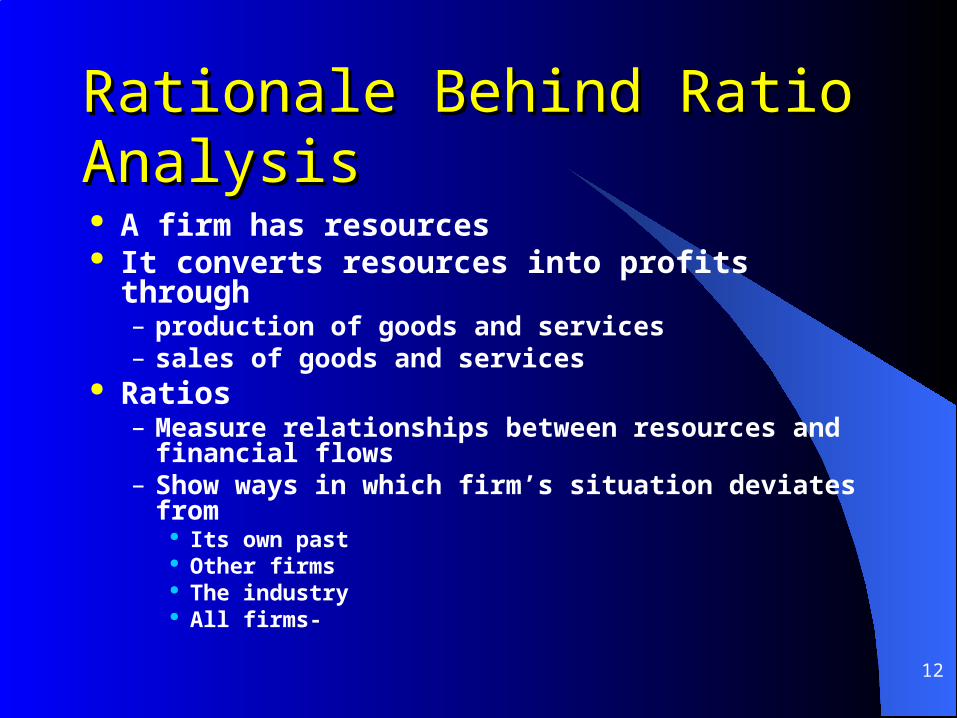
Rationale Behind Ratio Rationale Behind Ratio AnalysisAnalysis A firm has resources It converts resources into profits through
– production of goods and services– sales of goods and services
Ratios– Measure relationships between resources and
financial flows– Show ways in which firm’s situation deviates from
Its own past Other firms The industry All firms-

13
Types of RatiosTypes of Ratios Financial Ratios:
– Liquidity Ratios Assess ability to cover current obligations
– Leverage Ratios Assess ability to cover long term debt obligations
Operational Ratios:– Activity (Turnover) Ratios
Assess amount of activity relative to amount of resources used
– Profitability Ratios Assess profits relative to amount of resources used
Valuation Ratios: Assess market price relative to assets or earnings

14
Current Ratio:
Quick (Acid Test) Ratio:
Liquidity Ratio Examples: Liquidity Ratio Examples: XYZ inc.XYZ inc.

15
Debt Ratio:
Leverage Ratio Examples: Leverage Ratio Examples: XYZ inc.XYZ inc.

16
Return on Assets (ROA):
Return on Equity (ROE):
Profitability Ratio Examples: Profitability Ratio Examples: DellDell

17
Profitability Ratio Examples: Profitability Ratio Examples: DellDell Net Profit Margin:
Retention Ratio

18
Total Asset Turnover Ratio:
Inventory Turnover Ratio:
Activity (Turnover) Ratio Activity (Turnover) Ratio Examples: DellExamples: Dell
19
The DuPont SystemThe DuPont System
Method to breakdown ROE into:– ROA and Equity Multiplier
ROA is further broken down as:– Profit Margin and Asset Turnover
Helps to identify sources of strength and weakness in current performance
Helps to focus attention on value drivers

20
The DuPont SystemThe DuPont System
Profi t M argin T ota l A sse t T urnover
RO A E quity M ultip l ie r
RO E

21
The DuPont SystemThe DuPont System
Profi t M argin T ota l A sse t T urnover
RO A E quity M ultip l ie r
RO E
EquityCommon
Assets Total
Assets Total
IncomeNet MultiplierEquity ROAROE

22
XYZ inc. Strategy XYZ inc. Strategy
To profitably support the To profitably support the acquisition and deployment of XYZ acquisition and deployment of XYZ inc. with creative, flexible, market inc. with creative, flexible, market
enhancing financingenhancing financing

23
The DuPont System: XYZ inc. The DuPont System: XYZ inc.
Multiplier EquityROA
Multiplier EquityTurnover Asset TotalMarginProfit Equity Common
AssetsTotal
AssetsTotal
Sales
Sales
IncomeNet ROE
31.39%
2.16111452.0
2.16112.20250.0659$5,308.00
$11,471.00
$11,471.00
$25,265.00
$25,265.00
$1,666.00ROE

24
A Note on Sustainable Growth A Note on Sustainable Growth and Stock Returnsand Stock Returns For long run
– Sustainable growth and long run capital gains (g) = ROE x
Recall the relationship between stock returns (r), capital gains (g) and forward dividend yields (D1/P0):– r = g + D1/P0 = g + Do(1+g)/P0
Note: r & g must be quarterly if D is quarterly and annual if D is annual

25
Predicted Sustainable Growth Predicted Sustainable Growth for XYZ inc.for XYZ inc. Based on the most
recent numbers:– ROE = 31.38% &
= 100%
– g = 0.3138 x 1 = 31.38%
– r = 0.3138 + 0/P = 31.38%
Based on last 5 year averages:– ROE = 51.93% &
= 100%
– g = 0.5194 x 1 = 51.93%
– r = 0.3139 + 0/P = 51.93%

26
Summary of Financial RatiosSummary of Financial Ratios
Ratios help to:– Evaluate performance– Structure analysis– Show the connection between activities and
performance Benchmark with
– Past for the company– Industry
Ratios adjust for size differences

27
Limitations of Ratio AnalysisLimitations of Ratio Analysis
A firm’s industry category is often difficult to identify
Published industry averages are only guidelines
Accounting practices differ across firms Sometimes difficult to interpret deviations
in ratios Industry ratios may not be desirable
targets Seasonality affects ratios
28
Ratios and ForecastingRatios and Forecasting
Common stock valuation based on– Expected cashflows to stockholders– ROE and are major determinants of cashflows to
stockholders Ratios influence expectations by:
– Showing where firm is now– Providing context for current performance
Current information influences expectations by:– Showing developments that will alter future
performance

29
How Might Ratios Help us on How Might Ratios Help us on the IEM?the IEM? Analysis of AAPL, IBM and MSFT, and
comparisons to the S&P500 companies can help to:– Assess the (absolute and relative) financial state of
each company– Show each company’s strengths and weaknesses– Predict sustainable growth rate
Combined with current information, this can help to:– Assess likely future performance– Predict future valuation and earnings growth– Predict returns