1 formation et analyse d’images session 3 daniela hall 14 october 2004
Post on 19-Dec-2015
215 views
TRANSCRIPT

1
Formation et Analyse d’ImagesSession 3
Daniela Hall
14 October 2004

2
Course Overview
• Session 1: – Homogenous coordinates and tensor notation– Image transformations– Camera models
• Session 2:– Camera models– Reflection models– Color spaces
• Session 3:– Review color spaces– Pixel based image analysis
• Session 4:– Gaussian filter operators– Scale Space
3
Course overview
• Session 5:– Contrast description– Hough transform
• Session 6:– Kalman filter– Tracking of regions, pixels, and lines
• Session 7:– Stereo vision – Epipolar geometry
• Session 8: exam

4
Session Overview
1. Review reflectance model2. Pixel based image analysis
1. Color histograms2. Example face detection3. Segmentation4. Connectivity analysis5. Morphological operators6. Moments
3. Corrections

5
Di-chromatic reflectance model
• the reflected light R is the sum of the light reflected at the surface Rs and the light reflected from the material body RL
• Rs has the same spectrum as the light source• The spectrum of Rl is « filtered » by the material (photons are
absorbed, this changes the emitted light)• Luminance depends on surface orientation• Spectrum of chrominance is composed of light source
spectrum and absorption of surface material.
),,(),,(),,( geiRgeiRgeiR LLSs

6
Pixel based image analysis
• Amplitude of RL depends on angle i
• Amplitude is captured by the luminance axis.
• Body component of the object is captured by the chrominance axis.
)cos(),,( igeiRL
camera
light
Negi

7
Color space (r,g)
• Intensity normalised color space (r,g)
• Properties:– less sensitive to intensity changes– less sensitive to variances of i– preserves chrominance (important for object
identification)
BGR
Gg
BGR
Rr
,

8
Object detection by color
Let p((r,g)|obj) be the probability density of (r,g) given the object and p(r,g) the global probability of the occurrence of (r,g)
Then we can compute for any color (r,g) the probability p(obj|(r,g))
This gives rise to a « probability map » of the image.
),(
)()|),(()),(|(
grp
objpobjgrpgrobjp

9
Color histograms
• A color histogram is a (multi-dimensional) table• We define a linear function that computes for any
color the index of the corresponding histogram cell.
• Example: we have a greyscale image with 256 grey values. We want to fill a histogram with N cells. The index of the histogram cell c(val) of the pixel with value val is:
256)(
valNvalc

10
Color histograms
• A histogram is filled by considering pixels within a ROI (region of interest). – For each pixel val we compute the c(val) and
increment it.
• Histograms approximate probability densities.
),(1
)|),(( ),,(1
),(
),(1
lim),(
grhN
objgrpgrhN
grp
grhN
grp
objobj
tottot
tottot
Ntot

11
Object detection by color histograms
• The prior p(obj) can be estimated as the ratio of the obj size Nobj to the size of the image Ntot
• Then:
),(
),(
),(1
),(1
),(
)()|),(()),(|(
grh
grh
grhN
N
Ngrh
N
grp
objpobjgrpgrobjp
tot
obj
tottot
tot
objobj
obj
Ratio of histograms

12
Object detection by color histograms
• Constructing the histograms hobj and htot is called learning.• Important points:
– hobj must contain only points of the object– htot must be sufficiently representative to estimate the color
distribution in the world. – You need sufficient number of training examples.
• All cells of htot should be > 0 (otherwise division by 0)• You have sufficient data when N >= k*number cells, k~5 to 10
Example: for 2D histogram 32x32 cells, you need 10240 pixels.for 5D histogram of 10x10 cells, you need 1 million pixels.

13
Example: face detection
1. Learning1. select images
2. segment pixels that have skin color (by hand)
3. construct hobj and htot

14
Example: face detection
Detection• Compute probability map where each pixel has
probability p(obj|(r,g))~hobj(r,g)/htot(r,g).
• First and second moments of the high probability pixels give the position and extent of the face.

15
Example: face tracking
1. Learning as before2. Do detection once for initialisation3. Continous tracking
1. Compute position estimate for the next frame (using Kalman filter, session 6)
2. Compute probability image3. Multiply by a Gaussian mask that is centered on the
most likely position. This removes outliers and makes system more stable.
4. First and second moments give position and size of face.

16
Example: face tracking
input imageprobability image weighted by Gaussian
Tracking result

17
Segmentation
1. Segmentation by thresholding
2. Connected components
3. Improvement by morphological operators

18
Segmentation
Segmentation by thresholding
1. Make histogram of the probability image
2. Find threshold values by searching for valleys
3. Apply thresholds
probability image Thresholded image
Threshold at 0.375

19
Notational convention
• Image operators require to evaluate the neighboring pixels. The neighbor with coordinates (i-1,j-1) of pixel (i,j) is called the neighbor NW. It has the value I(i-1,j-1)= I(NW).
• Operators are based on two types of support: a 3*3 block (8-connected) or a 3*3 cross (4-connected).
I(NW) I(N) I(NE)I(W) I(C) I(E)I(SW) I(S) I(SE)
I(N) I(W) I(C) I(E) I(S)
I(i-1,j-1) I(i,j-1) I(i+1, j-1)I(i-1,j) I(i,j) I(i+1, j)I(i-1,j+1) I(i, j+1) I(i+1, j+1)
8 connected
4 connected

20
Connected components
• Algorithm to segment multiple objects within an image.• How it works:
1. Use a binary image2. Scan along a row until a point p with I(p)=1 is found.3. Examine the 4 neighbors (N,W,NW,NE)
1. if I(N)=I(NW)=I(NE)=I(E)=0, assign a new label to p2. if only one neighbor has a label, assign this label to p.3. if more neighbors have a label, assign one to p and make a note of
label equivalence.
4. Scan all rows.5. Determine which labels are equivalent6. Replace equivalent labels within the image.
source: http://homepages.inf.ed.ac.uk/rbf/HIPR2/label.htm
pN
W
NW NE

21
Example connectivity analysis
1. Scan a row until p with I(p)=1 is found.2. Examine neighbors N,NW,NE,W
a a a a a a a a aa a
bb
a a a aa a
bb b
b=a
a a a aa a
bb b
b=a
c c c
Replace equivalencesb b b
b b b bb b
c c c

22
More examples
binary image Connected components with labels coded as colors

23
Example: count number of objects
Original image Thresholded image
Connected componentalgorithm gives 163 labels
labels coded as grey values labels coded as colors labels coded as 8 different colors

24
Morphological operators
• This example shows the basic operators of the mathematic morphology on the binary images. The structuring element is a 3*3 block (8-connected) or a 3*3 cross (4-connected).
• Max (Dilatation for binary image) • Min (Erosion for binary image) • Close: Min(Max(Image)) • Open: Max(Min(Image)) • Convention: for the binary image, black=0,
white=1.

25
Dilatation and erosion
Dilatation operatorI’(C) = max(I(N),I(W),I(C),I(E),I(S)) Erosion operatorI’(C) = min(I(N),I(W),I(C),I(E),I(S))
Original image Thresholdedimage
Dilated image
Eroded image

26
Close and open operators
• Close: Min(Max(Image))
• Open: Max(Min(Image))

27
Moments
• In order to describe (and recognize) an object we need a method that is invariant to certain image transformations.
• Method: moment computation• 1st moment: center of gravity• 2nd moment: spatial extent• 1st and 2nd moment are invariant to image
orientation• 2nd moment is invariant to image translation.

28
Moments
• Input: a binary image.
• Let S be the sum of all white pixels.
• 1st moment (μi,μj) (center of gravity)
• 2nd moments (covariance)
22
22
212
122
212
11
)(),(
))((),(
)(),(
),(,),(
),(
jjji
ijiip
ji j
Sjj
jii j
Sjiij
ii j
Sii
i jSj
i jSi
i j
C
jjiI
jijiI
ijiI
jjiIijiI
jiIS

29
Moments
• The covariances define an ellipse. The direction and length of the major axis of the ellipse are computed by principle component analysis.
• Find a rotation Φ, such that
PT
P
T
TP
CC
C
10
01,
)cos()sin(
)sin()cos(
0
0
diagonal is such that ,
2
1
Φ eigen vectors, Λ eigen values

30
Example
• Height and width of an object depend on the orientation of the object
• whereas the eigen values of the covariance CP are invariant
h
ww
h
w
h
λ1λ2
bounding box

31
Example:pattern recognition
You dispose of an example image that contains a particular segmented object.
Task: decide for a number of new images of different orientations, if the learned object is within the image.
Training example
Query images

32
Example:pattern recognition
• Representation by width and height of the bounding box of the object is not a solution.
• Representation by moments allows to find the correct images.
Training example
Query images

33
Corrections
• Session 1:
• Translation in homogenous coordinates
1
1
1
100
10
01
1
2
2
y
x
ty
tx
y
x

34
1D linear interpolation
Ps0 Ps1
Ps3Ps2
Ps
position P
intensity I(P)
Ps0 Ps Ps1
)()()())(1(
)()()()(
)()(
1000
00
01
ssssss
ssssd
ss
PIPPPIPP
PIPPmPIPI
PIPIm
Gradient
Pixel color
35
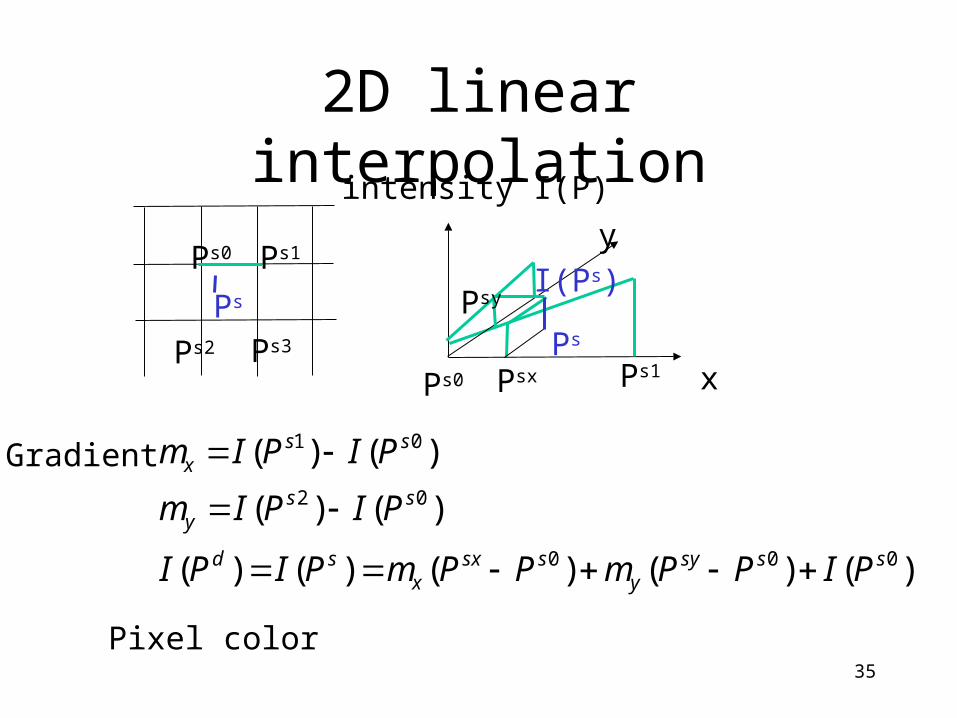
2D linear interpolation
Ps0 Ps1
Ps3Ps2
Ps
x
intensity I(P)
Ps0
Ps
Ps1
)()()()()(
)()(
)()(
000
02
01
sssyy
ssxx
sd
ssy
ssx
PIPPmPPmPIPI
PIPIm
PIPIm
Gradient
Pixel color
I(Ps)
y
Psx
Psy

36
Bi-linear interpolation
Ps0 Ps1
Ps3Ps2
Ps
x
intensity I(P)
Ps0
Ps
Ps1
)())((
)()()(
)()(
)()(
)()(
000
00
03
02
01
sssyssxxy
ssyy
ssxx
s
ssxy
ssy
ssx
PIPPPPm
PPmPPmPI
PIPIm
PIPIm
PIPIm
I(Ps)
y
Ps3
The bilinear approach computes the weighted average of thefour neighboring pixels.
Psx
Psy
Bilinear formula:dcxybyaxyxp ),(