1 general situation of service industries in japan (1 ... · general situation of service...
TRANSCRIPT
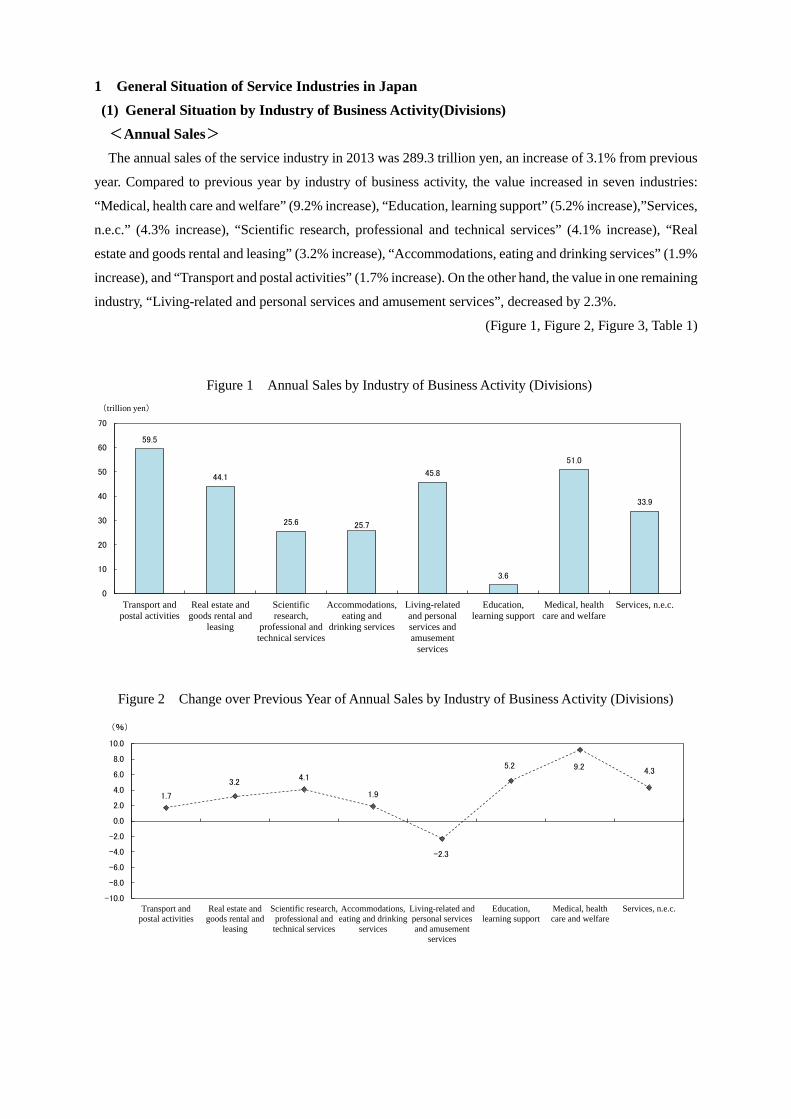
1 General Situation of Service Industries in Japan (1) General Situation by Industry of Business Activity(Divisions) <Annual Sales>
The annual sales of the service industry in 2013 was 289.3 trillion yen, an increase of 3.1% from previous
year. Compared to previous year by industry of business activity, the value increased in seven industries:
“Medical, health care and welfare” (9.2% increase), “Education, learning support” (5.2% increase),”Services,
n.e.c.” (4.3% increase), “Scientific research, professional and technical services” (4.1% increase), “Real
estate and goods rental and leasing” (3.2% increase), “Accommodations, eating and drinking services” (1.9%
increase), and “Transport and postal activities” (1.7% increase). On the other hand, the value in one remaining
industry, “Living-related and personal services and amusement services”, decreased by 2.3%.
(Figure 1, Figure 2, Figure 3, Table 1)
59.5
44.1
25.6 25.7
45.8
3.6
51.0
33.9
0
10
20
30
40
50
60
70
Transport andpostal activities
Real estate andgoods rental and
leasing
Scientificresearch,
professional andtechnical services
Accommodations,eating and
drinking services
Living-relatedand personalservices andamusement
services
Education,learning support
Medical, healthcare and welfare
Services, n.e.c.
(trillion yen)
Figure 1 Annual Sales by Industry of Business Activity (Divisions)
1.7
3.24.1
1.9
-2.3
5.2 9.2 4.3
-10.0
-8.0
-6.0
-4.0
-2.0
0.0
2.0
4.0
6.0
8.0
10.0
Transport andpostal activities
Real estate andgoods rental and
leasing
Scientific research,professional andtechnical services
Accommodations,eating and drinking
services
Living-related andpersonal servicesand amusement
services
Education,learning support
Medical, healthcare and welfare
Services, n.e.c.
(%)
Figure 2 Change over Previous Year of Annual Sales by Industry of Business Activity (Divisions)

59.5
Transport and postal activities
(58.6)
44.1
42.7
25.6
24.6
25.7
25.2
45.8
46.9
3.6
3.4
51.0
46.7
33.9
32.5
0 50 100 150 200 250 300
2013
2012
(trillion yen)
Real estate andgoods rental and leasing
Education, learning support Services, n.e.c.
280.7
289.3
Scientific research, professional and technical services
Accommodations, eating and drinking services
Living-related and personal services and amusement services
Medical, health care and welfare
Figure 3 Change in Annual Sales by Industry of Business Activity (Divisions)
Table 1 Change over Previous Year of Annual Sales by Industry of Business Activity (Divisions)
Transport andpostal activities
Real estate andgoods rentaland leasing
Scientificresearch,professionaland technicalservices
Accomodations,eating anddrinking services
Living-relatedand personalservices andamusementservices
Education,learningsupport
Medical, healthcare andwelfare
Services, n.e.c.
figures(million yen)
2012 280,662,004 58,564,003 42,700,132 24,617,720 25,243,062 46,870,616 3,403,895 46,732,212 32,530,3642013 289,275,890 59,540,747 44,081,236 25,624,393 25,734,294 45,790,721 3,580,230 51,009,334 33,914,936
change overprevious year(%)
2013 3.1 1.7 3.2 4.1 1.9 -2.3 5.2 9.2 4.3
contribution2013 3.1 0.35 0.49 0.36 0.18 -0.38 0.06 1.52 0.49
Service industry
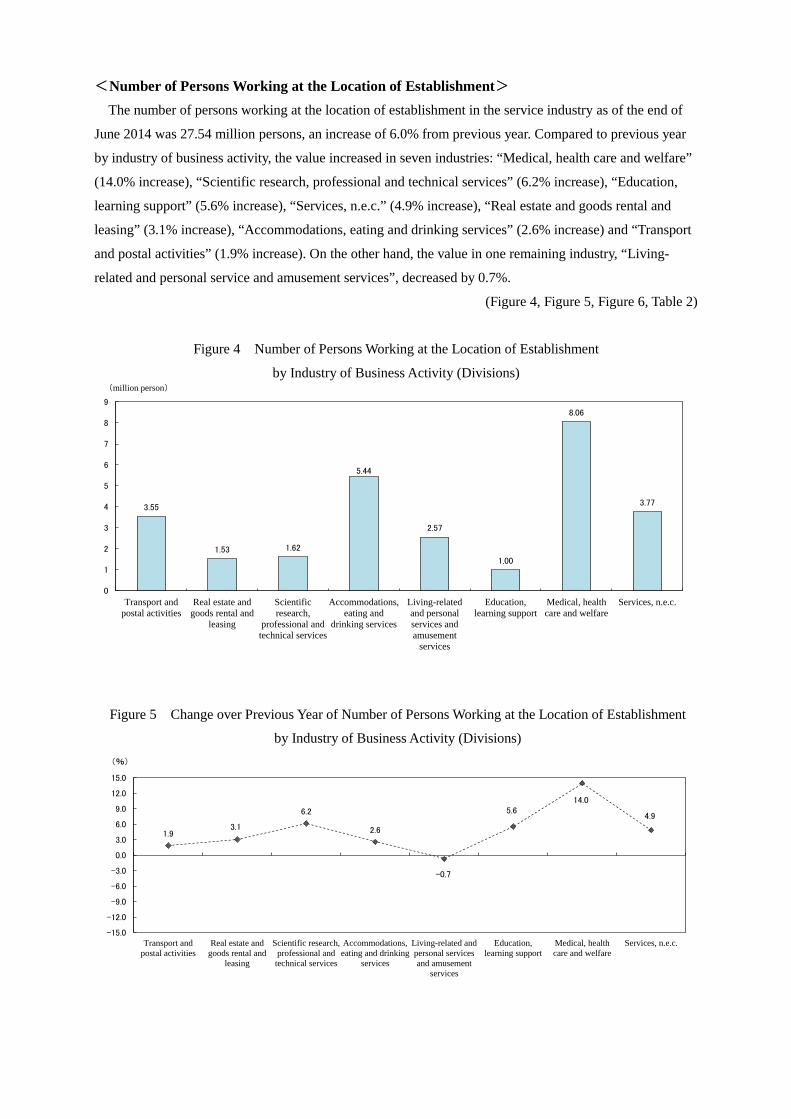
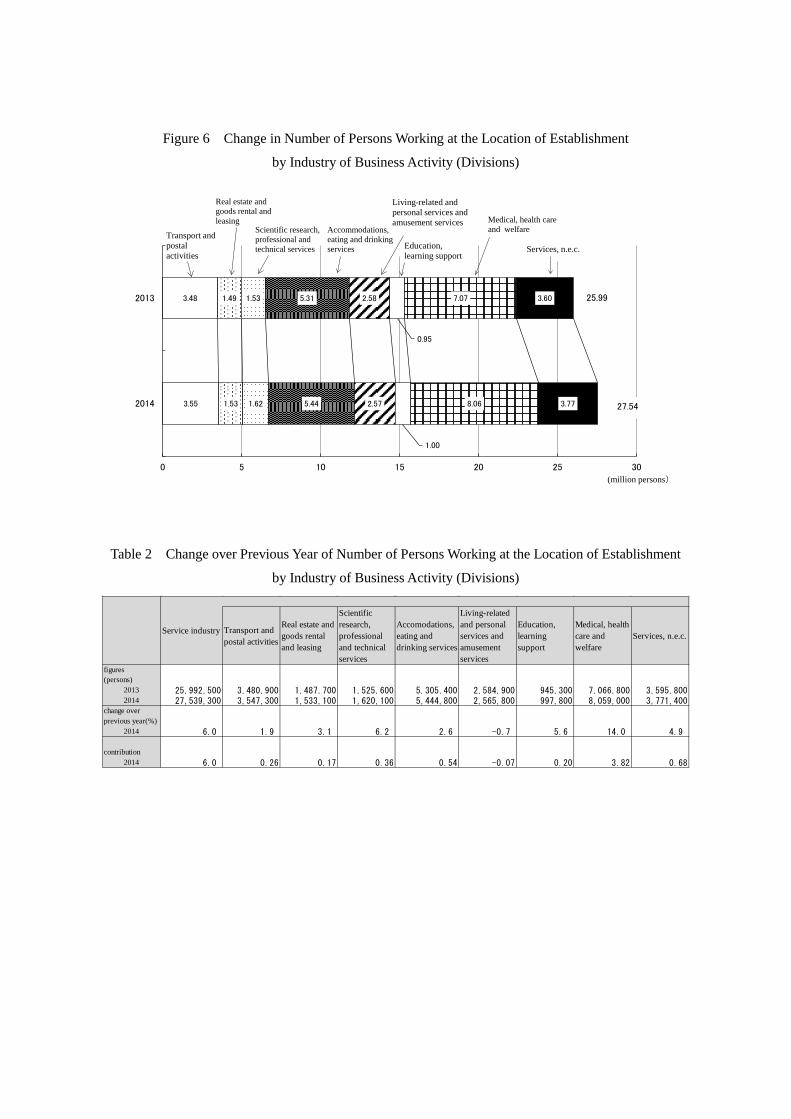
<Number of Persons Working at the Location of Establishment>
The number of persons working at the location of establishment in the service industry as of the end of
June 2014 was 27.54 million persons, an increase of 6.0% from previous year. Compared to previous year
by industry of business activity, the value increased in seven industries: “Medical, health care and welfare”
(14.0% increase), “Scientific research, professional and technical services” (6.2% increase), “Education,
learning support” (5.6% increase), “Services, n.e.c.” (4.9% increase), “Real estate and goods rental and
leasing” (3.1% increase), “Accommodations, eating and drinking services” (2.6% increase) and “Transport
and postal activities” (1.9% increase). On the other hand, the value in one remaining industry, “Living-
related and personal service and amusement services”, decreased by 0.7%.
(Figure 4, Figure 5, Figure 6, Table 2)
3.55
1.53 1.62
5.44
2.57
1.00
8.06
3.77
0
1
2
3
4
5
6
7
8
9
Transport andpostal activities
Real estate andgoods rental and
leasing
Scientificresearch,
professional andtechnical services
Accommodations,eating and
drinking services
Living-relatedand personalservices andamusement
services
Education,learning support
Medical, healthcare and welfare
Services, n.e.c.
(million person)
Figure 4 Number of Persons Working at the Location of Establishment
by Industry of Business Activity (Divisions)
1.93.1
6.2
2.6
-0.7
5.614.0
4.9
-15.0
-12.0
-9.0
-6.0
-3.0
0.0
3.0
6.0
9.0
12.0
15.0
Transport andpostal activities
Real estate andgoods rental and
leasing
Scientific research,professional andtechnical services
Accommodations,eating and drinking
services
Living-related andpersonal servicesand amusement
services
Education,learning support
Medical, healthcare and welfare
Services, n.e.c.
(%)
Figure 5 Change over Previous Year of Number of Persons Working at the Location of Establishment
by Industry of Business Activity (Divisions)
3.55
3.48
1.53
1.49
1.62
1.53
5.44
5.31
2.57
2.58
1.00
0.95
8.06
7.07
3.77
3.60
0 5 10 15 20 25 30
2014
2013
(million persons)
Real estate andgoods rental and leasing Medical, health care
and welfare
Services, n.e.c.
25.99
27.54
Scientific research, professional and technical services
Accommodations, eating and drinking services
Living-related and personal services and amusement services
Education, learning support
Transport and postal activities
Figure 6 Change in Number of Persons Working at the Location of Establishment
by Industry of Business Activity (Divisions)
Table 2 Change over Previous Year of Number of Persons Working at the Location of Establishment
by Industry of Business Activity (Divisions)
Transport andpostal activities
Real estate andgoods rentaland leasing
Scientificresearch,professionaland technicalservices
Accomodations,eating anddrinking services
Living-relatedand personalservices andamusementservices
Education,learningsupport
Medical, healthcare andwelfare
Services, n.e.c.
figures(persons)
2013 25,992,500 3,480,900 1,487,700 1,525,600 5,305,400 2,584,900 945,300 7,066,800 3,595,8002014 27,539,300 3,547,300 1,533,100 1,620,100 5,444,800 2,565,800 997,800 8,059,000 3,771,400
change overprevious year(%)
2014 6.0 1.9 3.1 6.2 2.6 -0.7 5.6 14.0 4.9
contribution2014 6.0 0.26 0.17 0.36 0.54 -0.07 0.20 3.82 0.68
Service industry
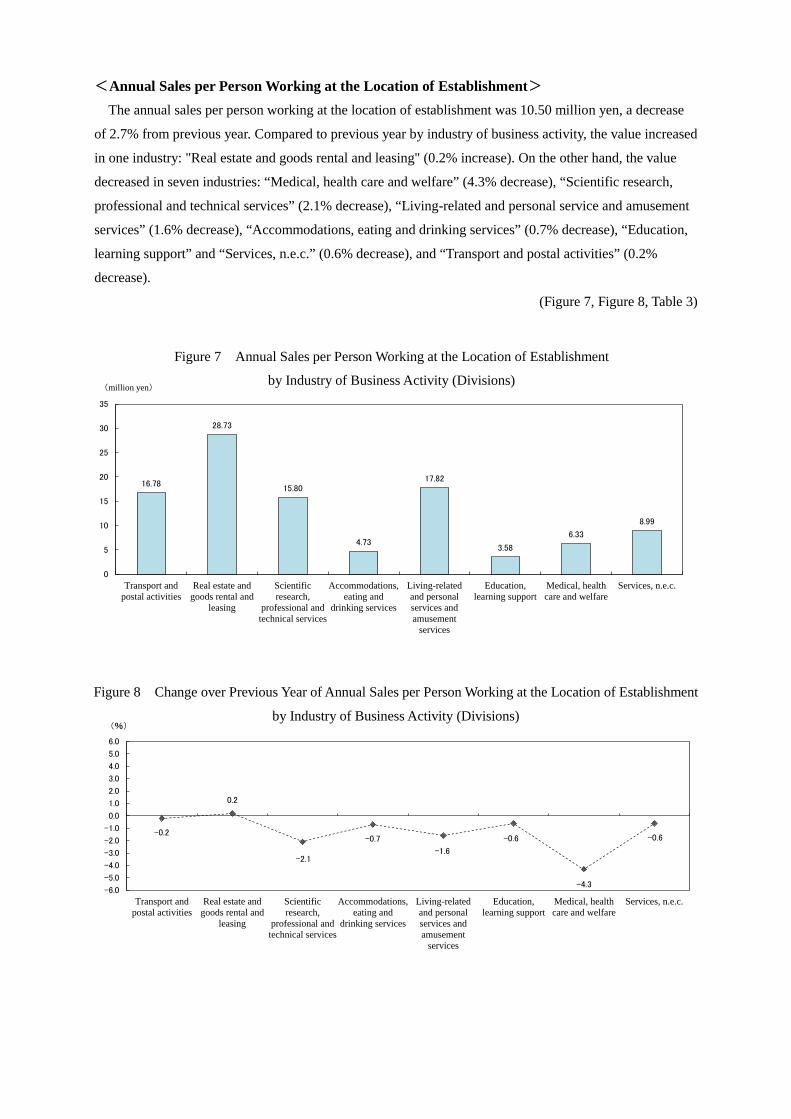
<Annual Sales per Person Working at the Location of Establishment> The annual sales per person working at the location of establishment was 10.50 million yen, a decrease
of 2.7% from previous year. Compared to previous year by industry of business activity, the value increased
in one industry: "Real estate and goods rental and leasing" (0.2% increase). On the other hand, the value
decreased in seven industries: “Medical, health care and welfare” (4.3% decrease), “Scientific research,
professional and technical services” (2.1% decrease), “Living-related and personal service and amusement
services” (1.6% decrease), “Accommodations, eating and drinking services” (0.7% decrease), “Education,
learning support” and “Services, n.e.c.” (0.6% decrease), and “Transport and postal activities” (0.2%
decrease).
(Figure 7, Figure 8, Table 3)
16.78
28.73
15.80
4.73
17.82
3.58
6.33
8.99
0
5
10
15
20
25
30
35
Transport andpostal activities
Real estate andgoods rental and
leasing
Scientificresearch,
professional andtechnical services
Accommodations,eating and
drinking services
Living-relatedand personalservices andamusement
services
Education,learning support
Medical, healthcare and welfare
Services, n.e.c.
(million yen)
Figure 7 Annual Sales per Person Working at the Location of Establishment
by Industry of Business Activity (Divisions)
-0.2
0.2
-2.1
-0.7
-1.6
-0.6
-4.3
-0.6
-6.0
-5.0
-4.0
-3.0
-2.0
-1.0
0.0
1.0
2.0
3.0
4.0
5.0
6.0
Transport andpostal activities
Real estate andgoods rental and
leasing
Scientificresearch,
professional andtechnical services
Accommodations,eating and
drinking services
Living-relatedand personalservices andamusement
services
Education,learning support
Medical, healthcare and welfare
Services, n.e.c.
(%)
Figure 8 Change over Previous Year of Annual Sales per Person Working at the Location of Establishment
by Industry of Business Activity (Divisions)
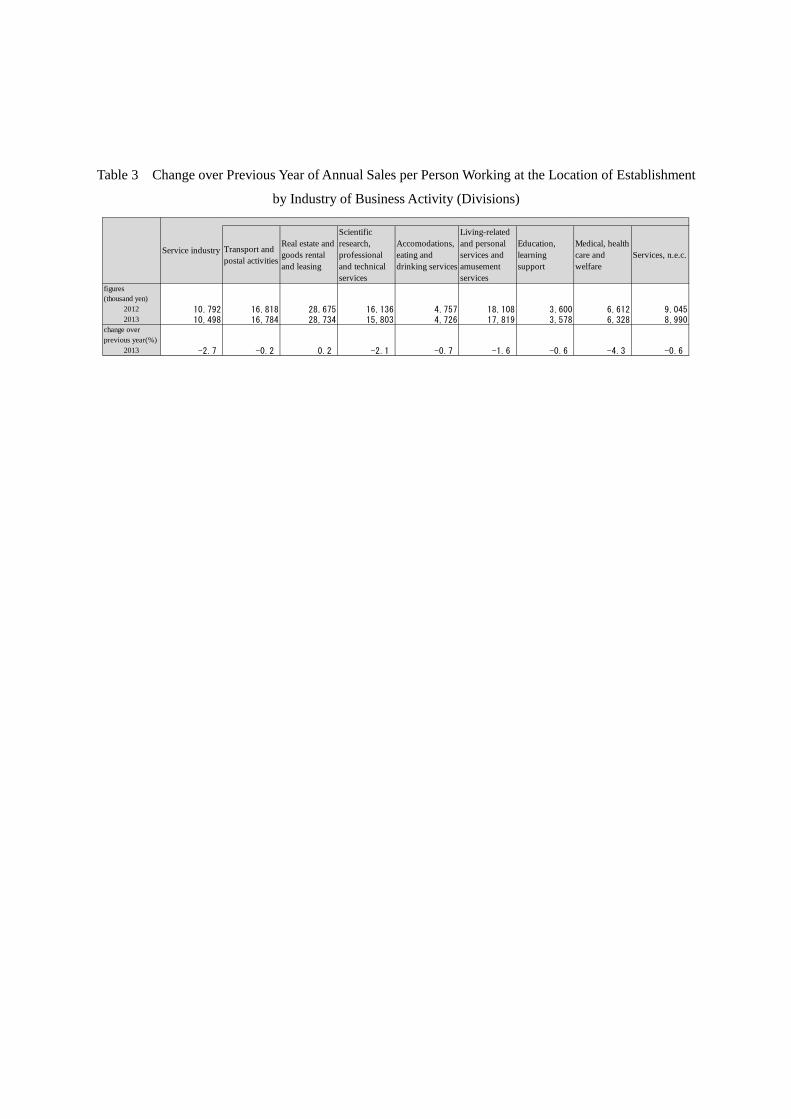
Table 3 Change over Previous Year of Annual Sales per Person Working at the Location of Establishment
by Industry of Business Activity (Divisions)
Transport andpostal activities
Real estate andgoods rentaland leasing
Scientificresearch,professionaland technicalservices
Accomodations,eating anddrinking services
Living-relatedand personalservices andamusementservices
Education,learningsupport
Medical, healthcare andwelfare
Services, n.e.c.
figures(thousand yen)
2012 10,792 16,818 28,675 16,136 4,757 18,108 3,600 6,612 9,0452013 10,498 16,784 28,734 15,803 4,726 17,819 3,578 6,328 8,990
change overprevious year(%)
2013 -2.7 -0.2 0.2 -2.1 -0.7 -1.6 -0.6 -4.3 -0.6
Service industry
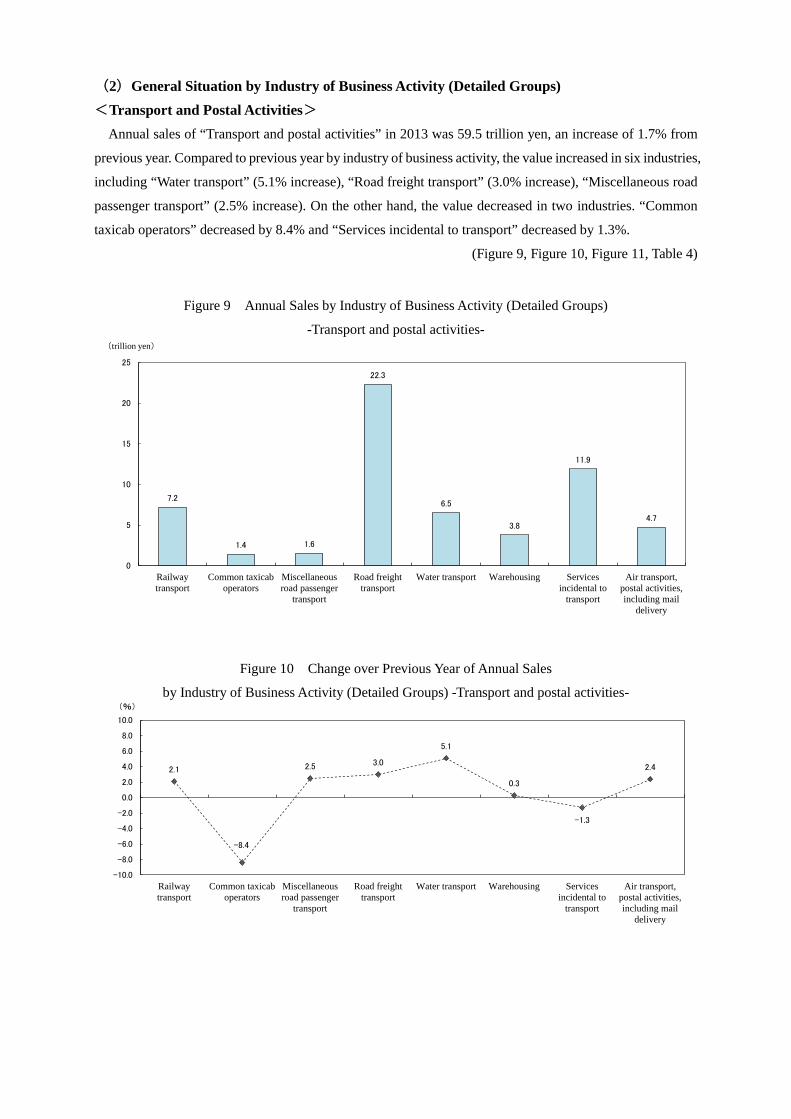
(2)General Situation by Industry of Business Activity (Detailed Groups) <Transport and Postal Activities>
Annual sales of “Transport and postal activities” in 2013 was 59.5 trillion yen, an increase of 1.7% from
previous year. Compared to previous year by industry of business activity, the value increased in six industries,
including “Water transport” (5.1% increase), “Road freight transport” (3.0% increase), “Miscellaneous road
passenger transport” (2.5% increase). On the other hand, the value decreased in two industries. “Common
taxicab operators” decreased by 8.4% and “Services incidental to transport” decreased by 1.3%.
(Figure 9, Figure 10, Figure 11, Table 4)
7.2
1.4 1.6
22.3
6.5
3.8
11.9
4.7
0
5
10
15
20
25
Railwaytransport
Common taxicaboperators
Miscellaneousroad passenger
transport
Road freighttransport
Water transport Warehousing Servicesincidental to
transport
Air transport,postal activities,including mail
delivery
(trillion yen)
Figure 9 Annual Sales by Industry of Business Activity (Detailed Groups)
-Transport and postal activities-
2.1
-8.4
2.5 3.0
5.1
0.3
-1.3
2.4
-10.0
-8.0
-6.0
-4.0
-2.0
0.0
2.0
4.0
6.0
8.0
10.0
Railwaytransport
Common taxicaboperators
Miscellaneousroad passenger
transport
Road freighttransport
Water transport Warehousing Servicesincidental to
transport
Air transport,postal activities,including mail
delivery
(%)
Figure 10 Change over Previous Year of Annual Sales
by Industry of Business Activity (Detailed Groups) -Transport and postal activities-
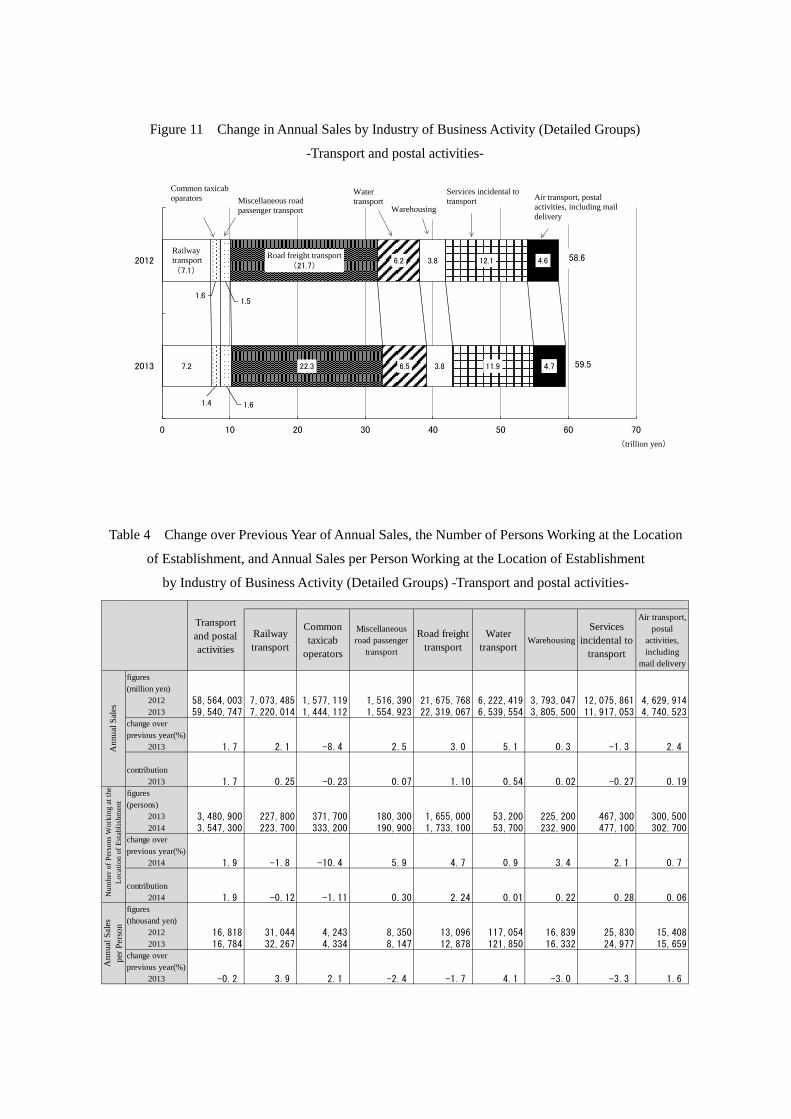
Table 4 Change over Previous Year of Annual Sales, the Number of Persons Working at the Location
of Establishment, and Annual Sales per Person Working at the Location of Establishment
by Industry of Business Activity (Detailed Groups) -Transport and postal activities-
7.2
Railwaytransport(7.1)
1.4
1.6
1.6
1.5
22.3
Road freight transport(21.7)
6.5
6.2
3.8
3.8
11.9
12.1
4.7
4.6
0 10 20 30 40 50 60 70
2013
2012
(trillion yen)
Warehousing
Services incidental to transport Air transport, postal
activities, including mail delivery
58.6
59.5
Common taxicab oparators Miscellaneous road
passenger transport
Water transport
Figure 11 Change in Annual Sales by Industry of Business Activity (Detailed Groups)
-Transport and postal activities-
Railwaytransport
Commontaxicab
operators
Miscellaneousroad passenger
transport
Road freighttransport
Watertransport
WarehousingServices
incidental totransport
Air transport,postal
activities,including
mail deliveryfigures(million yen)
2012 58,564,003 7,073,485 1,577,119 1,516,390 21,675,768 6,222,419 3,793,047 12,075,861 4,629,9142013 59,540,747 7,220,014 1,444,112 1,554,923 22,319,067 6,539,554 3,805,500 11,917,053 4,740,523
change overprevious year(%)
2013 1.7 2.1 -8.4 2.5 3.0 5.1 0.3 -1.3 2.4
contribution2013 1.7 0.25 -0.23 0.07 1.10 0.54 0.02 -0.27 0.19
figures(persons)
2013 3,480,900 227,800 371,700 180,300 1,655,000 53,200 225,200 467,300 300,5002014 3,547,300 223,700 333,200 190,900 1,733,100 53,700 232,900 477,100 302,700
change overprevious year(%)
2014 1.9 -1.8 -10.4 5.9 4.7 0.9 3.4 2.1 0.7
contribution2014 1.9 -0.12 -1.11 0.30 2.24 0.01 0.22 0.28 0.06
figures(thousand yen)
2012 16,818 31,044 4,243 8,350 13,096 117,054 16,839 25,830 15,4082013 16,784 32,267 4,334 8,147 12,878 121,850 16,332 24,977 15,659
change overprevious year(%)
2013 -0.2 3.9 2.1 -2.4 -1.7 4.1 -3.0 -3.3 1.6
Transportand postalactivities
Ann
ual S
ales
Num
ber o
f Per
sons
Wor
king
at t
heLo
catio
n of
Est
ablis
hmen
tA
nnua
l Sal
espe
r Per
son
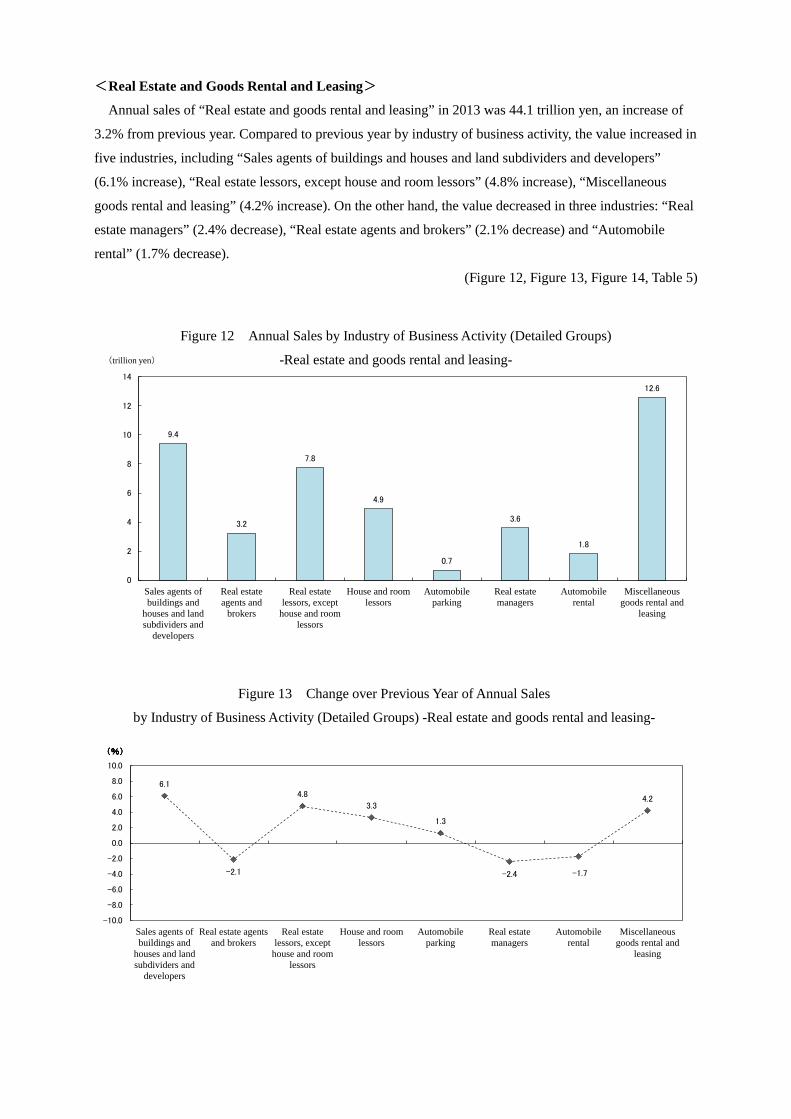
<Real Estate and Goods Rental and Leasing>
Annual sales of “Real estate and goods rental and leasing” in 2013 was 44.1 trillion yen, an increase of
3.2% from previous year. Compared to previous year by industry of business activity, the value increased in
five industries, including “Sales agents of buildings and houses and land subdividers and developers”
(6.1% increase), “Real estate lessors, except house and room lessors” (4.8% increase), “Miscellaneous
goods rental and leasing” (4.2% increase). On the other hand, the value decreased in three industries: “Real
estate managers” (2.4% decrease), “Real estate agents and brokers” (2.1% decrease) and “Automobile
rental” (1.7% decrease).
(Figure 12, Figure 13, Figure 14, Table 5)
9.4
3.2
7.8
4.9
0.7
3.6
1.8
12.6
0
2
4
6
8
10
12
14
Sales agents ofbuildings and
houses and landsubdividers and
developers
Real estateagents and
brokers
Real estatelessors, except
house and roomlessors
House and roomlessors
Automobileparking
Real estatemanagers
Automobilerental
Miscellaneousgoods rental and
leasing
(trillion yen)
Figure 12 Annual Sales by Industry of Business Activity (Detailed Groups)
-Real estate and goods rental and leasing-
6.1
-2.1
4.8
3.3
1.3
-2.4 -1.7
4.2
-10.0
-8.0
-6.0
-4.0
-2.0
0.0
2.0
4.0
6.0
8.0
10.0
Sales agents ofbuildings and
houses and landsubdividers and
developers
Real estate agentsand brokers
Real estatelessors, except
house and roomlessors
House and roomlessors
Automobileparking
Real estatemanagers
Automobilerental
Miscellaneousgoods rental and
leasing
(%)(%)(%)(%)
Figure 13 Change over Previous Year of Annual Sales
by Industry of Business Activity (Detailed Groups) -Real estate and goods rental and leasing-

9.4
8.9
3.2
3.3
7.8
7.4
4.9
4.8
0.7
0.7
3.6
3.7
1.8
1.9
12.6
Miscellaneous goods rental and leasing (12.1)
0 10 20 30 40 50
2013
2012
(trillion yen)
Real estate agents and brokers
Real estate lessors, except house and room lessors
House and room lessors
Automobileparking
Real estate managers
Automobile rental
42.7
44.1
Sales agents of buildings and houses and land subdividers and developers
Figure 14 Change in Annual Sales by Industry of Business Activity (Detailed Groups)
-Real estate and goods rental and leasing-
Table 5 Change over Previous Year of Annual Sales, the Number of Persons Working at the Location
of Establishment, and Annual Sales per Person Working at the Location of Establishment
by Industry of Business Activity (Detailed Groups) -Real estate and goods rental and leasing-
Sales agents ofbuildings and
houses and landsubdividers and
developers
Real estateagents and
brokers
Real estatelessors,
except houseand room
lessors
House androom lessors
Automobileparking
Real estatemanagers
Automobilerental
Miscellaneousgoods rentaland leasing
figures(million yen)
2012 42,700,132 8,873,698 3,317,124 7,405,735 4,768,851 689,406 3,691,374 1,867,606 12,086,3392013 44,081,236 9,416,495 3,248,562 7,760,435 4,926,459 698,384 3,602,443 1,835,946 12,592,512
change overprevious year(%)
2013 3.2 6.1 -2.1 4.8 3.3 1.3 -2.4 -1.7 4.2
contribution2013 3.2 1.27 -0.16 0.83 0.37 0.02 -0.21 -0.07 1.19
figures(persons)
2013 1,487,700 112,300 208,100 183,900 341,100 84,000 244,300 43,100 271,0002014 1,533,100 112,100 215,900 186,900 350,100 81,900 253,400 45,400 287,400
change overprevious year(%)
2014 3.1 -0.2 3.7 1.6 2.6 -2.5 3.7 5.3 6.1
contribution2014 3.1 -0.01 0.52 0.20 0.60 -0.14 0.61 0.15 1.10
figures(thousand yen)
2012 28,675 79,010 15,893 40,237 13,968 8,200 15,079 43,332 44,5722013 28,734 83,977 14,996 41,489 14,062 8,519 14,199 40,408 43,814
change overprevious year(%)
2013 0.2 6.3 -5.6 3.1 0.7 3.9 -5.8 -6.7 -1.7
Real estateand goodsrental and
leasing
Num
ber o
f Per
sons
Wor
king
at t
heLo
catio
n of
Est
ablis
hmen
tA
nnua
l Sal
esA
nnua
l Sal
espe
r Per
son
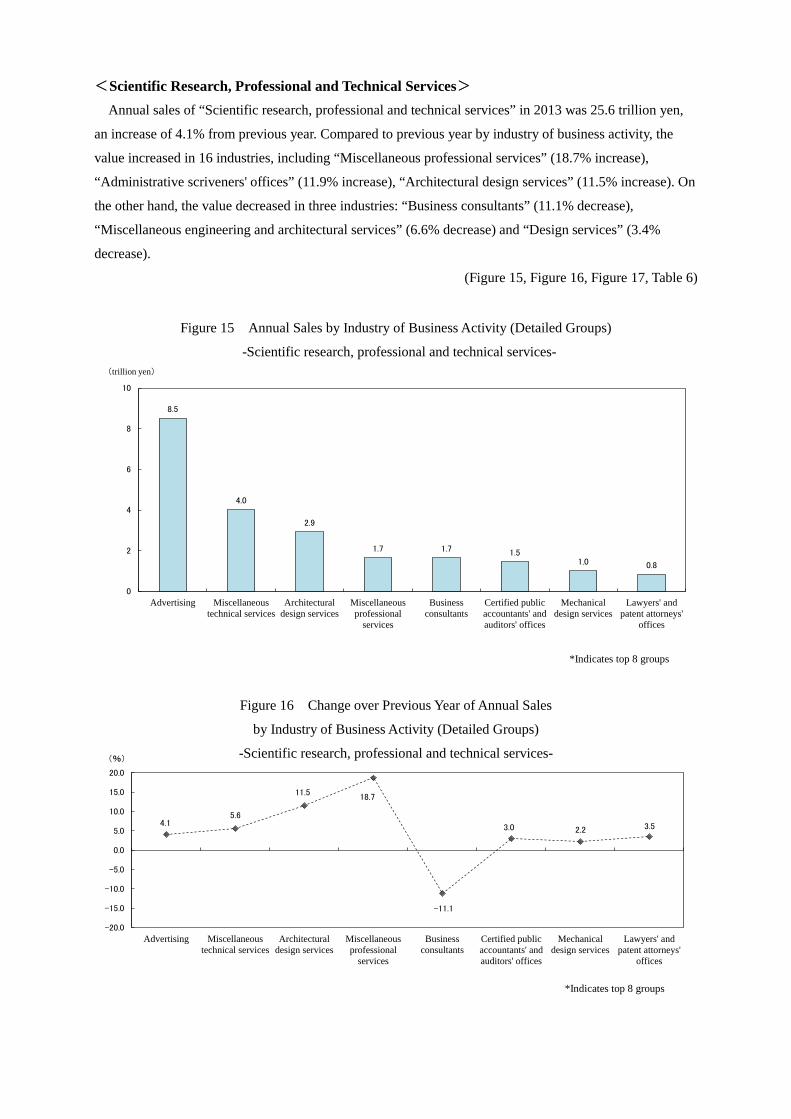
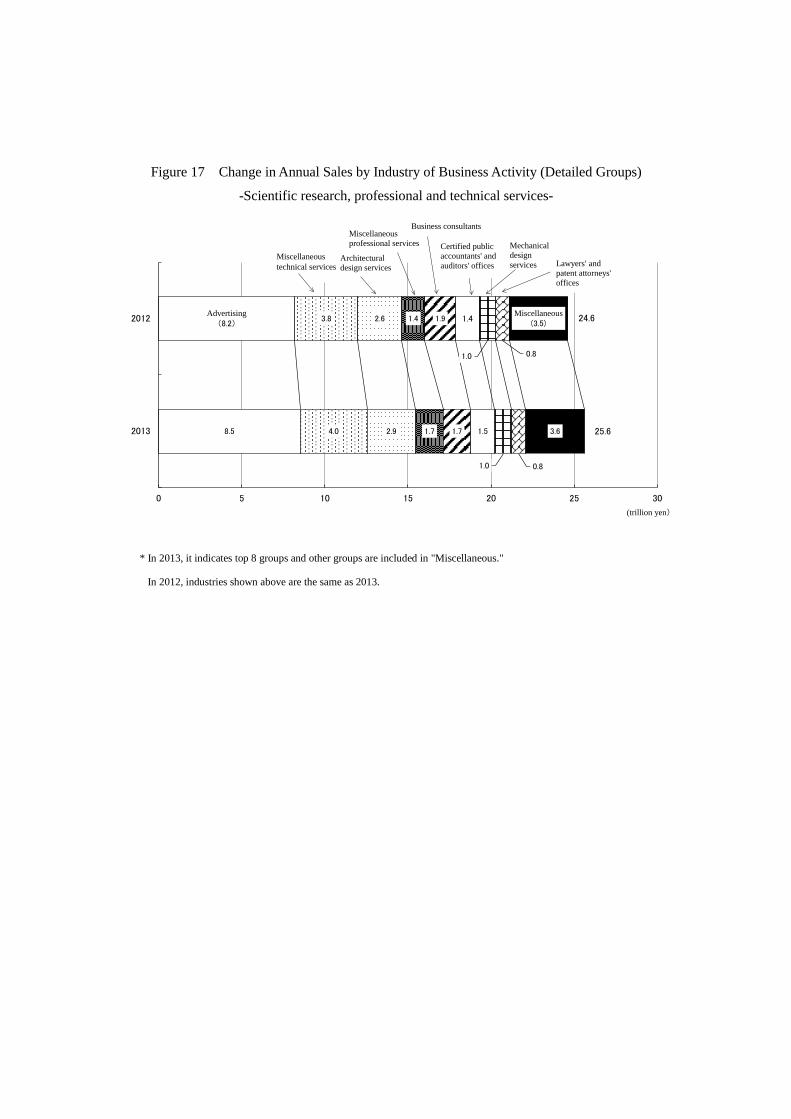
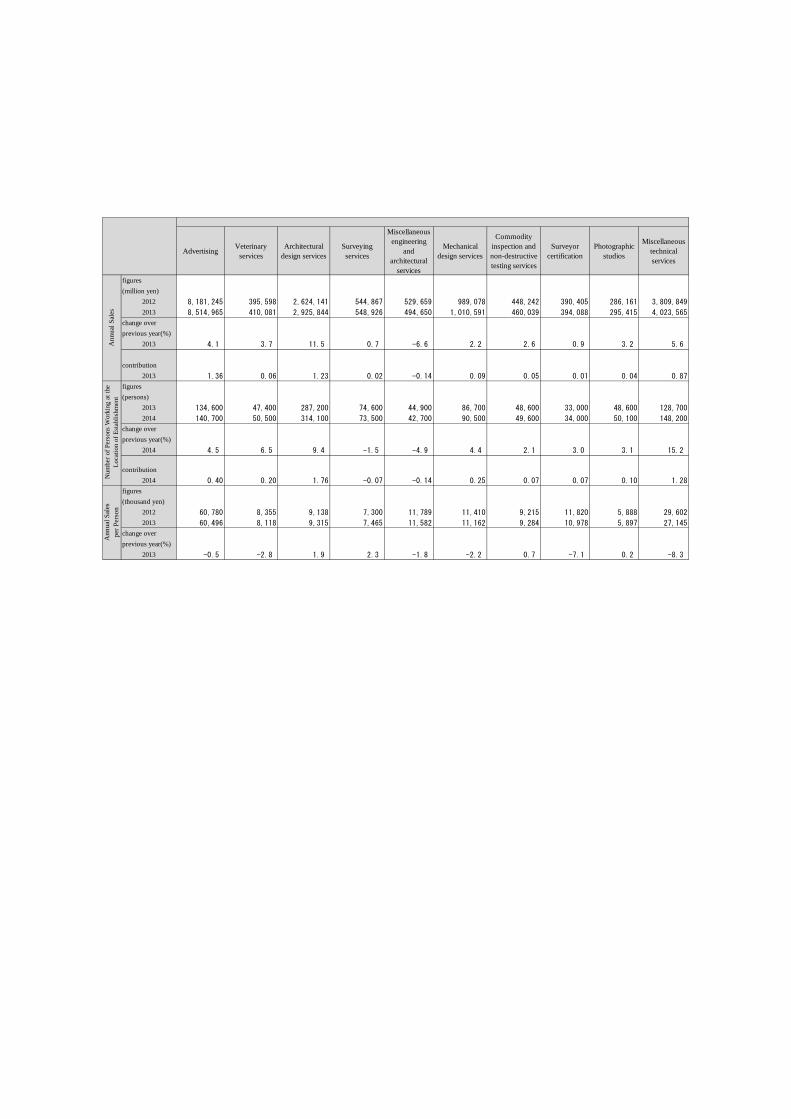
<Scientific Research, Professional and Technical Services> Annual sales of “Scientific research, professional and technical services” in 2013 was 25.6 trillion yen,
an increase of 4.1% from previous year. Compared to previous year by industry of business activity, the
value increased in 16 industries, including “Miscellaneous professional services” (18.7% increase),
“Administrative scriveners' offices” (11.9% increase), “Architectural design services” (11.5% increase). On
the other hand, the value decreased in three industries: “Business consultants” (11.1% decrease),
“Miscellaneous engineering and architectural services” (6.6% decrease) and “Design services” (3.4%
decrease).
(Figure 15, Figure 16, Figure 17, Table 6)
8.5
4.0
2.9
1.7 1.7 1.5 1.0 0.8
0
2
4
6
8
10
Advertising Miscellaneoustechnical services
Architecturaldesign services
Miscellaneousprofessional
services
Businessconsultants
Certified publicaccountants' andauditors' offices
Mechanicaldesign services
Lawyers' andpatent attorneys'
offices
(trillion yen)
Figure 15 Annual Sales by Industry of Business Activity (Detailed Groups)
-Scientific research, professional and technical services-
*Indicates top 8 groups
4.1 5.6
11.5 18.7
-11.1
3.0 2.2 3.5
-20.0
-15.0
-10.0
-5.0
0.0
5.0
10.0
15.0
20.0
Advertising Miscellaneoustechnical services
Architecturaldesign services
Miscellaneousprofessional
services
Businessconsultants
Certified publicaccountants' andauditors' offices
Mechanicaldesign services
Lawyers' andpatent attorneys'
offices
(%)
Figure 16 Change over Previous Year of Annual Sales
by Industry of Business Activity (Detailed Groups)
-Scientific research, professional and technical services-
*Indicates top 8 groups
8.5
Advertising(8.2)
4.0
3.8
2.9
2.6
1.7
1.4
1.7
1.9
1.5
1.4
1.0
1.0
0.8
0.8
3.6
Miscellaneous(3.5)
0 5 10 15 20 25 30
2013
2012
(trillion yen)
Miscellaneous technical services
Business consultants
法律事務所,
特許事務所
Architecturaldesign services
Miscellaneousprofessional services Certified public
accountants' and auditors' offices
Mechanicaldesign services Lawyers' and
patent attorneys' offices
24.6
25.6
Figure 17 Change in Annual Sales by Industry of Business Activity (Detailed Groups)
-Scientific research, professional and technical services-
* In 2013, it indicates top 8 groups and other groups are included in "Miscellaneous."
In 2012, industries shown above are the same as 2013.
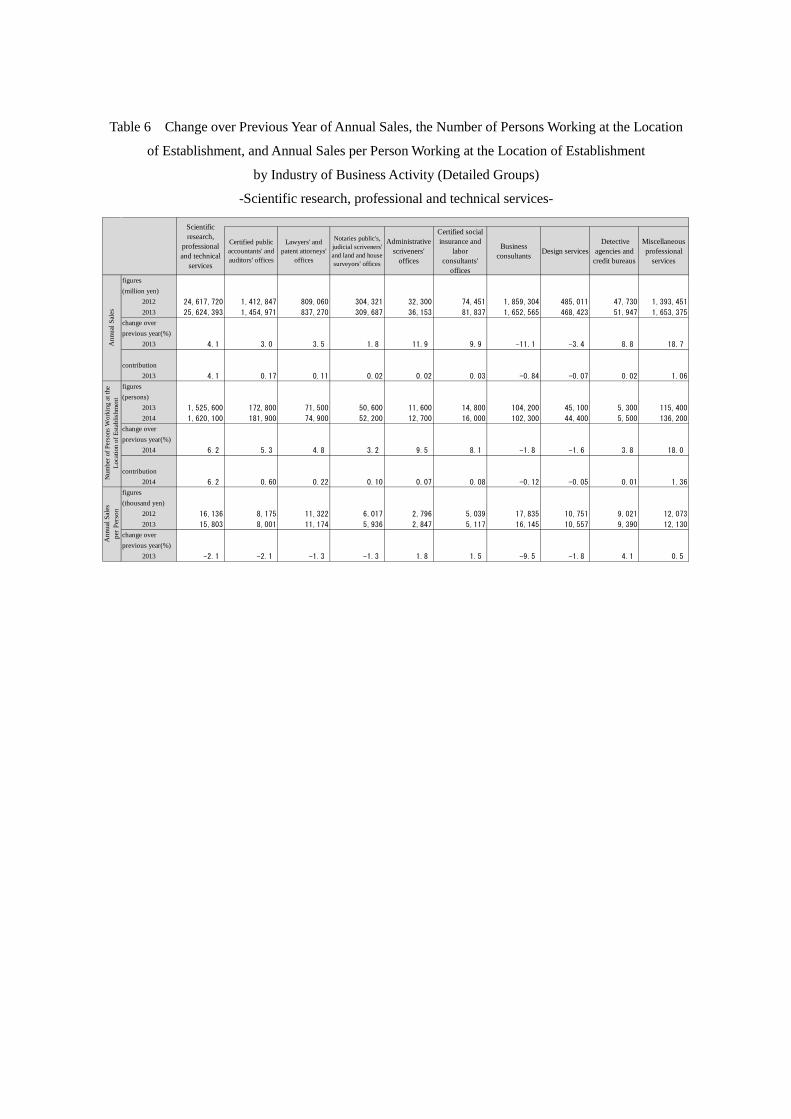
Table 6 Change over Previous Year of Annual Sales, the Number of Persons Working at the Location
of Establishment, and Annual Sales per Person Working at the Location of Establishment
by Industry of Business Activity (Detailed Groups)
-Scientific research, professional and technical services-
Certified publicaccountants' andauditors' offices
Lawyers' andpatent attorneys'
offices
Notaries public's,judicial scriveners'and land and housesurveyors' offices
Administrativescriveners'
offices
Certified socialinsurance and
laborconsultants'
offices
Businessconsultants Design services
Detectiveagencies and
credit bureaus
Miscellaneousprofessional
services
figures(million yen)
2012 24,617,720 1,412,847 809,060 304,321 32,300 74,451 1,859,304 485,011 47,730 1,393,451
2013 25,624,393 1,454,971 837,270 309,687 36,153 81,837 1,652,565 468,423 51,947 1,653,375
change overprevious year(%)
2013 4.1 3.0 3.5 1.8 11.9 9.9 -11.1 -3.4 8.8 18.7
contribution2013 4.1 0.17 0.11 0.02 0.02 0.03 -0.84 -0.07 0.02 1.06
figures(persons)
2013 1,525,600 172,800 71,500 50,600 11,600 14,800 104,200 45,100 5,300 115,400
2014 1,620,100 181,900 74,900 52,200 12,700 16,000 102,300 44,400 5,500 136,200
change overprevious year(%)
2014 6.2 5.3 4.8 3.2 9.5 8.1 -1.8 -1.6 3.8 18.0
contribution2014 6.2 0.60 0.22 0.10 0.07 0.08 -0.12 -0.05 0.01 1.36
figures(thousand yen)
2012 16,136 8,175 11,322 6,017 2,796 5,039 17,835 10,751 9,021 12,073
2013 15,803 8,001 11,174 5,936 2,847 5,117 16,145 10,557 9,390 12,130
change overprevious year(%)
2013 -2.1 -2.1 -1.3 -1.3 1.8 1.5 -9.5 -1.8 4.1 0.5
Scientificresearch,
professionaland technical
services
Ann
ual S
ales
Num
ber o
f Per
sons
Wor
king
at t
heLo
catio
n of
Est
ablis
hmen
tA
nnua
l Sal
espe
r Per
son
Advertising Veterinaryservices
Architecturaldesign services
Surveyingservices
Miscellaneousengineering
andarchitectural
services
Mechanicaldesign services
Commodityinspection andnon-destructivetesting services
Surveyorcertification
Photographicstudios
Miscellaneoustechnicalservices
figures(million yen)
2012 8,181,245 395,598 2,624,141 544,867 529,659 989,078 448,242 390,405 286,161 3,809,849
2013 8,514,965 410,081 2,925,844 548,926 494,650 1,010,591 460,039 394,088 295,415 4,023,565
change overprevious year(%)
2013 4.1 3.7 11.5 0.7 -6.6 2.2 2.6 0.9 3.2 5.6
contribution2013 1.36 0.06 1.23 0.02 -0.14 0.09 0.05 0.01 0.04 0.87
figures(persons)
2013 134,600 47,400 287,200 74,600 44,900 86,700 48,600 33,000 48,600 128,700
2014 140,700 50,500 314,100 73,500 42,700 90,500 49,600 34,000 50,100 148,200
change overprevious year(%)
2014 4.5 6.5 9.4 -1.5 -4.9 4.4 2.1 3.0 3.1 15.2
contribution2014 0.40 0.20 1.76 -0.07 -0.14 0.25 0.07 0.07 0.10 1.28
figures(thousand yen)
2012 60,780 8,355 9,138 7,300 11,789 11,410 9,215 11,820 5,888 29,602
2013 60,496 8,118 9,315 7,465 11,582 11,162 9,284 10,978 5,897 27,145
change overprevious year(%)
2013 -0.5 -2.8 1.9 2.3 -1.8 -2.2 0.7 -7.1 0.2 -8.3
Ann
ual S
ales
per P
erso
nA
nnua
l Sal
esN
umbe
r of P
erso
ns W
orki
ng a
t the
Loca
tion
of E
stab
lishm
ent
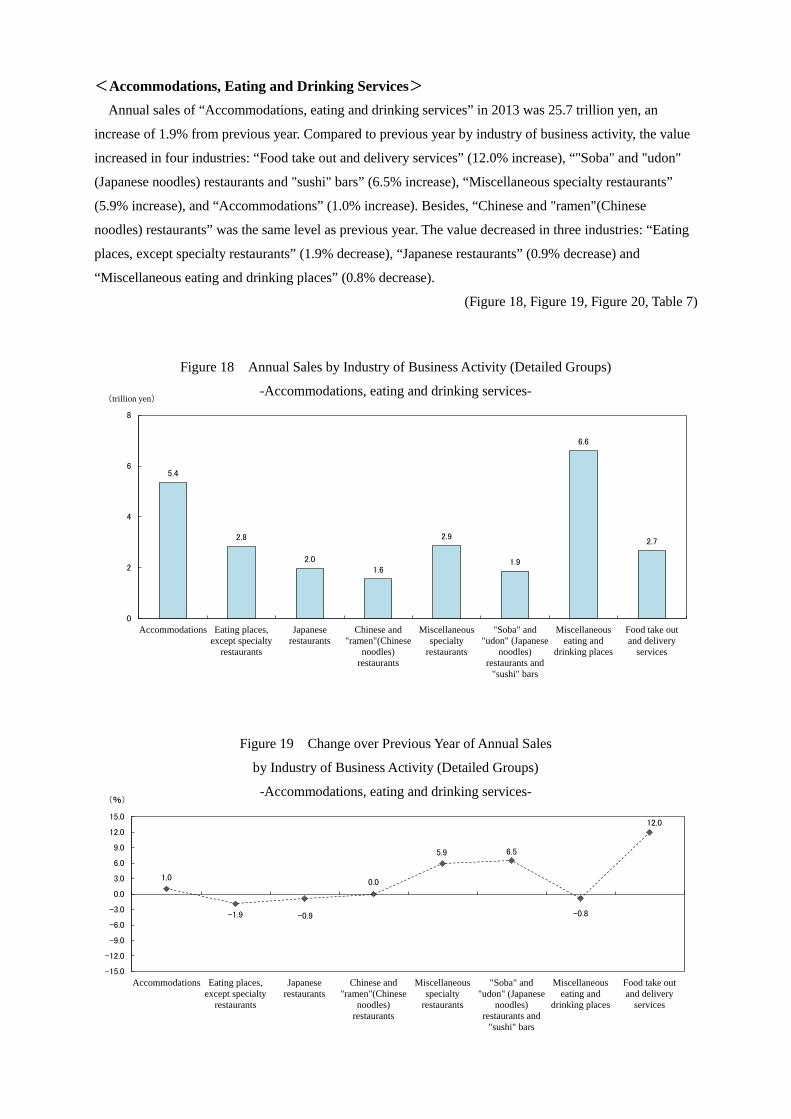
<Accommodations, Eating and Drinking Services> Annual sales of “Accommodations, eating and drinking services” in 2013 was 25.7 trillion yen, an
increase of 1.9% from previous year. Compared to previous year by industry of business activity, the value
increased in four industries: “Food take out and delivery services” (12.0% increase), “"Soba" and "udon"
(Japanese noodles) restaurants and "sushi" bars” (6.5% increase), “Miscellaneous specialty restaurants”
(5.9% increase), and “Accommodations” (1.0% increase). Besides, “Chinese and "ramen"(Chinese
noodles) restaurants” was the same level as previous year. The value decreased in three industries: “Eating
places, except specialty restaurants” (1.9% decrease), “Japanese restaurants” (0.9% decrease) and
“Miscellaneous eating and drinking places” (0.8% decrease).
(Figure 18, Figure 19, Figure 20, Table 7)
5.4
2.8
2.0 1.6
2.9
1.9
6.6
2.7
0
2
4
6
8
Accommodations Eating places,except specialty
restaurants
Japaneserestaurants
Chinese and"ramen"(Chinese
noodles)restaurants
Miscellaneousspecialty
restaurants
"Soba" and"udon" (Japanese
noodles)restaurants and
"sushi" bars
Miscellaneouseating and
drinking places
Food take outand delivery
services
(trillion yen)
Figure 18 Annual Sales by Industry of Business Activity (Detailed Groups)
-Accommodations, eating and drinking services-
1.0
-1.9 -0.9
0.0
5.9 6.5
-0.8
12.0
-15.0
-12.0
-9.0
-6.0
-3.0
0.0
3.0
6.0
9.0
12.0
15.0
Accommodations Eating places,except specialty
restaurants
Japaneserestaurants
Chinese and"ramen"(Chinese
noodles)restaurants
Miscellaneousspecialty
restaurants
"Soba" and"udon" (Japanese
noodles)restaurants and
"sushi" bars
Miscellaneouseating and
drinking places
Food take outand delivery
services
(%)
Figure 19 Change over Previous Year of Annual Sales
by Industry of Business Activity (Detailed Groups)
-Accommodations, eating and drinking services-

5.4
Accommodations(5.3)
2.8
2.9
2.0
2.0
1.6
1.6
2.9
2.7
1.9
1.7
6.6
Miscellaneous eating and drinking places (6.7)
2.7
2.4
0 5 10 15 20 25 30
2013
2012
(trillion yen)
Eating places, except specialty restaurants
Food take out and delivery services
Chinese and "ramen"(Chinese noodles) restaurants
25.2
25.7
Japaneserestaurants Miscellaneous
specialty restaurants
"Soba" and "udon" (Japanese noodles) restaurants and "sushi" bars
Figure 20 Change in Annual Sales by Industry of Business Activity (Detailed Groups)
-Accommodations, eating and drinking services-
Table 7 Change over Previous Year of Annual Sales, the Number of Persons Working at the Location
of Establishment, and Annual Sales per Person Working at the Location of Establishment
by Industry of Business Activity (Detailed Groups) -Accommodations, eating and drinking services-
AccommodationsEating places,
except specialtyrestaurants
Japaneserestaurants
Chinese and"ramen"(Chinese
noodles)restaurants
Miscellaneousspecialty
restaurants
"Soba" and "udon"(Japanese noodles)
restaurants and"sushi" bars
Miscellaneouseating and
drinking places
Food take outand delivery
services
figures(million yen)
2012 25,243,062 5,300,235 2,893,499 1,991,473 1,556,224 2,710,507 1,749,295 6,651,760 2,390,0682013 25,734,294 5,353,606 2,839,041 1,973,433 1,556,413 2,870,840 1,862,700 6,601,410 2,676,850
change overprevious year(%)
2013 1.9 1.0 -1.9 -0.9 0.0 5.9 6.5 -0.8 12.0
contribution2013 1.9 0.21 -0.22 -0.07 0.00 0.64 0.45 -0.20 1.14
figures(persons)
2013 5,305,400 660,800 615,900 459,600 350,200 595,300 399,800 1,706,100 517,6002014 5,444,800 674,500 630,000 437,800 351,000 624,000 420,100 1,723,800 583,600
change overprevious year(%)
2014 2.6 2.1 2.3 -4.7 0.2 4.8 5.1 1.0 12.8
contribution2014 2.6 0.26 0.27 -0.41 0.02 0.54 0.38 0.33 1.24
figures(thousand yen)
2012 4,757 8,018 4,696 4,333 4,444 4,553 4,375 3,899 4,6172013 4,726 7,936 4,503 4,507 4,434 4,600 4,434 3,829 4,586
change overprevious year(%)
2013 -0.7 -1.0 -4.1 4.0 -0.2 1.0 1.3 -1.8 -0.7
Accommodations,eating and
drinking sevices
Ann
ual S
ales
Num
ber o
f Per
sons
Wor
king
at t
heLo
catio
n of
Est
ablis
hmen
tA
nnua
l Sal
espe
r Per
son
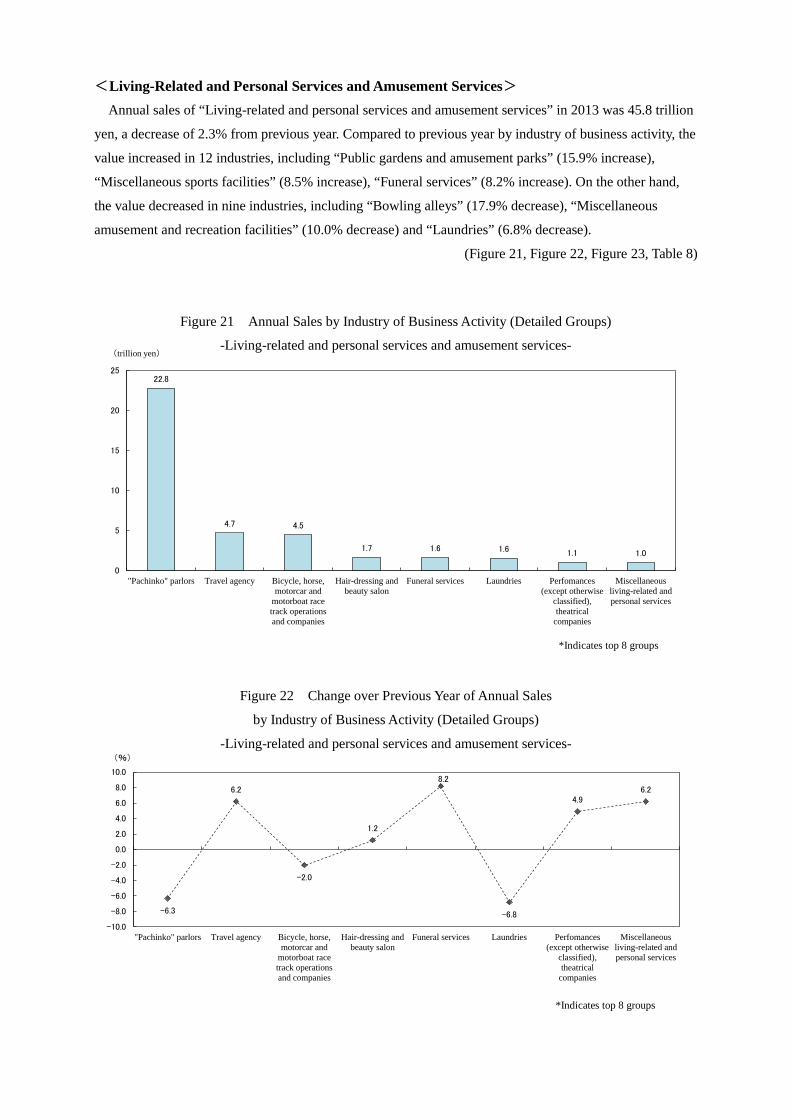
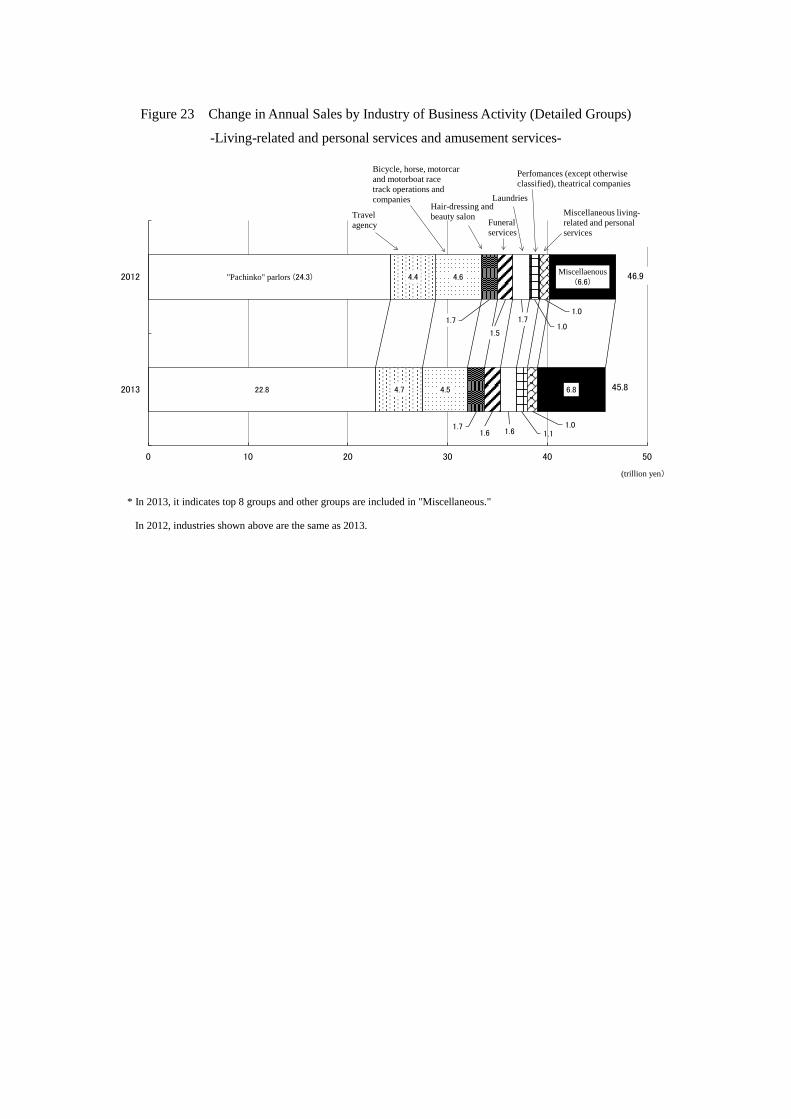
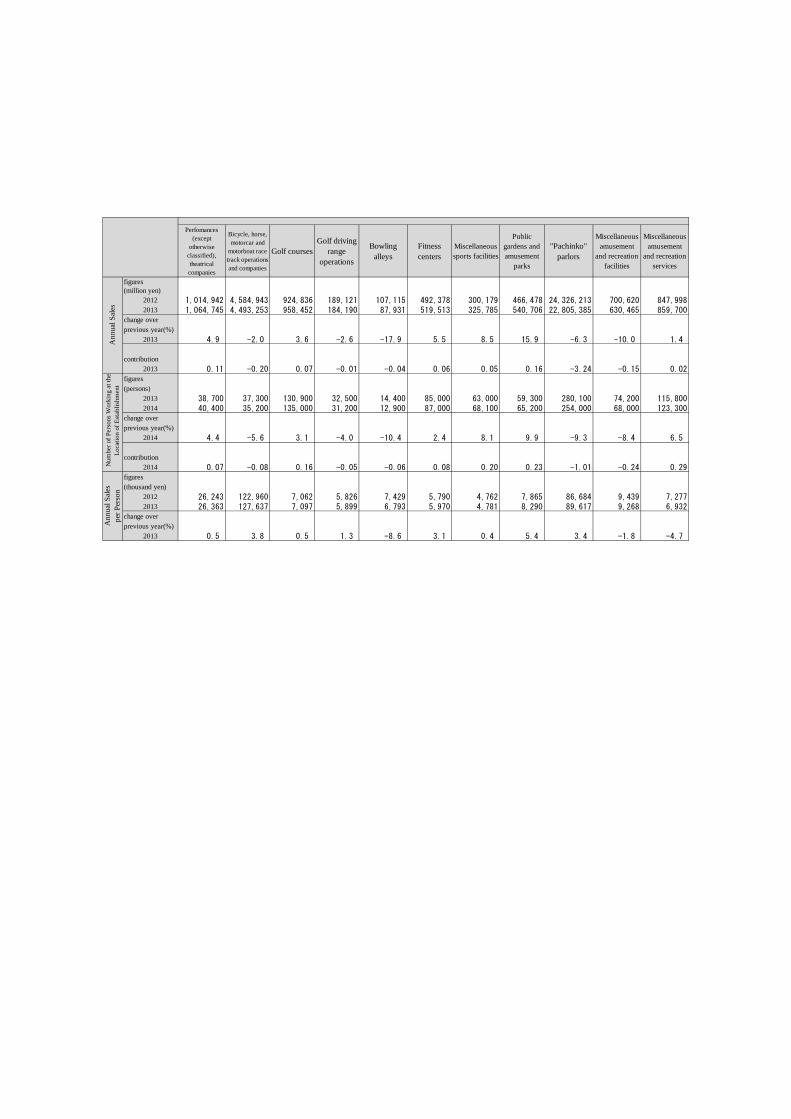
<Living-Related and Personal Services and Amusement Services> Annual sales of “Living-related and personal services and amusement services” in 2013 was 45.8 trillion
yen, a decrease of 2.3% from previous year. Compared to previous year by industry of business activity, the
value increased in 12 industries, including “Public gardens and amusement parks” (15.9% increase),
“Miscellaneous sports facilities” (8.5% increase), “Funeral services” (8.2% increase). On the other hand,
the value decreased in nine industries, including “Bowling alleys” (17.9% decrease), “Miscellaneous
amusement and recreation facilities” (10.0% decrease) and “Laundries” (6.8% decrease).
(Figure 21, Figure 22, Figure 23, Table 8)
22.8
4.7 4.5
1.7 1.6 1.6 1.1 1.0
0
5
10
15
20
25
"Pachinko" parlors Travel agency Bicycle, horse,motorcar and
motorboat racetrack operationsand companies
Hair-dressing andbeauty salon
Funeral services Laundries Perfomances(except otherwise
classified),theatrical
companies
Miscellaneousliving-related andpersonal services
(trillion yen)
Figure 21 Annual Sales by Industry of Business Activity (Detailed Groups)
-Living-related and personal services and amusement services-
*Indicates top 8 groups
-6.3
6.2
-2.0
1.2
8.2
-6.8
4.9 6.2
-10.0
-8.0
-6.0
-4.0
-2.0
0.0
2.0
4.0
6.0
8.0
10.0
"Pachinko" parlors Travel agency Bicycle, horse,motorcar and
motorboat racetrack operationsand companies
Hair-dressing andbeauty salon
Funeral services Laundries Perfomances(except otherwise
classified),theatrical
companies
Miscellaneousliving-related andpersonal services
(%)
Figure 22 Change over Previous Year of Annual Sales
by Industry of Business Activity (Detailed Groups)
-Living-related and personal services and amusement services-
*Indicates top 8 groups
22.8
"Pachinko" parlors (24.3)
4.7
4.4
4.5
4.6
1.7
1.7
1.6
1.5
1.6
1.7
1.1
1.0
1.0
1.0
6.8
Miscellaenous(6.6)
0 10 20 30 40 50
2013
2012
(trillion yen)
Travel agency
Bicycle, horse, motorcar and motorboat race track operations and companies
Funeralservices
Hair-dressing and beauty salon
Perfomances (except otherwise classified), theatrical companies
Miscellaneous living-related and personal services
46.9
45.8
Laundries
Figure 23 Change in Annual Sales by Industry of Business Activity (Detailed Groups)
-Living-related and personal services and amusement services-
* In 2013, it indicates top 8 groups and other groups are included in "Miscellaneous."
In 2012, industries shown above are the same as 2013.

Table 8 Change over Previous Year of Annual Sales, the Number of Persons Working at the Location of
Establishment, and Annual Sales per Person Working at the Location of Establishment
by Industry of Business Activity (Detailed Groups)
-Living-related and personal services and amusement services-
Laundries Barbershops
Hair-dressingand beauty
salon
Miscellaneouslaundry,
beauty andbath services
Travelagency
Funeralservices
Weddingceremony
halls
Ceremonialoccasion
mutual aidsociety
Miscellaneousliving-relatedand personal
services
Cinemas
figures(million yen)
2012 46,870,616 1,690,007 470,115 1,661,035 977,394 4,445,245 1,524,710 776,447 176,576 974,785 219,4782013 45,790,721 1,574,371 460,368 1,680,303 972,941 4,722,533 1,649,685 832,416 178,789 1,035,425 213,765
change overprevious year(%)
2013 -2.3 -6.8 -2.1 1.2 -0.5 6.2 8.2 7.2 1.3 6.2 -2.6
contribution2013 -2.3 -0.25 -0.02 0.04 -0.01 0.59 0.27 0.12 0.00 0.13 -0.01
figures(persons)
2013 2,584,900 350,600 211,100 436,700 185,300 98,900 96,800 64,800 16,200 176,000 17,2002014 2,565,800 327,900 204,400 439,900 185,200 99,300 107,700 70,600 15,800 177,600 16,900
change overprevious year(%)
2014 -0.7 -6.5 -3.2 0.7 -0.1 0.4 11.3 9.0 -2.5 0.9 -1.7
contribution2014 -0.7 -0.88 -0.26 0.12 0.00 0.02 0.42 0.22 -0.02 0.06 -0.01
figures(thousand yen)
2012 18,108 4,821 2,227 3,787 5,255 44,903 15,743 11,980 10,899 5,536 12,7952013 17,819 4,801 2,253 3,802 5,224 47,576 15,250 11,789 11,282 5,828 12,639
change overprevious year(%)
2013 -1.6 -0.4 1.2 0.4 -0.6 6.0 -3.1 -1.6 3.5 5.3 -1.2
Ann
ual S
ales
Living-relatedand personalservices andamusement
services
Num
ber o
f Per
sons
Wor
king
at t
heLo
catio
n of
Est
ablis
hmen
tA
nnua
l Sal
espe
r per
son
Perfomances(except
otherwiseclassified),theatrical
companies
Bicycle, horse,motorcar and
motorboat racetrack operationsand companies
Golf coursesGolf driving
rangeoperations
Bowlingalleys
Fitnesscenters
Miscellaneoussports facilities
Publicgardens andamusement
parks
"Pachinko"parlors
Miscellaneousamusement
and recreationfacilities
Miscellaneousamusement
and recreationservices
figures(million yen)
2012 1,014,942 4,584,943 924,836 189,121 107,115 492,378 300,179 466,478 24,326,213 700,620 847,9982013 1,064,745 4,493,253 958,452 184,190 87,931 519,513 325,785 540,706 22,805,385 630,465 859,700
change overprevious year(%)
2013 4.9 -2.0 3.6 -2.6 -17.9 5.5 8.5 15.9 -6.3 -10.0 1.4
contribution2013 0.11 -0.20 0.07 -0.01 -0.04 0.06 0.05 0.16 -3.24 -0.15 0.02
figures(persons)
2013 38,700 37,300 130,900 32,500 14,400 85,000 63,000 59,300 280,100 74,200 115,8002014 40,400 35,200 135,000 31,200 12,900 87,000 68,100 65,200 254,000 68,000 123,300
change overprevious year(%)
2014 4.4 -5.6 3.1 -4.0 -10.4 2.4 8.1 9.9 -9.3 -8.4 6.5
contribution2014 0.07 -0.08 0.16 -0.05 -0.06 0.08 0.20 0.23 -1.01 -0.24 0.29
figures(thousand yen)
2012 26,243 122,960 7,062 5,826 7,429 5,790 4,762 7,865 86,684 9,439 7,2772013 26,363 127,637 7,097 5,899 6,793 5,970 4,781 8,290 89,617 9,268 6,932
change overprevious year(%)
2013 0.5 3.8 0.5 1.3 -8.6 3.1 0.4 5.4 3.4 -1.8 -4.7
Ann
ual S
ales
Num
ber o
f Per
sons
Wor
king
at t
heLo
catio
n of
Est
ablis
hmen
tA
nnua
l Sal
espe
r Per
son
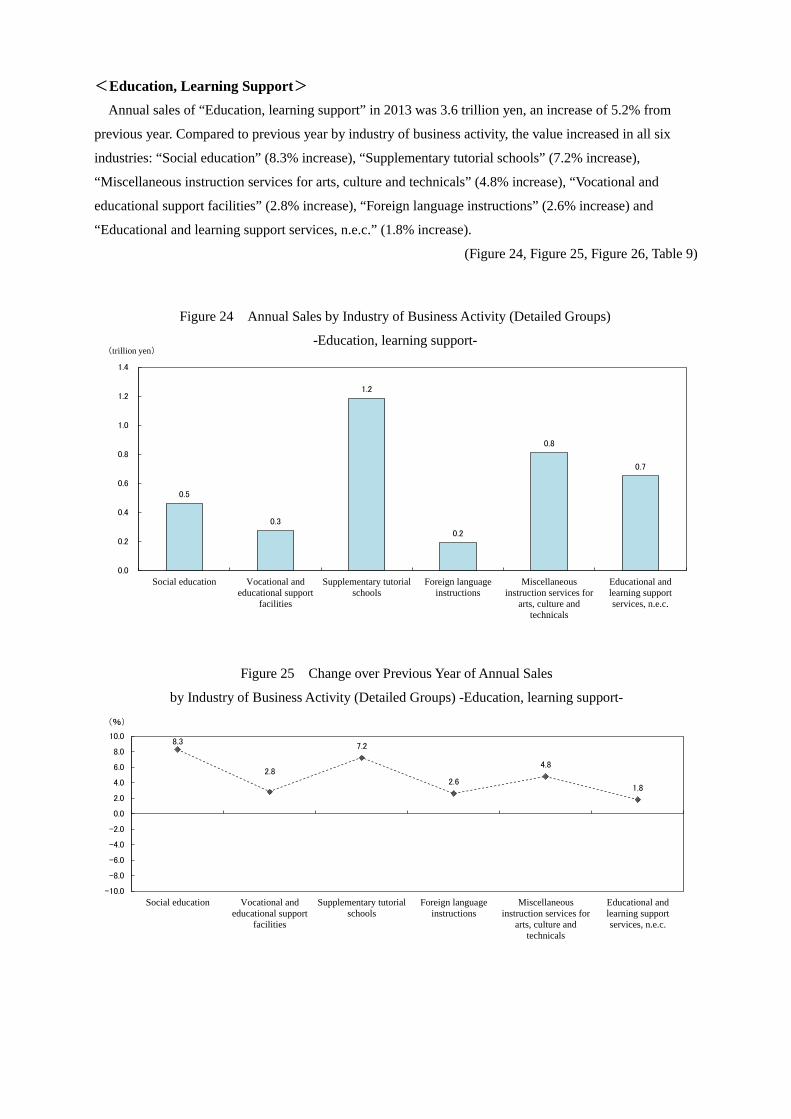
<Education, Learning Support> Annual sales of “Education, learning support” in 2013 was 3.6 trillion yen, an increase of 5.2% from
previous year. Compared to previous year by industry of business activity, the value increased in all six
industries: “Social education” (8.3% increase), “Supplementary tutorial schools” (7.2% increase),
“Miscellaneous instruction services for arts, culture and technicals” (4.8% increase), “Vocational and
educational support facilities” (2.8% increase), “Foreign language instructions” (2.6% increase) and
“Educational and learning support services, n.e.c.” (1.8% increase).
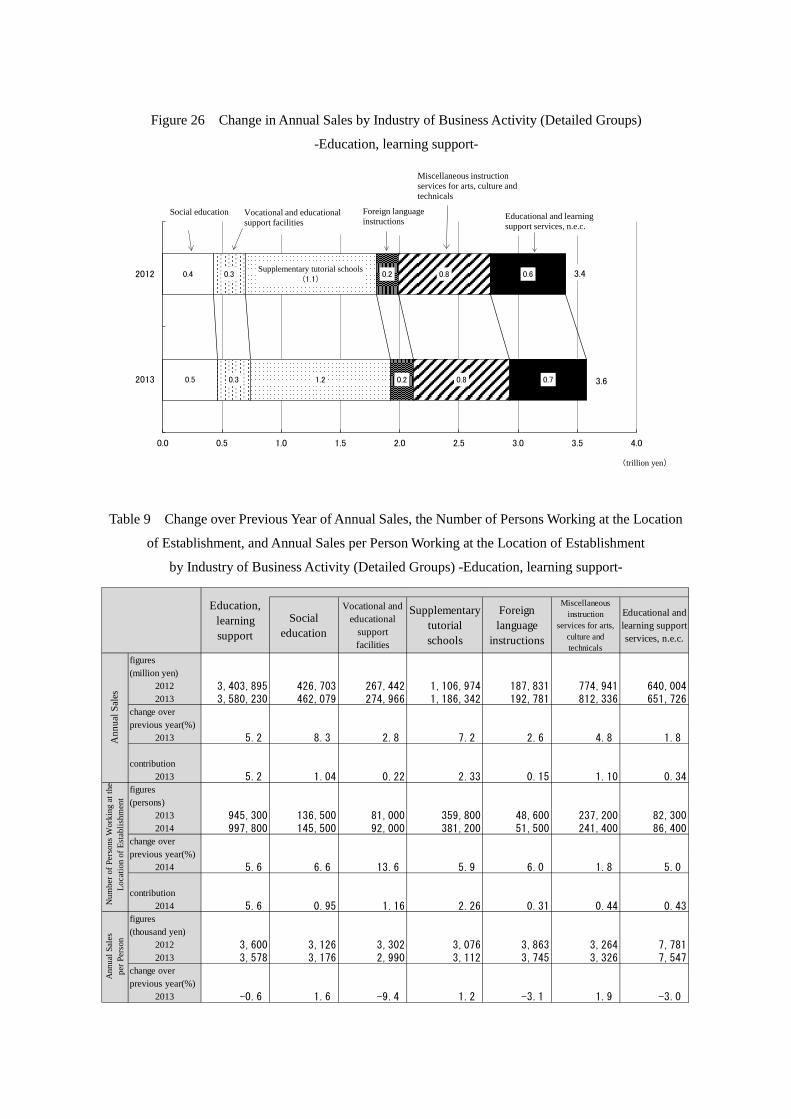
(Figure 24, Figure 25, Figure 26, Table 9)
0.5
0.3
1.2
0.2
0.8
0.7
0.0
0.2
0.4
0.6
0.8
1.0
1.2
1.4
Social education Vocational andeducational support
facilities
Supplementary tutorialschools
Foreign languageinstructions
Miscellaneousinstruction services for
arts, culture andtechnicals
Educational andlearning supportservices, n.e.c.
(trillion yen)
Figure 24 Annual Sales by Industry of Business Activity (Detailed Groups)
-Education, learning support-
8.3
2.8
7.2
2.6
4.8
1.8
-10.0
-8.0
-6.0
-4.0
-2.0
0.0
2.0
4.0
6.0
8.0
10.0
Social education Vocational andeducational support
facilities
Supplementary tutorialschools
Foreign languageinstructions
Miscellaneousinstruction services for
arts, culture andtechnicals
Educational andlearning supportservices, n.e.c.
(%)
Figure 25 Change over Previous Year of Annual Sales
by Industry of Business Activity (Detailed Groups) -Education, learning support-
0.5
0.4
0.3
0.3
1.2
Supplementary tutorial schools (1.1)
0.2
0.2
0.8
0.8
0.7
0.6
0.0 0.5 1.0 1.5 2.0 2.5 3.0 3.5 4.0
2013
2012
(trillion yen)
Vocational and educationalsupport facilities
Foreign language instructions Educational and learning
support services, n.e.c.
3.4
3.6
Social education
Miscellaneous instruction services for arts, culture and technicals
Table 9 Change over Previous Year of Annual Sales, the Number of Persons Working at the Location
of Establishment, and Annual Sales per Person Working at the Location of Establishment
by Industry of Business Activity (Detailed Groups) -Education, learning support-
Figure 26 Change in Annual Sales by Industry of Business Activity (Detailed Groups)
-Education, learning support-
Socialeducation
Vocational andeducational
supportfacilities
Supplementarytutorialschools
Foreignlanguage
instructions
Miscellaneousinstruction
services for arts,culture andtechnicals
Educational andlearning supportservices, n.e.c.
figures(million yen)
2012 3,403,895 426,703 267,442 1,106,974 187,831 774,941 640,0042013 3,580,230 462,079 274,966 1,186,342 192,781 812,336 651,726
change overprevious year(%)
2013 5.2 8.3 2.8 7.2 2.6 4.8 1.8
contribution2013 5.2 1.04 0.22 2.33 0.15 1.10 0.34
figures(persons)
2013 945,300 136,500 81,000 359,800 48,600 237,200 82,3002014 997,800 145,500 92,000 381,200 51,500 241,400 86,400
change overprevious year(%)
2014 5.6 6.6 13.6 5.9 6.0 1.8 5.0
contribution2014 5.6 0.95 1.16 2.26 0.31 0.44 0.43
figures(thousand yen)
2012 3,600 3,126 3,302 3,076 3,863 3,264 7,7812013 3,578 3,176 2,990 3,112 3,745 3,326 7,547
change overprevious year(%)
2013 -0.6 1.6 -9.4 1.2 -3.1 1.9 -3.0
Education,learningsupport
Ann
ual S
ales
Num
ber o
f Per
sons
Wor
king
at t
heLo
catio
n of
Est
ablis
hmen
tA
nnua
l Sal
espe
r Per
son
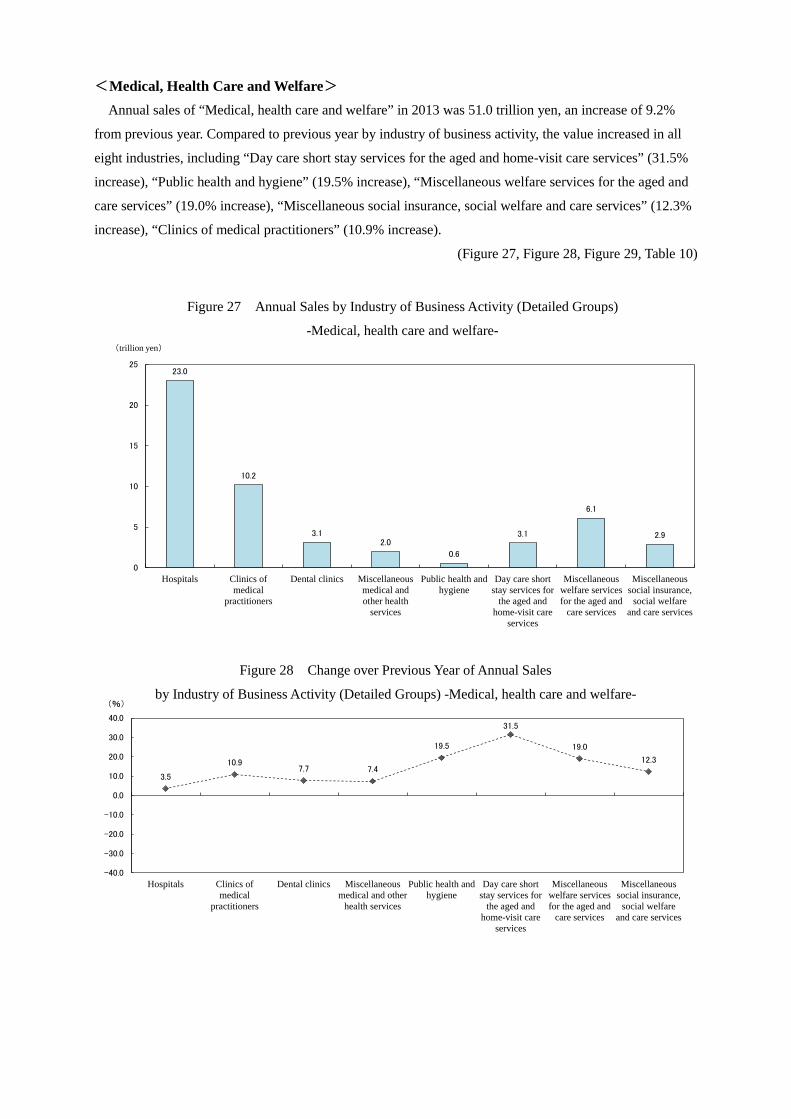
<Medical, Health Care and Welfare>
Annual sales of “Medical, health care and welfare” in 2013 was 51.0 trillion yen, an increase of 9.2%
from previous year. Compared to previous year by industry of business activity, the value increased in all
eight industries, including “Day care short stay services for the aged and home-visit care services” (31.5%
increase), “Public health and hygiene” (19.5% increase), “Miscellaneous welfare services for the aged and
care services” (19.0% increase), “Miscellaneous social insurance, social welfare and care services” (12.3%
increase), “Clinics of medical practitioners” (10.9% increase).
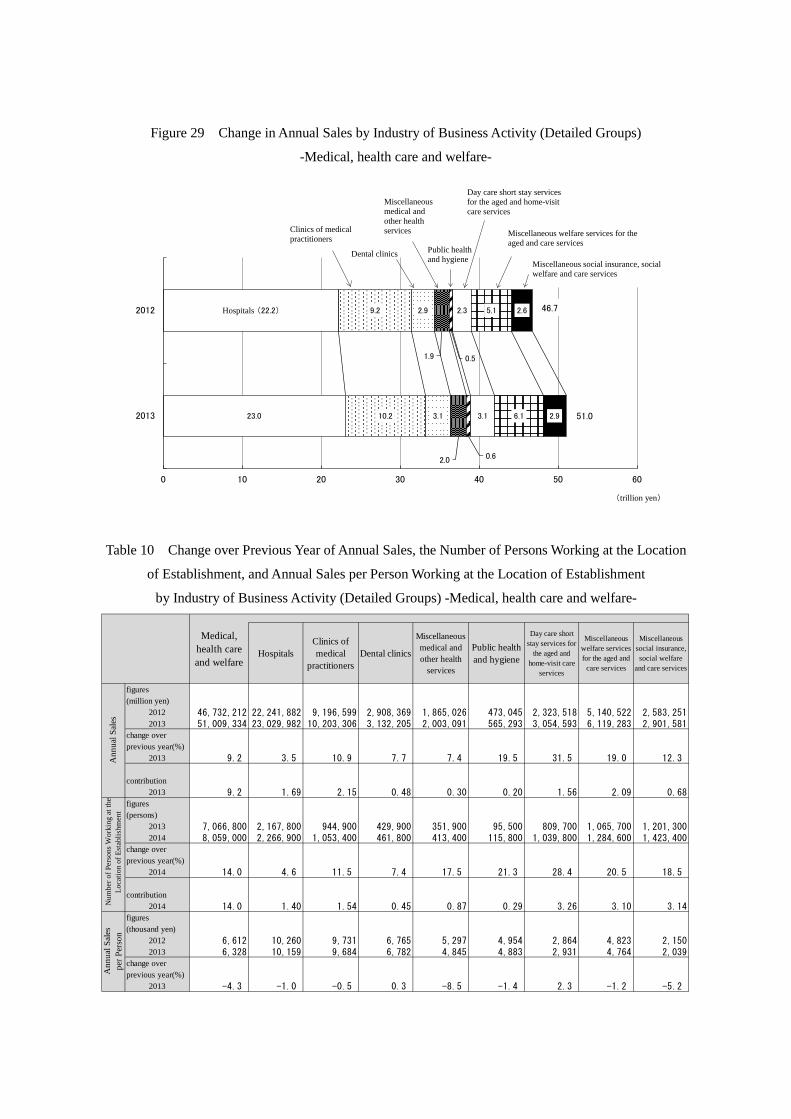
(Figure 27, Figure 28, Figure 29, Table 10)
23.0
10.2
3.1 2.0
0.6
3.1
6.1
2.9
0
5
10
15
20
25
Hospitals Clinics ofmedical
practitioners
Dental clinics Miscellaneousmedical andother health
services
Public health andhygiene
Day care shortstay services for
the aged andhome-visit care
services
Miscellaneouswelfare servicesfor the aged and
care services
Miscellaneoussocial insurance,
social welfareand care services
(trillion yen)
Figure 27 Annual Sales by Industry of Business Activity (Detailed Groups)
-Medical, health care and welfare-
3.5
10.9 7.7 7.4
19.5
31.5
19.0
12.3
-40.0
-30.0
-20.0
-10.0
0.0
10.0
20.0
30.0
40.0
Hospitals Clinics ofmedical
practitioners
Dental clinics Miscellaneousmedical and other
health services
Public health andhygiene
Day care shortstay services for
the aged andhome-visit care
services
Miscellaneouswelfare servicesfor the aged and
care services
Miscellaneoussocial insurance,
social welfareand care services
(%)
Figure 28 Change over Previous Year of Annual Sales
by Industry of Business Activity (Detailed Groups) -Medical, health care and welfare-
23.0
Hospitals (22.2)
10.2
9.2
3.1
2.9
2.0
1.9
0.6
0.5
3.1
2.3
6.1
5.1
2.9
2.6
0 10 20 30 40 50 60
2013
2012
(trillion yen)
Dental clinics
Miscellaneousmedical and other health services
Day care short stay services for the aged and home-visit care services
Miscellaneous welfare services for the aged and care services
Miscellaneous social insurance, social welfare and care services
46.7
51.0
Public health and hygiene
Clinics of medical practitioners
Figure 29 Change in Annual Sales by Industry of Business Activity (Detailed Groups)
-Medical, health care and welfare-
Table 10 Change over Previous Year of Annual Sales, the Number of Persons Working at the Location
of Establishment, and Annual Sales per Person Working at the Location of Establishment
by Industry of Business Activity (Detailed Groups) -Medical, health care and welfare-
Hospitals
Clinics ofmedical
practitionersDental clinics
Miscellaneousmedical andother health
services
Public healthand hygiene
Day care shortstay services for
the aged andhome-visit care
services
Miscellaneouswelfare servicesfor the aged and
care services
Miscellaneoussocial insurance,social welfare
and care services
figures(million yen)
2012 46,732,212 22,241,882 9,196,599 2,908,369 1,865,026 473,045 2,323,518 5,140,522 2,583,2512013 51,009,334 23,029,982 10,203,306 3,132,205 2,003,091 565,293 3,054,593 6,119,283 2,901,581
change overprevious year(%)
2013 9.2 3.5 10.9 7.7 7.4 19.5 31.5 19.0 12.3
contribution2013 9.2 1.69 2.15 0.48 0.30 0.20 1.56 2.09 0.68
figures(persons)
2013 7,066,800 2,167,800 944,900 429,900 351,900 95,500 809,700 1,065,700 1,201,3002014 8,059,000 2,266,900 1,053,400 461,800 413,400 115,800 1,039,800 1,284,600 1,423,400
change overprevious year(%)
2014 14.0 4.6 11.5 7.4 17.5 21.3 28.4 20.5 18.5
contribution2014 14.0 1.40 1.54 0.45 0.87 0.29 3.26 3.10 3.14
figures(thousand yen)
2012 6,612 10,260 9,731 6,765 5,297 4,954 2,864 4,823 2,1502013 6,328 10,159 9,684 6,782 4,845 4,883 2,931 4,764 2,039
change overprevious year(%)
2013 -4.3 -1.0 -0.5 0.3 -8.5 -1.4 2.3 -1.2 -5.2
Ann
ual S
ales
per P
erso
n
Medical,health careand welfare
Ann
ual S
ales
Num
ber o
f Per
sons
Wor
king
at t
heLo
catio
n of
Est
ablis
hmen
t
<Services, n.e.c.> Annual sales of “Services, n.e.c.” in 2013 was 33.9 trillion yen, an increase of 4.3% from previous year.
Compared to previous year by industry of business activity, the value increased in 10 industries, including
“Employment services” (18.1% increase), “Business services, n.e.c.” (12.5% increase), “Meeting halls”
(4.6% increase). On the other hand, the value decreased in four industries: “Stenographic, entrée document
and copy services” (16.7% decrease), “Electrical machinery, apparatus, appliances and supplies repair
shop” (5.4% decrease), “Automobile maintenance services” (5.1% decrease) and “Miscellaneous repair
services, including paper hangers” (4.4% decrease).
(Figure 30, Figure 31, Figure 32, Table 11)
10.1
5.2 5.0
2.6 2.3 2.3 2.2 1.6
0
2
4
6
8
10
12
Businessservices, n.e.c.
Buildingmaintenance
services
Workerdispatching
services
Machine repairshops, except
electricalmachinery,apparatus,
appliances andsupplies
Automobilemaintenance
services
Guard services Miscellaneouswaste disposal
business
Domestic wastedisposal business
(trillion yen)
Figure 30 Annual Sales by Industry of Business Activity (Detailed Groups)
-Services, n.e.c.-
*Indicates top 8 groups
12.5
0.42.5
0.3
-5.1
3.8 3.1 3.8
-15.0
-12.0
-9.0
-6.0
-3.0
0.0
3.0
6.0
9.0
12.0
15.0
Businessservices, n.e.c.
Buildingmaintenance
services
Workerdispatching
services
Machine repairshops, except
electricalmachinery,apparatus,
appliances andsupplies
Automobilemaintenance
services
Guard services Miscellaneouswaste disposal
business
Domestic wastedisposal business
(%)
Figure 31 Change over Previous Year of Annual Sales
by Industry of Business Activity (Detailed Groups) -Services, n.e.c.-
*Indicates top 8 groups
10.1
Business suervices, n.e.c. (9.0)
5.2
5.2
5.0
4.8
2.6
2.5
2.3
2.5
2.3
2.2
2.2
2.1
1.6
1.6
2.7
2.7
0 5 10 15 20 25 30 35 40
2013
2012
(trillion yen)
Automobile maintenance services
Machine repair shops, except electrical machinery, appartus, appliances and supplies
Guardservices
Miscellaneous waste disposal business
Domestic waste disposal business
Miscellaneous
32.5
33.9
Building maintenanceservices
Worker dispatching services
Figure 32 Change in Annual Sales by Industry of Business Activity (Detailed Groups)
-Services, n.e.c.-
* In 2013, it indicates top 8 groups and other groups are included in "Miscellaneous."
In 2012, industries shown above are the same as 2013.
Table 11 Change over Previous Year of Annual Sales, the Number of Persons Working at the Location
of Establishment, and Annual Sales per Person Working at the Location of Establishment
by Industry of Business Activity (Detailed Groups) -Services, n.e.c.-
Domesticwaste
disposalbusiness
Miscellaneouswaste disposal
business
Automobilemaintenance
services
Machine repairshops, except
electricalmachinery,apparatus,
appliances andsupplies
Electricalmachinery,apparatus,
appliances andsupplies repair
shop
Miscellaneousrepair
services,including
paper hangers
Employmentservices
figures(million yen)
2012 32,530,364 1,585,411 2,098,666 2,464,189 2,543,582 1,199,574 187,293 673,9422013 33,914,936 1,644,899 2,163,167 2,338,002 2,551,955 1,134,420 178,980 795,782
change overprevious year(%)
2013 4.3 3.8 3.1 -5.1 0.3 -5.4 -4.4 18.1
contribution2013 4.3 0.18 0.20 -0.39 0.03 -0.20 -0.03 0.37
figures(persons)
2013 3,595,800 214,600 125,000 258,800 145,500 73,300 27,000 48,6002014 3,771,400 219,300 131,800 247,400 153,900 66,400 26,500 51,400
change overprevious year(%)
2014 4.9 2.2 5.4 -4.4 5.8 -9.4 -1.9 5.8
contribution2014 4.9 0.13 0.19 -0.32 0.23 -0.19 -0.01 0.08
figures(thousand yen)
2012 9,045 7,382 16,794 9,520 17,482 16,356 6,937 13,8812013 8,990 7,495 16,416 9,451 16,587 17,080 6,744 15,486
change overprevious year(%)
2013 -0.6 1.5 -2.3 -0.7 -5.1 4.4 -2.8 11.6
Services,n.e.c.
Ann
ual S
ales
Num
ber o
f Per
sons
Wor
king
at t
heLo
catio
n of
Est
ablis
hmen
tA
nnua
l Sal
espe
r Per
son
Workerdispatching
services
Stenographic,entrée
document andcopy services
Buildingmaintenance
services
Guardservices
Businessservices,
n.e.c.
Meetinghalls
Slaughterhouses,Services, n.e.c.
figures(million yen)
2012 4,838,829 156,791 5,204,897 2,172,966 8,958,179 205,778 240,2652013 4,957,987 130,604 5,227,662 2,255,496 10,079,990 215,331 240,661
change overprevious year(%)
2013 2.5 -16.7 0.4 3.8 12.5 4.6 0.2
contribution2013 0.37 -0.08 0.07 0.25 3.45 0.03 0.00
figures(persons)
2013 317,700 16,800 993,100 427,300 894,100 36,700 17,3002014 323,600 13,000 1,008,400 435,300 1,034,600 42,700 17,300
change overprevious year(%)
2014 1.9 -22.6 1.5 1.9 15.7 16.3 0.0
contribution2014 0.16 -0.11 0.43 0.22 3.91 0.17 0.00
figures(thousand yen)
2012 15,226 9,333 5,241 5,085 10,016 5,592 13,8812013 15,306 10,053 5,184 5,182 9,741 5,035 13,927
change overprevious year(%)
2013 0.5 7.7 -1.1 1.9 -2.7 -10.0 0.3
Ann
ual S
ales
Num
ber o
f Per
sons
Wor
king
at
the
Loca
tion
of E
stab
lishm
ent
Ann
ual S
ales
per P
erso
n
<Supplementary Data> Top 50 Industries by Industry of Business Activity (Detailed Group)
Table 12 Annual Sales (Top 50)
Rank IndustryAnnual Sales(million yen)
Change overPrevious Year
(%)
Rank(Previous
year)
1 Hospitals 23,029,982 3.5 22 "Pachinko" parlors 22,805,385 -6.3 13 Road freight transport 22,319,067 3.0 34 Miscellaneous goods rental and leasing *Comprehensive leasing, CD rental, etc. 12,592,512 4.2 45 Services incidental to transport *Toll road managers, Airports, etc. 11,917,053 -1.3 56 Clinics of medical practitioners 10,203,306 10.9 67 Business services, n.e.c. *Event planning services, Call centers, etc. 10,079,990 12.5 78 Sales agents of buildings and houses and land subdividers and developers 9,416,495 6.1 89 Advertising 8,514,965 4.1 910 Real estate lessors, except house and room lessors 7,760,435 4.8 1011 Railway transport 7,220,014 2.1 1112 Miscellaneous eating and drinking places *Pubs and ceer halls, Cafes, Hamburger shops, etc. 6,601,410 -0.8 1213 Water transport 6,539,554 5.1 1314 Miscellaneous welfare services for the aged and care services *Elderly nursing homes, etc. 6,119,283 19.0 1615 Accommodations 5,353,606 1.0 1416 Building maintenance services *Building cleaning service, Train cleaning service, etc. 5,227,662 0.4 1517 Worker dispatching services 4,957,987 2.5 1718 House and room lessors 4,926,459 3.3 1819 Air transport, postal activities, including mail delivery 4,740,523 2.4 1920 Travel agency 4,722,533 6.2 2121 Bicycle, horse, motorcar and motorboat race track operations and companies 4,493,253 -2.0 2022 Miscellaneous technical services *Plant engineering, Plant maintenance, etc. 4,023,565 5.6 2223 Warehousing 3,805,500 0.3 2324 Real estate managers 3,602,443 -2.4 2425 Real estate agents and brokers 3,248,562 -2.1 2526 Dental clinics 3,132,205 7.7 2627 Day care short stay services for the aged and home-visit care services 3,054,593 31.5 3428 Architectural design services 2,925,844 11.5 2929 Miscellaneous social insurance, social welfare and care services *Nerseries and day care centers, etc. 2,901,581 12.3 3030 Miscellaneous specialty restaurants *Indian or curry restaurants, Western food restaurants, etc. 2,870,840 5.9 2831 Eating places, except specialty restaurants *Restaurants, Diners, etc. 2,839,041 -1.9 2732 Food take out and delivery services 2,676,850 12.0 3333 Machine repair shops, except electrical machinery, apparatus, appliances and supplies 2,551,955 0.3 3134 Automobile maintenance services 2,338,002 -5.1 3235 Guard services 2,255,496 3.8 3536 Miscellaneous waste disposal business *Industrial waste collection and transportation services, etc. 2,163,167 3.1 3637 Miscellaneous medical and other health services *Birth centers, Nursing, Acpunctures, etc. 2,003,091 7.4 3938 Japanese restaurants *Specialty restaurants serving tempura,eel, pork cutlet or "gyudon"shops, etc. 1,973,433 -0.9 3739 "Soba" and "udon" (Japanese noodles) restaurants and "sushi" bars 1,862,700 6.5 4140 Automobile rental 1,835,946 -1.7 3841 Hair-dressing and beauty salon 1,680,303 1.2 4342 Miscellaneous professional services *Translation, Real estate appraisers, Writers, etc. 1,653,375 18.7 5043 Business consultants 1,652,565 -11.1 4044 Funeral services 1,649,685 8.2 4745 Domestic waste disposal business 1,644,899 3.8 4446 Laundries 1,574,371 -6.8 4247 Chinese and "ramen"(Chinese noodles) restaurants 1,556,413 0.0 4648 Miscellaneous road passenger transport *Share bus transport, Charter bus transport, etc. 1,554,923 2.5 4849 Certified public accountants' and auditors' offices 1,454,971 3.0 4950 Common taxicab operators *Limousine operators, etc. 1,444,112 -8.4 45
Table 13 Number of Persons Working at the Location of Establishment (Top 50)
Rank Industry
number ofpersons workingat the location
ofestablishments
Change overPrevious Year
(%)
Rank(Previous
year)
1 Hospitals 2,266,900 4.6 12 Road freight transport 1,733,100 4.7 33 Miscellaneous eating and drinking places *Pubs and ceer halls, Cafes, Hamburger shops, etc. 1,723,800 1.0 24 Miscellaneous social insurance, social welfare and care services *Nerseries and day care centers, etc. 1,423,400 18.5 45 Miscellaneous welfare services for the aged and care services *Elderly nursing homes, etc. 1,284,600 20.5 56 Clinics of medical practitioners 1,053,400 11.5 77 Day care short stay services for the aged and home-visit care services 1,039,800 28.4 98 Business services, n.e.c. *Event planning services, Call centers, etc. 1,034,600 15.7 89 Building maintenance services *Building cleaning service, Train cleaning service, etc. 1,008,400 1.5 610 Accommodations 674,500 2.1 1011 Eating places, except specialty restaurants *Restaurants, Diners, etc. 630,000 2.3 1112 Miscellaneous specialty restaurants *Indian or curry restaurants, Western food restaurants, etc. 624,000 4.8 1213 Food take out and delivery services 583,600 12.8 1314 Services incidental to transport *Toll road managers, Airports, etc. 477,100 2.1 1415 Dental clinics 461,800 7.4 1716 Hair-dressing and beauty salon 439,900 0.7 1617 Japanese restaurants *Specialty restaurants serving tempura,eel, pork cutlet or "gyudon"shops, etc. 437,800 -4.7 1518 Guard services 435,300 1.9 1819 "Soba" and "udon" (Japanese noodles) restaurants and "sushi" bars 420,100 5.1 1920 Miscellaneous medical and other health services *Birth centers, Nursing, Acpunctures, etc. 413,400 17.5 2221 Supplementary tutorial schools 381,200 5.9 2122 Chinese and "ramen"(Chinese noodles) restaurants 351,000 0.2 2423 House and room lessors 350,100 2.6 2524 Common taxicab operators *Limousine operators, etc. 333,200 -10.4 2025 Laundries 327,900 -6.5 2326 Worker dispatching services 323,600 1.9 2627 Architectural design services 314,100 9.4 2828 Air transport, postal activities, including mail delivery 302,700 0.7 2729 Miscellaneous goods rental and leasing *Comprehensive leasing, CD rental, etc. 287,400 6.1 3030 "Pachinko" parlors 254,000 -9.3 2931 Real estate managers 253,400 3.7 3232 Automobile maintenance services 247,400 -4.4 3133 Miscellaneous instruction services for arts, culture and technicals *Piano instructions, etc. 241,400 1.8 3334 Warehousing 232,900 3.4 3535 Railway transport 223,700 -1.8 3436 Domestic waste disposal business 219,300 2.2 3637 Real estate agents and brokers 215,900 3.7 3838 Barbershops 204,400 -3.2 3739 Miscellaneous road passenger transport *Share bus transport, Charter bus transport, etc. 190,900 5.9 4140 Real estate lessors, except house and room lessors 186,900 1.6 4041 Miscellaneous laundry, beauty and bath services *Public baths, Beauty salons and nail salons, etc. 185,200 -0.1 3942 Certified public accountants' and auditors' offices 181,900 5.3 4343 Miscellaneous living-related and personal services *Bicycle parking spaces, Marriage consultants, etc. 177,600 0.9 4244 Machine repair shops, except electrical machinery, apparatus, appliances and supplies 153,900 5.8 4445 Miscellaneous technical services *Plant engineering, Plant maintenance, etc. 148,200 15.2 4846 Social education *Museums, Zoos, Correspondence education services, etc. 145,500 6.6 4547 Advertising 140,700 4.5 4648 Miscellaneous professional services *Translation, Real estate appraisers, Writers, etc. 136,200 18.0 5149 Golf courses 135,000 3.1 4750 Miscellaneous waste disposal business *Industrial waste collection and transportation services, etc. 131,800 5.4 49

Table 14 Annual Sales per Person Working at the Location of Establishment (Top 50)
Rank IndustryAnnual Salesper person
(thousand yen)
Change overPrevious Year
(%)
Rank(Previous
year)
1 Bicycle, horse, motorcar and motorboat race track operations and companies 127,637 3.8 12 Water transport 121,850 4.1 23 "Pachinko" parlors 89,617 3.4 34 Sales agents of buildings and houses and land subdividers and developers 83,977 6.3 45 Advertising 60,496 -0.5 56 Travel agency 47,576 6.0 67 Miscellaneous goods rental and leasing *Comprehensive leasing, CD rental, etc. 43,814 -1.7 78 Real estate lessors, except house and room lessors 41,489 3.1 99 Automobile rental 40,408 -6.7 810 Railway transport 32,267 3.9 1011 Miscellaneous technical services *Plant engineering, Plant maintenance, etc. 27,145 -8.3 1112 Perfomances (except otherwise claasified), theatrical companies *Theatres, Baseball stadiums, etc. 26,363 0.5 1213 Services incidental to transport *Toll road managers, Airports, etc. 24,977 -3.3 1314 Electrical machinery, apparatus, appliances and supplies repair shop *Television repair services, etc. 17,080 4.4 1815 Machine repair shops, except electrical machinery, apparatus, appliances and supplies 16,587 -5.1 1516 Miscellaneous waste disposal business *Industrial waste collection and transportation services, etc. 16,416 -2.3 1717 Warehousing 16,332 -3.0 1618 Business consultants 16,145 -9.5 1419 Air transport, postal activities, including mail delivery 15,659 1.6 2120 Employment services 15,486 11.6 2521 Worker dispatching services 15,306 0.5 2222 Funeral services 15,250 -3.1 2023 Real estate agents and brokers 14,996 -5.6 1924 Real estate managers 14,199 -5.8 2325 House and room lessors 14,062 0.7 2426 Slaughterhouses, Services, n.e.c. *Slaughterhouses, Central and regional wholesale markets, etc. 13,927 0.3 2527 Road freight transport 12,878 -1.7 2728 Cinemas 12,639 -1.2 2829 Miscellaneous professional services *Translation, Real estate appraisers, Writers, etc. 12,130 0.5 2930 Wedding ceremony halls 11,789 -1.6 3031 Miscellaneous engineering and architectural services *Geological suvery service, Building surveyors, rtc 11,582 -1.8 3232 Ceremonial occasion mutual aid society 11,282 3.5 3533 Lawyers' and patent attorneys' offices 11,174 -1.3 3434 Mechanical design services 11,162 -2.2 3335 Surveyor certification *General surveyor certification, mineral, Emvironmental mesurement and analysis services, etc. 10,978 -7.1 3136 Design services 10,557 -1.8 3637 Hospitals 10,159 -1.0 3738 Stenographic, entrée document and copy services 10,053 7.7 4239 Business services, n.e.c. *Event planning services, Call centers, etc. 9,741 -2.7 3840 Clinics of medical practitioners 9,684 -0.5 3941 Automobile maintenance services 9,451 -0.7 4042 Detective agencies and credit bureaus 9,390 4.1 4543 Architectural design services 9,315 1.9 4444 Commodity inspection and non-destructive testing services 9,284 0.7 4345 Miscellaneous amusement and recreation facilities *Game arcades, Pool halls, Mah-jong club 9,268 -1.8 4146 Automobile parking 8,519 3.9 4847 Public gardens and amusement parks 8,290 5.4 5148 Miscellaneous road passenger transport *Share bus transport, Charter bus transport, etc. 8,147 -2.4 4749 Veterinary services 8,118 -2.8 4650 Certified public accountants' and auditors' offices 8,001 -2.1 49
2 Regional Situation of Service Industries in Japan <Industry Composition of Annual Sales by Region> Table 15 shows top three service industries with large annual sales by prefectures. “Medical, health care
and welfare” was the highest in 25 prefectures including Fukuoka, Hokkaido and Hiroshima. “Transport
and postal activities” was the highest in 14 prefectures including Kanagawa, Aichi and Saitama.
Besides, “Living-related and personal services and amusement services” was the highest in six
prefectures including Gumma, Miyagi and Fukushima. “Real estate and goods rental and leasing” was the
highest in Tokyo and Osaka.
(Table 15)
Table 15 Top 3 Industries in Annual Sales by Prefectures (Divisions)
Prefectures Total of serviceindustries
National 287,775,760 Transport and postal activities 58,889,839 Medical, health care and welfare 51,009,313 Living-related and personal servicesand amusement services
45,788,400
Hokkaido 9,799,127 Medical, health care and welfare 2,363,408 Living-related and personal servicesand amusement services
1,958,325 Transport and postal activities 1,638,708
Aomori 1,983,353 Medical, health care and welfare 484,057 Living-related and personal servicesand amusement services
413,130 Transport and postal activities 335,710
Iwate 2,124,036 Transport and postal activities 536,587 Medical, health care and welfare 511,422 Living-related and personal servicesand amusement services
328,877
Miyagi 4,818,967 Living-related and personal servicesand amusement services
841,282 Transport and postal activities 836,979 Medical, health care and welfare 823,831
Akita 1,466,181 Medical, health care and welfare 479,089 Living-related and personal servicesand amusement services
275,700 Transport and postal activities 222,982
Yamagata 1,684,744 Medical, health care and welfare 435,938 Living-related and personal servicesand amusement services
321,206 Transport and postal activities 310,278
Fukushima 3,078,210 Living-related and personal servicesand amusement services
720,951 Medical, health care and welfare 692,461 Services, n.e.c. 406,391
Ibaraki 5,312,391 Transport and postal activities 1,138,046 Medical, health care and welfare 1,136,453 Living-related and personal servicesand amusement services
1,072,256
Tochigi 3,530,719 Medical, health care and welfare 823,433 Living-related and personal servicesand amusement services
772,896 Transport and postal activities 640,389
Gumma 3,581,816 Living-related and personal servicesand amusement services
928,029 Medical, health care and welfare 834,672 Transport and postal activities 656,225
Saitama 12,369,795 Transport and postal activities 3,096,866 Medical, health care and welfare 2,334,824 Living-related and personal servicesand amusement services
2,170,409
Chiba 12,194,184 Transport and postal activities 2,993,322 Living-related and personal servicesand amusement services
2,281,688 Medical, health care and welfare 2,007,095
Tokyo 72,206,582 Real estate and goods rental andleasing
16,229,135 Transport and postal activities 15,110,750 Scientific research, professional andtechnical services
10,804,374
Kanagawa 18,404,847 Transport and postal activities 4,009,167 Medical, health care and welfare 3,207,305 Real estate and goods rental andleasing
2,984,803
Niigata 4,030,490 Transport and postal activities 840,367 Medical, health care and welfare 821,974 Living-related and personal servicesand amusement services
725,549
Toyama 1,757,949 Medical, health care and welfare 511,452 Living-related and personal servicesand amusement services
293,988 Transport and postal activities 237,981
Ishikawa 2,053,276 Medical, health care and welfare 589,637 Living-related and personal servicesand amusement services
355,203 Transport and postal activities 281,252
Fukui 1,535,632 Medical, health care and welfare 342,224 Living-related and personal servicesand amusement services
318,854 Transport and postal activities 303,298
Yamanashi 1,471,874 Living-related and personal servicesand amusement services
335,614 Transport and postal activities 298,521 Medical, health care and welfare 296,074
Nagano 3,578,122 Medical, health care and welfare 885,502 Living-related and personal servicesand amusement services
593,223 Transport and postal activities 586,244
Gifu 3,406,016 Medical, health care and welfare 830,573 Living-related and personal servicesand amusement services
758,979 Transport and postal activities 596,803
Shizuoka 7,402,636 Transport and postal activities 1,730,454 Medical, health care and welfare 1,365,346 Living-related and personal servicesand amusement services
1,280,741
Aichi 17,580,558 Transport and postal activities 3,656,075 Living-related and personal servicesand amusement services
2,927,174 Medical, health care and welfare 2,866,921
Mie 3,451,537 Transport and postal activities 890,915 Medical, health care and welfare 738,865 Living-related and personal servicesand amusement services
536,500
Shiga 2,138,051 Transport and postal activities 463,343 Medical, health care and welfare 429,789 Living-related and personal servicesand amusement services
330,400
1st place 2nd place 3rd place
(million yen)
Prefectures Total of serviceindustries
Kyoto 5,091,582 Medical, health care and welfare 1,136,348 Living-related and personal servicesand amusement services
927,762 Transport and postal activities 812,534
Osaka 24,830,401 Real estate and goods rental andleasing
5,011,490 Transport and postal activities 4,889,015 Medical, health care and welfare 4,066,632
Hyogo 10,964,748 Transport and postal activities 2,620,417 Medical, health care and welfare 2,383,508 Living-related and personal servicesand amusement services
1,425,091
Nara 1,763,536 Medical, health care and welfare 564,392 Living-related and personal servicesand amusement services
383,053 Transport and postal activities 209,859
Wakayama 1,312,906 Medical, health care and welfare 332,121 Transport and postal activities 224,162 Accommodations, eating anddrinking services
191,246
Tottori 934,953 Medical, health care and welfare 342,640 Living-related and personal servicesand amusement services
140,842 Transport and postal activities 128,858
Shimane 1,015,818 Medical, health care and welfare 363,823 Transport and postal activities 145,141 Real estate and goods rental andleasing
135,399
Okayama 3,340,074 Transport and postal activities 867,828 Medical, health care and welfare 751,211 Living-related and personal servicesand amusement services
465,028
Hiroshima 5,557,068 Medical, health care and welfare 1,286,082 Transport and postal activities 1,204,270 Living-related and personal servicesand amusement services
762,815
Yamaguchi 2,401,656 Transport and postal activities 650,437 Medical, health care and welfare 643,477 Living-related and personal servicesand amusement services
375,998
Tokushima 1,281,785 Medical, health care and welfare 476,687 Living-related and personal servicesand amusement services
265,470 Transport and postal activities 184,319
Kagawa 1,818,295 Medical, health care and welfare 444,482 Transport and postal activities 360,564 Living-related and personal servicesand amusement services
348,092
Ehime 2,340,340 Transport and postal activities 619,801 Medical, health care and welfare 567,133 Living-related and personal servicesand amusement services
357,823
Kochi 1,113,520 Medical, health care and welfare 452,164 Living-related and personal servicesand amusement services
268,221 Transport and postal activities 110,225
Fukuoka 10,294,345 Medical, health care and welfare 2,466,312 Transport and postal activities 1,914,055 Living-related and personal servicesand amusement services
1,467,738
Saga 1,220,423 Medical, health care and welfare 316,946 Transport and postal activities 309,394 Living-related and personal servicesand amusement services
262,790
Nagasaki 2,038,817 Living-related and personal servicesand amusement services
566,276 Medical, health care and welfare 527,659 Transport and postal activities 231,144
Kumamoto 2,467,856 Medical, health care and welfare 678,366 Transport and postal activities 445,287 Living-related and personal servicesand amusement services
367,415
Oita 1,612,104 Living-related and personal servicesand amusement services
373,461 Medical, health care and welfare 355,362 Transport and postal activities 247,306
Miyazaki 1,445,624 Medical, health care and welfare 466,415 Living-related and personal servicesand amusement services
288,968 Transport and postal activities 224,879
Kagoshima 2,171,486 Medical, health care and welfare 652,985 Transport and postal activities 462,306 Living-related and personal servicesand amusement services
326,377
Okinawa 1,797,329 Medical, health care and welfare 476,452 Accommodations, eating anddrinking services
384,132 Real estate and goods rental andleasing
237,870
1st place 2nd place 3rd place