1 generation of density irregularities in the plasmasphere evgeny mishin boston college isr muri...
Post on 20-Dec-2015
218 views
TRANSCRIPT

1
GENERATION OF DENSITY IRREGULARITIES IN THE PLASMASPHERE
Evgeny MishinBoston College ISR
MURI Workshop
3-6 March 2008

22
OUTLINE
Introduction: Inner magnetosphere
Sub-Auroral PPolarization SStreams & Ion Drifts (SAPS & SAID)
SAPS/SAID-related plasmaspheric structures
Shear-flow and gradient-drift instabilities
APPROACH
•Compare plasmaspheric density structures with enhanced subauroral electric field
•Specify possible instabilities
OBJECTIVE: Specify the ducts formation conditions
Why should one care? Necessary for VLF triggering

33
Inner Magnetosphere
Inner magnetosphere: Plasmasphere &
Ring Current
Driven byDriven by the magnetospheric convection electric fieldconvection electric field generated by the solar wind- magnetosphere interaction
A schematic diagram of the Earth’s magnetosphere
Usually described by the cold plasma drift approximation: Balance of the convection and convection and corotation electric fieldscorotation electric fields

44
Large-Scale Structures: SAPS
During magnetic (sub)storms energetic particles are injected into the plasmasphere forming the “partial” ring current at dusk
Plas
ma
shee
t bou
ndar
y
Upward (Region 1) & downward (Region 2) FACs enhance.
Subauroral poleward electric fields appear enhanced westward convection (SAPS/SAID).
Topside Ionosphere: 850 km
~1 RE

5
Middle-Scale Structure: SAID
08-Apr-2004 SAID event 50 min after onset
Puhl-Quinn et al., 2007+
C1 & F16: Magnetically conjugate within 0.2o
DMSP F16
PP
ause
C1
C4
<1000 km
Pla
sm
a s
he
et
bo
un
da
ry
66
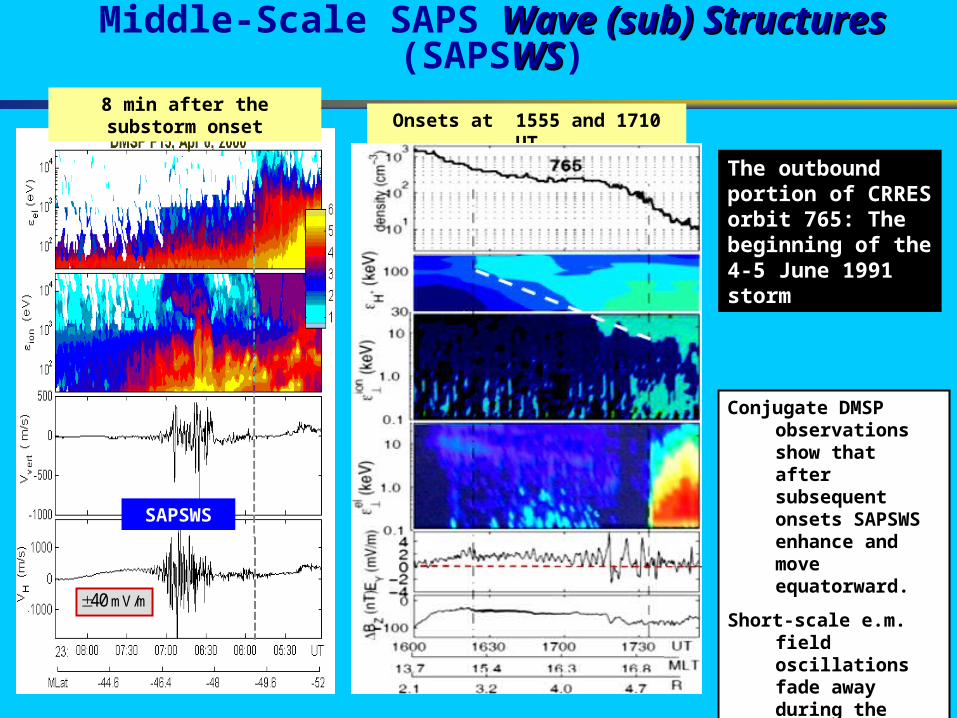
Middle-Scale SAPS Wave (sub) StructuresWave (sub) Structures (SAPSWSWS)
Conjugate DMSP observations show that after subsequent onsets SAPSWS enhance and move equatorward.
Short-scale e.m. field oscillations fade away during the substorm recovery.
Onsets at 1555 and 1710 UT
The outbound portion of CRRES orbit 765: The beginning of the 4-5 June 1991 storm
SAPSWS
8 min after the substorm onset
mV/m40

77
Middle-Scale Structures: Plumes & Shoulders
Volland-Stern
IMAGE EUV image : PS equatorial cross-section
00
06
12
18
plu
me
1-2 RE
Including SAPS [Khazanov+]
88
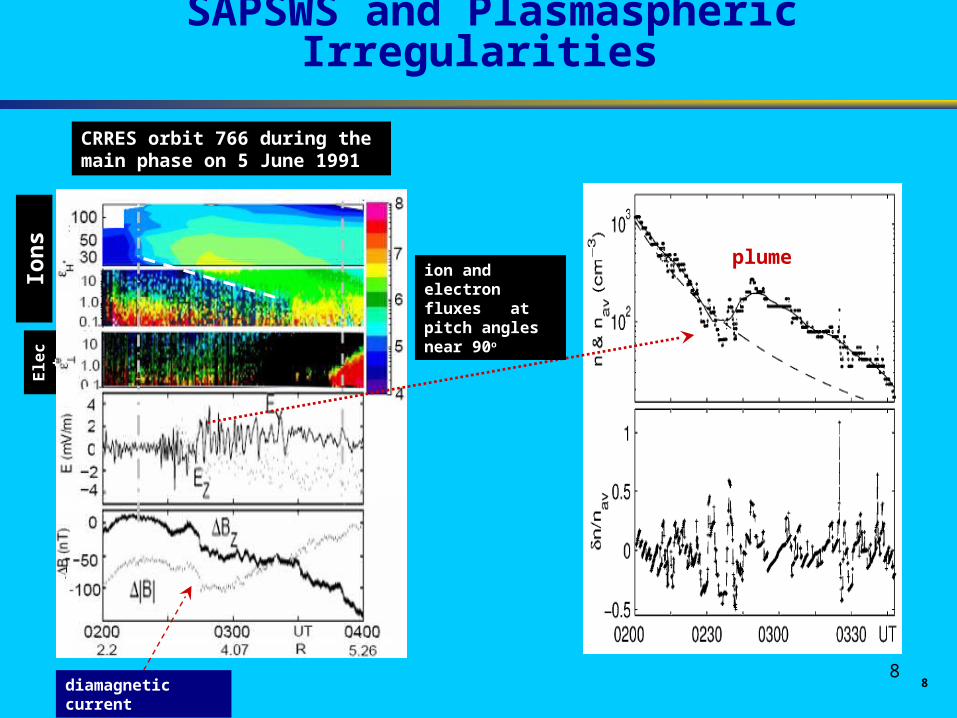
SAPSWS and Plasmaspheric Irregularities
Pla
sma
Sh
eet
bou
nd
ary
Ele
ct
Ion
s
diamagnetic current
CRRES orbit 766 during the main phase on 5 June 1991
ion and electron fluxes at pitch angles near 90o
plume

9
SAID & Plasmaspheric troughAdrian et al. [ 2007]
Simulated equatorial density distribution containing a SAID generated trough
Simulated EUV image
10
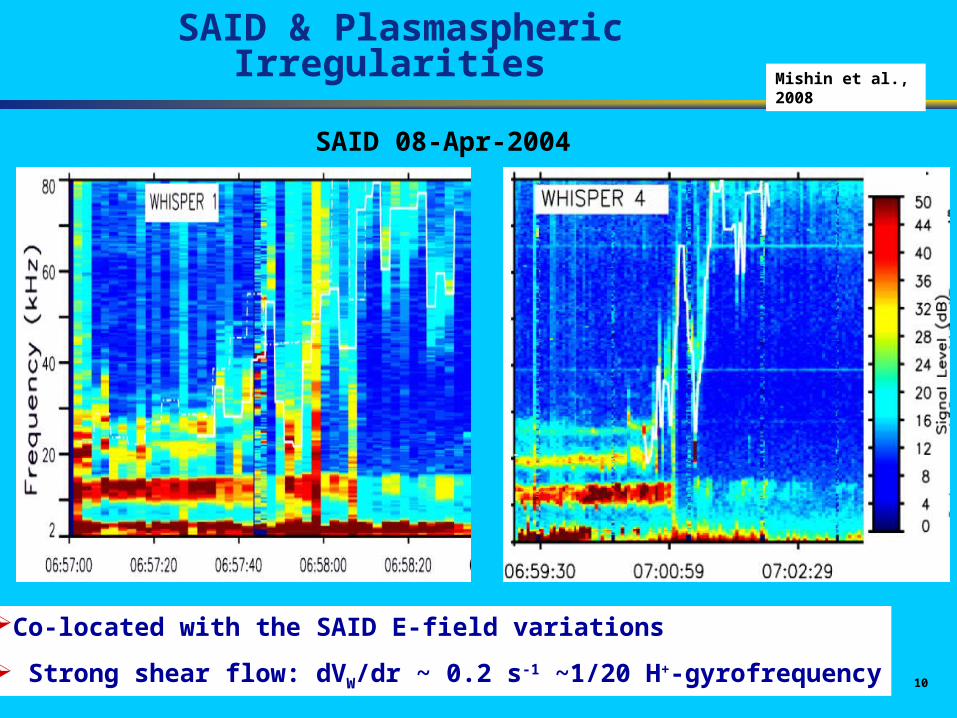
SAID & Plasmaspheric Irregularities
SAID 08-Apr-2004
Co-located with the SAID E-field variations
Strong shear flow: dVW/dr ~ 0.2 s-1 ~1/20 H+-gyrofrequency
Mishin et al., 2008

11
SAID & Plasmapause & Auroral Boundary Mishin and Puhl-Quinn, GRL2007
18 March 2002 25 min after onset DMSP F14
The outer side of the SAID channel is aligned with the plasmapause and its outer edge marks the electron precipitation (auroral zone) boundary.
The overall SAID features agree with a short-circuiting of the substorm-injected plasmoid over the plasmasphere and the formation of a turbulent boundary layer.
PP
ause

12
SAID and Plasmasphere’s Structuring
Cluster observations in the SAID system of reference
diamagnetic current near the inner edge
The short-circuit system in the plasmasphere extends far ahead the SAID channel
Mishin and Puhl-Quinn, GRL2007

1313
The current-convective instability in the RC- plasmasphere overlap
|| ||' /( )ek j en
Volkov& Maltsev, 1986
(static approximation)
|| ||' /( )e Dk j en k U Plasma cloud’s
transverse motion favors generation of
short-scale modes
Rise time a few min
Doppler-shifted frequency

1414
Density irregularities from Cluster
CLUSTER, 11- Apr-2002, 2130 MLT, Kp=3
Darrouzet et al., 2004
Cluster electron density profiles in the plasmasphere
IN OUT
plu
me
plu
me

1515
Motion of Plumes
cosn RV V
Darrouzet et al., 2004
The radial boundary velocity VR=(R1-R2)/(t1-t2)
The normal boundary velocity
( ) ( )sin (4 5)cor obsn cor nV V V
Co-rotation speed Vcor=0.47· Requat km/s
Shear flows near the plume

16
Plasmapause & Electron Injection boundary
IMAGE/FUV electron aurora images.
The color is proportional to brightness of the detected auroral emissions.
The FUV images mapped to the equatorial plane:
The EUV determined plasmapause is overlaid on the mapped images.
IMAGE/FUV measurements of the substorm of 1900–2038 UT on 17 April 2002.
Goldstein et al., 2005

1717
Motion of Irregularities inside the PSDarrouzet et al., 2004
1818
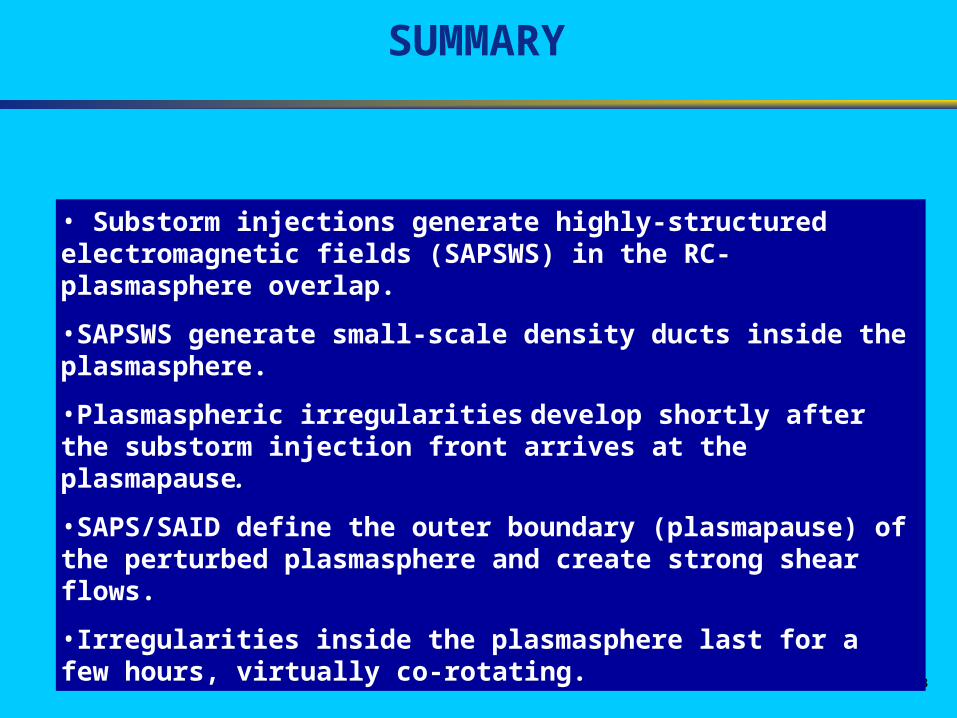
SUMMARY
• Substorm injections generate highly-structured electromagnetic fields (SAPSWS) in the RC-plasmasphere overlap.
•SAPSWS generate small-scale density ducts inside the plasmasphere.
•Plasmaspheric irregularities develop shortly after the substorm injection front arrives at the plasmapause.
•SAPS/SAID define the outer boundary (plasmapause) of the perturbed plasmasphere and create strong shear flows.
•Irregularities inside the plasmasphere last for a few hours, virtually co-rotating.

1919
Stationary Conditions
The subscript S refers to a stagnation point in cold plasma drift.
convection
corotation
Ly and PC are defined by the solar wind pressure and IMF
Zero-order, cold plasma drift approximation (Volland-Stern) separatrix

2020
SAPSWS- (cont’d)
The outbound portions of CRRES orbits 765 (onset), 766 (middle of the 1st main phase) and 767 (middle of the 2nd main phase) on 5 June 1991

21
Plasmapause & RB boundary
(a) SAMPEX high-energy (2–6 MeV) electrons, vs. L and day of year 2001.
Four main bursts of enhanced outer belt flux are labeled (‘1’ through ‘4’).
(b) Dst index, showing 4 main (‘1’–‘4’) and disturbances.
2–6-MeV, monthly window-averaged electron fluxes from SAMPEX (600 km)
The white curve represents every 10-day’s minimum Lpp based on the CRRES empirical model
Goldstein et al. [2005]
Li et al. [2006]

22
Plasmapause & RB boundary (cont’d)
Red (Lmin) and blue (Lavg) dots respectively give 3.5-day running average of minimum and mean per-image plasmapause Lp.
Blue line (LMAX): L of peak flux.
Red line (L-1): 0.1 of peak flux.
IMAGE/EUV plasmapause data

23
Structured precipitation from RB at HAARP[Pedersen et al., JGR, 2007]
Co-rotating, several-km-scale optical structures (‘angels dancing on the head of a pin’)
24
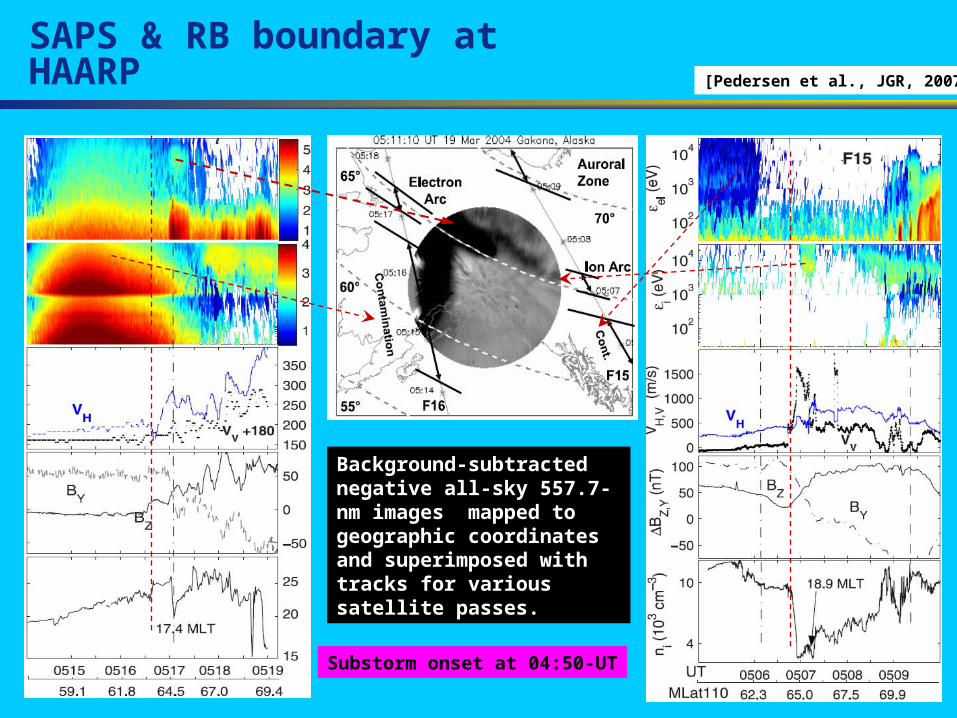
SAPS & RB boundary at HAARP
Substorm onset at 04:50-UT
[Pedersen et al., JGR, 2007]
Background-subtracted negative all-sky 557.7-nm images mapped to geographic coordinates and superimposed with tracks for various satellite passes.
25
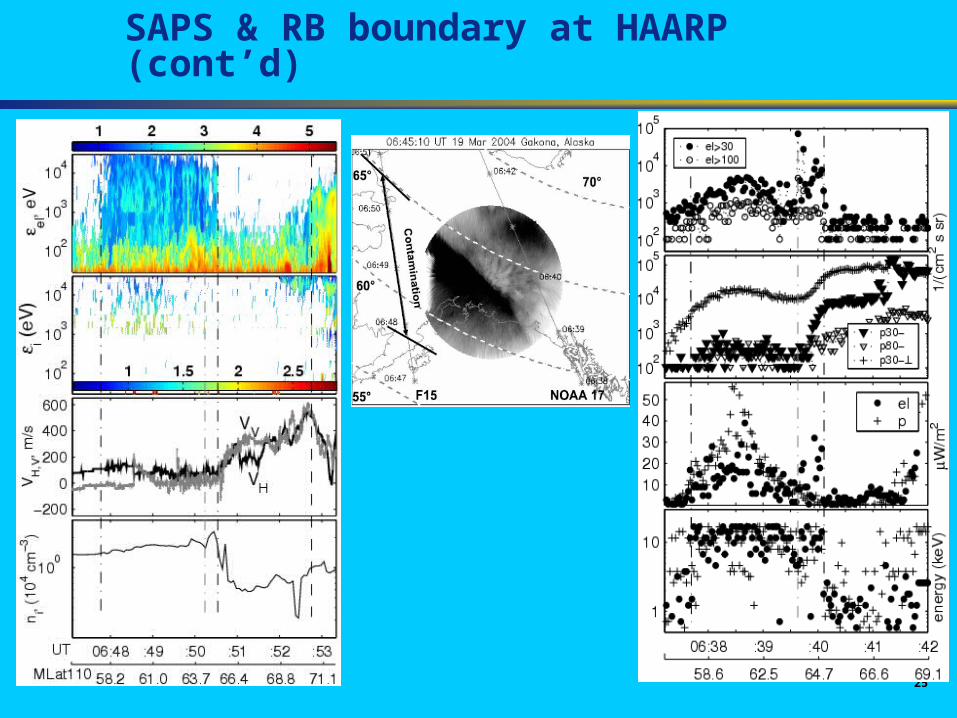
SAPS & RB boundary at HAARP (cont’d)

26
SAPS/SAID, RB boundary & Plasmapause
RB region
Similarities between Cluster and DMSP/NOAA observations