1 gfnorte: 4q07 results february, 2008. 2 1.4q07 overview. 2.asset quality. 3.stock metrics. 4.final...
Post on 21-Dec-2015
217 views
TRANSCRIPT
1
GFNORTE:4Q07 Results
February, 2008
2
1. 4Q07 Overview.
2. Asset Quality.
3. Stock Metrics.
4. Final Considerations.
Contents
3
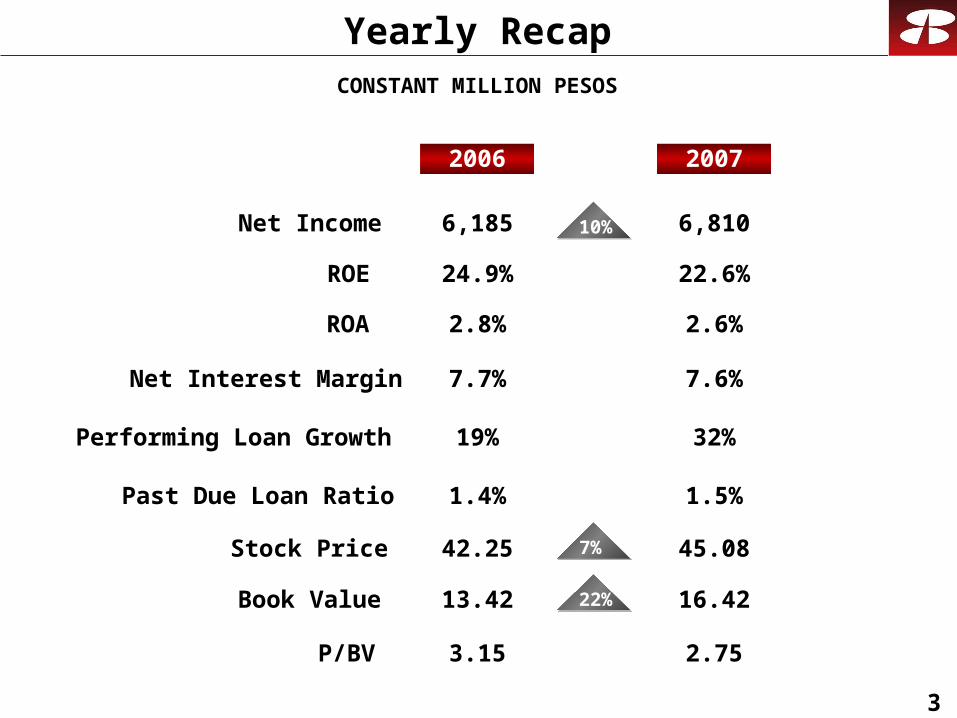
Yearly Recap
Performing Loan Growth 19% 32%
2007
Net Income
Stock Price
P/BV
2006
6,185
Net Interest Margin
11%
42.25
3.15
7.7%
7%
2.75
7.6%
6,810
45.08
ROA 2.8% 2.6%
ROE 24.9% 22.6%
Book Value 13.42 16.42
Past Due Loan Ratio 1.4% 1.5%
22%
10%
CONSTANT MILLION PESOS
4
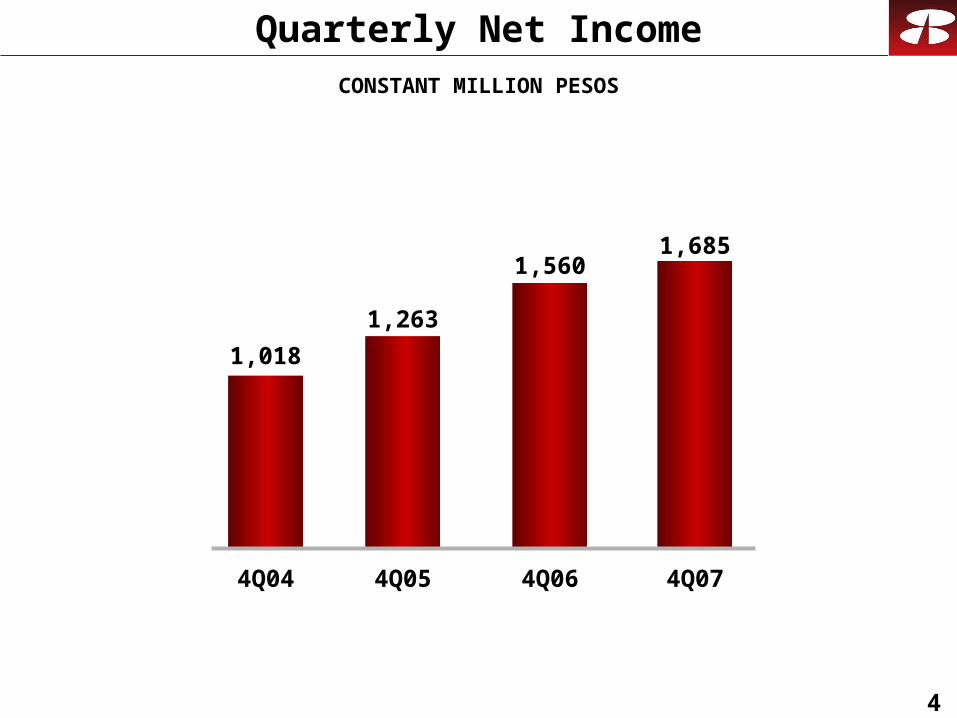
Quarterly Net IncomeCONSTANT MILLION PESOS
1,685
1,018
4Q04 4Q05
1,560
4Q06
1,263
4Q07
5
2006
15%
12%
(36%)
(28%)
(2%)
9%
12%
6%
798%
1%
10%
67%
(95%)
2007
17,384
6,028
580
1,292
7,899
25,283
14,432
10,851
1,867
(3,293)
6,810
(2,645)
31
Change
15,069
5,391
900
1,782
8,072
23,141
12,931
10,210
208
(3,255)
6,185
(1,588)
610
QoQ YoY
24%
17%
21%
(82%)
(5%)
14%
13%
16%
3,283%
(8%)
8%
170%
(130%)
4Q06 4Q07
4,881
1,666
164
83
1,914
6,795
3,841
2,954
382
(694)
1,685
(921)
(36)
3,931
1,424
136
450
2,010
5,941
3,395
2,546
(12)
(756)
1,560
(341)
122
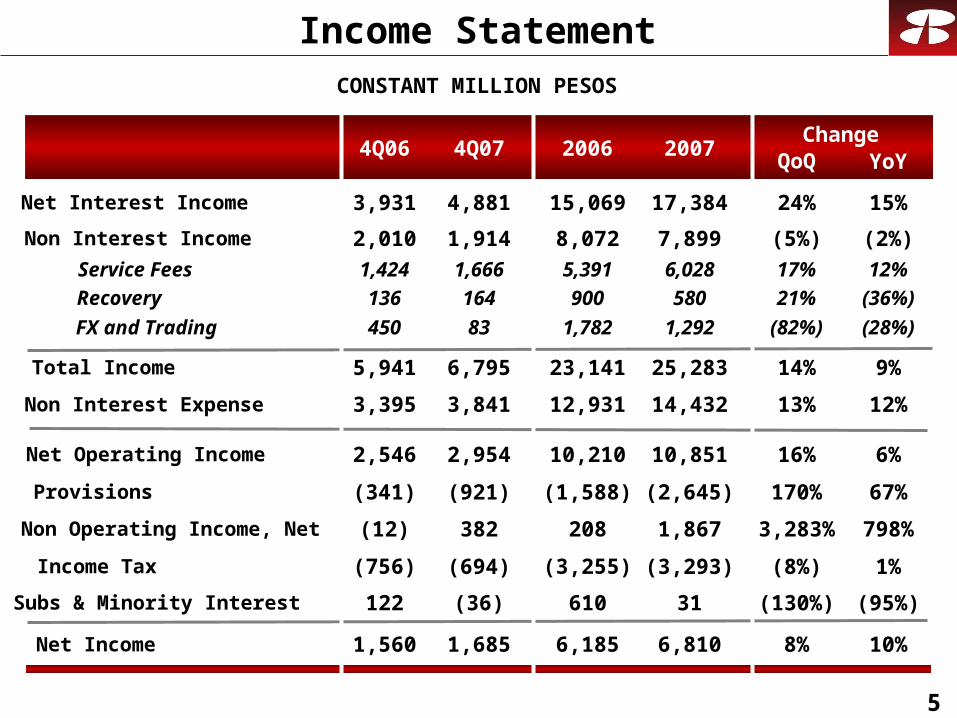
Income StatementCONSTANT MILLION PESOS
Net Interest Income
Service Fees
Recovery
FX and Trading
Non Interest Income
Total Income
Non Interest Expense
Net Operating Income
Non Operating Income, Net
Income Tax
Net Income
Provisions
Subs & Minority Interest
6
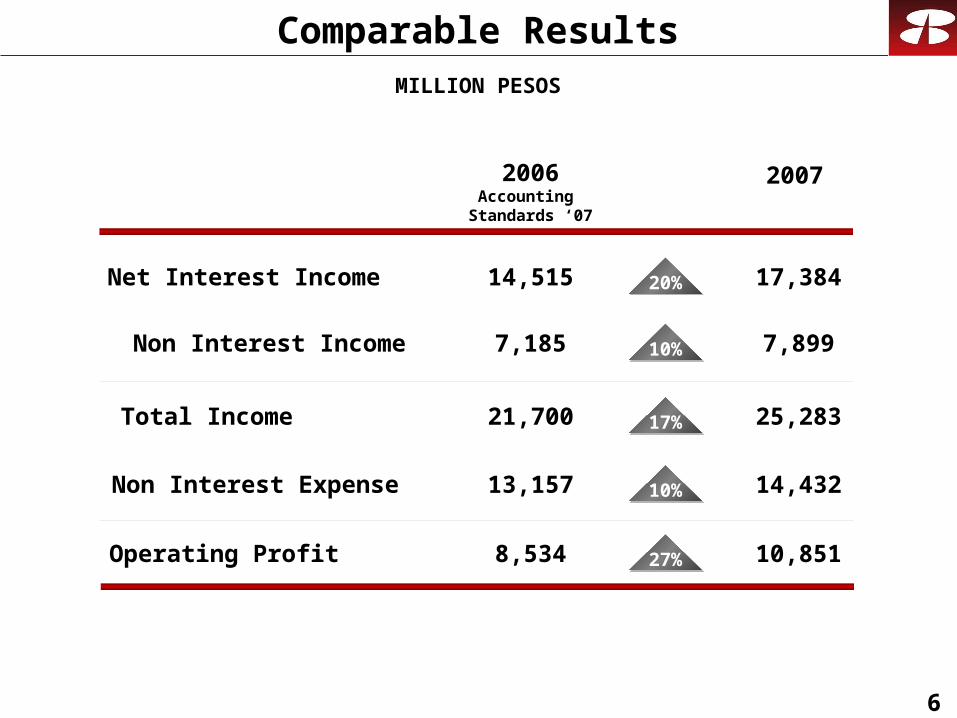
Comparable Results
Net Interest Income 14,515
2007
17,38420%
MILLION PESOS
Non Interest Income 7,185 7,89910%
Total Income 21,700 25,28317%
Non Interest Expense 13,157 14,43210%
2006Accounting
Standards ‘07
Operating Profit 8,534 10,85127%
7
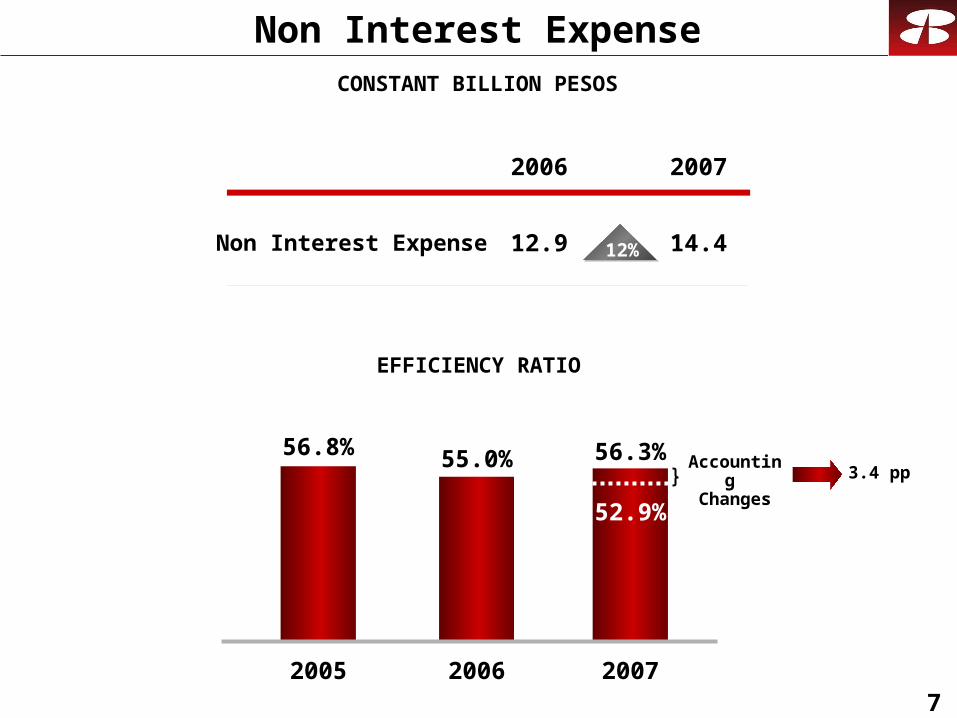
Non Interest ExpenseCONSTANT BILLION PESOS
EFFICIENCY RATIO
Non Interest Expense
2006
12.9
2007
14.412%
56.8%
2005
55.0%
2006
56.3%
2007
Accounting Changes
52.9%
3.4 pp
8
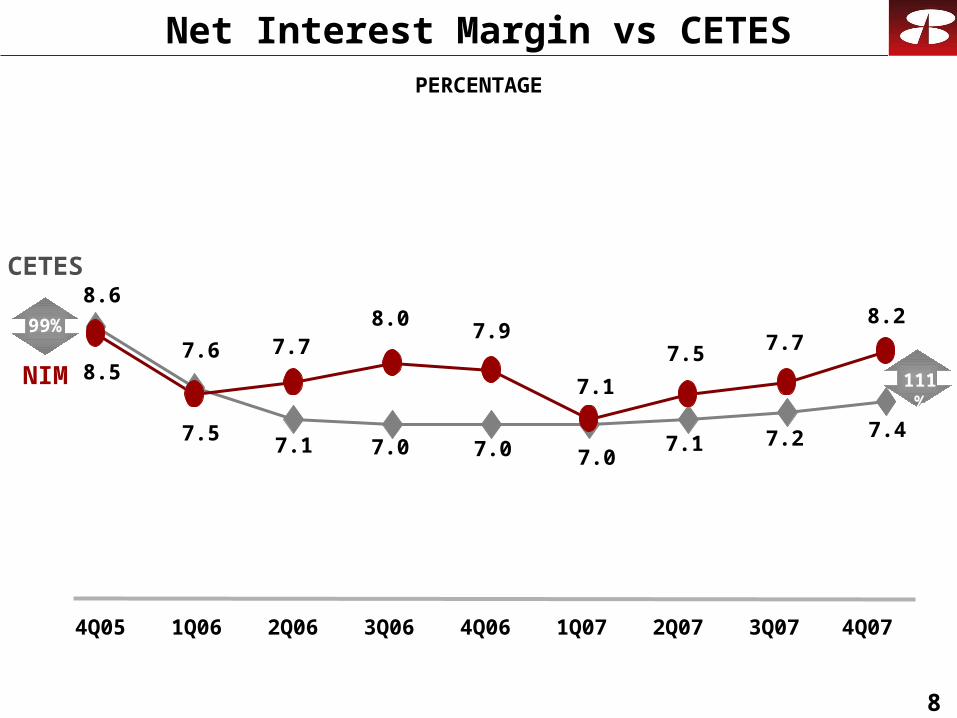
Net Interest Margin vs CETESPERCENTAGE
CETES
NIM
4Q05 1Q06 2Q06 3Q06 4Q06 1Q07 2Q07 3Q07
99%
111%
4Q07
8.6
7.6
7.18.5
7.57.07.07.07.1 7.1 7.2 7.4
7.98.0
7.7 7.5 7.78.2

9
Core DepositsCONSTANT BILLION PESOS
Mix
Demand
Time
Demand
Time
Total
Deposits 4Q05 4Q074Q06
111
64
175
99
56
154
82
43
125 13%23%
13%
14%
21%
30%
63%
37%
100%
64%
36%
100%
66%
34%
100%
10
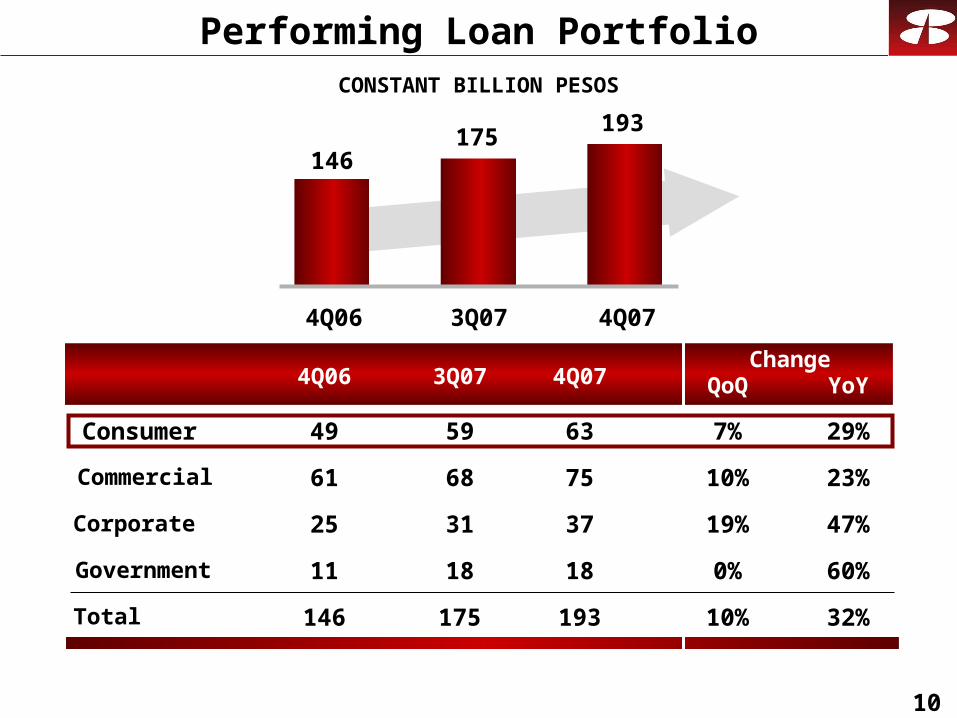
CONSTANT BILLION PESOS
Performing Loan Portfolio
4Q06 3Q07 4Q07 QoQChange
YoY
Commercial
Corporate
Government
Total
Consumer
23%10%
47%19%
60%0%
32%10%
29%7%
75
37
18
193
63
68
31
18
175
59
61
25
11
146
49
4Q06 3Q07 4Q07
146175
193
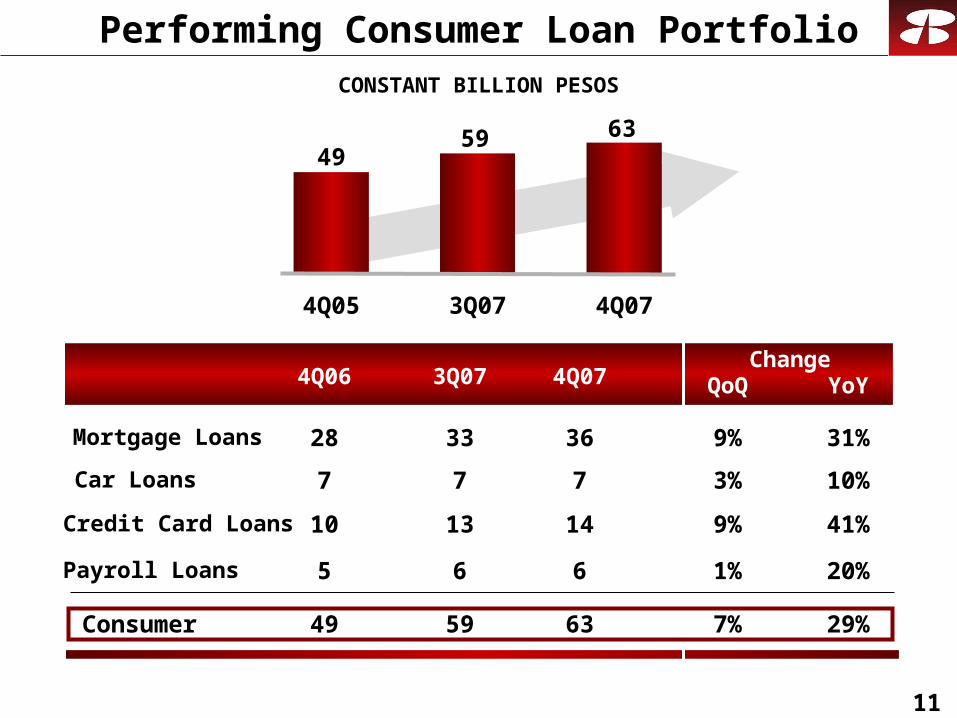
11
Performing Consumer Loan PortfolioCONSTANT BILLION PESOS
4Q05 3Q07 4Q07
4959 63
4Q06 3Q07 4Q07 QoQChange
YoY
Car Loans
Credit Card Loans
Payroll Loans
Consumer
10%3%
41%9%
20%1%
29%7%
7
14
6
63
7
13
6
59
7
10
5
49
Mortgage Loans 31%9%363328
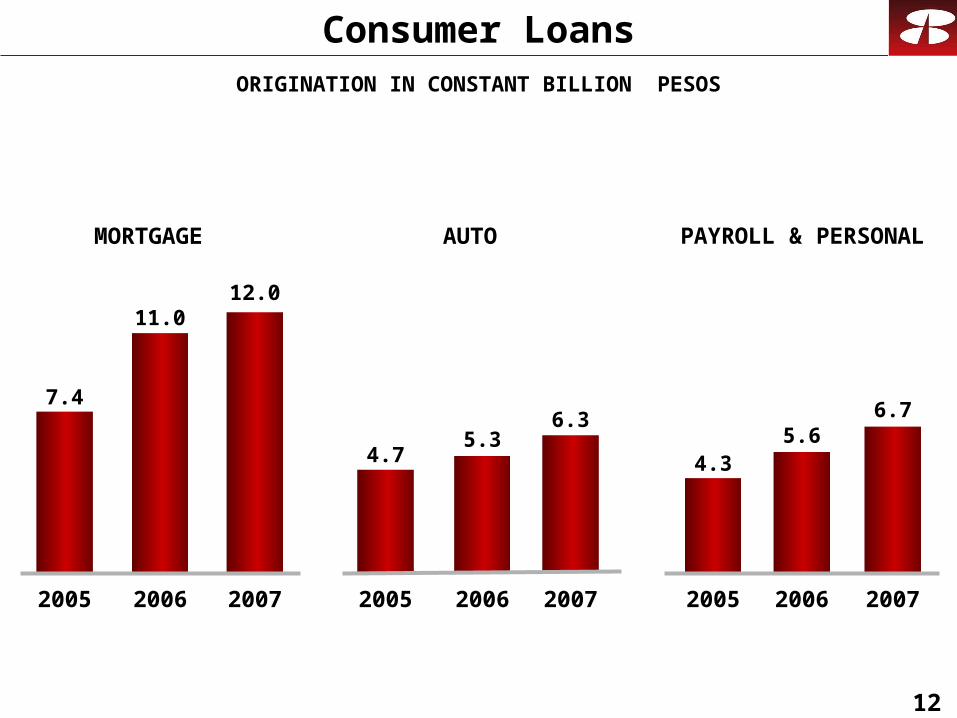
12
AUTO
2005 2006
4.75.3
2007
6.3
MORTGAGE
2005 2006
7.4
11.0
2007
12.0
PAYROLL & PERSONAL
2005 2006
4.35.6
2007
6.7
Consumer LoansORIGINATION IN CONSTANT BILLION PESOS
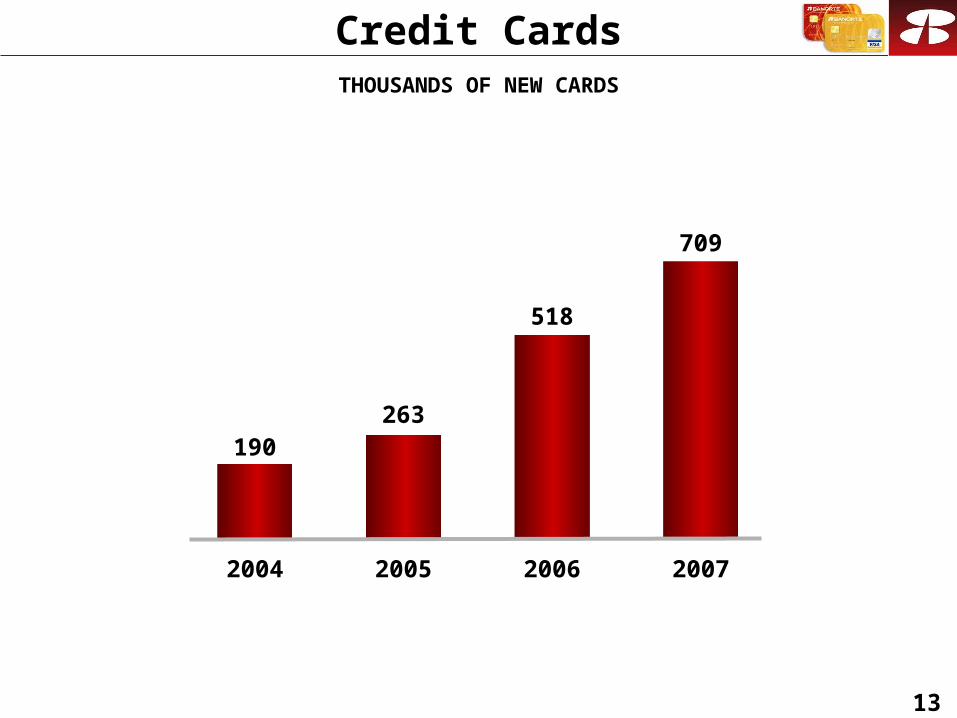
13
Credit CardsTHOUSANDS OF NEW CARDS
263
518
2005 2006
190
2004
709
2007
14
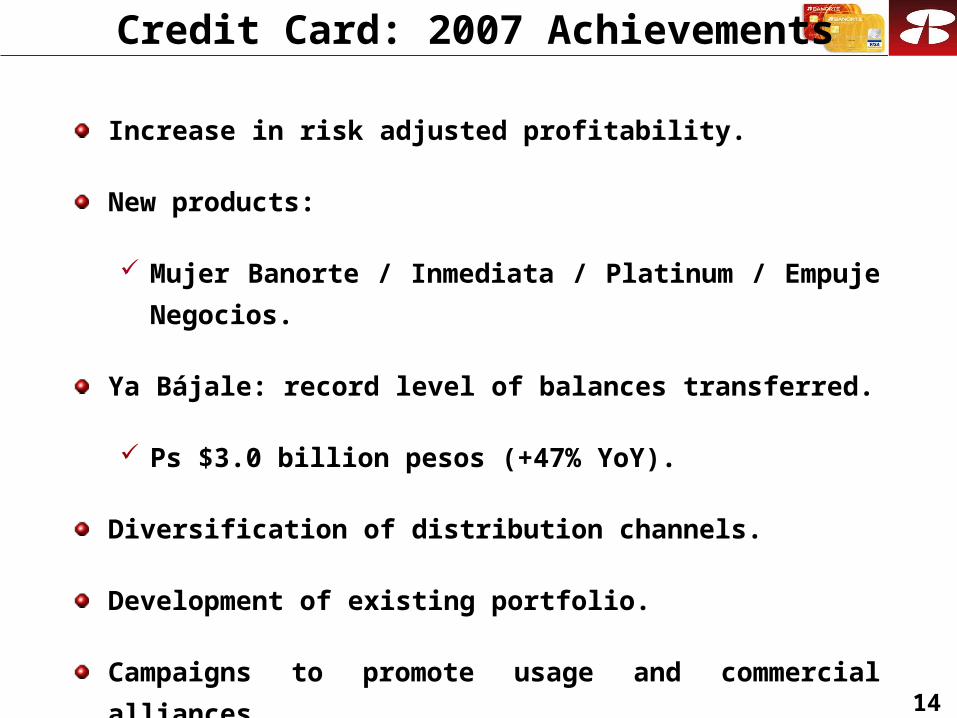
Increase in risk adjusted profitability.
New products:
Mujer Banorte / Inmediata / Platinum / Empuje Negocios.
Ya Bájale: record level of balances transferred.
Ps $3.0 billion pesos (+47% YoY).
Diversification of distribution channels.
Development of existing portfolio.
Campaigns to promote usage and commercial alliances.
Credit Card: 2007 Achievements
15
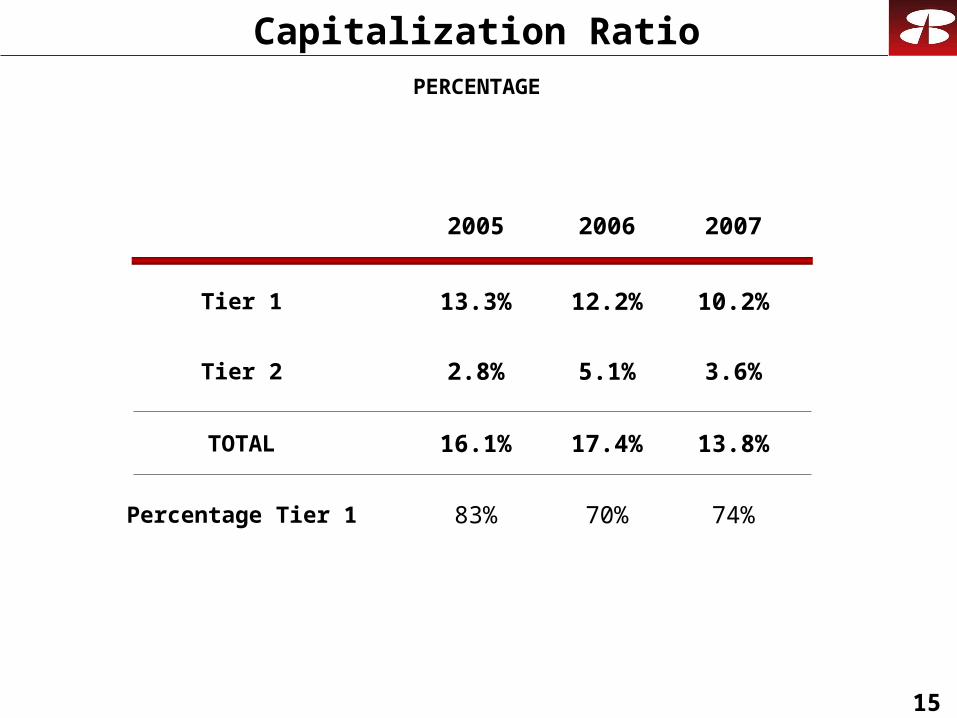
Capitalization Ratio
Tier 1
Tier 2
TOTAL
Percentage Tier 1
PERCENTAGE
10.2%
3.6%
13.8%
2005 2006 2007
74%
13.3% 12.2%
2.8% 5.1%
16.1% 17.4%
83% 70%
16
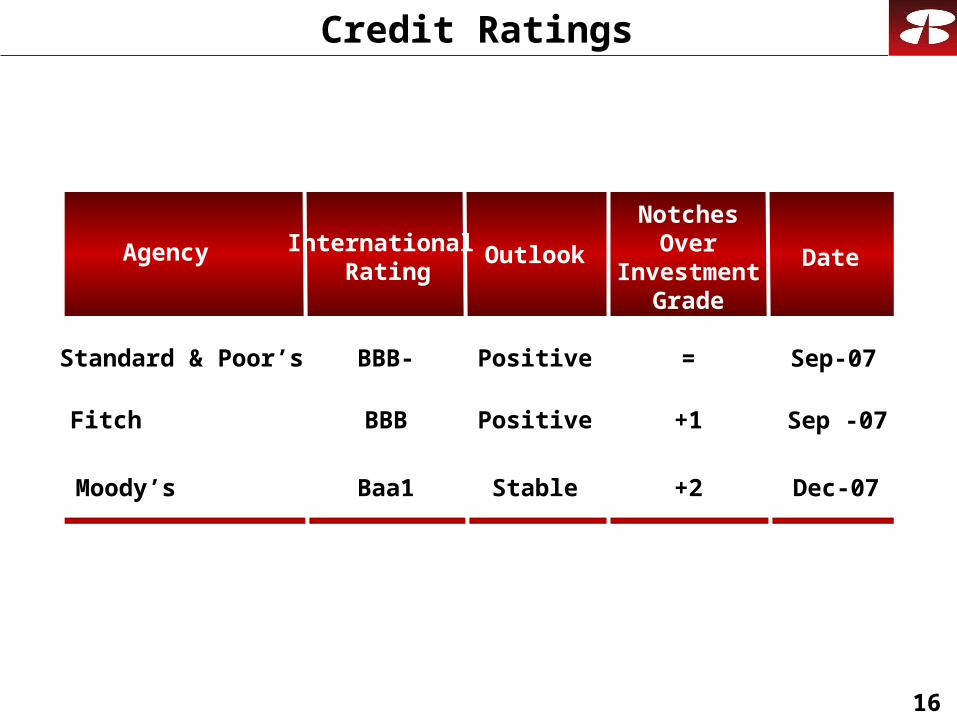
Credit Ratings
+1
+2
=
Notches Over
Investment Grade
Baa1
BBB
BBB-
International Rating
Fitch
Moody’s
Standard & Poor’s
Agency
Positive
Positive
Stable
Outlook Date
Sep-07
Sep -07
Dec-07

17
Subsidiaries
18
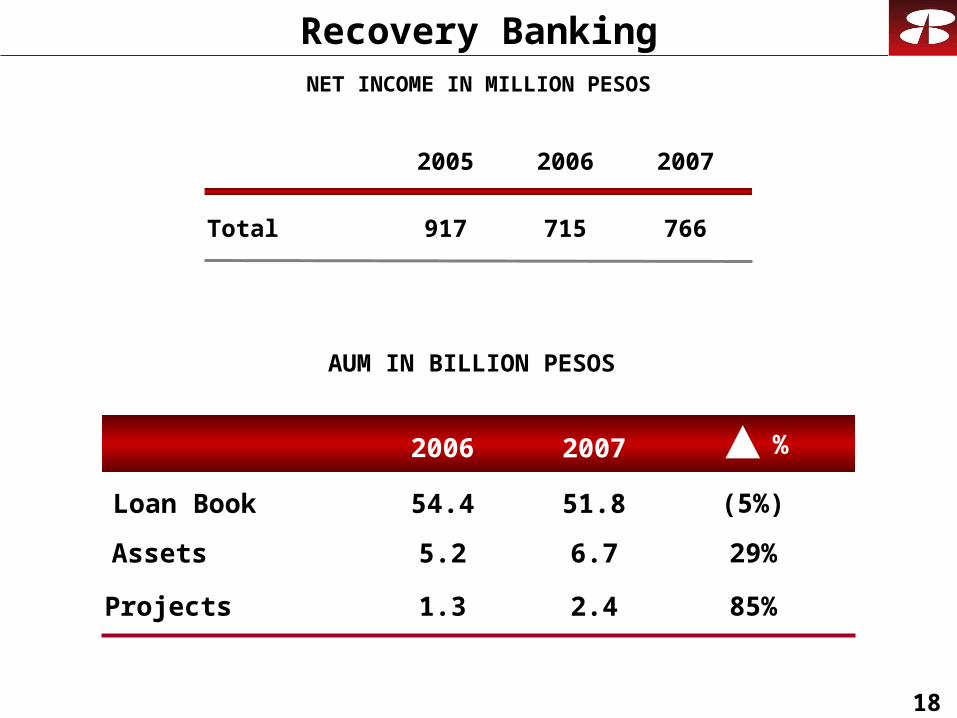
Recovery BankingNET INCOME IN MILLION PESOS
Total
2005
917
2006
715
2007
766
AUM IN BILLION PESOS
20072006
5.2
54.4
6.7
51.8Loan Book
Assets
%
29%
(5%)
1.3 2.4Projects 85%
19
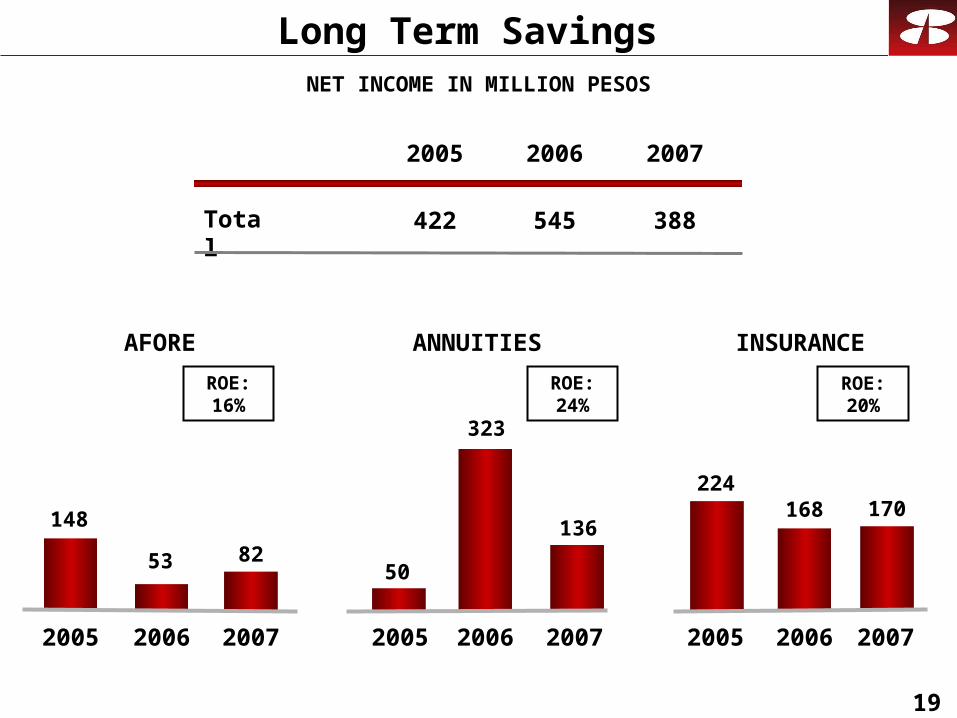
Long Term Savings
AFORE
148
53
2005 2006
INSURANCE
224168
2005 2006
ANNUITIES
50
323
2005 20062007
82
2007
136
2007
170
Total
2005
422
2006
545
2007
388
ROE: 16%
ROE: 24%
ROE: 20%
NET INCOME IN MILLION PESOS
20
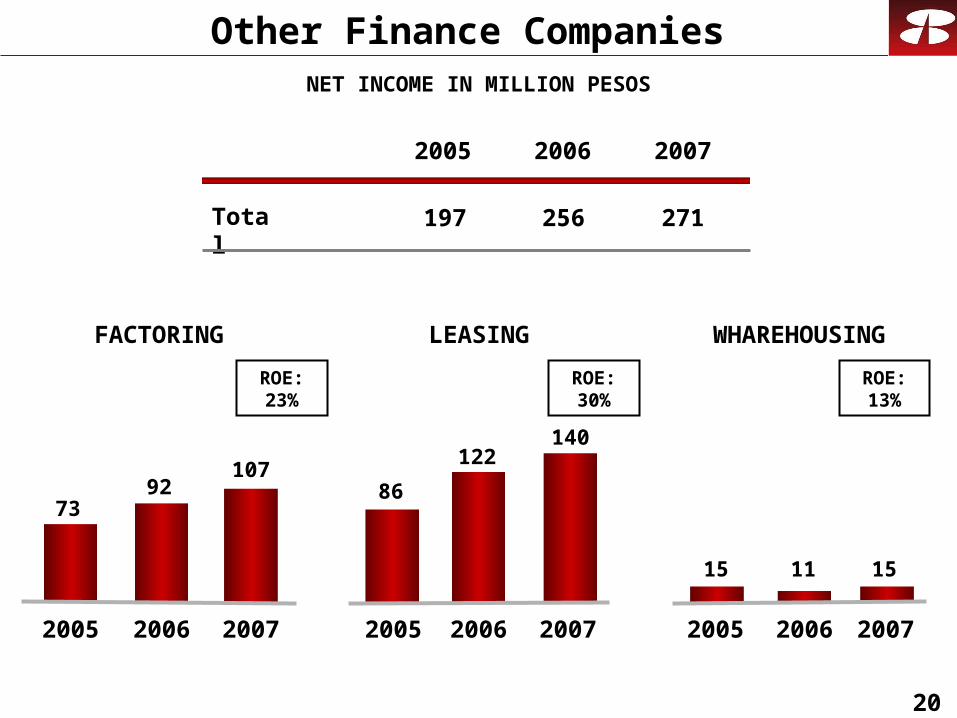
Other Finance Companies
FACTORING
7392
WHAREHOUSING
15 11
LEASING
86
122107
140
15
Total
2005
197
2006
256
2007
271
ROE: 23%
ROE: 30%
ROE: 13%
2005 2006 2005 20062005 20062007 2007 2007
NET INCOME IN MILLION PESOS
21
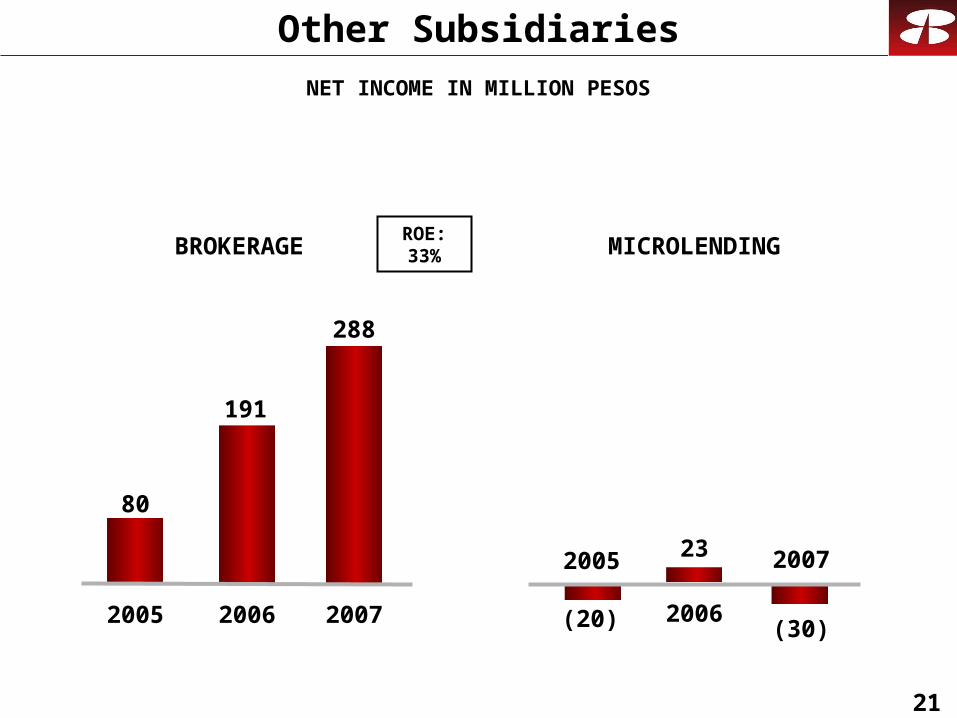
Other Subsidiaries
BROKERAGE MICROLENDING
(20)
232005
2006(30)
2007
ROE: 33%
80
191
2005 2006
288
2007
NET INCOME IN MILLION PESOS
22
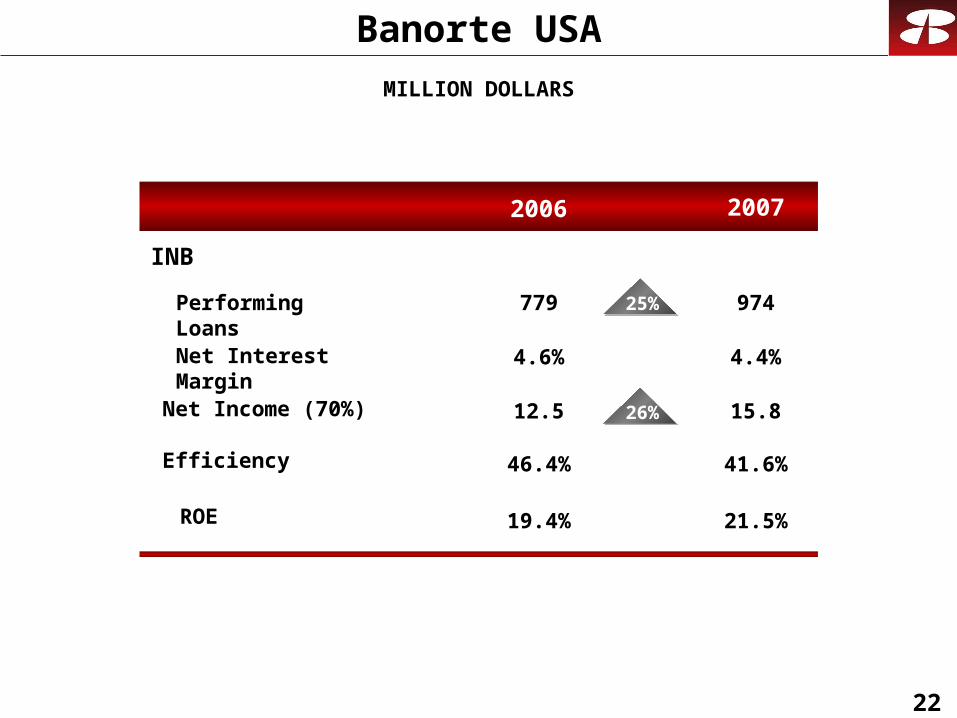
Banorte USA
MILLION DOLLARS
20072006
INB
Performing Loans
Efficiency
ROE
Net Income (70%)
Net Interest Margin
974
4.4%
15.8
41.6%
21.5%
779
12.5
19.4%
46.4%
4.6%
11%25%
11%26%
23
Business Indicators
Customers
AUM
Infrastructure
24
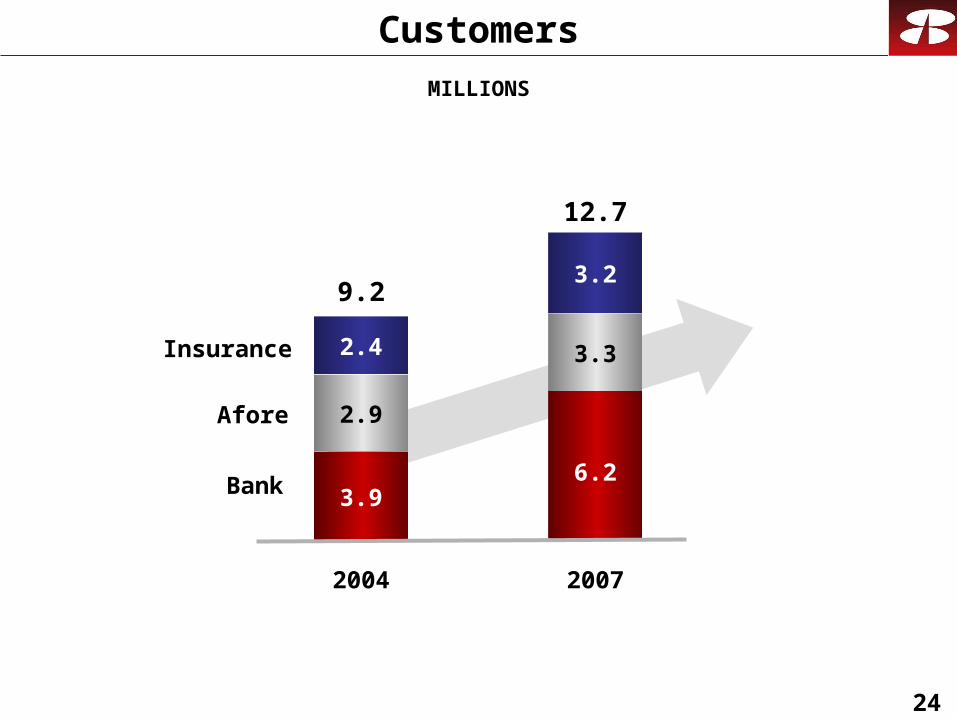
Customers
3.9
2.9
2.4
2004
Bank
Afore
Insurance
MILLIONS
9.2
4
2.4
6.2
3.3
3.2
2007
12.7
25
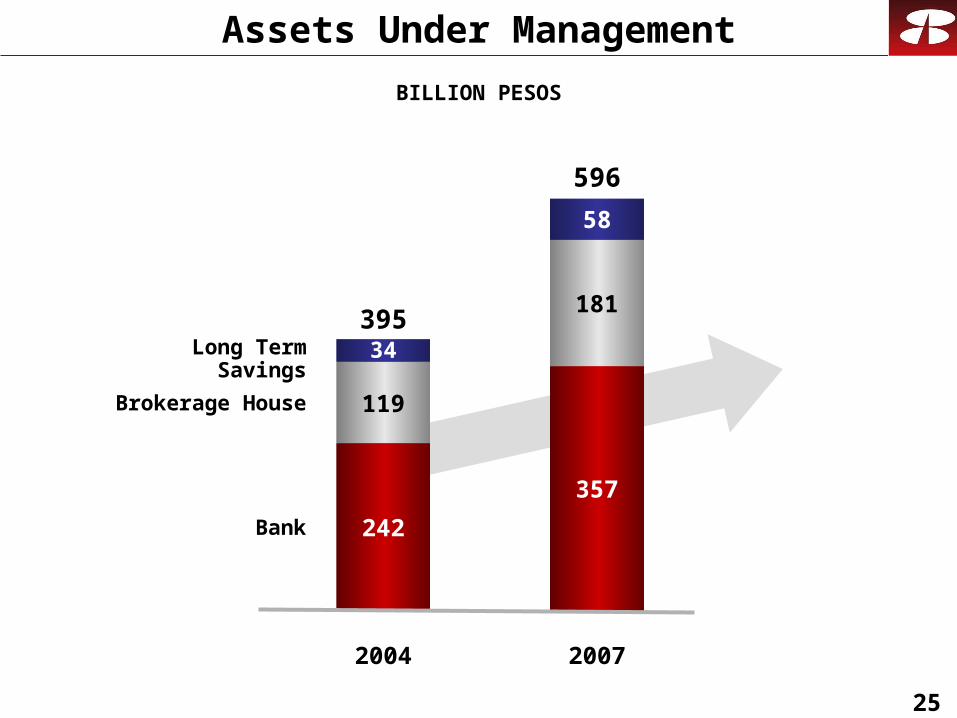
BILLION PESOS
Assets Under Management
Bank
Brokerage House
Long Term Savings
242
119
2004
39534
357
181
2007
596
58
26
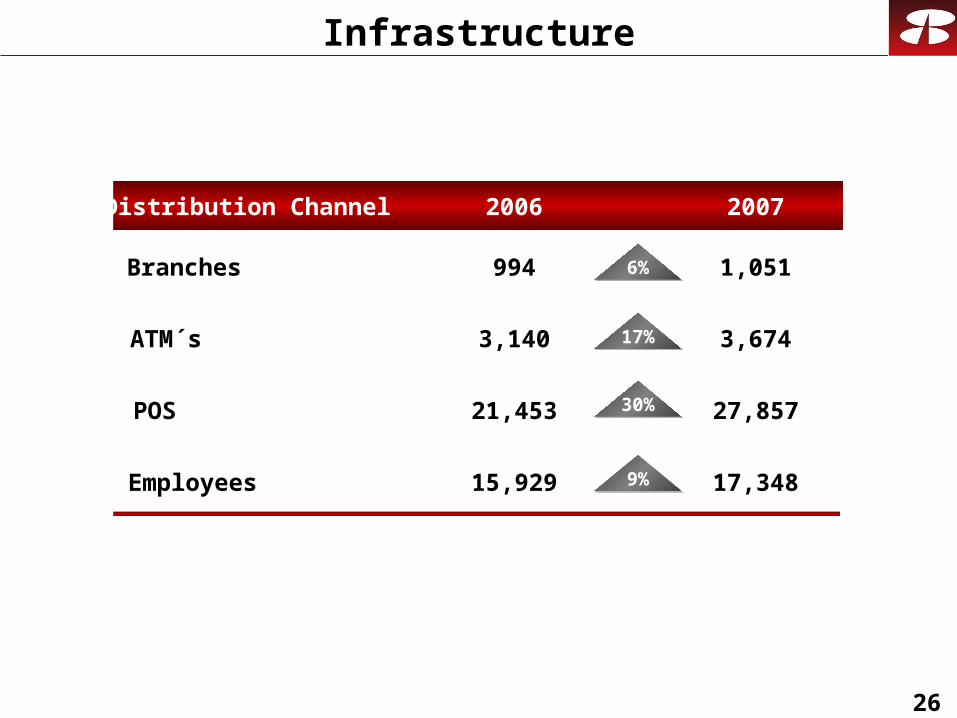
Infrastructure
Distribution Channel 2007
Branches
ATM´s
POS
1,051
3,674
27,857
Employees 17,348
994
3,140
21,453
15,929
2006
6%
17%
30%
9%

27
2. Asset Quality
28
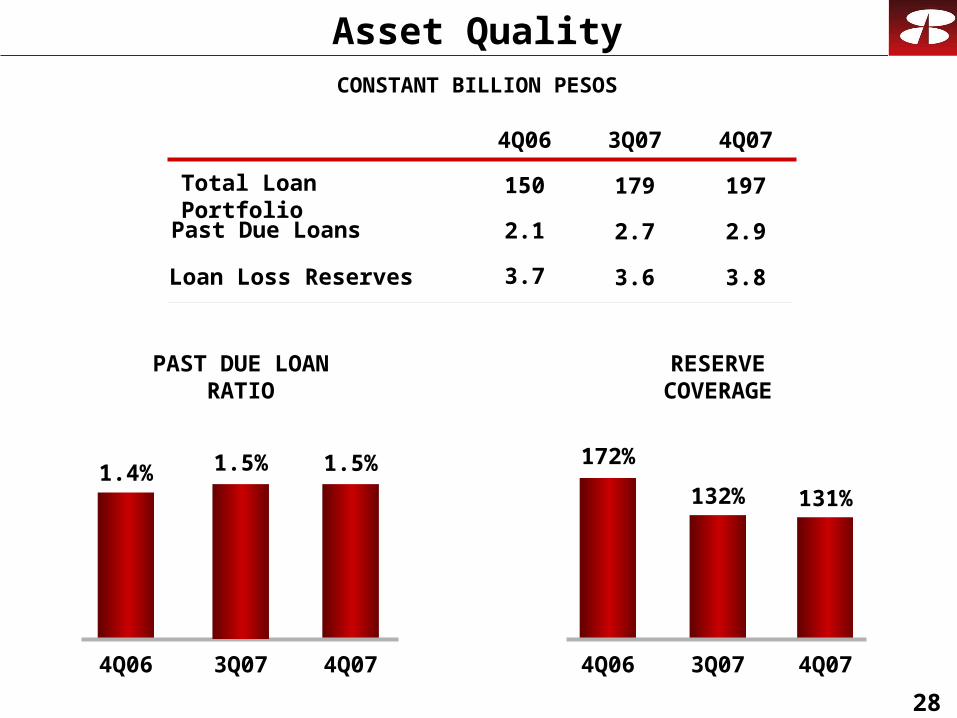
Asset Quality
Past Due Loans
Loan Loss Reserves
RESERVECOVERAGE
PAST DUE LOANRATIO
Total Loan Portfolio
CONSTANT BILLION PESOS
4Q06 3Q07 4Q07
2.1
3.7
150
2.7
3.6
179
2.9
3.8
197
131%
172%
132%
4Q06 3Q07 4Q07
1.5%1.4%
4Q06 3Q07 4Q07
1.5%
29
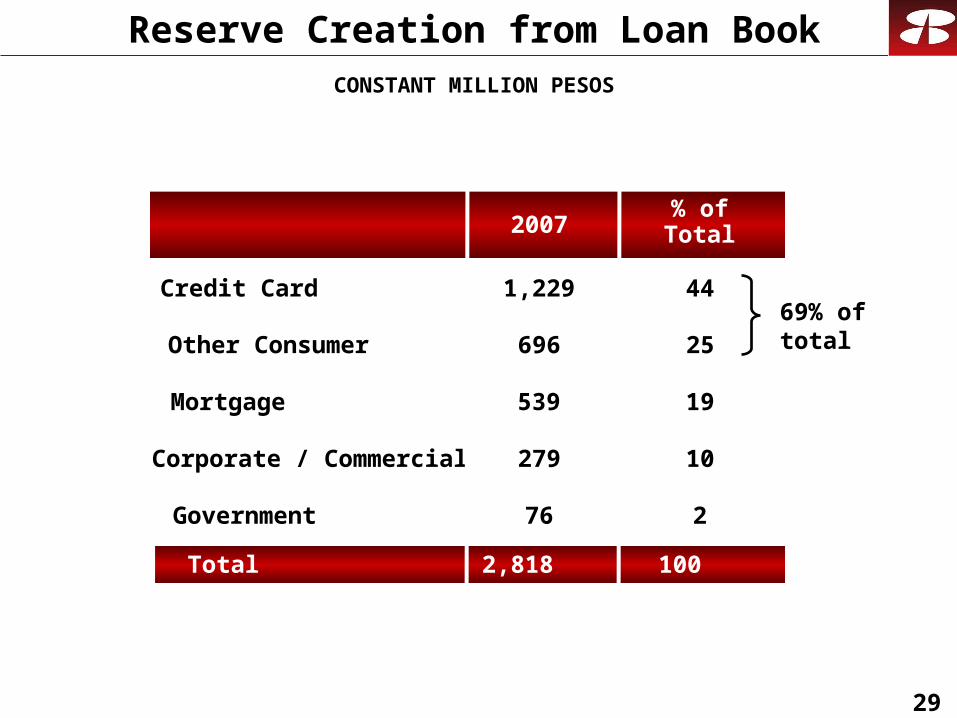
Reserve Creation from Loan Book
Mortgage
Corporate / Commercial
Government
Credit Card
696
76
1,229
539
Other Consumer
279
2007
Total 2,818
% of Total
25
2
44
19
10
100
69% of total
CONSTANT MILLION PESOS
30
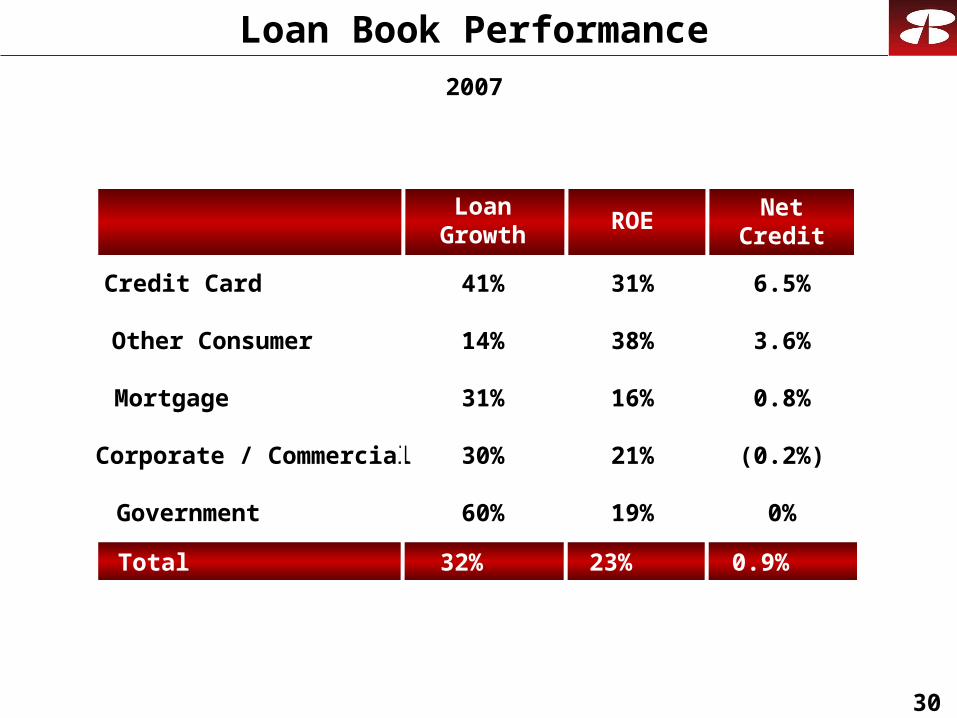
Loan Book Performance
Mortgage
Corporate / Commercial
Government
Credit Card
14%
60%
41%
31%
Other Consumer
30%
Total 32%
ROE
38%
19%
31%
16%
21%
3.6%
0%
6.5%
0.8%
(0.2%)
Loan Growth
Net Credit Losses
23% 0.9%
2007
31
3. Stock Metrics
32
60
100
140
180
220
260
300
340
380
420
460
500
540
Dec
-07
Oc
t-0
7
Au
g-0
7
Ju
n-0
7
Ap
r-0
7
Fe
b-0
7
Dec
-06
Oc
t-0
6
Au
g-0
6
Ju
n-0
6
Ap
r-0
6
Fe
b-0
6
Dec
-05
Oc
t-0
5
Au
g-0
5
Ma
y-0
5
Ap
r-0
5
Fe
b-0
5
Dec
-04
Oc
t-0
4
Au
g-0
4
Ap
r-0
4
Ap
r-0
4
Fe
b-0
4
Dec
-03
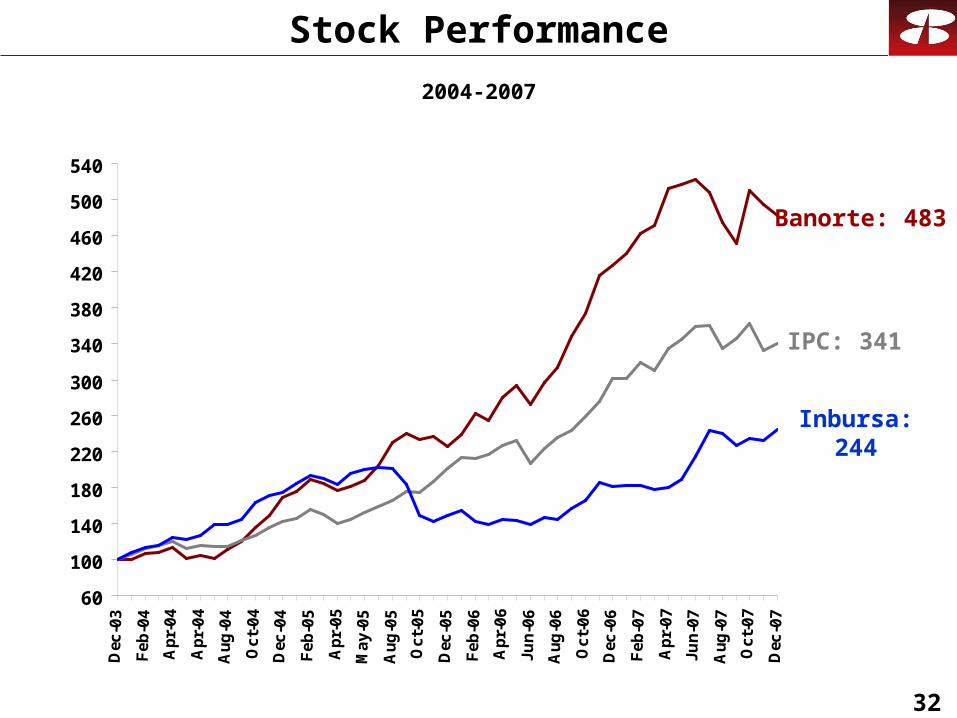
Stock Performance
IPC: 341
Banorte: 483
2004-2007
Inbursa: 244
33
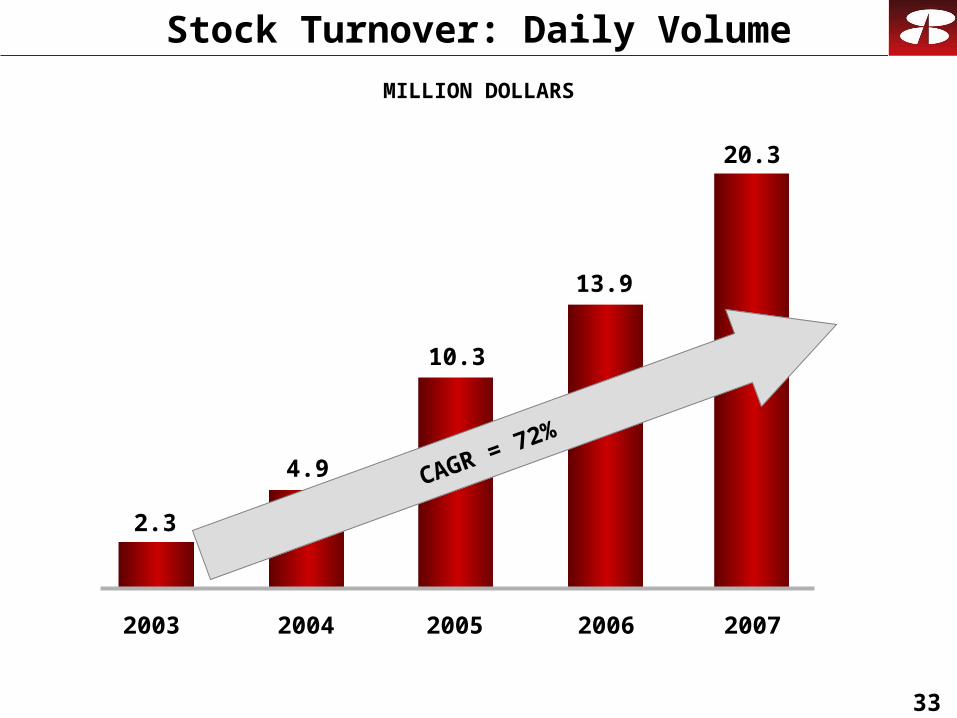
Stock Turnover: Daily Volume
MILLION DOLLARS
2003 2004
2.3
4.9
2005
10.3
2006
13.9
CAGR = 72%
2007
20.3
34
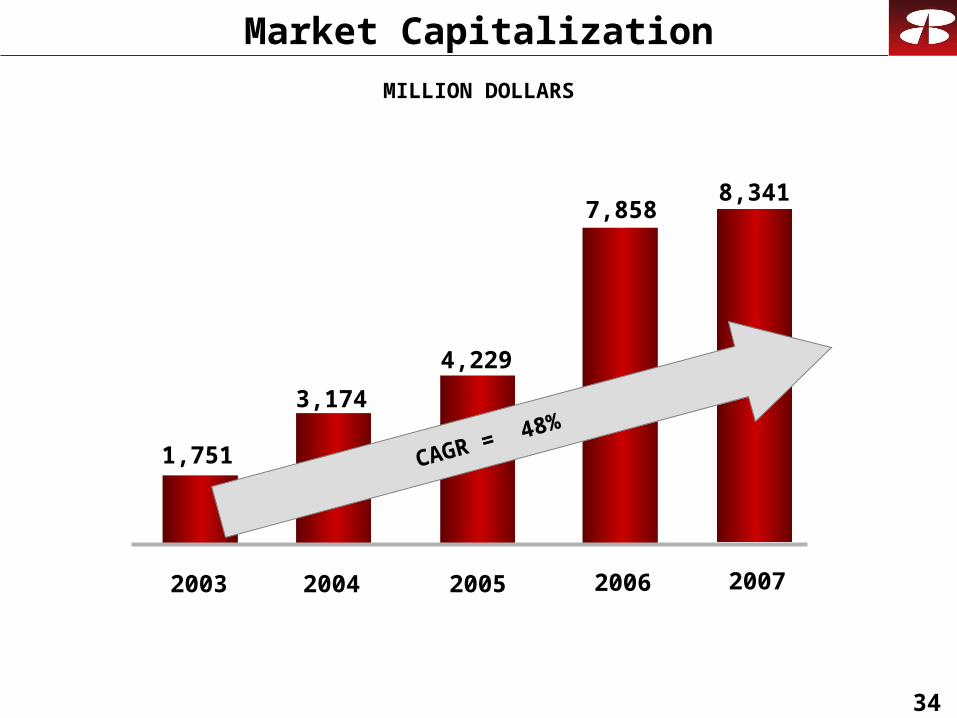
Market Capitalization
7,858
2006
3,174
1,751
2003 2004
4,229
2005
8,341
2007
CAGR = 48%
MILLION DOLLARS
35
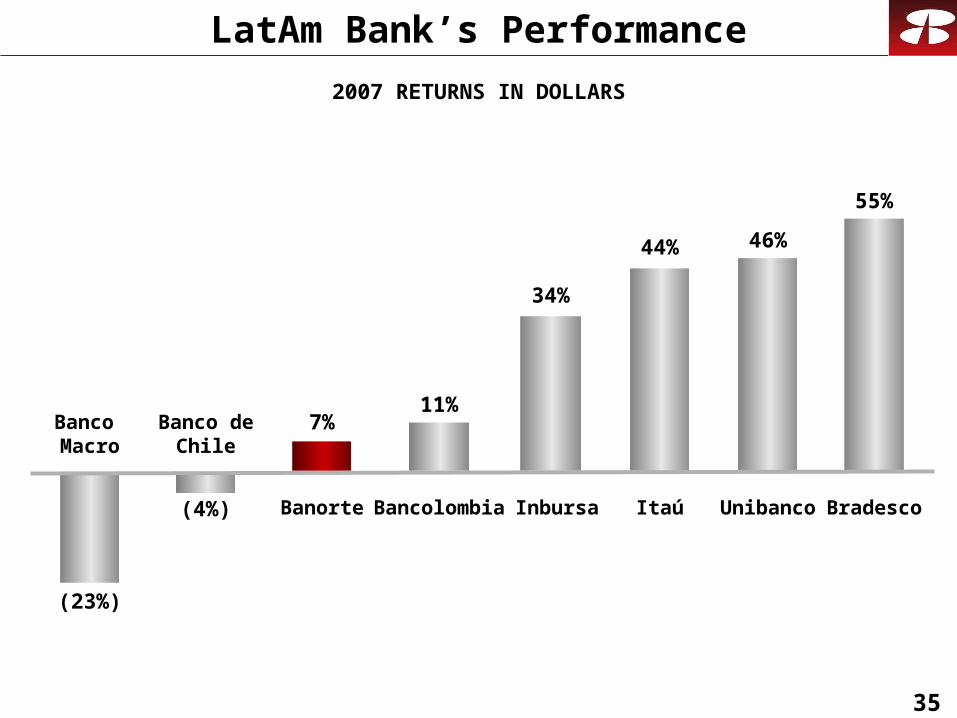
LatAm Bank’s Performance
Bradesco
(23%)
Banco deChile
46%
Unibanco
55%
(4%)
Banco Macro
Bancolombia
11%
ItaúBanorte
7%
44%
Inbursa
2007 RETURNS IN DOLLARS
34%
36
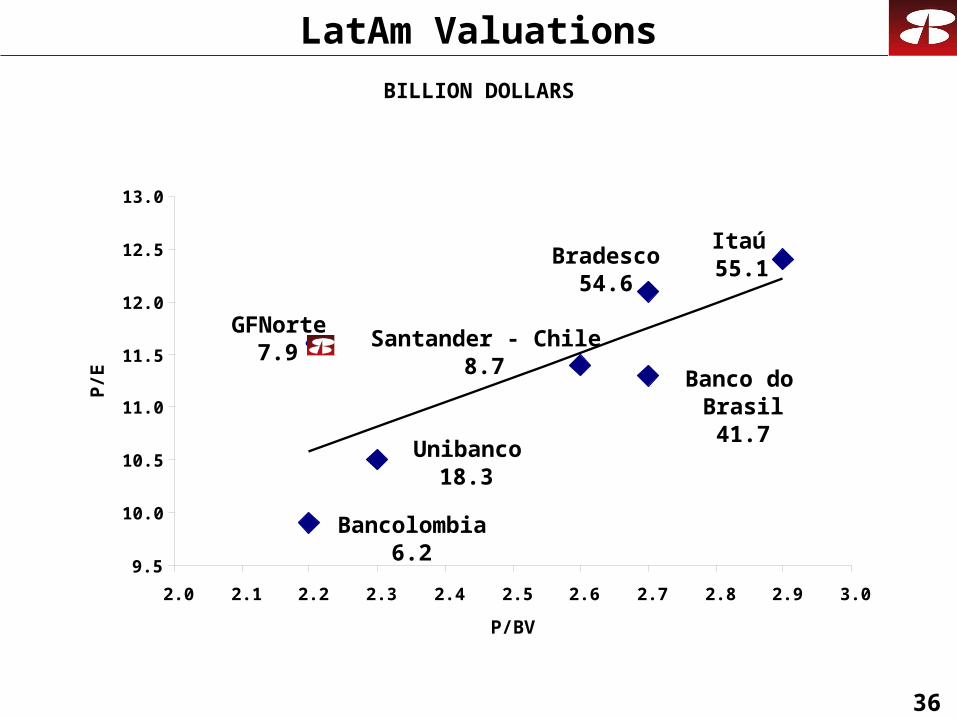
LatAm Valuations
9.5
10.0
10.5
11.0
11.5
12.0
12.5
13.0
2.0 2.1 2.2 2.3 2.4 2.5 2.6 2.7 2.8 2.9 3.0
P/BV
P/E
Bradesco54.6
Santander - Chile8.7
Bancolombia6.2
Unibanco18.3
Banco do Brasil41.7
GFNorte7.9
Itaú 55.1
BILLION DOLLARS

37
4. Final Considerations
38
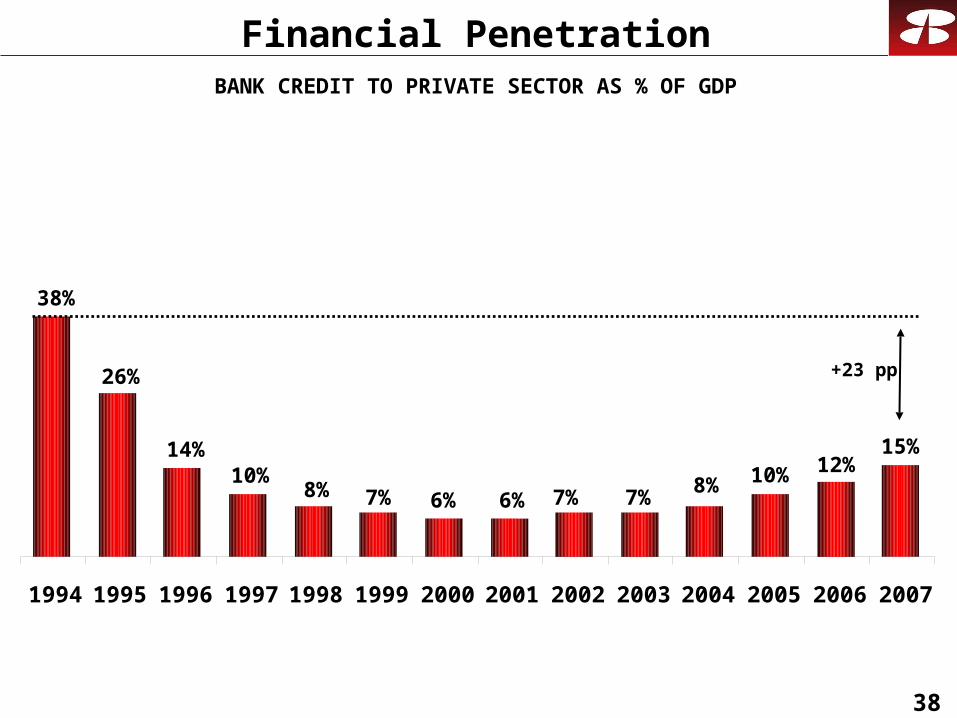
1994 1995 1996 1997 1998 1999 2000 2001 2002 2003 2004 2005 2006 2007
Financial Penetration
7%7%6%6%
14%
38%
BANK CREDIT TO PRIVATE SECTOR AS % OF GDP
8% 10% 12%
26%
10%8% 7%
15%
+23 pp
39
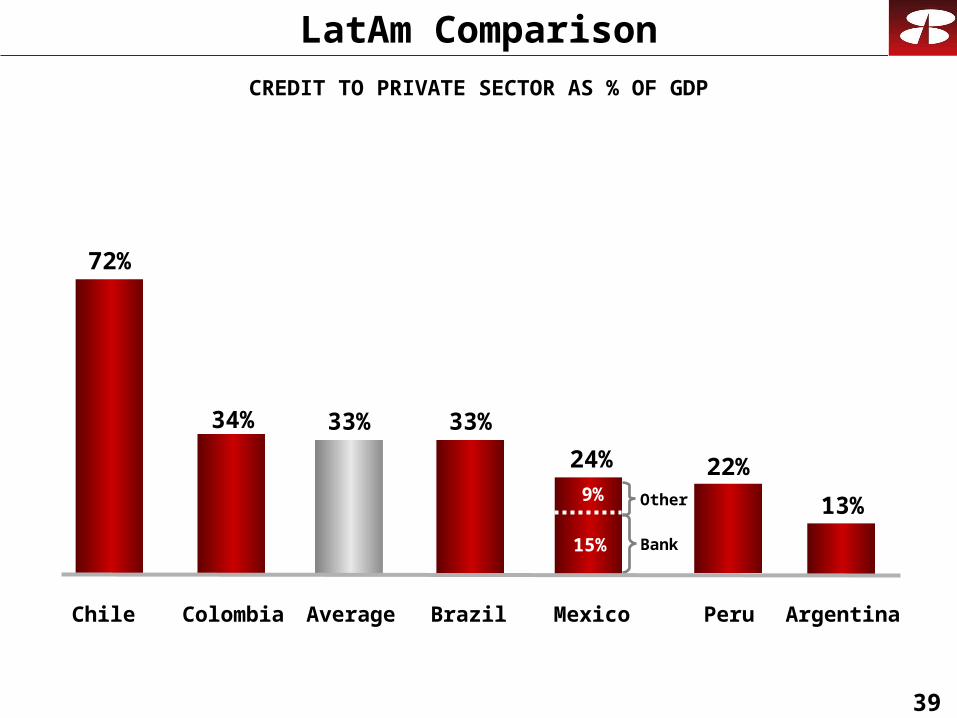
LatAm Comparison
34% 33%
13%
24%
72%
Chile Colombia Average ArgentinaMexico
Bank
Other
15%
9%
33%
Brazil
22%
Peru
CREDIT TO PRIVATE SECTOR AS % OF GDP
40
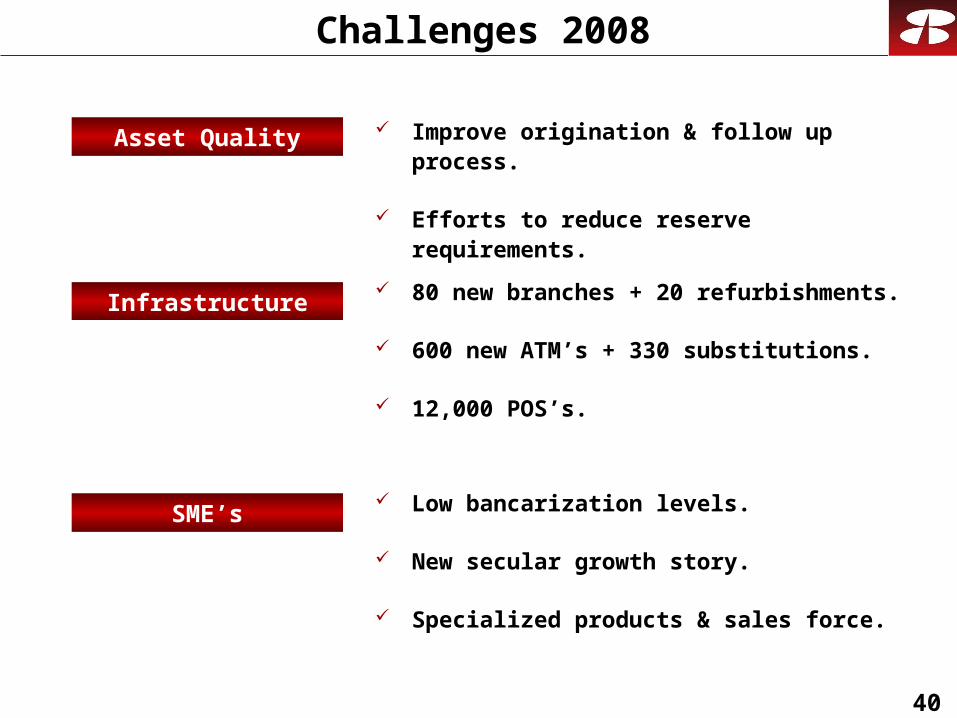
Challenges 2008
Infrastructure 80 new branches + 20 refurbishments.
600 new ATM’s + 330 substitutions.
12,000 POS’s.
SME’s Low bancarization levels.
New secular growth story.
Specialized products & sales force.
Asset Quality Improve origination & follow up process.
Efforts to reduce reserve requirements.
41
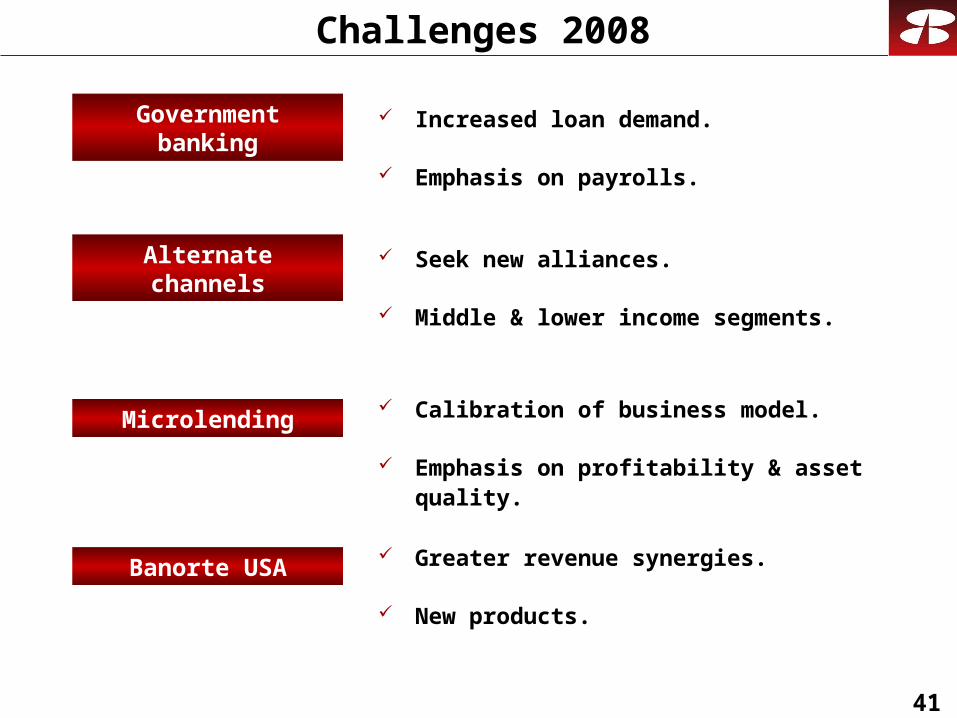
Challenges 2008
Banorte USA
Microlending
Alternate channels
Greater revenue synergies.
New products.
Calibration of business model.
Emphasis on profitability & asset quality.
Seek new alliances.
Middle & lower income segments.
Government banking Increased loan demand.
Emphasis on payrolls.
42
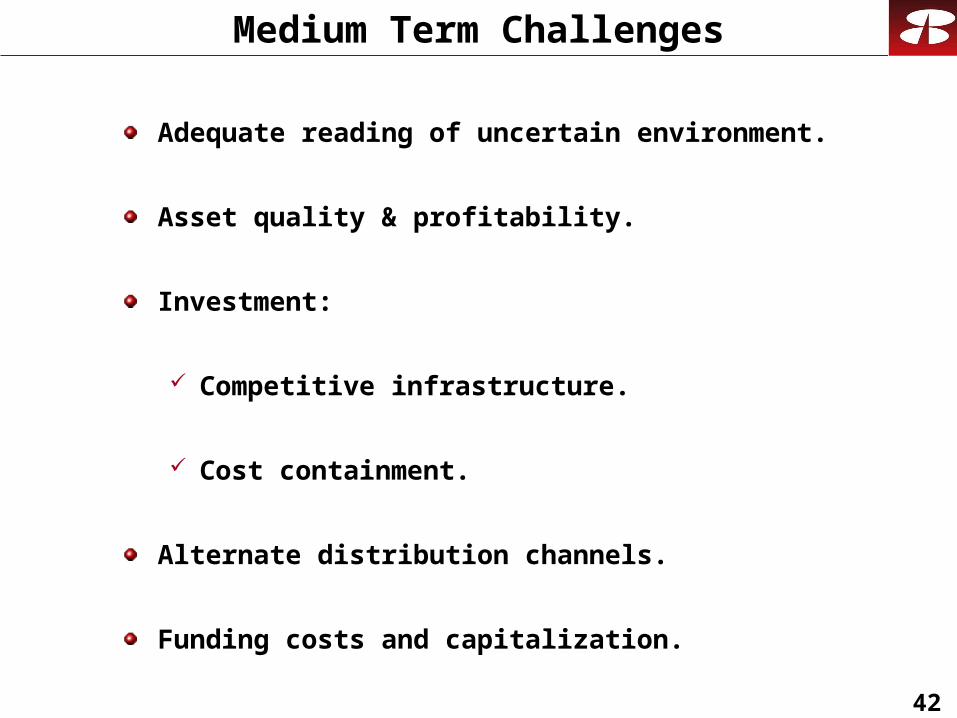
Medium Term Challenges
Adequate reading of uncertain environment.
Asset quality & profitability.
Investment:
Competitive infrastructure.
Cost containment.
Alternate distribution channels.
Funding costs and capitalization.
43