1 glucose in blood. diabetes mellitus seminar no. 4
TRANSCRIPT

1
Glucose in blood.Diabetes mellitus
Seminar No. 4

2
What is glucose?

3
• the most common monosaccharide / aldohexose
• C6H12O6 (Mr 180)
• synonyms: grape sugar, blood sugar, dextrose
• the most important sugar in the human body
• the source of chemical energy (17 kJ/g)
• metabolic nutrient for most tissues
• prominent fuel for the brain and RBC

4
Q. 1

5
A.1a) Free glucose in food is rare
Food Glucose (%)a
Glukopurb
Raisins
Honeyc
Grapes
Other fresh fruits
100
50
30
6-10
1-5a mass percentage, average values
b pure crystalline glucose, Czech made, sold in pharmacy
c about 30 % glucose, 40 % fructose, 10 % oligosaccharides, 20 % water

6
A.1 b) Glucose chemically bound
• Starch (polysaccharide from glucose: amylose + amylopectin)
cereals, bread, rolls, pastry, cakes, biscuits,
dumplings, rice, pasta, semolina, legumes, potatoes, banana ...
• Sugar (table sugar, sucrose, disaccharide: glucose + fructose)
commercially available in 100% purity
• Lactose (disaccharide: galactose + glucose) – milk

7
Q. 2

8
A. 2 Symport (co-transport) with Na+ ions
• transporter binds together Glc and Na+ (secondary active
transport) – see also Harper (27th ed., p. 436)
• Na+ ions move from high conc. space to low conc. space
• Glc is expelled from enterocyte via GLUT2 (facilitated diffusion)
• Na+ ions are expelled from cell via Na+,K+-ATPase pump
What is the metabolic fuel for enterocyte itself ?

9
Symport of Glucose with Na+
Na+ glucose
Lumen of intestine
ICF of enterocyte
membrane
transport along concentration gradient
transport against concentration gradient
The dissipation of Na+ gradient = source of energy for Glc transport

10
Q. 4 + 5
11
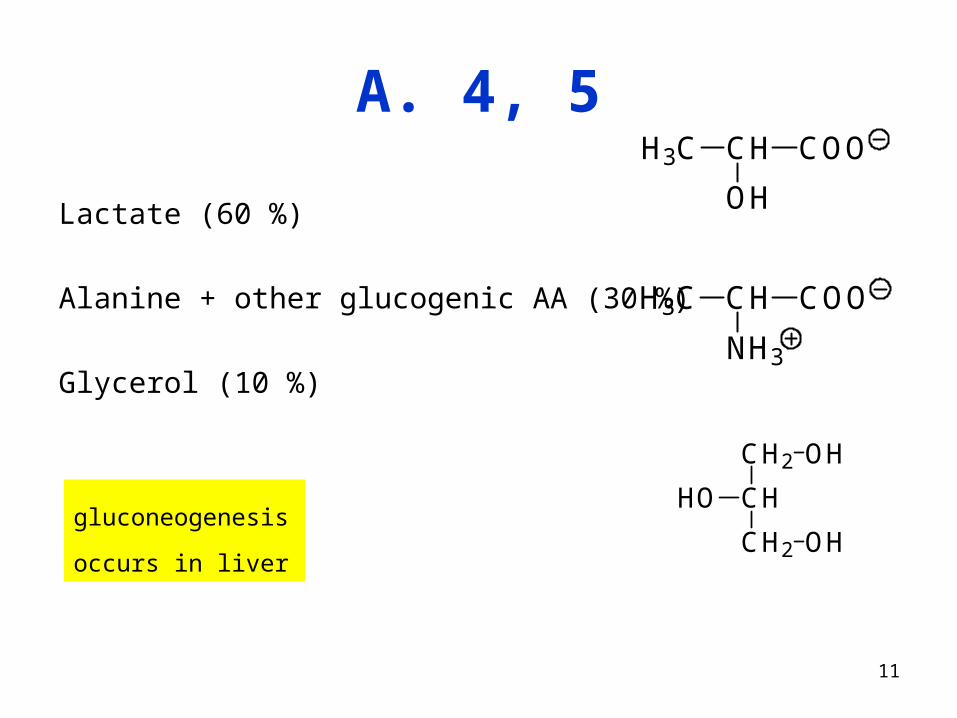
A. 4, 5
Lactate (60 %)
Alanine + other glucogenic AA (30 %)
Glycerol (10 %)
H3C CH
OH
COO
H3C CH
NH3
COO
CH2
CH
CH2
HO
OH
OH
gluconeogenesis
occurs in liver

12
Q. 7

13
A. 7 Cori cycle
liver muscle
glucose
pyruvate
lactate
glucose
pyruvate
lactate
glycolysisgluconeogenesis
transport in blood

14
Q. 8

15
• Liver glycogen is degraded by phosphate (phosphorolysis)
• Phosphorylase – phosphoglucomutase – glc-6-phosphatase
A. 8
glycogen Glc-1-P Glc-6-P glucose in bloodPi

16
Q. 9 + 10

17
A. 9 + 10 (Harper, p. 173)• Glucose is highly polar compound, does not pass freely
across hydrophobic cell membranes
• Requires specific protein transporters
• GLUT = glucose transporter
GLUT 1
GLUT 2
GLUT 3
GLUT 4
GLUT 5
SGLT 1
most cells, brain, erythrocytes
liver, pancreas, kidney
brain, kidney
muscle, adip. tissues – insulin dependent
small intestine
small intestine, kidney (Na+ coupled active transport)

18
Insulin-independent transporters
• In most tissues (liver, CNS, Ery)
• Passive transport – facilitated diffusion
• Transporter – integral protein
• After binding Glc it changes conformation and releases
glucose into ICF
Passive transport – no energy required

19
• In muscles, adipose tissue
• After binding Glc it changes conformation and releases glucose into ICF
• Free transporters are then transferred inside the cell by endocytosis
• Insulin stimulates their incorporation into cell membrane when necessary
Insulin-dependent transporters
Passive transport – no energy required

20
Q. 12

21
A. 12
• night fasting – liver glycogen
• one-day fasting - liver glycogen + gluconeogenesis
• three-day fasting - gluconeogenesis

22
Five stages of glucose homeostasis
Feature I II III IV V
Stage description well-fed post resorption early starvation prolonged starvation extreme starvation
Time intervala 0-4 h 4-16 h 16-30 h 2-24 d over 24 d
Origin of Glc in blood foodliver glycogen
gluconeogenesisgluconeogenesis liver
glycogengluconeogenesis gluconeogenesis
Utilization of Glc all tissuesall tissuesb
muscle, ad.t. limitedall tissuesb
muscle, ad.t. limitedbrain, Ercs, kidney
Ercs, kidney, brain - limited
Energy for brain Glc Glc Glc Glc, ketone bodies ketone bodies, Glc
a Approximate values, time 0 = any main meal (e.g. lunch).
b Except of liver.
23
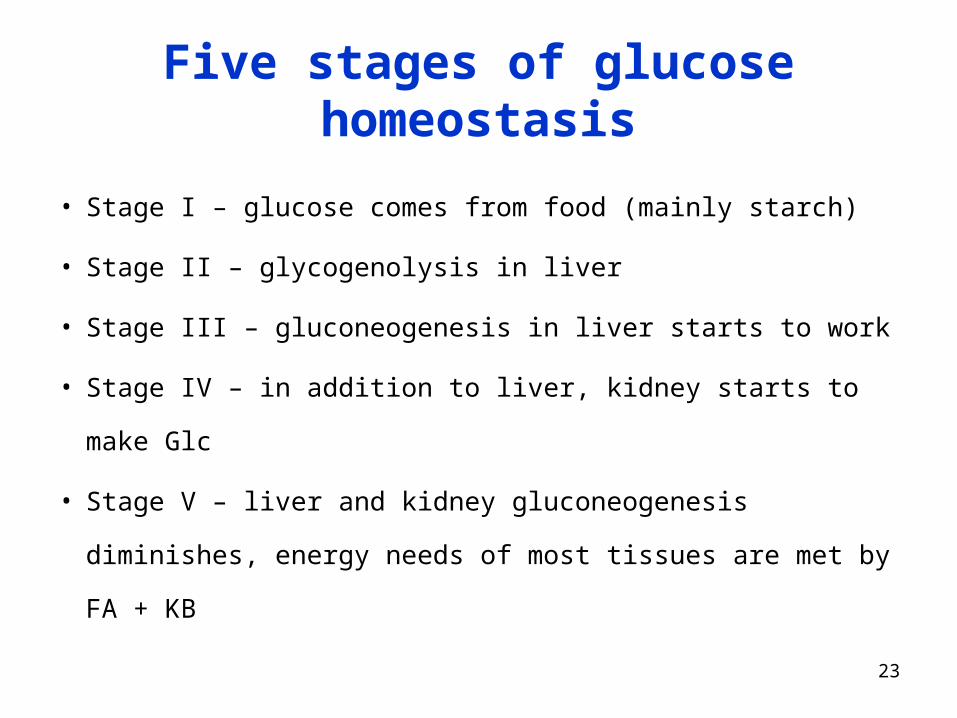
• Stage I – glucose comes from food (mainly starch)
• Stage II – glycogenolysis in liver
• Stage III – gluconeogenesis in liver starts to work
• Stage IV – in addition to liver, kidney starts to make Glc
• Stage V – liver and kidney gluconeogenesis diminishes,
energy needs of most tissues are met by FA + KB
Five stages of glucose homeostasis

24
Hormonal regulation of Glc metabolism
• insulin, glucagon
• stress hormones: adrenalin, cortisol

25
Q. 16
Harper, 27th ed., Ch. 20, p. 170

26
Q. 17

27
A.17
a) glucose
b) FFA

28
Q. 18

29
Glucagon (fasting)
• Low blood glucose level is the signal for glucagon secretion
• Glucagon stimulates:
• breakdown of glycogen in liver (not in muscles)
• gluconeogenesis in liver (from lactate and AA)
• lipolysis in adip. tissues
Glucagon is inducer of key enzymes of gluconeogenesis

30
Q. 19

31
Insulin (after meal) stimulates
• in liver: glycolysis + synthesis of glycogen
• in adip. tissue: synthesis of TAG
• in muscles: synthesis of proteins
Insulin is generally anabolic hormone
Insulin is inducer of key enzymes of glycolysis and glycogenesis

32
Q. 20

33
A. 20
• Glc phosphorylation (hexokinase, glucokinase)
• Glc-1-P isomeration
• Fru-6-P isomeration

34
Q. 21

35
A. 21 Glycogenolysis
liver
• cca 4-6 % of liver mass
• Glycogenolysis affords
free glucose - for other
tissues
• After about 18 h of
fasting exhausted
muscle
• cca 1 % of muscle mass
• Glycogenolysis affords
Glc-6-P for muscle only
• Storage lasts longer

36
Q. 22

37
A. 22
• Liver: glucagon, adrenalin
• Muscle: adrenalin

38
Q.23

39
A. 23
α-1,4
α-1,6

40
Q. 24

41
A. 24
glycogen Glc-1-P Glc-6-P glucose in blood

42
Q. 25
43
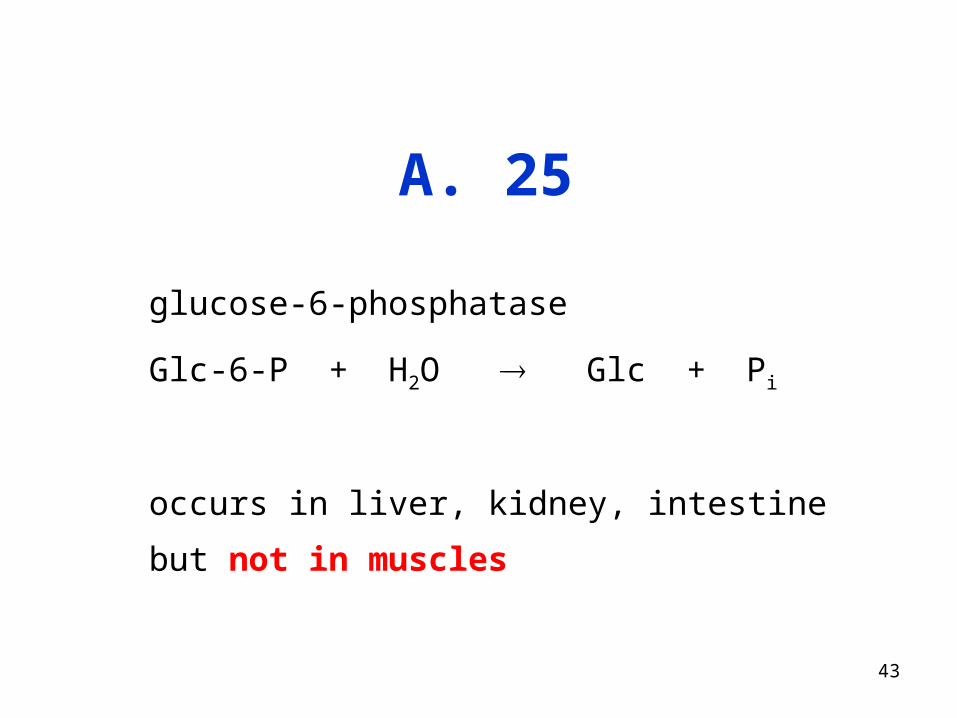
A. 25
glucose-6-phosphatase
Glc-6-P + H2O Glc + Pi
occurs in liver, kidney, intestine but not in muscles

44
Q. 26

45
A. 26
• Glc is the source of energy (aerobic glycolysis)
• Glc is the source of NADPH +H+ for FA synthesis (pentose cycle)
• Glc is the source of glycerol-3-P for TAG synthesis
glycerol-3-P 1-acylglycerol-3-P 1,2-diacylglycerol-3-P
1,2-diacylglycerol TAG

46
Adrenaline – acute stress• Signal that energy is needed immediately• Very quick action• Stimulates the breakdown of glycogen (in liver and
muscles) and TAG (In adipos. tissue)
Cortisol – adaptation to stress
• Stimulates proteolysis in muscles
• Released AA are substrates for gluconeogenesis
• Inducer of key enzymes of gluconeogenesis

47
Adrenaline action in fight-or-flight situation
liver
FA
muscles
adrenaline
TAG
glycogen
glycogenGlc
GlcAdipose tissue
Quick supply of energy for muscles

48
Metabolic Features of Diabetes (Type I)
metabolic processes occur under influence of glucagon

49
Process Change Consequence
Transport of glucose to muscle + ad.t.
Glycolysis in liver
Gluconeogenesis in liver
Lipolysis in adipocytes
β-Oxidation of FA in liver
Capacity CAC, lack of oxaloacetate
Production of ketone bodies
Q. 30

50
A. 30
Process Change Consequence
Transport of glucose to muscle + ad.t. elevated blood glucose
Glycolysis in liver elevated blood glucose
Gluconeogenesis in liver elevated blood glucose
Lipolysis in adipocytes elevated blood fatty acids
β-Oxidation of FA in liver production of acetyl-CoA
Capacity CAC, lack of oxaloacetate amount of acetyl-CoA
Production of ketone bodies elevated blood KB, acidosis
51
Q. 31
Elevated: glucose
FFA
TG
KB !

52
A. 31 – elevated Glc
• The lack of insulin few GLUT4 Glc cannot enter
adipose and muscle cells elevated blood Glc
• The lack of insulin decreased glycolysis in liver
• The excess of glucagon glycogenolysis elevated blood
glucose
• The excess of glucagon increased liver gluconeogenesis

53
A. 31 – elevated FFA
The excess of glucagon lipolysis
elevated blood FFA (bound to albumin)

54
A. 31 – elevated TG
• The lack of insulin not enough LPL (insulin is the
inducer of its synthesis) elevated blood TG
(CM + VLDL)

55
A. 31 – elevated KB
• The excess of FA from lipolysis excess of acetyl-
CoA (over CAC capacity) synthesis of KB
elevated blood KB
• Limited glycolysis in liver not enough pyruvate
not enough oxaloacetate to run CAC excess of
acetyl-CoA (over CAC capacity) synthesis of KB
elevated blood KB

56
Q. 32

57
A. 32 N NH
S
O
COOH
C
O
HO
Biotin COOH
H3C C
O
COOH
Biotin H
CH2 C
O
COOHHOOC
pyruvát oxalacetát
pyruvátkarboxylasa
+
pyruvate oxaloacetate
Pyruvate carboxylase

58
Q. 33

59
A. 33
1. The lack of insulin decreased glycolysis the shortage of
pyruvate the shortage of oxaloacetate
2. The excess of glucagon increased utilization of
oxaloacetate for gluconeogenesis
60
Q. 34

61
A. 34
H3C C CH3
O
H3C CH CH2 CO
OH
OH
H3C C CH2
O
CO
O H- CO2
- 2H
+ 2H
-hydroxymáselná kyselina acetoctová kyselina aceton
Acid pKA
Acetoacetic
-Hydroxybutyric
3.52
4.70
acetone
non-electrolyte
beta-hydroxybutyric ac. acetoacetic ac.
62
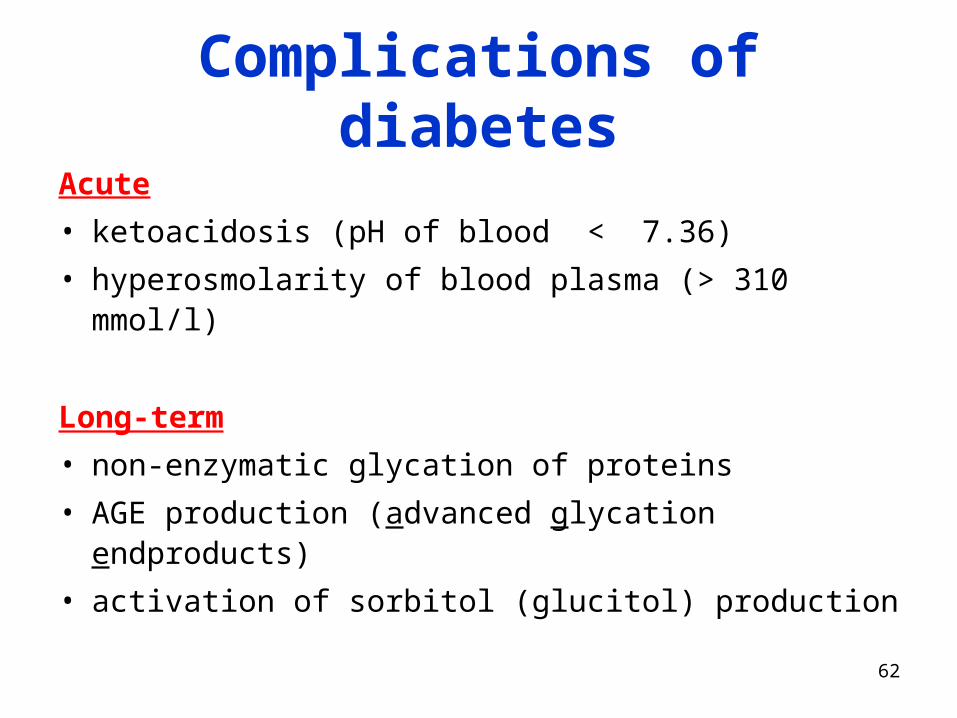
Complications of diabetes
Acute
• ketoacidosis (pH of blood < 7.36)
• hyperosmolarity of blood plasma (> 310 mmol/l)
Long-term
• non-enzymatic glycation of proteins
• AGE production (advanced glycation endproducts)
• activation of sorbitol (glucitol) production

63
Q. 35

64
A. 35
A) Increased lipolysis, elevated FFA-albumin in blood
B) Shortage of LPL because of the lack of insulin elevated
plasma TG (CM and VLDL)
C) Increased production of KB and VLDL
65
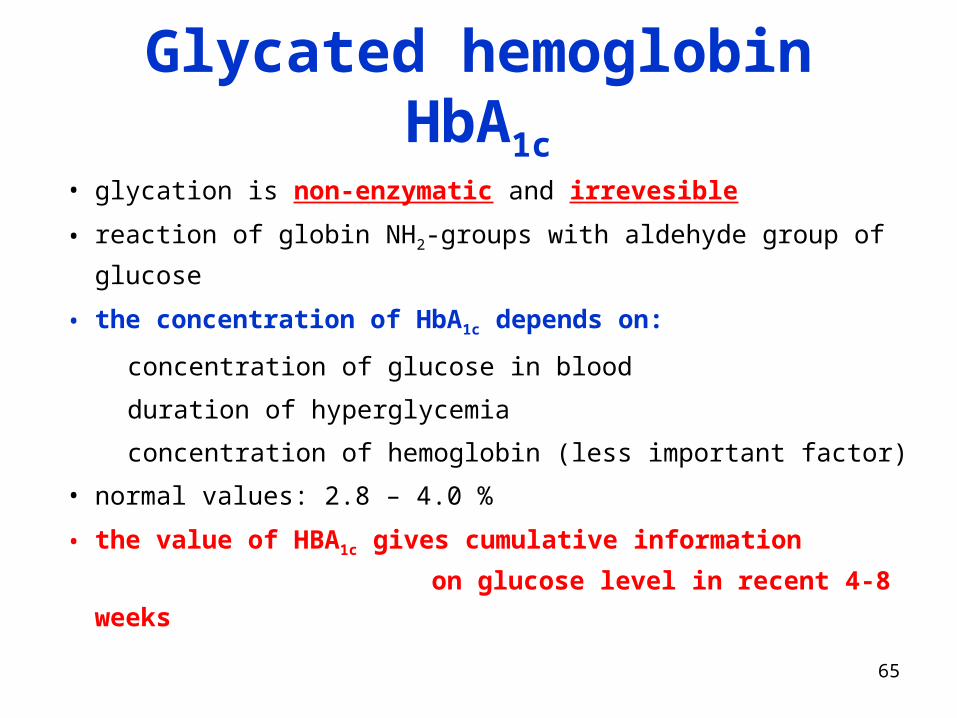
Glycated hemoglobin HbA1c
• glycation is non-enzymatic and irrevesible
• reaction of globin NH2-groups with aldehyde group of glucose
• the concentration of HbA1c depends on:
concentration of glucose in blood
duration of hyperglycemia
concentration of hemoglobin (less important factor)
• normal values: 2.8 – 4.0 %
• the value of HBA1c gives cumulative information
on glucose level in recent 4-8 weeks

66
Glycation of proteins
C
C
C
OHH
HHO
C
C
OHH
OH
CH2OH
H OH
+ H2N-PROTEIN
glucose
aldehyde form
- H2O
which -NH2
groups in globin
are nucleophilic?

67
Glycation of proteins
C
C
C
OHH
HHO
C
C
OHH
OH
CH2OH
H OH
+ H2N-PROTEIN
N-terminal
or
Lysine side chain
- H2O
C
C
C
OHH
HHO
C
C
OHH
NH
CH2OH
H OH
PROTEIN CH2
C
C
O
HHO
C
C
OHH
CH2OH
H OH
NH PROTEIN
aldimine
Schiff’s base
unstable
ketoamine
glycated protein
rearrangement
AGE