1 h13 hcc_ir_eng
TRANSCRIPT
Hyundai Card Hyundai Card is...Hyundai Card Investor Presentation 1H13
DisclaimerThese presentation materials have been prepared by Hyundai Card Co., Ltd. (“HCC or the Company”), solely for the use at this presentation and havenot been independently verified. No representations or warranties, express or implied, are made as to, and no reliance should be placed on, theaccuracy, fairness or completeness of the information presented or contained in this presentation. Neither the Company nor any of its affiliates,advisers or representatives accepts any responsibility whatsoever for any loss or damage arising from any information presented or contained in thispresentation. The information presented or contained in this presentation is current as of the date hereof and is subject to change without notice andits accuracy is not guaranteed. Neither the Company nor any of its affiliates, advisers or representatives make any undertaking to update any suchits accuracy is not guaranteed. Neither the Company nor any of its affiliates, advisers or representatives make any undertaking to update any suchinformation subsequent to the date hereof. This presentation should not be construed as legal, tax, investment or other advice.
Certain information and statements made in this presentation contain “forward-looking statements.” Such forward-looking statements canbe identified by the use of forward-looking terminology such as “anticipate,” “believe,” “considering,” “depends,” “estimate,” “expect,” “intend,” “plan,”“planning,”“planned,” “project,”“trend,” and similar expressions. All forward-looking statements are the Company’s current expectation of futureevents and are subject to a number of factors that could cause actual results to differ materially from those described in the forward-lookingstatements. Caution should be taken with respect to such statements and you should not place undue reliance on any such forward-lookingstatements.
Certain industry and market data in this presentation was obtained from various trade associations, and the Company have not verified such data withindependent sources. Accordingly, the Company make no representations as to the accuracy or completeness of that data, and such data involves risksand uncertainties and is subject to change based on various factors.
This presentation does not constitute an offer or invitation to purchase or subscribe for any shares or other securities of the Company and neither anypart of this presentation nor any information or statement contained therein shall form the basis of or be relied upon in connection with any contract orcommitment whatsoever. Any decision to purchase shares in any offering of shares of the Company should be made solely on the basis of theinformation contained in the offering document which may be published or distributed in due course in connection with any offering of shares of theCompany, if any.
The contents of this presentation may not be reproduced, redistributed or passed on, directly or indirectly, to any other person or published, in wholeor in part, for any purpose.
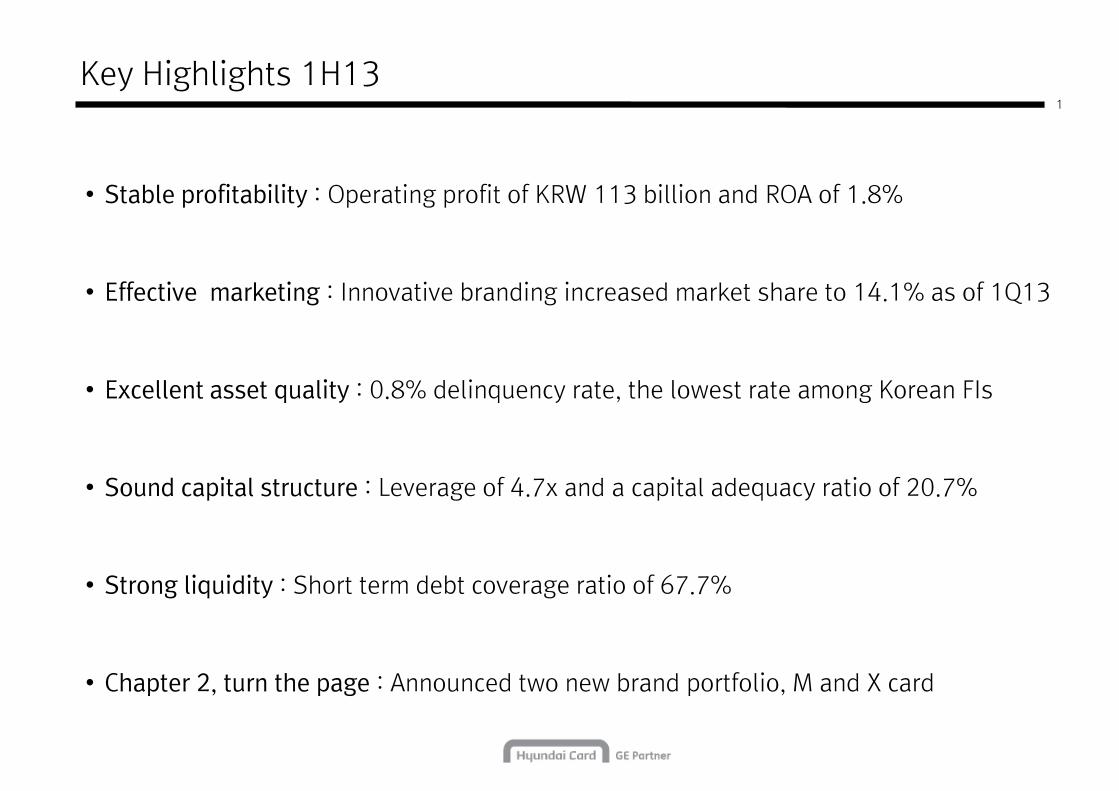
• Stable profitability : Operating profit of KRW 113 billion and ROA of 1.8%
1
Key Highlights 1H13
• Effective marketing : Innovative branding increased market share to 14.1% as of 1Q13
• Excellent asset quality : 0.8% delinquency rate, the lowest rate among Korean FIs
• Sound capital structure : Leverage of 4.7x and a capital adequacy ratio of 20.7%
• Strong liquidity : Short term debt coverage ratio of 67.7%
• Chapter 2, turn the page : Announced two new brand portfolio, M and X card
2
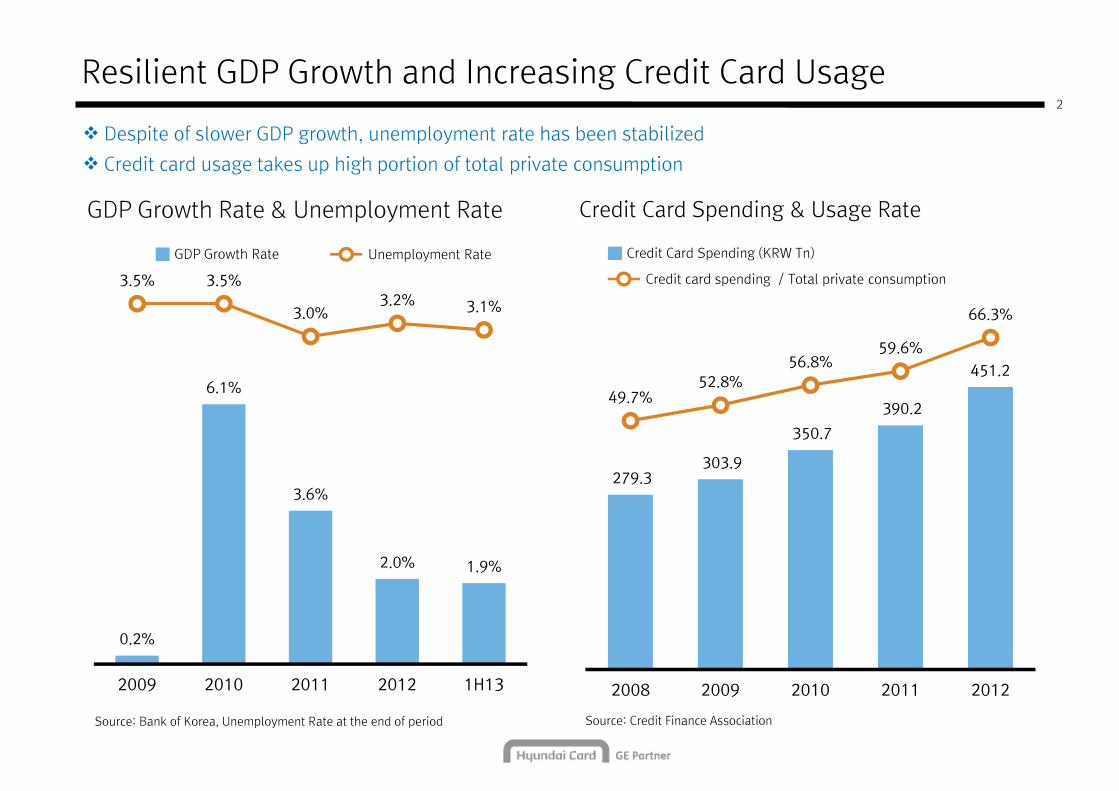
Resilient GDP Growth and Increasing Credit Card Usage
GDP Growth Rate & Unemployment Rate
GDP Growth Rate Unemployment Rate
Credit Card Spending & Usage Rate
Credit Card Spending (KRW Tn)
� Despite of slower GDP growth, unemployment rate has been stabilized
� Credit card usage takes up high portion of total private consumption
Credit card spending / Total private consumption
279.3 303.9
350.7
390.2
451.2
49.7%52.8%
56.8%59.6%
66.3%
6.1%
3.6%
3.5% 3.5%
3.0%3.2% 3.1%
Source: Bank of Korea, Unemployment Rate at the end of period Source: Credit Finance Association
2008 2009 2010 2011 2012
0.2%
2.0% 1.9%
2009 2010 2011 2012 1H13
3
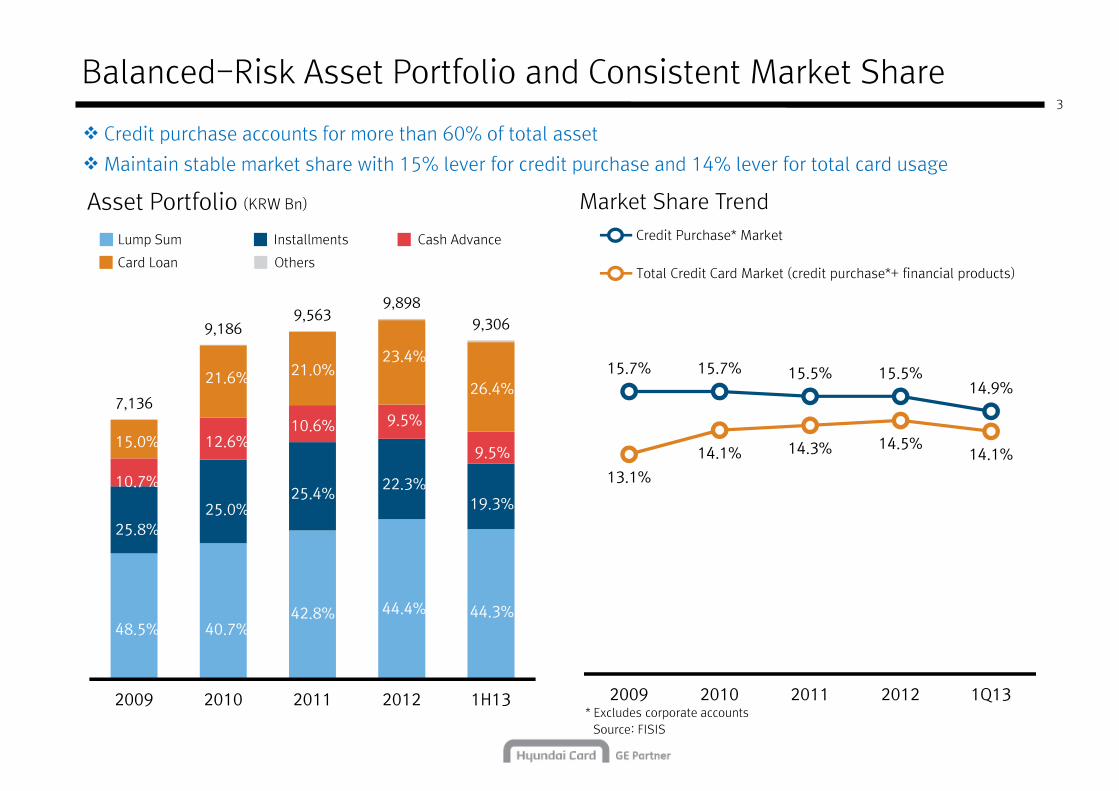
Balanced-Risk Asset Portfolio and Consistent Market Share
Asset Portfolio (KRW Bn) Market Share Trend
Lump Sum Installments Cash Advance
Card Loan Others
Credit Purchase* Market
� Credit purchase accounts for more than 60% of total asset
� Maintain stable market share with 15% lever for credit purchase and 14% lever for total card usage
Card Loan OthersTotal Credit Card Market (credit purchase*+ financial products)
7,136
9,1869,563
9,898
9,306
25.8%
10.7%
15.0%
25.0%
12.6%
21.6%
25.4%
10.6%
21.0%
22.3%
9.5%
23.4%
19.3%
9.5%
26.4%15.7% 15.7% 15.5% 15.5%
14.9%
13.1%
14.1% 14.3% 14.5%14.1%
* Excludes corporate accountsSource: FISIS
2009 2010 2011 2012 1H13
48.5%
25.8%
40.7%42.8% 44.4% 44.3%
2009 2010 2011 2012 1Q13
4
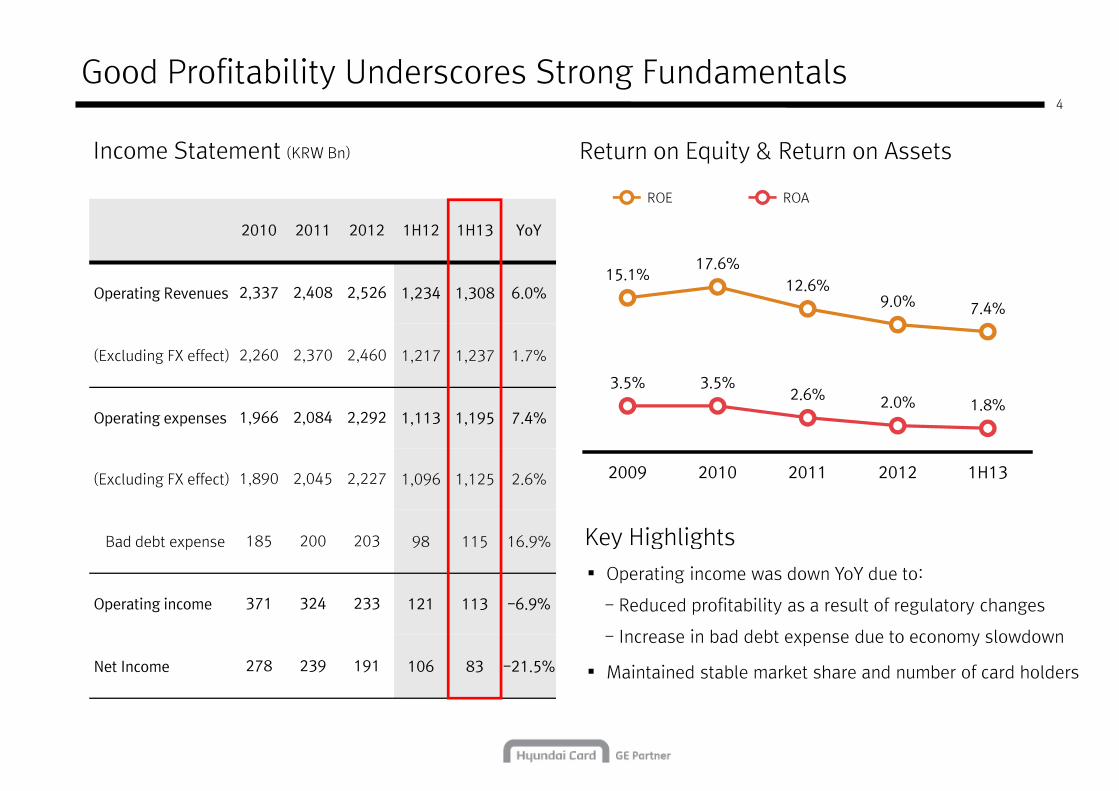
Good Profitability Underscores Strong Fundamentals
2010 2011 2012 1H12 1H13 YoY
Income Statement (KRW Bn) Return on Equity & Return on Assets
ROE ROA
17.6%
Key Highlights
Operating Revenues 2,337 2,408 2,526 1,234 1,308 6.0%
(Excluding FX effect) 2,260 2,370 2,460 1,217 1,237 1.7%
Operating expenses 1,966 2,084 2,292 1,113 1,195 7.4%
(Excluding FX effect) 1,890 2,045 2,227 1,096 1,125 2.6%
15.1%17.6%
12.6%9.0% 7.4%
3.5% 3.5%2.6% 2.0% 1.8%
2009 2010 2011 2012 1H13
Key Highlights
� Operating income was down YoY due to:
- Reduced profitability as a result of regulatory changes
- Increase in bad debt expense due to economy slowdown
� Maintained stable market share and number of card holders
Bad debt expense 185 200 203 98 115 16.9%
Operating income 371 324 233 121 113 -6.9%
Net Income 278 239 191 106 83 -21.5%
5
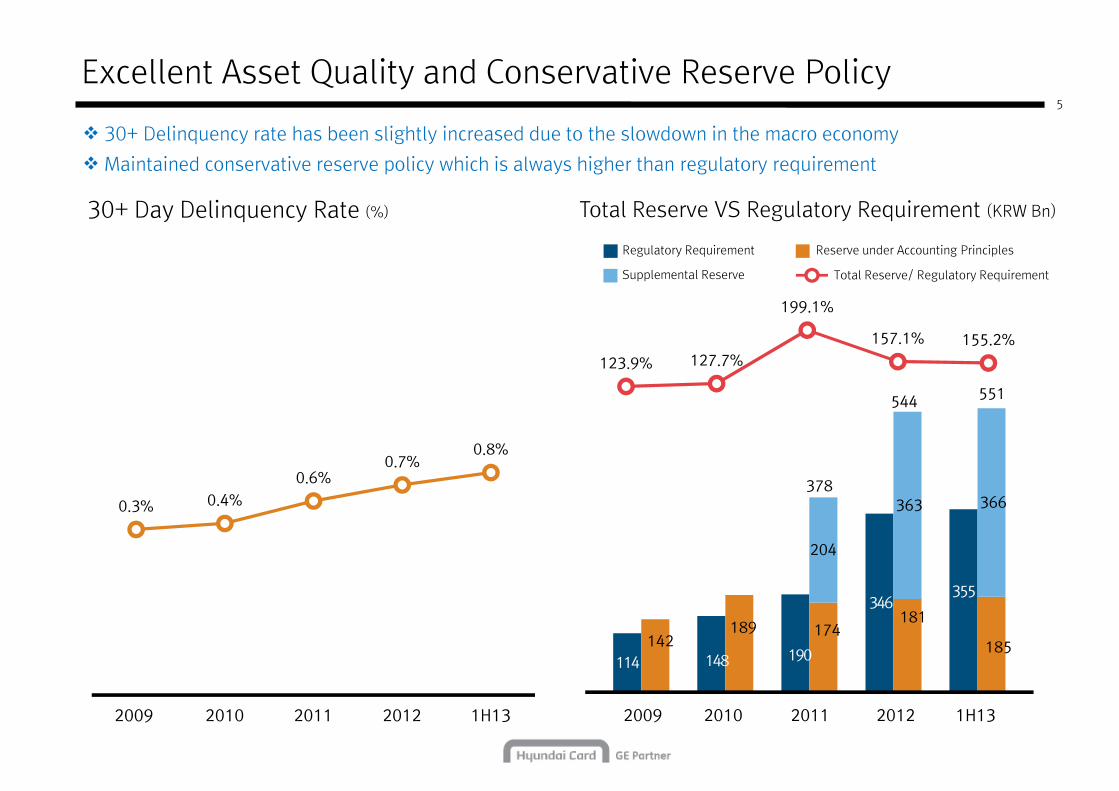
Excellent Asset Quality and Conservative Reserve Policy
30+ Day Delinquency Rate (%) Total Reserve VS Regulatory Requirement (KRW Bn)
Regulatory Requirement Reserve under Accounting Principles
� 30+ Delinquency rate has been slightly increased due to the slowdown in the macro economy
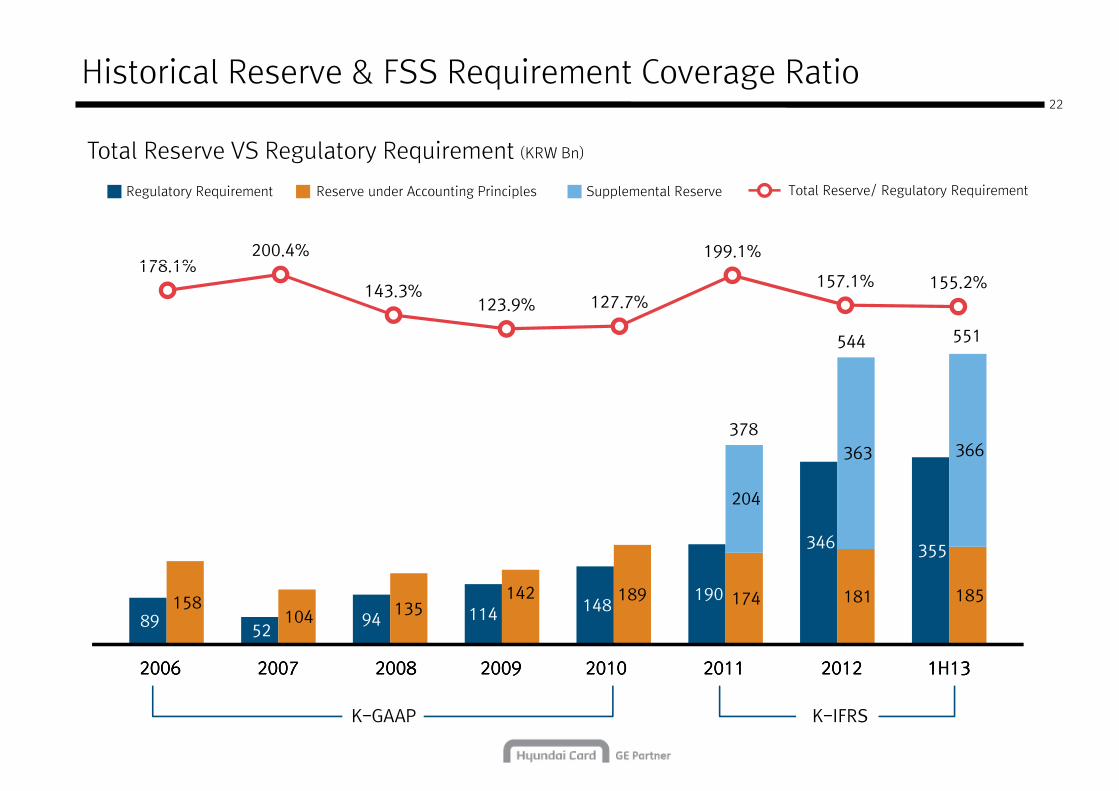
� Maintained conservative reserve policy which is always higher than regulatory requirement
Supplemental Reserve Total Reserve/ Regulatory Requirement
0.3% 0.4%
0.6%0.7%
0.8%
363 366 378
544
123.9% 127.7%
199.1%
157.1% 155.2%
551
2009 2010 2011 2012 1H13
114 148 190
346 355
142189 174
181
185
204
2009 2010 2011 2012 1H13
6
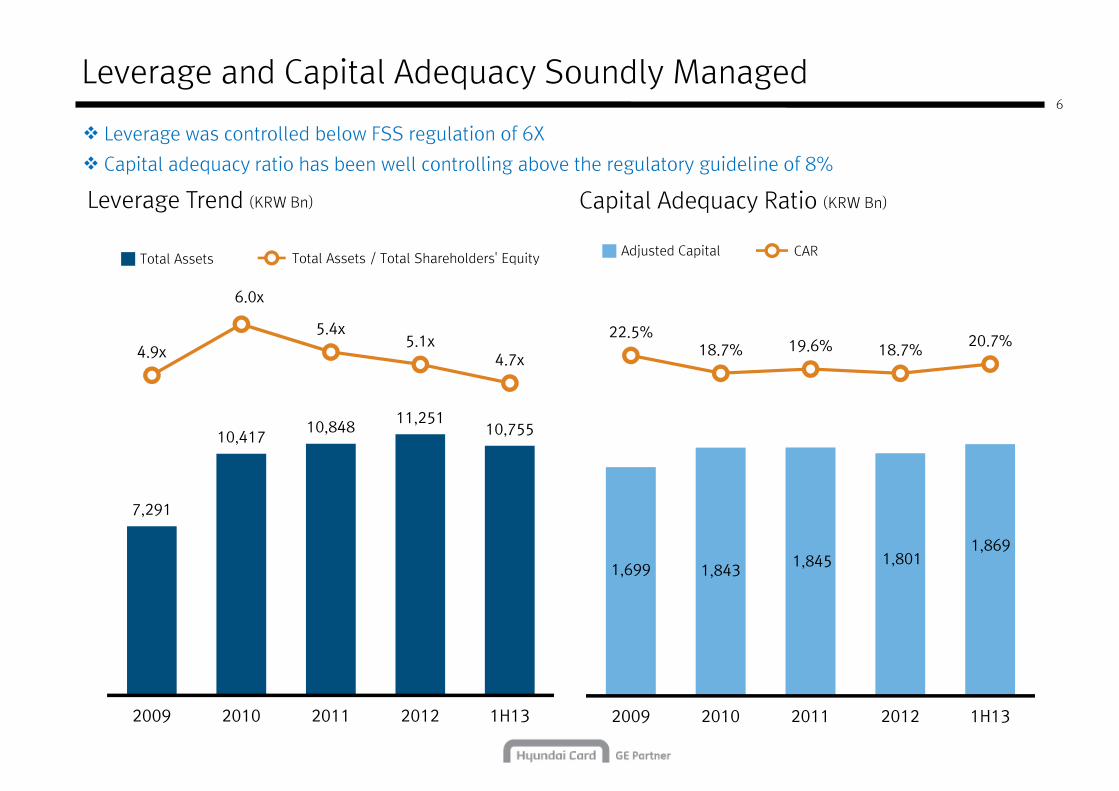
Leverage and Capital Adequacy Soundly Managed
Leverage Trend (KRW Bn) Capital Adequacy Ratio (KRW Bn)
Total Assets / Total Shareholders' Equity Adjusted Capital CAR
� Leverage was controlled below FSS regulation of 6X
� Capital adequacy ratio has been well controlling above the regulatory guideline of 8%
Total Assets
7,291
10,417 10,848
11,251 10,755
4.9x
6.0x
5.4x5.1x
4.7x
Total Assets / Total Shareholders' Equity
22.5%18.7% 19.6% 18.7%
20.7%
Total Assets
2009 2010 2011 2012 1H13
1,699 1,843 1,845 1,801
1,869
2009 2010 2011 2012 1H13
• Maintain the proportions of ABS and CP
under 20% and 10%, respectively
7
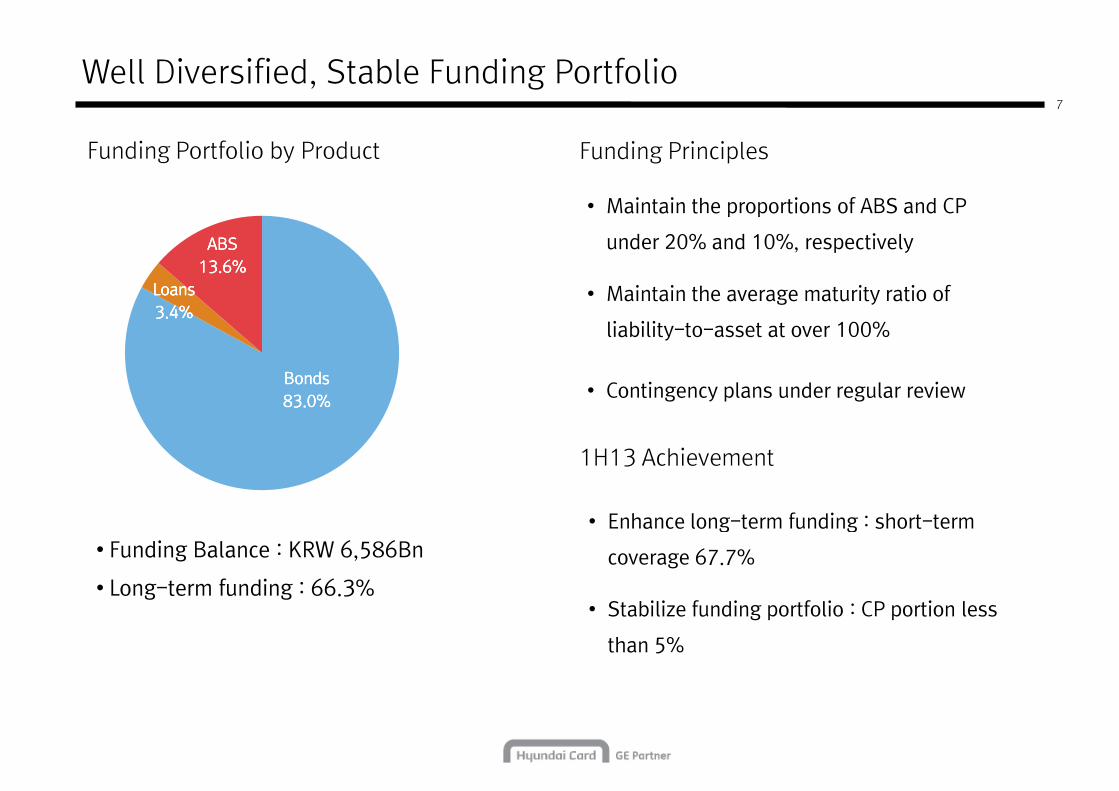
Well Diversified, Stable Funding Portfolio
Funding Portfolio by Product Funding Principles
ABS ABS ABS ABS 13.6%13.6%13.6%13.6%
• Maintain the average maturity ratio of
liability-to-asset at over 100%
• Contingency plans under regular review
1H13 Achievement
Bonds Bonds Bonds Bonds 83.0%83.0%83.0%83.0%
Loans Loans Loans Loans 3.4%3.4%3.4%3.4%
13.6%13.6%13.6%13.6%
• Enhance long-term funding : short-term • Funding Balance : KRW 6,586Bn
• Long-term funding : 66.3%
• Enhance long-term funding : short-term
coverage 67.7%
• Stabilize funding portfolio : CP portion less
than 5%
8
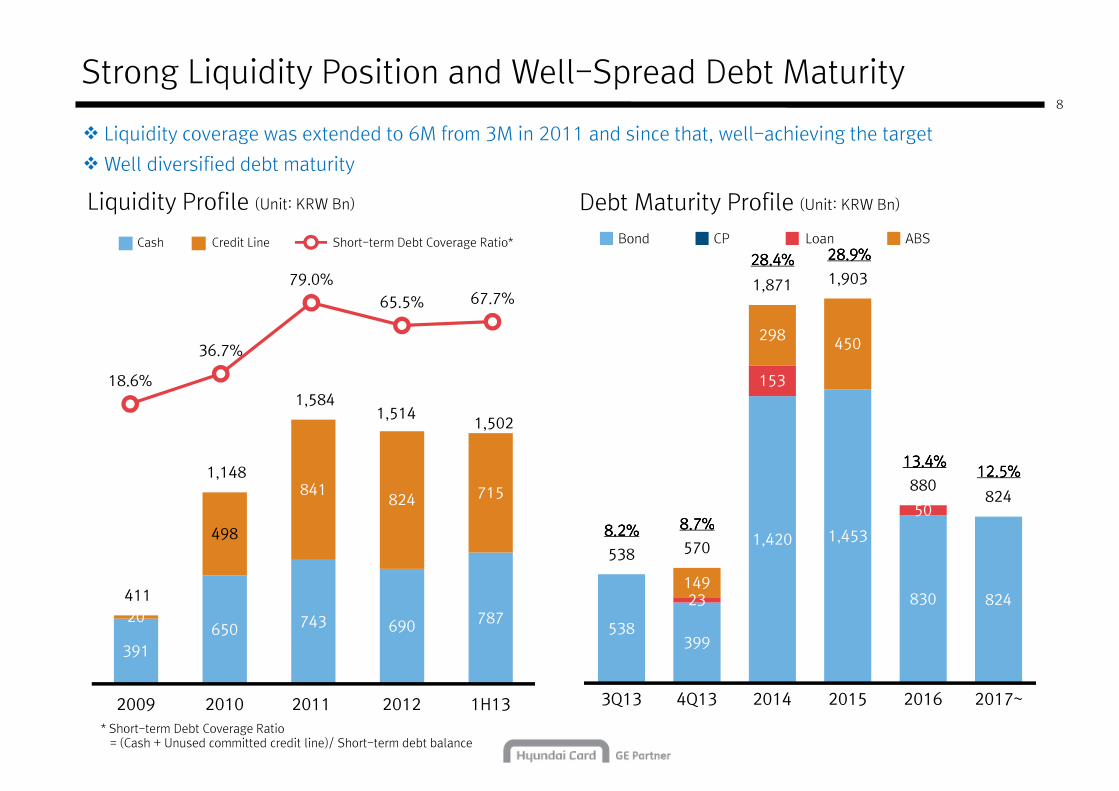
Strong Liquidity Position and Well-Spread Debt Maturity
Liquidity Profile (Unit: KRW Bn) Debt Maturity Profile (Unit: KRW Bn)
Credit LineCash Short-term Debt Coverage Ratio* CP LoanBond ABS
28.4%28.4%28.4%28.4% 28.9%28.9%28.9%28.9%
� Liquidity coverage was extended to 6M from 3M in 2011 and since that, well-achieving the target
� Well diversified debt maturity
498
841824 715
1,148
1,584 1,514
1,502
18.6%
36.7%
79.0%
65.5% 67.7%
153
50
298450
8.2%8.2%8.2%8.2% 8.7%8.7%8.7%8.7%
28.4%28.4%28.4%28.4%
13.4%13.4%13.4%13.4%12.5%12.5%12.5%12.5%
1,871 1,903
880824
* Short-term Debt Coverage Ratio= (Cash + Unused committed credit line)/ Short-term debt balance
391
650 743 690 787 20
498
411
2009 2010 2011 2012 1H13
538399
1,420 1,453
830 82423149
8.2%8.2%8.2%8.2% 8.7%8.7%8.7%8.7%
538 570
3Q13 4Q13 2014 2015 2016 2017~
Hyundai Card Hyundai Card Company OverviewHyundai Card Investor Presentation 1H13
I. Who is Hyundai Card?
9
The Premier Korean Credit Card Company
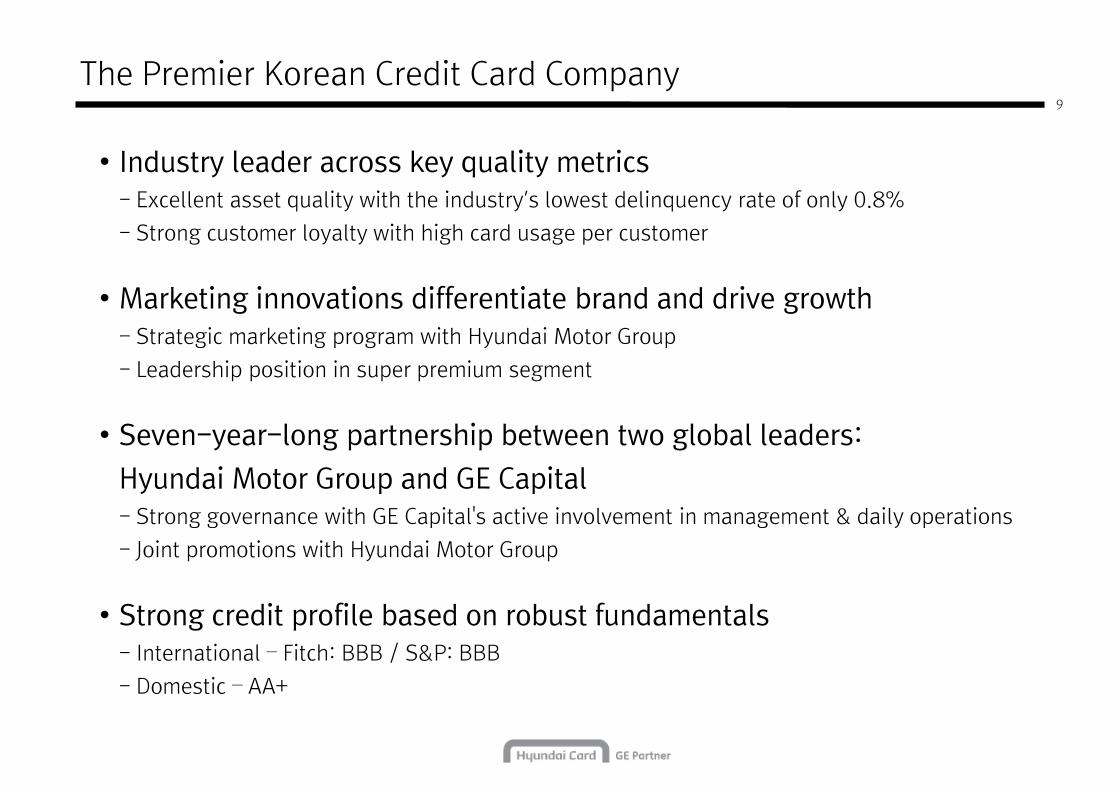
• Industry leader across key quality metrics- Excellent asset quality with the industry’s lowest delinquency rate of only 0.8%
- Strong customer loyalty with high card usage per customer
• Marketing innovations differentiate brand and drive growth- Strategic marketing program with Hyundai Motor Group
- Leadership position in super premium segment
• Seven-year-long partnership between two global leaders:
Hyundai Motor Group and GE Capital - Strong governance with GE Capital's active involvement in management & daily operations- Strong governance with GE Capital's active involvement in management & daily operations
- Joint promotions with Hyundai Motor Group
• Strong credit profile based on robust fundamentals- International – Fitch: BBB / S&P: BBB
- Domestic – AA+
- Innovative “Point Programs”
- Stable & solid operational base
- Extensive sales network
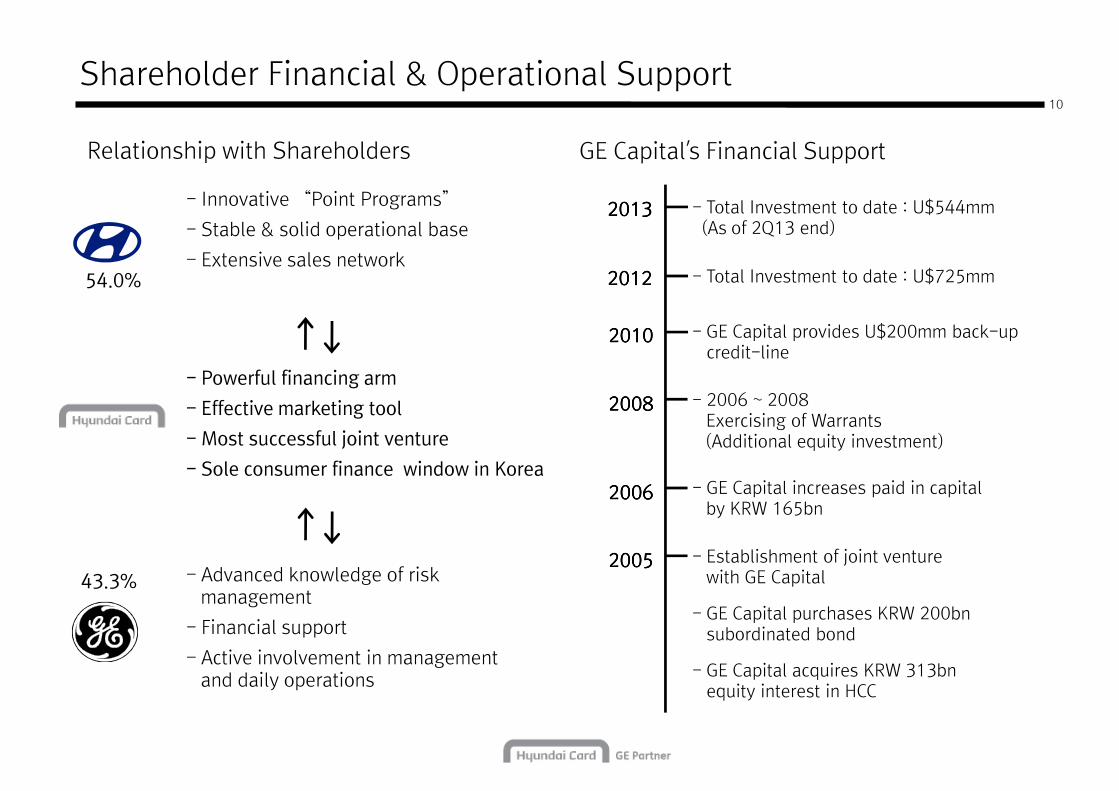
Shareholder Financial & Operational Support
Relationship with Shareholders GE Capital’s Financial Support
2013201320132013 - Total Investment to date : U$544mm(As of 2Q13 end)
10
- GE Capital increases paid in capital by KRW 165bn
- 2006 ~ 2008Exercising of Warrants(Additional equity investment)
- GE Capital provides U$200mm back-up credit-line
54.0%- Extensive sales network
- Powerful financing arm
- Effective marketing tool
- Most successful joint venture
- Sole consumer finance window in Korea
2010201020102010
2008200820082008
2006200620062006
2012201220122012 - Total Investment to date : U$725mm
- GE Capital acquires KRW 313bn equity interest in HCC
- Establishment of joint venturewith GE Capital43.3% - Advanced knowledge of risk
management
- Financial support
- Active involvement in management and daily operations
2005200520052005
- GE Capital purchases KRW 200bn subordinated bond
11
Management Strategy
• Continuous product and service innovation and profit improvement to
overcome regulatory changes and intensifying market competition
• Enhance customer value through spending stimulation and increasing
customer loyalty
• Achieve sustainable growth through prioritizing risk management and
a strong capital structure
12
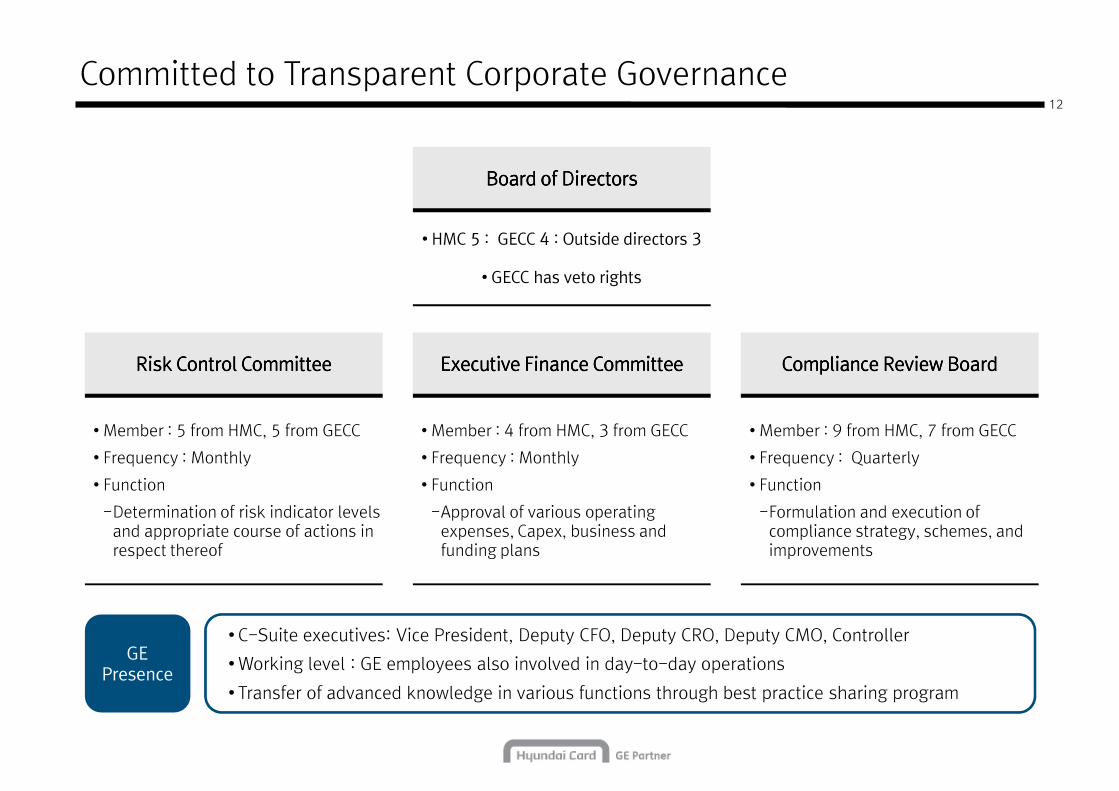
Committed to Transparent Corporate Governance
Board of DirectorsBoard of DirectorsBoard of DirectorsBoard of Directors
• HMC 5 : GECC 4 : Outside directors 3
• GECC has veto rights
Risk Control CommitteeRisk Control CommitteeRisk Control CommitteeRisk Control Committee
• Member : 5 from HMC, 5 from GECC
• Frequency : Monthly
• Function
-Determination of risk indicator levels and appropriate course of actions in
Executive Finance CommitteeExecutive Finance CommitteeExecutive Finance CommitteeExecutive Finance Committee
• Member : 4 from HMC, 3 from GECC
• Frequency : Monthly
• Function
-Approval of various operating expenses, Capex, business and
Compliance Review BoardCompliance Review BoardCompliance Review BoardCompliance Review Board
• Member : 9 from HMC, 7 from GECC
• Frequency : Quarterly
• Function
-Formulation and execution of compliance strategy, schemes, and and appropriate course of actions in
respect thereofexpenses, Capex, business and funding plans
compliance strategy, schemes, and improvements
• C-Suite executives: Vice President, Deputy CFO, Deputy CRO, Deputy CMO, Controller
• Working level : GE employees also involved in day-to-day operations
• Transfer of advanced knowledge in various functions through best practice sharing program
GEPresence
13
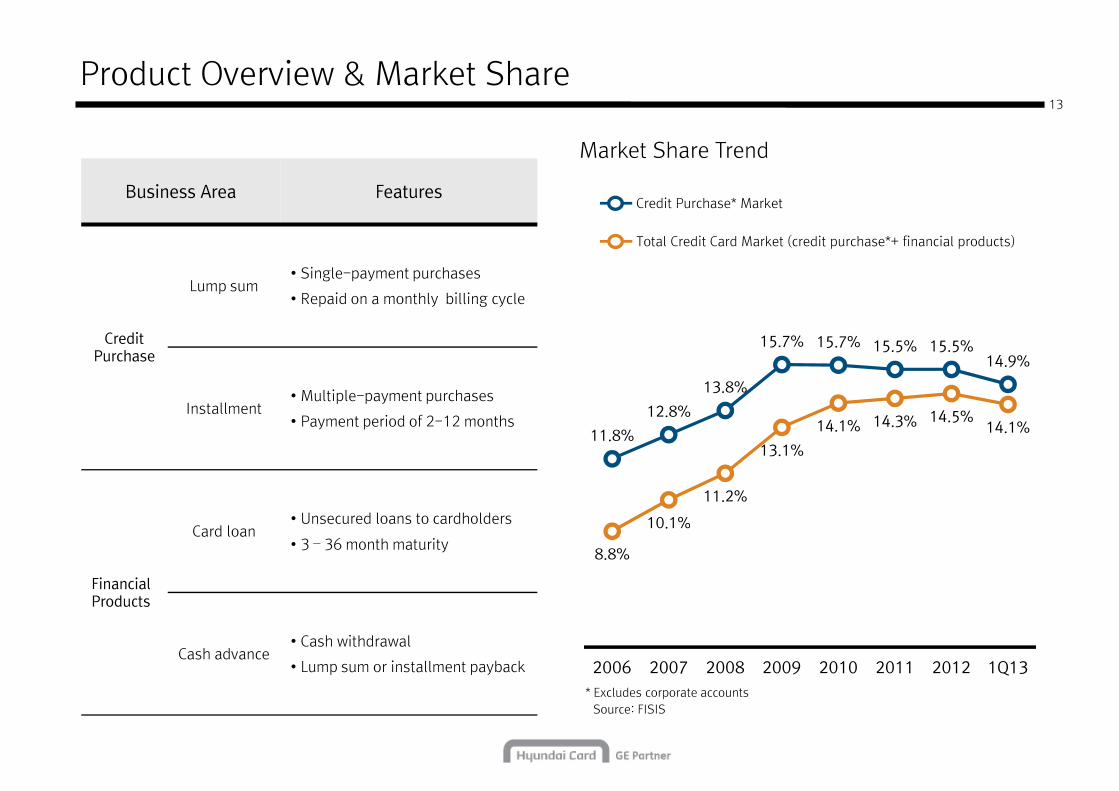
Business Area Features
Product Overview & Market Share
Market Share Trend
Total Credit Card Market (credit purchase*+ financial products)
Credit Purchase* Market
Credit Purchase
Lump sum• Single-payment purchases
• Repaid on a monthly billing cycle
Installment• Multiple-payment purchases
• Payment period of 2-12 months
Card loan• Unsecured loans to cardholders
11.8%
12.8%
13.8%
15.7% 15.7% 15.5% 15.5%14.9%
10.1%
11.2%
13.1%
14.1% 14.3% 14.5%14.1%
Financial Products
Card loan• 3 – 36 month maturity
Cash advance• Cash withdrawal
• Lump sum or installment payback
* Excludes corporate accountsSource: FISIS
8.8%
10.1%
2006 2007 2008 2009 2010 2011 2012 1Q13
II. Premium Brand & Marketing
14
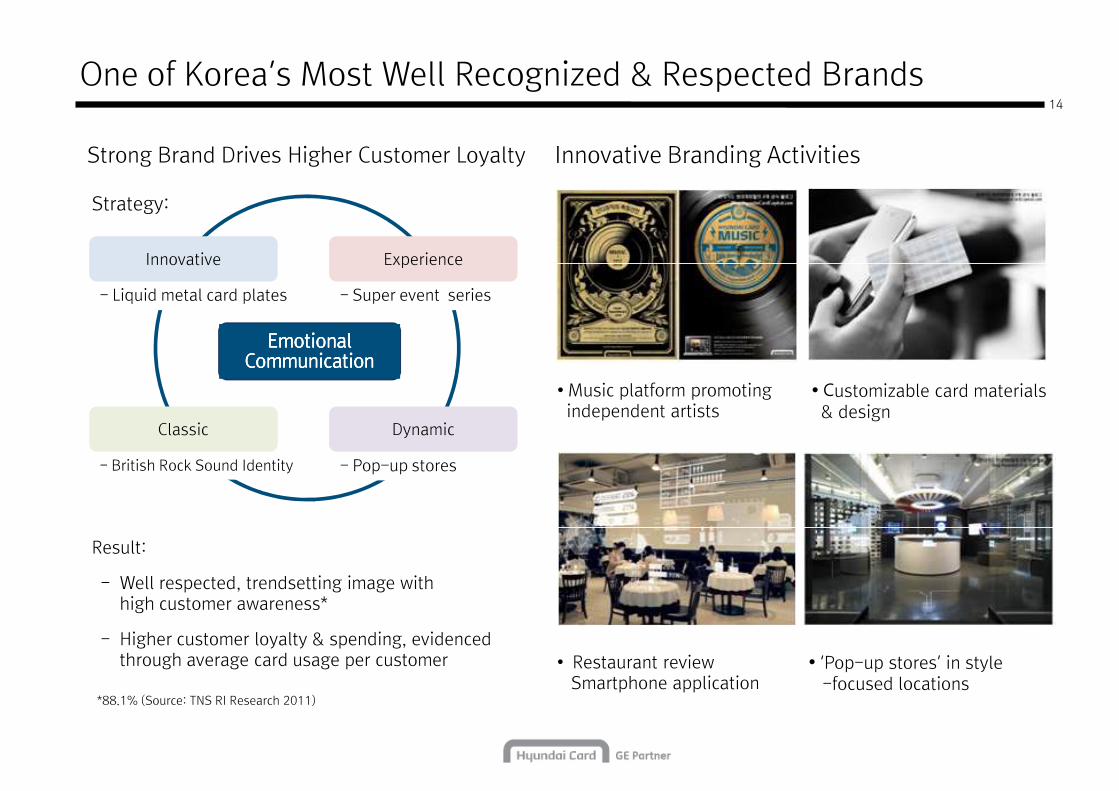
One of Korea’s Most Well Recognized & Respected Brands
Strong Brand Drives Higher Customer Loyalty Innovative Branding Activities
Strategy:
Innovative Experience
- Liquid metal card plates
- British Rock Sound Identity - Pop-up stores
- Super event series
Emotional Emotional Emotional Emotional CommunicationCommunicationCommunicationCommunication
• Customizable card materials & design
• Music platform promoting independent artists
Innovative Experience
Classic Dynamic
*88.1% (Source: TNS RI Research 2011)
• Restaurant review Smartphone application
• ‘Pop-up stores’ in style-focused locations
Result:
- Well respected, trendsetting image with high customer awareness*
- Higher customer loyalty & spending, evidenced through average card usage per customer
15
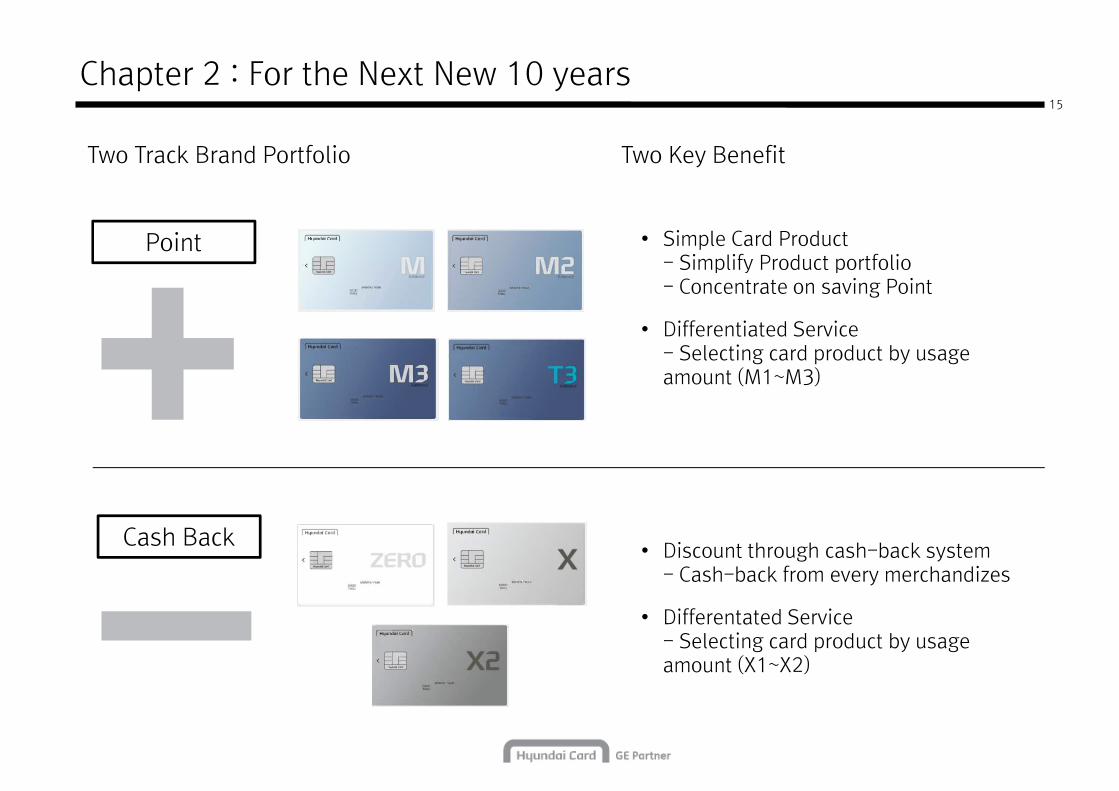
Chapter 2 : For the Next New 10 years
Two Track Brand Portfolio Two Key Benefit
Point • Simple Card Product- Simplify Product portfolio
Cash Back
- Simplify Product portfolio- Concentrate on saving Point
• Differentiated Service - Selecting card product by usage amount (M1~M3)
Cash Back• Discount through cash-back system
- Cash-back from every merchandizes
• Differentated Service- Selecting card product by usage amount (X1~X2)

III. Macro & Industry Environment
16
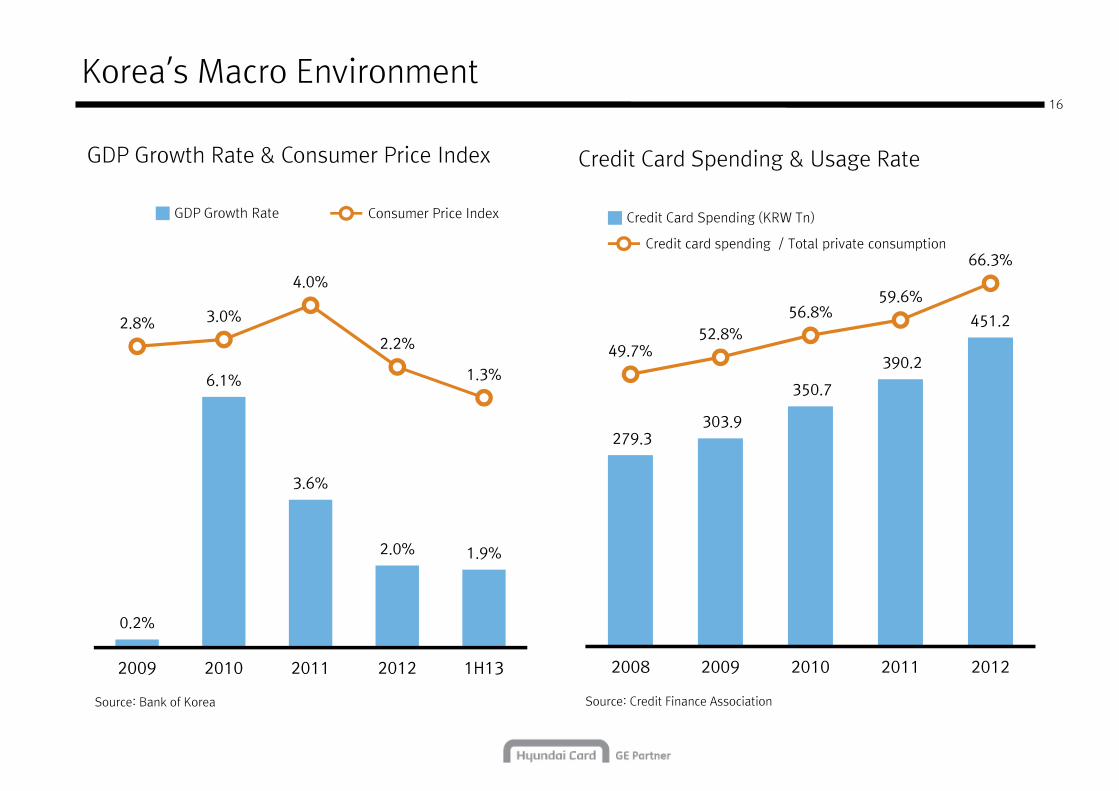
Korea’s Macro Environment
GDP Growth Rate & Consumer Price Index
GDP Growth Rate Consumer Price Index
Credit Card Spending & Usage Rate
Credit Card Spending (KRW Tn)
Credit card spending / Total private consumption66.3%
279.3 303.9
350.7
390.2
451.2
49.7%52.8%
56.8%59.6%
66.3%
6.1%
3.6%
2.8% 3.0%
4.0%
2.2%
1.3%
Source: Bank of Korea Source: Credit Finance Association
2008 2009 2010 2011 2012
0.2%
2.0% 1.9%
2009 2010 2011 2012 1H13
Korean Credit Card Market Features17
• Conservative lending environment - Low usage of revolving credit card products, as full payment of monthly balance
preferredpreferred
• Strong credit infrastructure - Well developed credit bureau system provides a quantitative customer credit score
based on all previous credit history
• Cash-less society - Ubiquitous acceptance of credit cards, high popularity of online shopping, and tax
incentives for credit card use
• Strict government oversight- Regulations governing new origination practices and customer cash advance limits
18
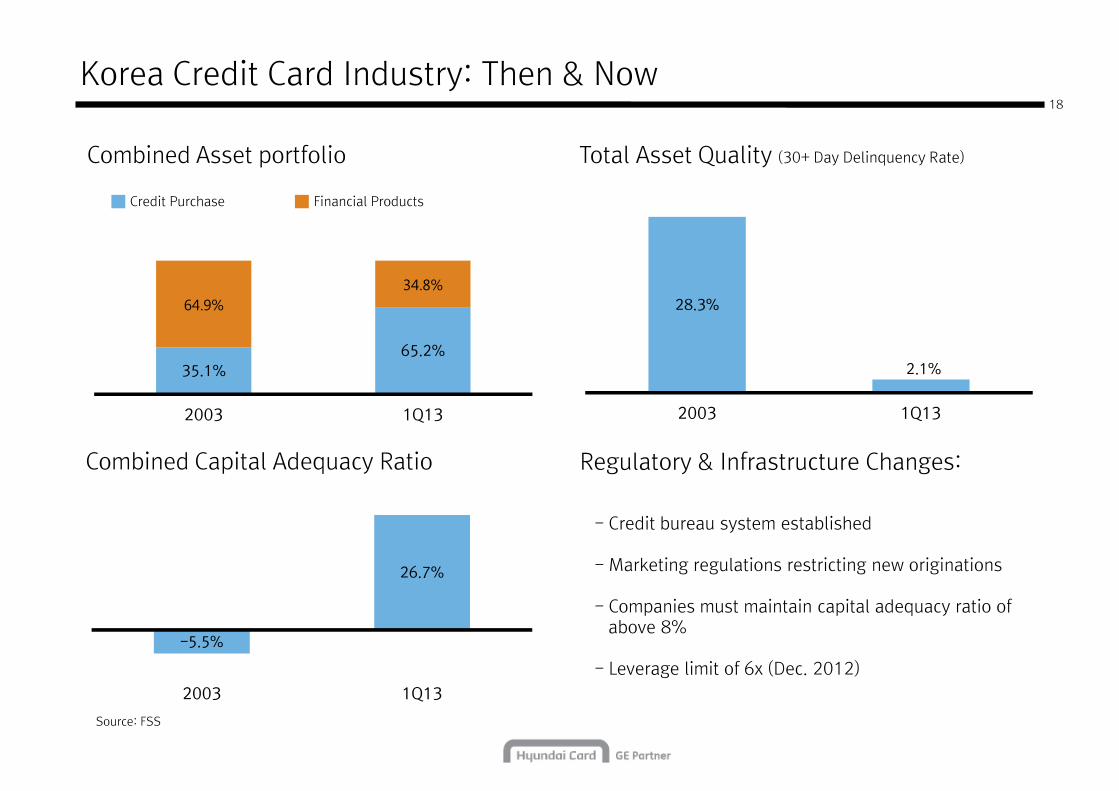
Korea Credit Card Industry: Then & Now
Combined Asset portfolio Total Asset Quality (30+ Day Delinquency Rate)
Credit Purchase Financial Products
Combined Capital Adequacy Ratio Regulatory & Infrastructure Changes:
- Credit bureau system established
35.1%65.2%
64.9%34.8%
2003 1Q13
28.3%
2.1%
2003 1Q13
Source: FSS
- Credit bureau system established
- Marketing regulations restricting new originations
- Companies must maintain capital adequacy ratio of above 8%
- Leverage limit of 6x (Dec. 2012)
-5.5%
26.7%
2003 1Q13
IV. Asset Portfolio & Performance
19
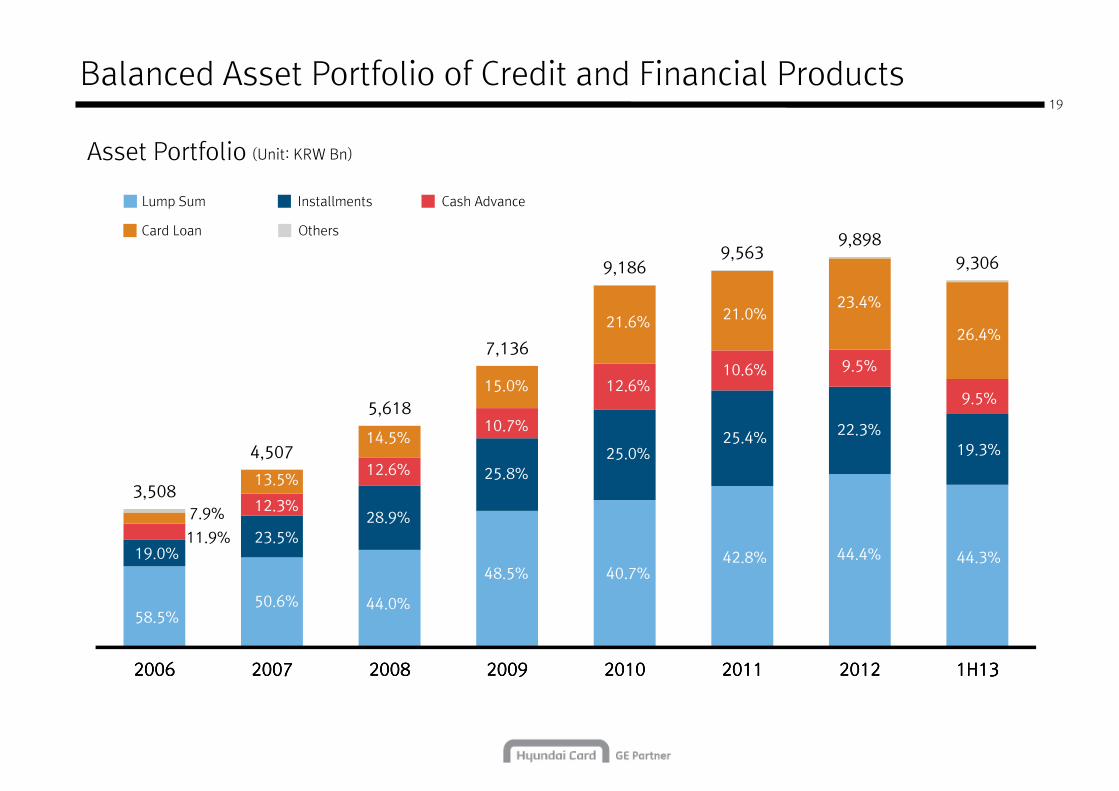
Balanced Asset Portfolio of Credit and Financial Products
Asset Portfolio (Unit: KRW Bn)
Lump Sum Installments Cash Advance
Card Loan Others
9,1869,563
9,898
9,306
3,508
4,507
5,618
7,136
9,186 9,306
28.9%
12.6%
14.5%
25.8%
10.7%
15.0%
25.0%
12.6%
21.6%
25.4%
10.6%
21.0%
12.3%
13.5%
7.9%
22.3%
9.5%
23.4%
19.3%
9.5%
26.4%
2006200620062006 2007200720072007 2008200820082008 2009200920092009 2010201020102010 2011201120112011 2012201220122012 1H131H131H131H13
44.0%
48.5% 40.7%42.8%
50.6%
23.5%
58.5%
19.0%11.9%
44.4% 44.3%
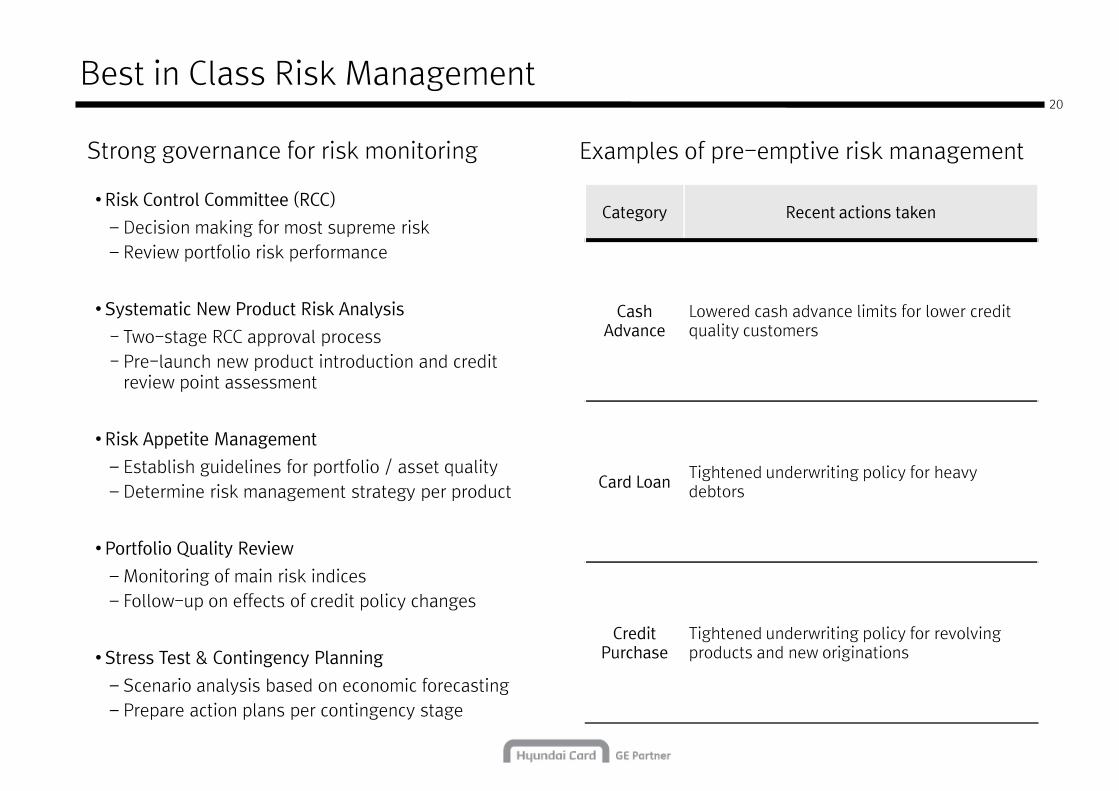
Best in Class Risk Management
Strong governance for risk monitoring Examples of pre-emptive risk management
Category Recent actions taken• Risk Control Committee (RCC)
– Decision making for most supreme risk– Review portfolio risk performance
20
Cash Advance
Lowered cash advance limits for lower credit quality customers
Card LoanTightened underwriting policy for heavy debtors
• Systematic New Product Risk Analysis
- Two-stage RCC approval process - Pre-launch new product introduction and credit
review point assessment
• Risk Appetite Management
– Establish guidelines for portfolio / asset quality – Determine risk management strategy per product
Credit Purchase
Tightened underwriting policy for revolving products and new originations
• Portfolio Quality Review
– Monitoring of main risk indices– Follow-up on effects of credit policy changes
• Stress Test & Contingency Planning
– Scenario analysis based on economic forecasting– Prepare action plans per contingency stage
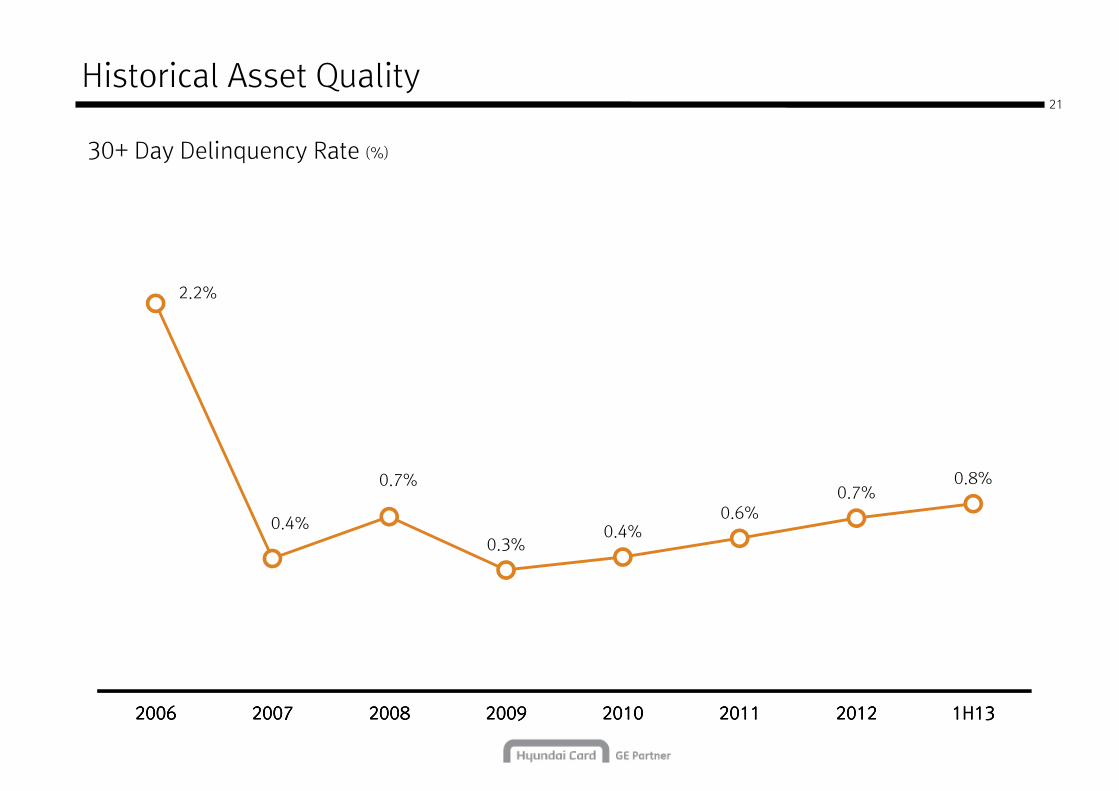
Historical Asset Quality
30+ Day Delinquency Rate (%)
21
2.2%
0.4%
0.7%
0.4%0.6%
0.7%0.8%
0.4%0.3%
0.4%
2006200620062006 2007200720072007 2008200820082008 2009200920092009 2010201020102010 2011201120112011 2012201220122012 1H131H131H131H13
22
Historical Reserve & FSS Requirement Coverage Ratio
Total Reserve VS Regulatory Requirement (KRW Bn)
Regulatory Requirement Reserve under Accounting Principles Supplemental Reserve Total Reserve/ Regulatory Requirement
178.1%200.4% 199.1%
204
363 366
178.1%
143.3%123.9% 127.7%
157.1% 155.2%
378
544 551
K-GAAP K-IFRS
89 52
94 114 148 190
346 355
158 104 135
142 189 174 181 185
2009200920092009 2010201020102010 2011201120112011 201220122012201220082008200820082006200620062006 2007200720072007 1H131H131H131H13
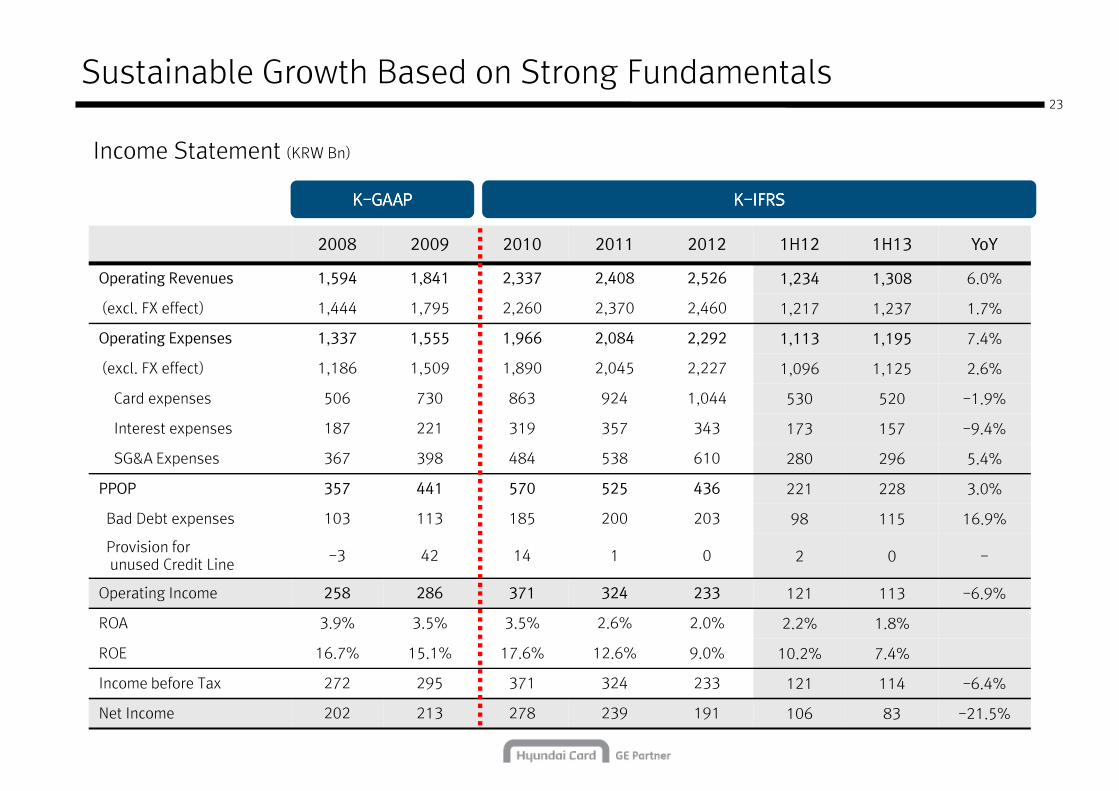
Sustainable Growth Based on Strong Fundamentals
2008 2009 2010 2011 2012 1H12 1H13 YoY
Income Statement (KRW Bn)
23
KKKK----IFRSIFRSIFRSIFRSKKKK----GAAPGAAPGAAPGAAP
Operating Revenues 1,594 1,841 2,337 2,408 2,526 1,234 1,308 6.0%
(excl. FX effect) 1,444 1,795 2,260 2,370 2,460 1,217 1,237 1.7%
Operating Expenses 1,337 1,555 1,966 2,084 2,292 1,113 1,195 7.4%
(excl. FX effect) 1,186 1,509 1,890 2,045 2,227 1,096 1,125 2.6%
Card expenses 506 730 863 924 1,044 530 520 -1.9%
Interest expenses 187 221 319 357 343 173 157 -9.4%
SG&A Expenses 367 398 484 538 610 280 296 5.4%
PPOP 357 441 570 525 436 221 228 3.0%
Bad Debt expenses 103 113 185 200 203 98 115 16.9%
Provision for unused Credit Line
-3 42 14 1 0 2 0 -
Operating Income 258 286 371 324 233 121 113 -6.9%
ROA 3.9% 3.5% 3.5% 2.6% 2.0% 2.2% 1.8%
ROE 16.7% 15.1% 17.6% 12.6% 9.0% 10.2% 7.4%
Income before Tax 272 295 371 324 233 121 114 -6.4%
Net Income 202 213 278 239 191 106 83 -21.5%
V. Capitalization, Funding & Liquidity
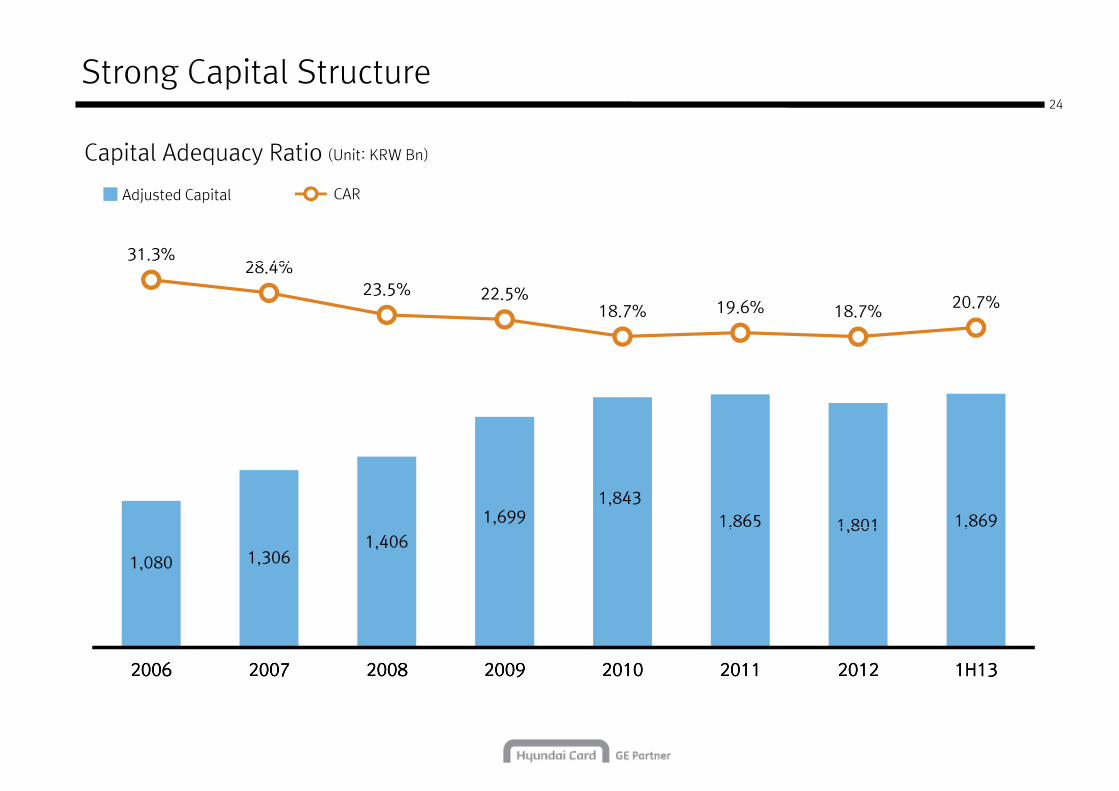
Capital Adequacy Ratio (Unit: KRW Bn)
24
Strong Capital Structure
Adjusted Capital CAR
31.3%28.4%
1,699 1,843
1,865 1,801 1,869
28.4%23.5% 22.5%
18.7% 19.6% 18.7% 20.7%
1,080 1,306 1,406
1,865 1,801 1,869
2006200620062006 2007200720072007 2008200820082008 2009200920092009 2010201020102010 2011201120112011 2012201220122012 1H131H131H131H13
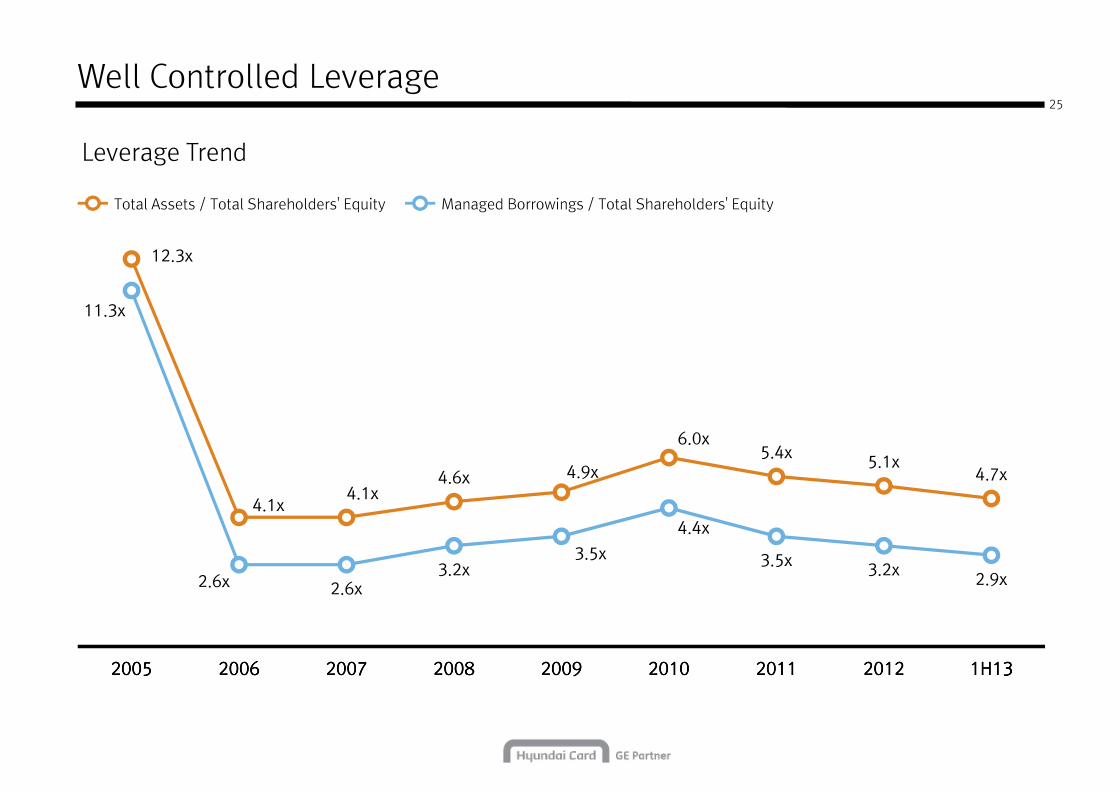
Well Controlled Leverage
Leverage Trend
Total Assets / Total Shareholders' Equity Managed Borrowings / Total Shareholders' Equity
25
12.3x12.3x
4.1x4.1x
4.6x 4.9x
6.0x5.4x
5.1x4.7x
11.3x
4.4x
2.6x 2.6x3.2x
3.5x
4.4x
3.5x3.2x
2.9x
2005200520052005 2006200620062006 2007200720072007 2008200820082008 2009200920092009 2010201020102010 2011201120112011 2012201220122012 1H131H131H131H13
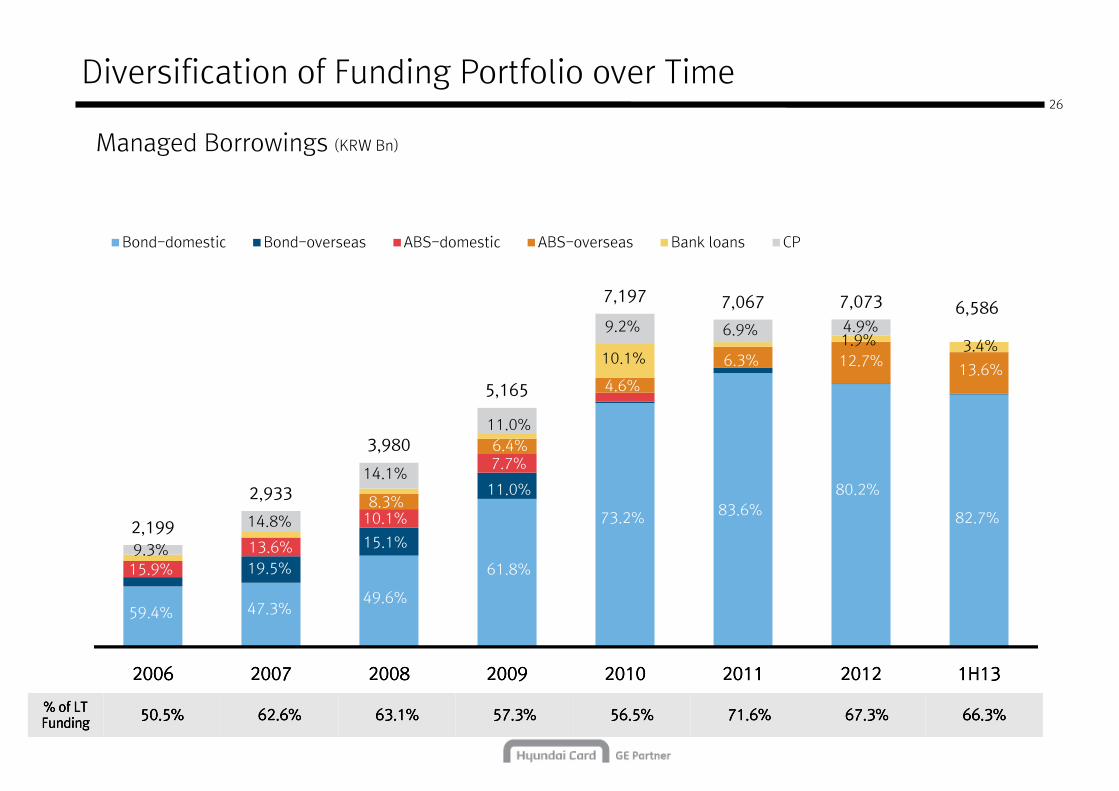
Diversification of Funding Portfolio over Time
Managed Borrowings (KRW Bn)
26
Bond-domestic Bond-overseas ABS-domestic ABS-overseas Bank loans CP
2,199
2,933
3,980
5,165
7,197 7,067 7,073 6,586
80.2%
12.7%1.9%
14.8% 10.1%
14.1%
8.3%
7.7%
11.0%6.4%
11.0%
73.2%
4.6%
9.2%
10.1%
83.6%
6.9%
6.3%
4.9%
82.7%
13.6%
3.4%
%%%% of LT of LT of LT of LT FundingFundingFundingFunding 50.5%50.5%50.5%50.5% 62.6%62.6%62.6%62.6% 63.1%63.1%63.1%63.1% 57.3%57.3%57.3%57.3% 56.5%56.5%56.5%56.5% 71.6%71.6%71.6%71.6% 67.3%67.3%67.3%67.3% 66.3%66.3%66.3%66.3%
2,199
2006200620062006 2007200720072007 2008200820082008 2009200920092009 2010201020102010 2011201120112011 2012201220122012 1H131H131H131H13
59.4%
15.9%9.3%
47.3%
19.5%
14.8%
13.6%
49.6%
15.1%
61.8%
27
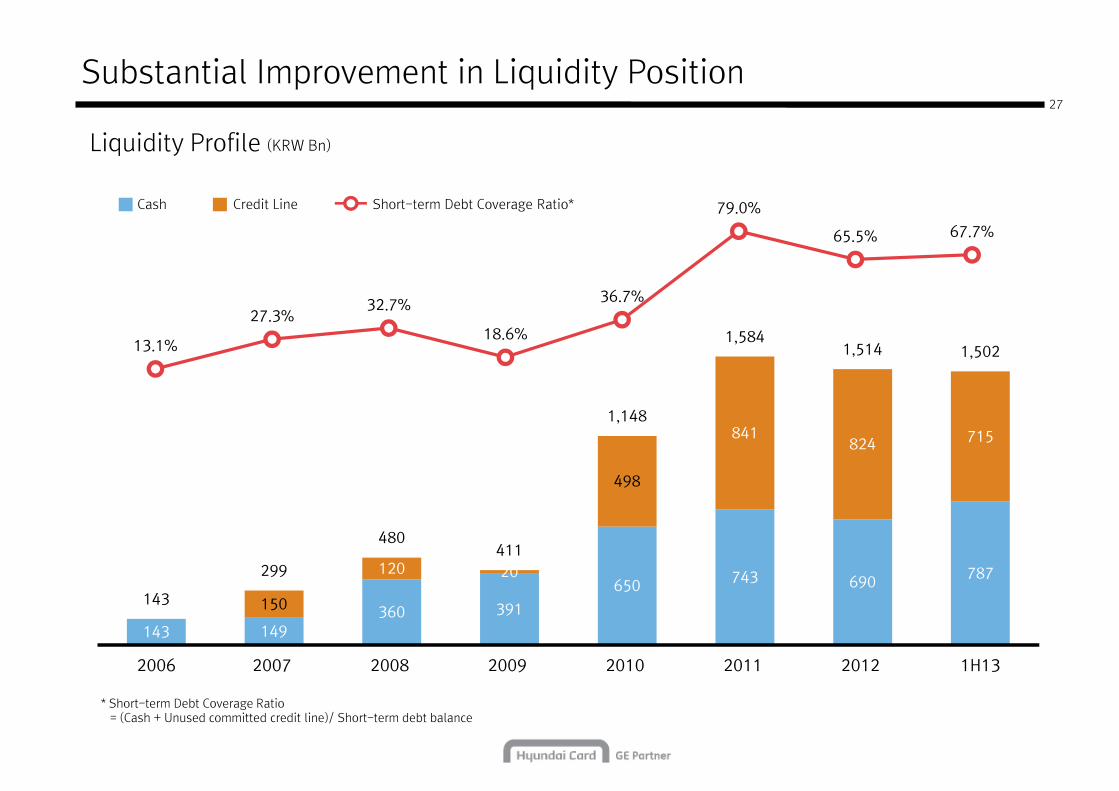
Substantial Improvement in Liquidity Position
Liquidity Profile (KRW Bn)
Credit LineCash Short-term Debt Coverage Ratio* 79.0%
65.5% 67.7%
498
841824 715
1,148
1,5841,514 1,50213.1%
27.3%32.7%
18.6%
36.7%
* Short-term Debt Coverage Ratio= (Cash + Unused committed credit line)/ Short-term debt balance
143 149360 391
650 743 690787
150
120 20
143
299
480411
2006 2007 2008 2009 2010 2011 2012 1H13
Investor Relations Contacts
Jungsang Kim, Head of Investor RelationsPhone +82 2 2167 [email protected]
Minchul Seo, Deputy General Manager of Investor RelationsPhone +82 2 2167 [email protected]
Suh ye Choi, Manager of Investor RelationsPhone +82 2 2167 7541
Justin Lee, Manager of Investor RelationsPhone +82 2 2167 8082
http://ir.hyundaicard.com/
Phone +82 2 2167 [email protected]
Phone +82 2 2167 [email protected]
Jay Moon, Assistant Manager of Investor RelationsPhone +82 2 2167 [email protected]
Hyunyoung Jang, Assistant Manager of Investor RelationsPhone +82 2 2167 [email protected]