1 homing behaviour of atlantic salmon (salmo - core · 1 1 homing behaviour of atlantic salmon...
TRANSCRIPT

1
Homing behaviour of Atlantic salmon (Salmo 1
salar) during final phase of marine migration 2
and river entry 3
4
Jan Grimsrud Davidsen Audun Haringvard Rikardsen Eva Bonsak Thorstad Elina 5
Halttunen Hiromichi Mitamura Kim Praeligbel Jofrid Skarethhamar and Tor Fredrik 6
Naeligsje 7
8
JG Davidsen (jandavidsenntnuno) AH Rikardsen (audunrikardsenuitno) 9
EB Thorstad (evathorstaduitno) E Halttunen (elinahalttunenuitno) and K 10
Praeligbel (kimpraebeluitno) Faculty of Biosciences Fisheries and Economics 11
University of Tromsoslash N-9037 Tromsoslash Norway 12
13
JG Davidsen (jandavidsenntnuno) Museum of Natural History and Archaeology 14
Norwegian University of Science and Technology (NTNU) N-7491 Trondheim 15
Norway 16
17
EB Thorstad (evathorstadninano) and TF Naeligsje (tornaesjeninano) 18
Norwegian Institute for Nature Research N-7485 Trondheim Norway 19
20
H Mitamura (mitamurabresocikyoto-uacjp) Graduate School of Informatics 21
Kyoto University Kyoto 606-8501 Japan 22
23
2
J Skarethhamar (jofridskardhamarimrno) Institute of Marine Research N-9294 24
Tromsoslash Norway 25
26
Present address Centre for Ecological and Evolutionary Synthesis (CEES) 27
Department of Biology University of Oslo PO Box 1066 Blindern N-0315 Oslo 28
Norway 29
30
Corresponding author Jan Grimsrud Davidsen Museum of Natural History and 31
Archaeology Norwegian University of Science and Technology N-7491 Trondheim 32
Norway Tel +47 924 64314 email jandavidsenntnuno 33
34
3
Homing behaviour of Atlantic salmon (Salmo 35
salar) during final phase of marine migration 36
and river entry 37
38
Abstract Little is known about Atlantic salmon behaviour during the last phase of 39
the marine homing migration and subsequent river entry In this study 56 adult 40
Atlantic salmon in the Alta Fjord in northern Norway were equipped with acoustic 41
transmitters Salmon generally followed the coastline but their horizontal distribution 42
was also affected by wind induced spreading of river water across the fjord Mean 43
swimming depth was shallow (25ndash05 m) but with dives down to 30 m depth 44
Timing of river entry was not affected by river flow diel periodicity or tidal cycles 45
Movements during the last part of the marine migration and river entry were 46
unidirectional and relatively fast (mean 97 km day-1) However migratory speed 47
slowed as salmon approached the estuary with a significant lower speed in the 48
innermost part of the estuary than in the open fjord Migration behaviour seemed not 49
affected by handling and tagging as there were no behavioural differences between 50
newly tagged fish and those captured and tagged one year before their homing 51
migration 52
53
54
Keywords genetic assignment migratory behaviour returning salmon Salmo salar 55
L swimming depth vertical and horizontal distribution56
4
INTRODUCTION 57
Atlantic salmon (Salmo salar L) is a species of great biological cultural and 58
economic importance Abundance marine survival and in some cases growth have 59
declined in large parts of the species distribution range for unknown reasons (Parrish 60
et al 1998 ICES 2011) The anadromous life cycle involves long and complex 61
migrations through different habitats Knowledge on migration timing and patterns 62
and how these are affected by environmental factors is crucial to identify critical life 63
stages and anthropogenic impacts and to be able to implement effective mitigation 64
measures 65
Few studies have focused on the marine migration behaviour mainly due to 66
methodological constraints Radio telemetry has been used to track individual Atlantic 67
salmon in freshwater (Heggberget et al 1993 Karppinen et al 2004) resulting in 68
substantial knowledge on within-river migration of adults returning for spawning 69
(Thorstad et al 2008) Due to the high electrolyte level radio telemetry cannot be 70
used in seawater Recent improvements of acoustic telemetry methods have opened 71
new opportunities to follow individual fish in near coastal areas (Lacroix and Voegeli 72
2000 Cooke et al 2011) This has resulted in a number of studies of marine post-73
smolt migration towards feeding areas in the ocean (Thorstad et al 2012) but studies 74
of adults during their return migration are still few 75
There appears to be two phases of the marine migration from the ocean to the 76
natal river an initial phase with navigation from feeding areas towards the coast and 77
a second phase with more precise orientation in coastal waters (Hansen et al 1993) 78
This second phase is of special concern since near shore areas are often densely 79
populated and heavily affected by human activities such as boat traffic harbour and 80
industry infrastructure aquaculture pollution and fishing which may affect migration 81
5
patterns (Pierce et al 1990 Smith 1990 Alabaster et al 1991) Near-coastal areas 82
may also be complex habitats forming transition zones between rivers and the ocean 83
being subjects to both marine (tides waves saline water) and riverine influences 84
(freshwater and sediments) To collect basic information about the generally preferred 85
migration pattern the ideal situation is to study the migration in a natural environment 86
with minimal anthropogenic factors possibly influencing the migratory behaviour and 87
progression Such information is required when evaluating the movements in 88
declining populations from areas heavily influenced by for instance obstacles altered 89
water quality and global warming Northern areas like the Alta Fjord where this study 90
was performed are relatively pristine with a sparse human population and little 91
industrial development and other constructions Information about fish migration in 92
these areas may therefore be important in understanding the basic migratory behavior 93
A large number of studies have examined the effects of environmental factors 94
upon the timing of river entry on adult Atlantic salmon based on data from riverine 95
counting fences (eg Dahl et al 2004 Jonsson et al 2007) One challenge associated 96
with detecting relationships between environmental variables and the upstream 97
migration using such methods is the lack of information on how many fish are present 98
downstream of the counting site (Treacutepanier et al 1996) An increase in upstream 99
counts may not necessarily mean that conditions are improved but could reflect 100
increased fish abundance for other reasons (Thorstad et al 2008) or increased 101
detection probability On the contrary environmental conditions may be favourable 102
for upstream migration but count data may show little migration activity if there are 103
no fish available in the area Moreover fish counters are usually placed in fishways 104
traps or dams and the environmental factors important to stimulate salmon to pass 105
such sites may be site specific and different from natural river sections with other or 106
6
no migration barriers (Banks 1969 Thorstad et al 2008) Tagging fish with acoustic 107
transmitters enables us to follow their behaviour both before and during river entry to 108
analyse the impacts of environmental factors on river entry in natural rivers without 109
fishways or other obstacles 110
The aim of this study was to analyse Atlantic salmon migration pattern during 111
the last part of the spawning migration through a pristine coastal area and during river 112
entry using acoustic telemetry methods We tested the following hypotheses 1) The 113
horizontal distribution of Atlantic salmon is closer to the coastline as the fish 114
approach the river mouth since river water may be used as a guide for orientating to 115
the river 2) Swimming depths are closer to the surface as salmon approach the 116
estuary which may happen if olfactory clues from the river in the upper part of the 117
water column facilitate location and recognition the river (Quinn 1990) 3) River entry 118
is stimulated by increased water discharge in the river and occurs mainly during the 119
night and ebb tide according to previous studies based on fish counts (Jonsson 1991 120
Potter et al 1992 Smith and Smith 1997 Jonsson et al 2007) 4) Marine migration 121
speeds decline towards the river mouth which may happen if the fish need time to 122
ensure recognition of the home river and adapt to freshwater (Hansen and Quinn 123
1998) 5) Marine migration speeds increase with increasing river discharge which 124
may happen if increased freshwater supply to the fjord ease river recognition 125
(Thorstad et al 2010) 6) Migration is not affected by recent capture handling and 126
tagging as suggested by Thorstad et al (2000) which may be tested by use of long 127
lifespan telemetry tags enabling the comparison of the return migration between 128
newly captured and tagged fish and fish tagged a year before the homing migration 129
130
131
7
MATERIAL AND METHODS 132
STUDY AREA 133
The Alta Fjord northern Norway (70degN 23degE) is a large open fjord which is 134
15 km at its widest and 488 m at its deepest (Fig 1) The fjord opens through three 135
channels into the Barents Sea The tidal range is 15ndash25 m The River Alta with a 136
catchment area of 7 400 km2 is the major river draining into the fjord The estuary in 137
this study was defined as the first 2 km of the fjord measured from the river mouth 138
(zone 3 and 4) The mean annual water discharge of the river is 75 m3 sminus1 with a 139
spring flood that is occasionally higher than 1000 m3 sminus1 The river length accessible 140
to Atlantic salmon is 47 km and a hydropower plant was constructed above this 141
stretch in 1987 River Alta is one of the northernmost Atlantic salmon rivers in the 142
world with annual in-river catches between 6 and 32 tonnes during 1974ndash2007 143
(Ugedal et al 2008) Adult salmon return to the river during MayndashAugust and the 144
river temperature varies from 3ndash15deg C during this period A small town with 12 000 145
inhabitants is situated at the mouth of the river 146
147
RECORDING OF SALMON BY AUTOMATIC LISTENING STATIONS AND 148
MANUAL TRACKING 149
In 2007 a total of five arrays with automatic listening stations (ALS) (Vemco 150
Inc Canada model VR2) were deployed in the fjord Three arrays were deployed 31 151
km (array 1 21 ALSs) 17 km (array 2 14 ALSs) and 4 km (array 3 11 ALSs) 152
from the river mouth in lines across the fjord with 400 m separating each ALS (Fig 153
1) The ALSs were deployed 5 m below the surface The arrays were divided into 154
eastern side (three ALSs from east) central part and western side (three ALSs from 155
west) Further ten ALSs were deployed at 3 m depth in two arrays in the river outlet 156
8
28 km (array 4 800 m between each ALS) and 2 km (array 5 400 m between each 157
ALS) from the river mouth In addition two ALSs were deployed 2 m below the 158
surface in the river mouth (array 6) and three ALSs 5 km upstream in the river (array 159
7) In 2008 similar arrays were deployed 31 km (array 1) 4 km (array 3) and 2 160
km (array 5) from the river mouth as well as two ALSs in the river mouth (array 161
6) The sea depth exceeded 30 m at all arrays in the fjord When tagged salmon came 162
within the range of 100ndash600 m from an ALS the individual id code depth (for 30 of 163
the tags) and the time were recorded by the ALS (detection range depended on 164
environmental conditions such as currents waves and haloclines) In array 1ndash5 and 165
river mouth (array 6) the first registration of each salmon was used as the time of 166
arrival The last registration of each individual registered in the river mouth was used 167
as the time of river entry To confirm that salmon registered in the river mouth 168
actually entered the river manual tracking in the river was performed from a boat 169
during JulyndashOctober using a VR100 receiver (Vemco Inc Canada) 170
171
RECORDING OF ENVIRONMENTAL VARIABLES 172
Water temperature salinity tidal cycle light intensity water current and wind 173
speed and direction were recorded in the fjord Water temperature and discharge were 174
recorded in the river Salinity and temperature profiles were recorded at every second 175
ALS across array 1ndash3 down to 12 m depth on 6 and 13 July 2007 at low tide using 176
an SD204 conductivity temperature and depth (CTD) sonde (SAIV AS Norway) 177
SD6000 water current meters (Sensordata AS Norway) were placed three meters 178
below the surface at the south-western and north-eastern side of array 3 (Fig 1) 179
recording the direction and speed of the water current every 30 min The CTD- and 180
current meter datasets were analysed gridded and plotted using Matlab704365 181
9
(R14) The tidal range was measured every 10 min with a depth sensing data storage 182
tag (Star-Oddi Iceland model DST-milli-L) placed at the fjord bottom 1 km from the 183
river mouth Light intensities and wind direction were recorded every 15 min with a 184
light meter and an anemometer with a data logger (Onset Computer Corporation 185
USA model HOBO UA-002-64) placed on a small island in the inner part of the fjord 186
(Fig 1) 187
188
FISH CAPTURE AND TAGGING PROCEDURE 189
Eighty-two Atlantic salmon were trapped in 13 different bag nets (Fig 1) in 190
the Alta Fjord during 3ndash25 July 2007 This is a gentle capture method as the salmon 191
swim freely inside the bag net (Thorstad et al 1998) Scale analysis (Lund and 192
Hansen 1991 Fiske et al 2005) confirmed that 74 of the salmon were wild fish and 193
only these were used in this study Based on external sex characteristics these were 194
37 females (mean fork length (LF) = 93 cm range 80ndash109 cm SD = 6 mean mass = 195
96 kg range 65ndash142 kg SD = 19) 22 males (LF = 95 cm range 66ndash110 cm SD 196
= 11 mean mass = 110 kg range 45ndash180 kg SD = 35) and 15 of unknown sex 197
(mean LF = 86 cm range 61ndash98 cm SD = 9 mean mass = 79 kg range 29ndash125 kg 198
SD = 25) There were no significant differences in fork length (Welchrsquos t-test df = 199
57 P = 026) or mass (Welchrsquos t-test df = 56 P = 007) between the sexes 200
According to scale analysis mean smolt age was 41 years (range 3ndash5) Four fish had 201
spawned once and one fish twice before this spawning season The fish had on 202
average spent 29 years (range 1ndash7) from smoltification until they were captured for 203
this study There were no differences between the sexes in age of smoltification 204
(Welchrsquos t-test df = 47 P = 076) or in time from smoltification until capture for 205
this study (Welchrsquos t-test df = 57 P = 045) 206
10
The Atlantic salmon were brought directly from the bag net into a water tank 207
on board a small research vessel for body measurements (fork length and mass) scale 208
sampling and tagging They were tagged with one of four types of individually coded 209
acoustic transmitters Thelma AS Norway model MP‐13 (n=21 13 times 31 mm mass 210
in waterair of 711g) Thelma AS Norway model LP‐16‐short (n=23 16 x 36 mm 211
mass in waterair of 614 g) Vemco Inc Canada model V13P‐1L (n=21 13 times 36 212
mm mass in waterair of 611 g) or Vemco Inc Canada model V16P‐4H (n=9 213
16x71 mm mass in waterair of 1125g) The 30 Vemco transmitters measured depth 214
with a pressure sensor (accuracy 25 m resolution 022 m) and transmitted this 215
information together with the fish identity code All fish were externally tagged under 216
the dorsal fin with a modified Carlin tag with contact and reward information 217
Individuals were anaesthetised by immersion in an aqueous solution of 2-218
phenoxy ethanol in approximately 3 min (EC No 204-589-7 SIGMA Chemical Co 219
USA 05 ml l-1) The transmitter was inserted through a 20ndash30 cm incision on the 220
ventral surface anterior to the pelvic girdle The transmitter was subsequently pushed 221
gently forward into the body cavity The incision was closed using two to three 222
independent silk sutures (20 Ethicon Belgium) Following recovery (5ndash10 minutes) 223
the salmon were transported 300 m away from the bag net (to avoid recapture in the 224
same bag net) and released Mean distance from the release site to the river mouth 225
was 24 km (range 19ndash34 km SD = 4) (Fig 1) 226
To assess possible effects of being newly tagged on fish behaviour the results 227
were compared to a lsquocontrolrsquo group of eight Atlantic salmon that were acoustically 228
tagged in the same river as kelts in May 2007 (see Halttunen et al 2009 for details) 229
and recorded during return migration as multiple spawners more than one year later 230
in 2008 231
11
232
DATA ANALYSES 233
Differences in the horizontal distribution along the different ALS arrays and 234
differences in the horizontal distribution between periods with and without wind were 235
tested with Chi-square tests To take into account the time lag of wind forces on the 236
water currents mean average wind speed and direction from the last two hours before 237
the passage of salmon in the ALS array were used Due to the low number of salmon 238
registered at each ALS array (range 26ndash33) the wind speeds were divided into only 239
two categories ldquono windrdquo was defined as wind speeds less than 30 m s-1 and ldquowindrdquo 240
as wind speeds from 31ndash134 m s-1 (highest measured value) Brackish water was 241
defined as salinity lt 30 242
Since the individual swimming depths had unequal variance difference in 243
swimming depth between the different ALS arrays was tested with Welchrsquos t-test 244
(two-way t-test assuming unequal variance) 245
The relationship between time of river entry and river flow the same day and 246
cumulative changes in river flow from one two and three days before river entry 247
were tested with linear regression analyses To test if salmon entered the river during 248
day or night night was defined as 2000ndash0800 hours which during the study period 249
corresponded to light intensities less than 20 000 lx Chi-square-tests were used to test 250
for differences between river entry at day or night during different stages of the tidal 251
cycle (divided into three hour phases high ebbing low or flooding tide) and between 252
the different combinations of day and night and different stages of the tidal cycle In 253
order to explore if timing of river entry (day-of-the-year day or night river flow tidal 254
cycle) depended on fork length or body mass a redundancy analysis (RDA Legendre 255
and Legendre 1998) was used as ordination method The proportion of the constrained 256
12
inertia (the sum of the variance from all included parameters) from the total inertia 257
was calculated which in RDA gives the proportion of variance The package ldquoVeganrdquo 258
(Oksanen 2008) was used in the software program R 28 (httpwwwr-projectorg) 259
Day and night and the tidal cycle groups were coded as dummy variables 260
Time spent in the different parts of the fjord system and migratory speeds 261
were calculated for those salmon registered at two subsequent ALS arrays Since not 262
all salmon were registered by all arrays the sample sizes for these analyses were 263
smaller than the total number of salmon registered Migratory speed was estimated as 264
individual body lengths (LF) per second and km per day by using the shortest distance 265
between the actual ALS recording the detection and the river mouth thus giving 266
minimum estimates (Thorstad et al 2004) Individual mean and median values were 267
used to calculate the populations mean and median in order to keep the data points 268
independent Differences in swimming speeds between the four zones were tested as 269
unbalanced unreplicated repeated measurements by fitting a linear mixed model using 270
the restricted maximum likelihood (REML) method The resulting zone term in the 271
fitted model was when tested with a likelihood ratio test against the null model The 272
package ldquolme4rdquo (Bates and Maechler 2010) was used in the software program R 212 273
(httpwwwr-projectorg) 274
Relationships between migratory speed and river flow the same day as river 275
entry and cumulative changes in river flow from one two and three days before river 276
entry were tested with linear regression analyses Possible significant p-values were 277
corrected for multiple comparisons using the Bonferroni procedure 278
279
280
RESULTS 281
13
Fifty-nine of the 74 confirmed wild salmon (80) were registered in the river 282
mouth (array 6) and 56 (76) entered the river Of those 15 fish that did not enter 283
the river mouth five were recaptured by anglers in the fjord seven left the fjord 284
(registered in array 1) and the remaining three were only registered some few times 285
at array 2 Genetic assignment tests supported the homing of the 56 salmon to their 286
natal river (JG Davidsen unpublished data) Data from these 56 salmon are used in 287
the following analyses 288
289
ENVIRONMENTAL DATA 290
The river flow in River Alta decreased during the period 5ndash26 July from 130 291
m3 s-1 to 75 m3 s-1 Thereafter it increased again (Fig 2) 292
In summer the surface layer in the Alta Fjord consists of brackish water due 293
to the large freshwater supply from the river The Alta fjord is a wide fjord where the 294
Coriolis effect on the circulation is considerable (Svendsen 1995) allowing cross-295
fjord gradients in current velocities salinity and temperature Theoretically the 296
brackish water would therefore follow the eastern side of the Alta fjord towards the 297
sea This was clearly seen in the conductivity temperature and depth (CTD) sections 298
from July 13 (Fig 3) when the lowest salinities were measured on the eastern side of 299
the fjord on array 1ndash3 (only array 2 and 3 are shown in the figure) One week 300
earlier the vertical salinity gradients were stronger in the upper 4 m while the 301
horizontal gradients were weaker This difference can be explained by the larger river 302
runoff in early July than mid-July combined with stronger winds (up to 8 m s-1) with 303
northerly components spreading the surface water across the fjord Thus in array 1 304
and 2 the brackish water (salinity less than 30) was found only along the eastern side 305
14
on the 13 July while covering the entire fjord section one week earlier At array 3 306
the brackish water covered the upper 3ndash4 m all along the array both days 307
The currents at both current meter locations were highly variable and did not 308
co-vary (Fig 4) Surface temperature varied during the study period between 11 and 309
17 ordmC 310
311
HORIZONTAL DISTRIBUTION 312
Most of the salmon (n = 70 95) were captured tagged and released on the 313
eastern side of the fjord Only four salmon (5) were captured on the western side 314
(Fig 1) When passing the array 2 where 55 of the 56 salmon were registered the 315
horizontal distribution corresponded to the distribution at release (Chi-square test P = 316
022 n = 55) Forty salmon (73) were registered on the eastern side 11 (20) in the 317
central part and four (7) on the western side 318
When passing the array 3 (Fig 1) more salmon migrated in the central and 319
south-western part of the fjord (Chi-square test P lt 0001 n = 55) Twelve salmon 320
(22) were registered on the north-eastern side 23 (42) in the central part and 20 321
(36) on the south-western side In the array 4 and 5 salmon were equally 322
distributed between the eastern (45 46 respectively) and western side (41 323
50 respectively) but only few individuals migrated in the central part (14 4 324
respectively) The horizontal distribution along the third AL array 3 in 2007 differed 325
between periods with and without wind During periods with no wind most salmon 326
passed the array on the north-eastern side while when the wind was blowing from the 327
north (321ndash50deg) most salmon were found in the central part of the array (Chi-square 328
test df = 2 P lt 001) Such difference was not observed when salmon passed array 329
2 4 or 5 330
15
There was no correlation between the passage time at array 3 and the current 331
direction (inout of the fjord) at either the north-eastern (Chi-square test df = 1 P = 332
086) or south-western current meter (Chi-square test df =1 P = 016) (Fig 4) The 333
current speeds (lt 20 cm s-1 Fig 4) were consistently well below the estimated 334
migratory speed of the salmon between the river mouth (array 6) and array 1 335
(average 63 cm s-1) 336
337
SWIMMING DEPTH 338
The mean swimming depth when crossing array 2ndash5 varied from 05ndash24 339
meter (Table 1) When approaching the estuary salmon swam closer to the surface 340
There was no difference in swimming depth between males and females Seven of the 341
lsquocontrolrsquo fish (the fish that returned to the river again in 2008) had depth sensing tags 342
Mean migration depth was 5 m (range 0ndash8 SD = 2) at array 1 4 m (range 0ndash6 SD 343
= 2) at array 3 and 5 m (range 0ndash9 SD = 3) at array 5 which was slightly deeper 344
than the newly tagged fish 345
346
TIMING OF RIVER ENTRY 347
Females entered the river on average six days before the males (Welchrsquos t-test 348
df = 42 P = 002) Timing of river entry did not depend on river flow on the day of 349
entry (r2 = 016 P = 006) or on cumulative changes from one (r2 = 0007 P = 070) 350
two (r2 = 0003 P = 081) or three days before entry (r2 = 0003 P = 080) No 351
difference in the timing of river entry was found in relation to the tides (Table 2) 352
There was also no difference in the timing of river entry (day-of-the-year day or 353
night river flow tidal cycle) in relation to fork length or body mass since only 14 354
16
of the variation (Table 3) of the constrained axes in the redundancy analysis was 355
explained by the timing of river entry between different sizes of salmon 356
There was a clear difference in the light intensities between day (50 000ndash209 424 lx) 357
and night (183ndash20 000 lx) during the study period (5ndash24 July) but no significant 358
difference was observed in the timing of river entry between day and night or in the 359
combination of tidal water and day or night (Table 2) Thirty salmon entered the river 360
during day-time and 26 during night time (Chi-square test df = 1 p-value = 062) 361
362
MIGRATORY SPEEDS 363
Mean migratory speed from release to river entry was 97 km day-1 (01 LF s-364
1) but with large individual variation (n = 54 range 07ndash331 km day-1 SD = 80) 365
The mean speed was lower (Welchrsquos t-test df = 50 P = 0003) from release to the 366
array 2 (93 km day-101 LF s-1 n = 52 range 05ndash710 km day-1 SD = 122) than 367
from array 2 to the river mouth (165 km day-102 LF s-1 n = 51 range 06ndash610 km 368
day-1 SD = 137) Median migratory speed (Fig 5) was fastest in zone 1 (06 LF s-1) 369
and decreased as the fish migrated towards the river mouth (01 LF s-1) (05 LF s-1 04 370
LF s-1and 01 LF s-1for zones 2‐4 respectively Linear mixed‐effects model n = 159 P 371
lt 0001) 372
Migratory speed from ALS array one to the river mouth did not depend on the 373
river flow on the day of river entry (r2 = 0007 P = 055) or on cumulative changes in 374
water flow from one (r2 = 0019 P = 031) two (r2 = 0028 P = 022) or three days 375
before entry (r2 = 0013 P = 041) There was also no relationship between migratory 376
speed in zone four (the last 2 km before river entry) and river flow on the day of river 377
entry (r2 = 0033 P = 029) or changes in river flow from the day before entry (r2 = 378
0037 P = 027) 379
17
For the eight returning Atlantic salmon in 2008 (lsquocontrolrsquo group tagged the 380
year before) the median migratory speed decreased as they approached the inner part 381
of the fjord similar to the newly tagged fish (Fig 5) Median migratory speed from 382
array 1 to the river mouth was 272 km day-1 (range 19ndash538 km day-1 SD = 199) 383
which was higher than when salmon were tagged and initially studied in 2007 384
However while the lsquocontrolrsquo group was registered at array 1 the registrations in 385
2007 started at array 2 Therefore a larger part of the fjord was included in 2008 386
387
388
DISCUSSION 389
These results from the relatively pristine Alta Fjord confirmed the hypothesis 390
that horizontal adult migration path was closer to the coastline as the fish approached 391
the river mouth but the distribution was influenced by brackish water distribution 392
northerly winds spread the brackish water across the fjord and the Atlantic salmon 393
seemed to follow this Further the results supported the hypothesis that the migration 394
occurred closer to the surface as the salmon approached the river mouth however the 395
findings could not confirm that river entry was facilitated by increased water 396
discharge and ebb tide and occurred mainly during the night The results confirmed 397
the hypothesis that the marine migration speed of returning Atlantic salmon declined 398
towards the river mouth however the hypothesis that marine migration speeds 399
increased with increasing river discharge was not supported A similar behaviour 400
between newly tagged fish and those tagged the year before their homing migration 401
supported the hypothesis that the migration pattern was not largely affected by short-402
term capture handling and tagging effects 403
404
18
HORIZONTAL DISTRIBUTION 405
Atlantic salmon generally followed the coastline during their homing 406
migration which may suggest that the coastline was used as a guide for orientating to 407
the river The complex interface between open ocean and up-river migration pose 408
special challenges and salmon may use elements of many orientation systems (Quinn 409
et al 1989 Pascual and Quinn 1991 Olson and Quinn 1993) It is widely accepted 410
that salmon at least partly rely on olfactory information to orientate to their home 411
river (Brannon 1981 Stabell 1982 Quinn 1990) The fact that most of the returning 412
adults were observed on the eastern side in the outer and central part of the fjord 413
where the lowest salinities were measured may suggest that the fish used this side of 414
the fjord because it provided the best conditions to locate and recognise the river At 415
array 3 in the inner part of the fjord the brackish layer covered the entire array and 416
here the returning adults utilized both sides of the fjord 417
Despite finding no correlation between the current direction measured at 3 m 418
depth and migratory pattern at array 3 there was a significant relationship between 419
wind direction and horizontal distribution of salmon when passing this array This 420
may indicate that the salmon distribution was influenced by wind induced spreading 421
of river water across the array The same pattern was observed during the outward 422
post-smolts migration studied in the same fjord in the same year (Davidsen et al 423
2009) 424
Despite the wind induced spreading of river water across the fjord mean 425
migratory speed was always higher than measured current velocities so it seems that 426
salmon had an active swimming behaviour when passing the array 3 In other 427
studies Atlantic salmon have been found to be influenced by the tidal current by 428
19
generally moving with the tide (eg Aprahamian et al 1998) but also to swim with 429
lower ground speed during ebb tide and higher during flood tides (Smith et al 1981) 430
431
SWIMMING DEPTH 432
As salmon approached the estuary they swam closer to the surface Since the 433
brackish water from the river outlet is in the upper part of the water column one 434
explanation for this behaviour may be that they use the brackish water layer to locate 435
and recognise the river (Quinn 1990) The attraction may be due to both the lower 436
salinity level and the river odour Earlier gillnet studies have shown that returning 437
Atlantic salmon usually remain near the surface (1ndash5 m depth) but occasionally make 438
downwards movements in the water column (Stasko et al 1973) Westerberg (1982) 439
and Doslashving et al (1985) reported that Atlantic salmon with acoustic tags moved up 440
and down in the water column in association with fine-scale hydrographic 441
stratification and they both concluded that salmon searched for vertical gradients of 442
odours from the home river rather than horizontal gradients Another reason to 443
migrate closer to the sea surface when approaching the river is to acclimate to the 444
fresh water Quinn (1990) suggested that by migrating in and out of the brackish 445
water layer at the top of the water column in the estuary salmonids can adjust to the 446
salinity of their environment as they make the transition from salt water to freshwater 447
448
TIMING OF RIVER ENTRY 449
Females entered the river in average six days earlier than males which is 450
consistent with findings in other studies (Dahl et al 2004 Niemelauml et al 2006) Dahl 451
et al (2004) suggested that the earlier river entry of female Atlantic salmon may be 452
due to females being older than males when performing their spawning migration 453
20
Several previous studies indicate that older (larger) fish usually arrive earlier than 454
younger (smaller) individuals (Power 1981 Jonsson et al 1990a) However in the 455
present study there were no differences in size or age between the two sexes 456
Changes in river flow did not influence the timing of river entry Increased 457
water discharge appears to be an important proximate factor stimulating adult Atlantic 458
salmon to enter small rivers from the sea (Jonsson et al 2007) However this stimuli 459
may act in combination with other environmental factors such as water temperature 460
light tides and water chemistry (Jonsson 1991 Potter et al 1992 Smith and Smith 461
1997) The fact that no correlation between river flow tidal cycle and river entry was 462
found in this study may be due to the generally large discharge of the River Alta (75ndash463
130 m3 s-1 during the study) In a large river like this it may not be critical for salmon 464
to enter the river at high river flow in order to safely migrate upstream or have the ebb 465
tide to facilitate the recognition of the outflowing fresh water from the home river 466
This is supported by the fact that day-of-the-year day or night time river flow and 467
tidal cycle at the time of river entry in total explained only 14 of the variation 468
between different sizes of the salmon This suggests that parameters other than those 469
included in the analysis may be important for timing of river entry or that timing of 470
river entry in the River Alta simply depends on the time salmon reach the estuary and 471
river mouth If the latter is the case timing of river entry may depend on factors 472
influencing the migration in the outer fjord or open sea 473
It has been suggested that the correlation between increased discharge and the 474
time of river entry in large rivers is not due to the stimulus for Atlantic salmon to 475
enter the river per se but rather that increased freshwater supply to near coastal areas 476
may aid salmon to recognise and find their natal river increasing the number of fish 477
entering fresh water compared to low flow periods (Thorstad et al 2010) In the 478
21
present study there was no correlation between time of river entry and changes in 479
river flow one two and three days before entry However since salmon were tagged 480
and monitored in the last part of the spawning run there may already have been 481
enough freshwater in the fjord system to guide the salmon The observation that river 482
entry not is correlated with river flow in large rivers is also supported by other studies 483
(Dahl et al 2004 Karppinen et al 2004) 484
Adult salmon entered the river during all phases of the tidal cycle It has been 485
suggested that Atlantic salmon entering the river during strong ebb currents may have 486
been attracted by the outward flow of fresh water (Potter et al 1992) However there 487
is little consensus among studies about the relationship between tidal phase and river 488
entry (Potter 1988 Potter et al 1992 Smith and Smith 1997 Karppinen et al 2004) 489
Given the wide variation in the physical chemical and hydrographic characteristics of 490
estuaries this variation in the migratory responses of Atlantic salmon to the tidal 491
cycle is perhaps not surprising (Smith and Smith 1997) In general different sizes 492
forms and shapes of rivers may result in different relationships between Atlantic 493
salmon behaviour and environmental factors 494
The absence of a clear diel pattern in the timing of river mouth passage 495
differed from that observed in a post-smolt study in the River Alta when more post-496
smolts passed the river mouth at night during migration towards the sea (Davidsen et 497
al 2009) Nocturnal migration is thought to be an adaptive behaviour to reduce 498
predation by visual predators like seals (Solomon 1982) and has been observed in 499
several studies of returning Atlantic salmon (eg Potter 1988 Smith and Smith 1997) 500
Even though the northern River Alta is situated on a latitude with midnight sun light 501
intensities were still lower than 20 000 lx at night in contrast to the 50 000ndash200 000 502
lx measured during day time The fact that no difference in the diel migration pattern 503
22
was observed for adult salmon may be because they do not experience the same 504
predation level as the smaller post-smolts 505
506
MIGRATORY SPEEDS 507
The migratory speed slowed as salmon approached the estuary and salmon 508
had a lower migratory speed in the innermost part of the estuary (zone four) than in 509
the open fjord (zone onendashthree) This change in travel rates may be an indication of a 510
physiological need to adapt to the fresh water in the river time to orientate towards 511
the river mouth and to recognise the home river (Hansen and Quinn 1998) or to wait 512
for optimal conditions for upstream migration (Jonsson et al 1990b) The finding of 513
decreasing travel rates when approaching the estuary confirm results from mark and 514
recapture studies (Hansen et al 1993 Hansen and Quinn 1998) 515
516
CONTROL FISH TAGGED THE PRECEDING YEAR 517
The migration behaviour of the eight returning Atlantic salmon in 2008 518
(lsquocontrolrsquo group tagged the year before) did not differ from the newly tagged fish 519
Similar to the newly tagged fish median migratory speed decreased as they 520
approached the inner part of the fjord and the fish migrated close (4ndash5 m) to the 521
surface The migration behaviour seemed therefore not affected by capture handling 522
and tagging This is in accordance with a laboratory study indicating that swimming 523
performance of Atlantic salmon was not affected by transmitters used in the present 524
study (Thorstad et al 2000) To our knowledge this study is first one using multiyear 525
tags to capture the migration behaviour of Atlantic salmon while Welch et al (2011) 526
have used this method on juvenile Pacific salmon 527
528
23
529
ACKNOWLEDGEMENTS 530
This study was financed by the Norwegian Research Council (project no 531
17601S40) the Norwegian Institute for Nature Research the Directorate for Nature 532
Management and the University of Tromsoslash The Norwegian Water Resources and 533
Energy Directorate provided data on the river flow The crew onboard the Research 534
Vessel ldquoJohan Ruudrdquo the staff at Alta Laksefiskeri Interessentselskap (ALI) the local 535
bag net fishermen Amund Suhr Anette Grimsrud Davidsen Cedar Chittenden and 536
Jenny Jensen are all thanked for their extensive help during the field work and Gunnel 537
Oslashstborg for scale analyses Helge Meissner is thanked for assistance with genotyping 538
and Svein-Erik Fevolden and Anne K Praeligbel for valuable discussions concerning the 539
genetics Timothy Sheehan and two anonymous referees are thanked for their valuable 540
comments on an earlier version of the manuscript The experimental procedures 541
concur with the national ethical requirements and were approved by the Norwegian 542
National Animal Research Authority 543
544
24
545
REFERENCES 546
547
Alabaster JS Gough PJ and Brooker WJ 1991 The environmental requirements 548
of Atlantic salmon Salmo salar L during their passage through the Thames 549
estuary 1982-89 J Fish Biol 38 741-762 550
Aprahamian MW Jones GO and Gough PJ 1998 Movement of adult Atlantic 551
salmon in the Usk estuary Wales J Fish Biol 53 221-225 552
Banks JW 1969 A review of the litterature on the upstream migration of adult 553
salmonids J Fish Biol 1 85-136 554
Bates D and Maechler M (2010) Package ldquolme4rdquo Reference manual for the 555
package Available at httpcranr-projectorgwebpackageslme4lme4pdf 556
(Assessed 22062012) 557
Brannon EL 1981 Orientation mechanisms of homing salmonids In Salmon and 558
trout migratory behaviour symposium Edited by EL Brannon and EO Salo 559
University of Washington Seattle pp 219-227 560
Cooke SJ Iverson SJ Stokesbury MJW Hinch SG Fisk AT Smith P 561
VanderZwaag D Brattey J and Whoriskey F 2011 Ocean Tracking 562
Network Canada A network approach to addressing critical issues in fisheries 563
and resource management with implications for ocean governance Fisheries 564
36 583-592 565
Dahl J Dannewitz J Karlsson L Petersson E Loumlf A and Ragnarsson B 2004 566
The timing of spawning migration implications of environmental variation 567
life history and sex Can J Zool 82 1864-1870 568
25
Davidsen JG Rikardsen AH Halttunen E Thorstad EB Oslashkland F Letcher 569
BH Skarethhamar J and Naeligsje TF 2009 Migratory behaviour and survival 570
rates of wild northern Atlantic salmon (Salmo salar) post-smolts effects of 571
environmental factors J Fish Biol 75 1700-1718 572
Doslashving KB Westergaringrd H and Johnsen PB 1985 Role of olfaction in the 573
behavioural and neuronal responses of Atlantic salmon Salmo salar to 574
hydrographic stratification Can J Fish Aquat Sci 42 1658-1667 575
Fiske P Lund RA and Hansen LP 2005 Identifying fish farm escapees In Stock 576
identification methods Edited by SX Cadrin KD Friedland and JD 577
Waldman Elsevier Academic Press Amsterdam pp 659-680 578
Halttunen E Rikardsen AH Davidsen JG Thorstad EB and Dempson JB 579
2009 Survival migration speed and swimming depth of Atlantic salmon kelts 580
during sea entry and fjord migration In Tagging and tracking of Marine 581
Animals with Electronic Devices Reviews Methods and Technologies in Fish 582
Biology and Fisheries 9 Edited by JL Nielsen H Arrizabalaga N Fragoso 583
A Hobday M Lutcavage and J Sibert Springer Dordrecht pp 35-49 584
Hansen LP Jonsson N and Jonsson B 1993 Oceanic migration in homing 585
Atlantic salmon Anim Behav 45 927-941 586
Hansen LP and Quinn TP 1998 The marine phase of the Atlantic salmon (Salmo 587
salar) life cycle with comparisons to pacific salmon Can J Fish Aquat Sci 588
55 104-118 589
Heggberget TG Oslashkland F and Ugedal O 1993 Distribution and migratory 590
behaviour of adult wild and farmed Atlantic salmon (Salmo salar) during 591
return migration Aquaculture 118 73-83 592
ICES (2011) Report of the Working Group on North Atlantic Salmon (WGNAS) 593
26
ICES 2011ACOM09 286 pp Available at 594
httpwwwicesdkreportsACOM2011WGNASwgnas_2011_finalpdf 595
(Assessed 22062012) 596
Jonsson B Jonsson N and Hansen LP 1990a Does juvenile experience affect 597
migration and spawning of adult Atlantic salmon Behav Ecol Sociobiol 26 598
225-230 599
Jonsson B Jonsson N and Hansen LP 2007 Factors affecting river entry of adult 600
Atlantic salmon in a small river J Fish Biol 71 943-956 601
Jonsson N 1991 Influence of water flow water temperature and light on fish 602
migration in rivers Nord J Freshwat Res 66 20-35 603
Jonsson N Jonsson B and Hansen LP 1990b Partial segregation in the timing of 604
migration of Atlantic salmon of different ages Anim Behav 40 313-321 605
Karppinen P Erkinaro J Niemelauml E Moen K and Oslashkland F 2004 Return 606
migration of one-sea-winter Atlantic salmon in the River Tana J Fish Biol 607
64 1179-1192 608
Lacroix GL and Voegeli FA 2000 Development of automated monitoring 609
systems for ultrasonic transmitters In Fish Telemetry Proceedings of the 3rd 610
Conference on Fish Telemetry in Europe Edited by A Moore and IC 611
Russell CEFAS Lowestoft UK pp 37-50 612
Legendre P and Legendre L 1998 Numerical ecology p 853 Elsevier Science BV 613
Amsterdam 614
Lund RA and Hansen LP 1991 Identification of wild and reared Atlantic salmon 615
Salmo salar L using scale characters Aquacult Fish Manage 22 499-508 616
Niemelauml E Orell P Erkinaro J Dempson J Broslashrs S Svenning M and 617
Hassinen E 2006 Previously spawned Atlantic salmon ascend a large 618
27
subarctic river earlier than their maiden counterparts J Fish Biol 69 1151ndash619
1163 620
Olson AF and Quinn TP 1993 Vertical and horizontal movements of adult 621
chinook salmon Oncorhynchus tshawytscha in the Columbia River estuary 622
Fishery Bulletin of the Fish and Wildlife Service 91 171-178 623
Parrish DL Behnke RJ Gephard SR McCormick SD and Reeves GH 1998 624
Why arenrsquot there more Atlantic salmon (Salmo salar) Can J Fish Aquat 625
Sci 55 281-287 626
Pascual MA and Quinn TP 1991 Evaluation of alternative models of the coastal 627
migration of adult Fraser River sockeye salmon (Oncorhynchus nerka) Can J 628
Fish Aquat Sci 48 799-810 629
Pierce GJ Boyle PR and Thompson PM 1990 Diet selection by seals In 630
Trophic Relationships in the Marine Environment Edited by M Barnes and 631
RN Gibson Aberdeen University Press Aberdeen pp 222-238 632
Potter ECE 1988 Movements of Atlantic salmon Salmo salar L in an estuary in 633
south-west England J Fish Biol 33 153-159 634
Potter ECE Solomon DJ and Buckley AA 1992 Estuarine movements of adult 635
Atlantic salmon (Salmo salar L) in Christchurch Harbour southern England 636
In Wildlife telemetry remote monitoring and tracking of animals Edited by 637
IG Priede and SM Swift Ellis Horwood Limited Chichester England pp 638
400-409 639
Power G 1981 Stock Characteristics and Catches of Atlantic Salmon (Salmo salar) 640
in Quebec and Newfoundland and Labrador in Relation to Environmental 641
Variables Can J Fish Aquat Sci 38 1601-1611 642
28
Quinn TP 1990 Current controversies in the study of salmon homing Ethol Ecol 643
Evol 2(1) 49-63 644
Quinn TP Terahart BA and Groot C 1989 Migratory orientation and vertical 645
movements of homing adult sockeye salmon Oncorhynchus nerka in coastal 646
waters Anim Behav 37 587-599 647
Smith GW 1990 The relationship between river flow and net catches of salmon 648
(Salmo salar L) in and around the mouth of the Aberdeenshire Dee between 649
1973 and 1986 Fish Res 10 73-91 650
Smith GW Hawkins AD Urquhart GG and Shearer WM 1981 Orientation 651
and energetic efficiency in the offshore movements of returning Atlantic 652
salmon Salmo salar L Scott Fish Res Rep 21 1-22 653
Smith IP and Smith GW 1997 Tidal and diel timing of river entry by adult 654
Atlantic salmon returning to the Aberdeenshire Dee Scotland J Fish Biol 50 655
463-474 656
Solomon DJ 1982 Smolt migration in Atlantic salmon (Salmo salar L) and sea 657
trout (Salmo trutta L) In Salmon and trout migratory behavior symposium 658
Edited by EL Brannon and EO Salo University of Washington Seattle pp 659
196-203 660
Stabell OB 1982 Homing of Atlantic salmon in relation to olfaction and genetics In 661
Salmon and trout migratory behaviour symposium Edited by EL Brannon 662
and EO Salo University of Washington Seattle pp 238-246 663
Stasko AB Sutterlin AM Rommel SAj and Elson PF 1973 Migration-664
orientation of Atlantic salmon (Salmo salar L) In International Atlantic 665
Salmon Symposium Special Publication Series Edited by MW Smith and 666
29
WM Carter International Atlantic Salmon Foundation New York pp 119-667
137 668
Svendsen H 1995 Physical oceanography of coupled fjord-coast systems in northern 669
Norway with special focus on frontal dynamics and tides In Ecology of fjords 670
and coastal waters Edited by HR Skjoldal C Hopkins KJ Erikstad and 671
HP Leinaas Elsevier Science Publ B V Amsterdam pp 149-164 672
Thorstad EB Heggberget TG and Oslashkland F 1998 Migratory behaviour of adult 673
wild and escaped farmed Atlantic salmon Salmo salar L before during and 674
after spawning in a Norwegian river Aquacult Res 29 419-428 675
Thorstad EB Whoriskey F Uglem I Moore A Rikardsen AH and Finstad B 676
2012 A critical life stage of the Atlantic salmon Salmo salar behaviour and 677
survival during the smolt and initial post-smolt migration J Fish Biol 81 678
500-542 679
Thorstad EB Whoriskey FG Rikardsen AH and Aarestrup K 2010 Aquatic 680
nomads the life and migrations of the Atlantic salmon In Atlantic Salmon 681
Ecology Edited by Oslash Aas S Einum A Klemetsen and J Skurdal Wiley-682
Blackwell New York pp 1-32 683
Thorstad EB Oslashkland F Aarestrup K and Heggberget TG 2008 Factors 684
affecting the within-river spawning migration of Atlantic salmon with 685
emphasis on human impacts Rev Fish Biol Fish 18 345-371 686
Thorstad EB Oslashkland F and Finstad B 2000 Effects of telemetry transmitters on 687
swimming performance of adult Atlantic salmon J Fish Biol 57 531-535 688
Treacutepanier S Rodriacuteguez MA and Magnan P 1996 Spawning migrations in 689
landlocked Atlantic salmon time series modelling of river discharge and water 690
temperature effects J Fish Biol 48 925-936 691
30
Ugedal O Naeligsje TF Thorstad EB Forseth T Saksgaringrd L and Heggberget 692
TG 2008 Twenty years of hydropower regulation in the River Alta long 693
term changes in abundance of juvenile and adult Atlantic salmon 694
Hydrobiologia 609 9-23 695
Welch DW Melnychuk MC Payne JC Rechisky EL Porter AD Jackson 696
GD Ward BR Vincent SP Wood CC and Semmens J 2011 In situ 697
Measurement of Coastal Ocean Movements and Survival of Juvenile Pacific 698
Salmon Proc Natl Acad Sci USA 108 8708-8713 699
Westerberg H 1982 Ultrasonic tracking of Atlantic salmon (Salmo salar L) ndash II 700
Swimming depth and temperature stratification Rep Inst Fresh Res 701
Drottningholm 60 102-120 702
1
TABLES 1
Table 1 Mean swimming depth registered at the time Atlantic salmon (Salmo salar) passed 2
the array 2ndash5 in the Alta Fjord Mean values are based on individual means Welchrsquos t-test 3
was used to test for significant difference between male and female swimming depth 4
5
ALS
Array
n
Mean
(m)
SD individual
mean (range)
(m)
Deepest
individual
recording
(m)
Mean
depth
females
(m)
Mean
depth
males
(m)
p-value
(between
sexes)
2 23 24 37 (00ndash161) 297 26 18 057
3 24 11 15 (00ndash64) 189 09 14 036
4 18 15 19 (00ndash67) 109 14 17 075
5 21 05 07 (00ndash18) 146 04 09 018
2
Table 2 Comparisons of the number and proportions of homing Atlantic salmon (Salmo 6
salar) entering the river during 1) different stages of the tidal cycle and 2) for different 7
combinations of day and night and different stages of the tidal cycle Chi-square-tests were 8
used to test for differences between different stages of the tidal cycle and between the 9
different combinations of day and night and different stages of the tidal cycle 10
11
Number
(n =56) P-value
High tide 15 27
Ebbing tide 13 23
Low tide 9 16
Flooding tide 19 34 029
High tide day time 7 13
High tide night time 8 14
Ebbing tide day time 7 13
Ebbing tide night time 6 11
Low tide day time 5 9
Low tide night time 4 7
Flooding tide day time 11 20
Flooding tide night time 8 14 071
12
3
Table 3 Results from a redundancy analysis (RDA) exploring whether timing of river entry 13
(day-of-the-year day or night river flow tidal cycle) of Atlantic salmon (Salmo salar) 14
depended on fork length or body mass The proportion of constrained and unconstrained 15
inertia (the sum of the variance from all included parameters) from total inertia was 16
calculated which in RDA gives the proportion of variance 17
18
19
Inertia Proportion
Total 20000 10000
Constrained 02846 01423
Unconstrained 17154 08577
0
N
5
km RiverAlta
Alta Fjord
70deg30deg20deg
65deg
Norway Sweden
Finland
1
2
34
5
Z 1Z 1 Z 2Z 2
Z 3Z 3Z 4Z 47 6
10
11
12
13
14
15
16
40
50
60
70
80
90
100
110
120
130
140
57 127 197 267 28
Tem
pera
ture
(degC
)
Riv
er fl
ow (m
3 s-1
)
Date 2007
0 7 0 7 1 0 0 7 1 3 0 7 1 6 0 7 1 9 0 7 2 2 0 7 2 5 0 7 - 1 0
- 5
0
5
1 0
1 5
2 0
0 7 0 7 1 0 0 7 1 3 0 7 1 6 0 7 1 9 0 7 2 2 0 7 2 5 0 7 - 1 0
- 5
0
5
1 0
1 5
2 0
Cur
rent
vel
ocity
com
pone
nt (c
m s-1
) C
urre
nt v
eloc
ity c
ompo
nent
(cm
s-1
)
Date 2007
12
34
00 05 10 15 20
Fjord zone (year 2007)
Migratory speed (bl sminus1)
AB
C
00 05 10 15 20
Fjord zone (year 2008)
Migratory speed (bl sminus1)
1
FIGURE CAPTIONS 1
2
Figure 1 Map of the lower part of River Alta and the Alta Fjord showing the position 3
of the bag nets ( ) and the release sites ( ) ALS array 1 is indicated with () while 4
ALS arrays 2ndash5 are indicated by grey and black lines Most fish passed these ALSs in the 5
darker parts of the lines The two ALSs in the river mouth (array 6) and the three ALSs 6
(array 7) in the river are given by () The map also shows the position of the two current 7
meters in ALS array 3 ( ) the four zones (Z1ndash4) and the weather station () In the 8
following year (2008) were only array 1 3 5 and 6 present 9
10
11
Figure 2 Daily river flow (- - - - -) and water temperature (___) in the River Alta 12
13
14
Figure 3 Salinity distribution recorded at 0ndash12 m depth across ALS array 2 (a amp c) and ALS 15
array 3 (b amp d) in the Alta Fjord on 6 July (a amp b) and 13 July (c amp d) 2007 16
17
18
Figure 4 Current velocity components at 3 m depth at the north-eastern (upper panel) and 19
south-western (lower panel) side of the Alta Fjord at the ALS array 3 Positive values are 20
towards the fjord head and negative values are towards the fjord mouth indicates time of 21
individual Atlantic salmon (Salmo salar) passage 22
23
2
Figure 5 Migratory speeds of homing Atlantic salmon (Salmo salar) in the Alta Fjord in 2007 24
and 2008 In 2007 the fjord was divided into four zones (see map Fig 1) In 2008 zone A 25
was the area from ALS1ndash3 zone B from ALS3ndash5 and zone C from ALS5ndash6 The box-26
and-whisker plots give the median values (black lines) the interquartile ranges (box 50 of 27
the data falling into this) and the 5th and 95th percentiles (whiskers) 28
29
- cjfas-2012-0352-final1
-
- Homing behaviour of Atlantic salmon (Salmo salar) during final phase of marine migration and river entry
-
- Table 1-3
- Figure 1
- Figure 2
-
- Slide Number 1
-
- Figure 3
-
- Slide Number 1
-
- Figure 4
-
- Slide Number 1
-
- Figure 5
- FIGURE CAPTIONS
-

2
J Skarethhamar (jofridskardhamarimrno) Institute of Marine Research N-9294 24
Tromsoslash Norway 25
26
Present address Centre for Ecological and Evolutionary Synthesis (CEES) 27
Department of Biology University of Oslo PO Box 1066 Blindern N-0315 Oslo 28
Norway 29
30
Corresponding author Jan Grimsrud Davidsen Museum of Natural History and 31
Archaeology Norwegian University of Science and Technology N-7491 Trondheim 32
Norway Tel +47 924 64314 email jandavidsenntnuno 33
34
3
Homing behaviour of Atlantic salmon (Salmo 35
salar) during final phase of marine migration 36
and river entry 37
38
Abstract Little is known about Atlantic salmon behaviour during the last phase of 39
the marine homing migration and subsequent river entry In this study 56 adult 40
Atlantic salmon in the Alta Fjord in northern Norway were equipped with acoustic 41
transmitters Salmon generally followed the coastline but their horizontal distribution 42
was also affected by wind induced spreading of river water across the fjord Mean 43
swimming depth was shallow (25ndash05 m) but with dives down to 30 m depth 44
Timing of river entry was not affected by river flow diel periodicity or tidal cycles 45
Movements during the last part of the marine migration and river entry were 46
unidirectional and relatively fast (mean 97 km day-1) However migratory speed 47
slowed as salmon approached the estuary with a significant lower speed in the 48
innermost part of the estuary than in the open fjord Migration behaviour seemed not 49
affected by handling and tagging as there were no behavioural differences between 50
newly tagged fish and those captured and tagged one year before their homing 51
migration 52
53
54
Keywords genetic assignment migratory behaviour returning salmon Salmo salar 55
L swimming depth vertical and horizontal distribution56
4
INTRODUCTION 57
Atlantic salmon (Salmo salar L) is a species of great biological cultural and 58
economic importance Abundance marine survival and in some cases growth have 59
declined in large parts of the species distribution range for unknown reasons (Parrish 60
et al 1998 ICES 2011) The anadromous life cycle involves long and complex 61
migrations through different habitats Knowledge on migration timing and patterns 62
and how these are affected by environmental factors is crucial to identify critical life 63
stages and anthropogenic impacts and to be able to implement effective mitigation 64
measures 65
Few studies have focused on the marine migration behaviour mainly due to 66
methodological constraints Radio telemetry has been used to track individual Atlantic 67
salmon in freshwater (Heggberget et al 1993 Karppinen et al 2004) resulting in 68
substantial knowledge on within-river migration of adults returning for spawning 69
(Thorstad et al 2008) Due to the high electrolyte level radio telemetry cannot be 70
used in seawater Recent improvements of acoustic telemetry methods have opened 71
new opportunities to follow individual fish in near coastal areas (Lacroix and Voegeli 72
2000 Cooke et al 2011) This has resulted in a number of studies of marine post-73
smolt migration towards feeding areas in the ocean (Thorstad et al 2012) but studies 74
of adults during their return migration are still few 75
There appears to be two phases of the marine migration from the ocean to the 76
natal river an initial phase with navigation from feeding areas towards the coast and 77
a second phase with more precise orientation in coastal waters (Hansen et al 1993) 78
This second phase is of special concern since near shore areas are often densely 79
populated and heavily affected by human activities such as boat traffic harbour and 80
industry infrastructure aquaculture pollution and fishing which may affect migration 81
5
patterns (Pierce et al 1990 Smith 1990 Alabaster et al 1991) Near-coastal areas 82
may also be complex habitats forming transition zones between rivers and the ocean 83
being subjects to both marine (tides waves saline water) and riverine influences 84
(freshwater and sediments) To collect basic information about the generally preferred 85
migration pattern the ideal situation is to study the migration in a natural environment 86
with minimal anthropogenic factors possibly influencing the migratory behaviour and 87
progression Such information is required when evaluating the movements in 88
declining populations from areas heavily influenced by for instance obstacles altered 89
water quality and global warming Northern areas like the Alta Fjord where this study 90
was performed are relatively pristine with a sparse human population and little 91
industrial development and other constructions Information about fish migration in 92
these areas may therefore be important in understanding the basic migratory behavior 93
A large number of studies have examined the effects of environmental factors 94
upon the timing of river entry on adult Atlantic salmon based on data from riverine 95
counting fences (eg Dahl et al 2004 Jonsson et al 2007) One challenge associated 96
with detecting relationships between environmental variables and the upstream 97
migration using such methods is the lack of information on how many fish are present 98
downstream of the counting site (Treacutepanier et al 1996) An increase in upstream 99
counts may not necessarily mean that conditions are improved but could reflect 100
increased fish abundance for other reasons (Thorstad et al 2008) or increased 101
detection probability On the contrary environmental conditions may be favourable 102
for upstream migration but count data may show little migration activity if there are 103
no fish available in the area Moreover fish counters are usually placed in fishways 104
traps or dams and the environmental factors important to stimulate salmon to pass 105
such sites may be site specific and different from natural river sections with other or 106
6
no migration barriers (Banks 1969 Thorstad et al 2008) Tagging fish with acoustic 107
transmitters enables us to follow their behaviour both before and during river entry to 108
analyse the impacts of environmental factors on river entry in natural rivers without 109
fishways or other obstacles 110
The aim of this study was to analyse Atlantic salmon migration pattern during 111
the last part of the spawning migration through a pristine coastal area and during river 112
entry using acoustic telemetry methods We tested the following hypotheses 1) The 113
horizontal distribution of Atlantic salmon is closer to the coastline as the fish 114
approach the river mouth since river water may be used as a guide for orientating to 115
the river 2) Swimming depths are closer to the surface as salmon approach the 116
estuary which may happen if olfactory clues from the river in the upper part of the 117
water column facilitate location and recognition the river (Quinn 1990) 3) River entry 118
is stimulated by increased water discharge in the river and occurs mainly during the 119
night and ebb tide according to previous studies based on fish counts (Jonsson 1991 120
Potter et al 1992 Smith and Smith 1997 Jonsson et al 2007) 4) Marine migration 121
speeds decline towards the river mouth which may happen if the fish need time to 122
ensure recognition of the home river and adapt to freshwater (Hansen and Quinn 123
1998) 5) Marine migration speeds increase with increasing river discharge which 124
may happen if increased freshwater supply to the fjord ease river recognition 125
(Thorstad et al 2010) 6) Migration is not affected by recent capture handling and 126
tagging as suggested by Thorstad et al (2000) which may be tested by use of long 127
lifespan telemetry tags enabling the comparison of the return migration between 128
newly captured and tagged fish and fish tagged a year before the homing migration 129
130
131
7
MATERIAL AND METHODS 132
STUDY AREA 133
The Alta Fjord northern Norway (70degN 23degE) is a large open fjord which is 134
15 km at its widest and 488 m at its deepest (Fig 1) The fjord opens through three 135
channels into the Barents Sea The tidal range is 15ndash25 m The River Alta with a 136
catchment area of 7 400 km2 is the major river draining into the fjord The estuary in 137
this study was defined as the first 2 km of the fjord measured from the river mouth 138
(zone 3 and 4) The mean annual water discharge of the river is 75 m3 sminus1 with a 139
spring flood that is occasionally higher than 1000 m3 sminus1 The river length accessible 140
to Atlantic salmon is 47 km and a hydropower plant was constructed above this 141
stretch in 1987 River Alta is one of the northernmost Atlantic salmon rivers in the 142
world with annual in-river catches between 6 and 32 tonnes during 1974ndash2007 143
(Ugedal et al 2008) Adult salmon return to the river during MayndashAugust and the 144
river temperature varies from 3ndash15deg C during this period A small town with 12 000 145
inhabitants is situated at the mouth of the river 146
147
RECORDING OF SALMON BY AUTOMATIC LISTENING STATIONS AND 148
MANUAL TRACKING 149
In 2007 a total of five arrays with automatic listening stations (ALS) (Vemco 150
Inc Canada model VR2) were deployed in the fjord Three arrays were deployed 31 151
km (array 1 21 ALSs) 17 km (array 2 14 ALSs) and 4 km (array 3 11 ALSs) 152
from the river mouth in lines across the fjord with 400 m separating each ALS (Fig 153
1) The ALSs were deployed 5 m below the surface The arrays were divided into 154
eastern side (three ALSs from east) central part and western side (three ALSs from 155
west) Further ten ALSs were deployed at 3 m depth in two arrays in the river outlet 156
8
28 km (array 4 800 m between each ALS) and 2 km (array 5 400 m between each 157
ALS) from the river mouth In addition two ALSs were deployed 2 m below the 158
surface in the river mouth (array 6) and three ALSs 5 km upstream in the river (array 159
7) In 2008 similar arrays were deployed 31 km (array 1) 4 km (array 3) and 2 160
km (array 5) from the river mouth as well as two ALSs in the river mouth (array 161
6) The sea depth exceeded 30 m at all arrays in the fjord When tagged salmon came 162
within the range of 100ndash600 m from an ALS the individual id code depth (for 30 of 163
the tags) and the time were recorded by the ALS (detection range depended on 164
environmental conditions such as currents waves and haloclines) In array 1ndash5 and 165
river mouth (array 6) the first registration of each salmon was used as the time of 166
arrival The last registration of each individual registered in the river mouth was used 167
as the time of river entry To confirm that salmon registered in the river mouth 168
actually entered the river manual tracking in the river was performed from a boat 169
during JulyndashOctober using a VR100 receiver (Vemco Inc Canada) 170
171
RECORDING OF ENVIRONMENTAL VARIABLES 172
Water temperature salinity tidal cycle light intensity water current and wind 173
speed and direction were recorded in the fjord Water temperature and discharge were 174
recorded in the river Salinity and temperature profiles were recorded at every second 175
ALS across array 1ndash3 down to 12 m depth on 6 and 13 July 2007 at low tide using 176
an SD204 conductivity temperature and depth (CTD) sonde (SAIV AS Norway) 177
SD6000 water current meters (Sensordata AS Norway) were placed three meters 178
below the surface at the south-western and north-eastern side of array 3 (Fig 1) 179
recording the direction and speed of the water current every 30 min The CTD- and 180
current meter datasets were analysed gridded and plotted using Matlab704365 181
9
(R14) The tidal range was measured every 10 min with a depth sensing data storage 182
tag (Star-Oddi Iceland model DST-milli-L) placed at the fjord bottom 1 km from the 183
river mouth Light intensities and wind direction were recorded every 15 min with a 184
light meter and an anemometer with a data logger (Onset Computer Corporation 185
USA model HOBO UA-002-64) placed on a small island in the inner part of the fjord 186
(Fig 1) 187
188
FISH CAPTURE AND TAGGING PROCEDURE 189
Eighty-two Atlantic salmon were trapped in 13 different bag nets (Fig 1) in 190
the Alta Fjord during 3ndash25 July 2007 This is a gentle capture method as the salmon 191
swim freely inside the bag net (Thorstad et al 1998) Scale analysis (Lund and 192
Hansen 1991 Fiske et al 2005) confirmed that 74 of the salmon were wild fish and 193
only these were used in this study Based on external sex characteristics these were 194
37 females (mean fork length (LF) = 93 cm range 80ndash109 cm SD = 6 mean mass = 195
96 kg range 65ndash142 kg SD = 19) 22 males (LF = 95 cm range 66ndash110 cm SD 196
= 11 mean mass = 110 kg range 45ndash180 kg SD = 35) and 15 of unknown sex 197
(mean LF = 86 cm range 61ndash98 cm SD = 9 mean mass = 79 kg range 29ndash125 kg 198
SD = 25) There were no significant differences in fork length (Welchrsquos t-test df = 199
57 P = 026) or mass (Welchrsquos t-test df = 56 P = 007) between the sexes 200
According to scale analysis mean smolt age was 41 years (range 3ndash5) Four fish had 201
spawned once and one fish twice before this spawning season The fish had on 202
average spent 29 years (range 1ndash7) from smoltification until they were captured for 203
this study There were no differences between the sexes in age of smoltification 204
(Welchrsquos t-test df = 47 P = 076) or in time from smoltification until capture for 205
this study (Welchrsquos t-test df = 57 P = 045) 206
10
The Atlantic salmon were brought directly from the bag net into a water tank 207
on board a small research vessel for body measurements (fork length and mass) scale 208
sampling and tagging They were tagged with one of four types of individually coded 209
acoustic transmitters Thelma AS Norway model MP‐13 (n=21 13 times 31 mm mass 210
in waterair of 711g) Thelma AS Norway model LP‐16‐short (n=23 16 x 36 mm 211
mass in waterair of 614 g) Vemco Inc Canada model V13P‐1L (n=21 13 times 36 212
mm mass in waterair of 611 g) or Vemco Inc Canada model V16P‐4H (n=9 213
16x71 mm mass in waterair of 1125g) The 30 Vemco transmitters measured depth 214
with a pressure sensor (accuracy 25 m resolution 022 m) and transmitted this 215
information together with the fish identity code All fish were externally tagged under 216
the dorsal fin with a modified Carlin tag with contact and reward information 217
Individuals were anaesthetised by immersion in an aqueous solution of 2-218
phenoxy ethanol in approximately 3 min (EC No 204-589-7 SIGMA Chemical Co 219
USA 05 ml l-1) The transmitter was inserted through a 20ndash30 cm incision on the 220
ventral surface anterior to the pelvic girdle The transmitter was subsequently pushed 221
gently forward into the body cavity The incision was closed using two to three 222
independent silk sutures (20 Ethicon Belgium) Following recovery (5ndash10 minutes) 223
the salmon were transported 300 m away from the bag net (to avoid recapture in the 224
same bag net) and released Mean distance from the release site to the river mouth 225
was 24 km (range 19ndash34 km SD = 4) (Fig 1) 226
To assess possible effects of being newly tagged on fish behaviour the results 227
were compared to a lsquocontrolrsquo group of eight Atlantic salmon that were acoustically 228
tagged in the same river as kelts in May 2007 (see Halttunen et al 2009 for details) 229
and recorded during return migration as multiple spawners more than one year later 230
in 2008 231
11
232
DATA ANALYSES 233
Differences in the horizontal distribution along the different ALS arrays and 234
differences in the horizontal distribution between periods with and without wind were 235
tested with Chi-square tests To take into account the time lag of wind forces on the 236
water currents mean average wind speed and direction from the last two hours before 237
the passage of salmon in the ALS array were used Due to the low number of salmon 238
registered at each ALS array (range 26ndash33) the wind speeds were divided into only 239
two categories ldquono windrdquo was defined as wind speeds less than 30 m s-1 and ldquowindrdquo 240
as wind speeds from 31ndash134 m s-1 (highest measured value) Brackish water was 241
defined as salinity lt 30 242
Since the individual swimming depths had unequal variance difference in 243
swimming depth between the different ALS arrays was tested with Welchrsquos t-test 244
(two-way t-test assuming unequal variance) 245
The relationship between time of river entry and river flow the same day and 246
cumulative changes in river flow from one two and three days before river entry 247
were tested with linear regression analyses To test if salmon entered the river during 248
day or night night was defined as 2000ndash0800 hours which during the study period 249
corresponded to light intensities less than 20 000 lx Chi-square-tests were used to test 250
for differences between river entry at day or night during different stages of the tidal 251
cycle (divided into three hour phases high ebbing low or flooding tide) and between 252
the different combinations of day and night and different stages of the tidal cycle In 253
order to explore if timing of river entry (day-of-the-year day or night river flow tidal 254
cycle) depended on fork length or body mass a redundancy analysis (RDA Legendre 255
and Legendre 1998) was used as ordination method The proportion of the constrained 256
12
inertia (the sum of the variance from all included parameters) from the total inertia 257
was calculated which in RDA gives the proportion of variance The package ldquoVeganrdquo 258
(Oksanen 2008) was used in the software program R 28 (httpwwwr-projectorg) 259
Day and night and the tidal cycle groups were coded as dummy variables 260
Time spent in the different parts of the fjord system and migratory speeds 261
were calculated for those salmon registered at two subsequent ALS arrays Since not 262
all salmon were registered by all arrays the sample sizes for these analyses were 263
smaller than the total number of salmon registered Migratory speed was estimated as 264
individual body lengths (LF) per second and km per day by using the shortest distance 265
between the actual ALS recording the detection and the river mouth thus giving 266
minimum estimates (Thorstad et al 2004) Individual mean and median values were 267
used to calculate the populations mean and median in order to keep the data points 268
independent Differences in swimming speeds between the four zones were tested as 269
unbalanced unreplicated repeated measurements by fitting a linear mixed model using 270
the restricted maximum likelihood (REML) method The resulting zone term in the 271
fitted model was when tested with a likelihood ratio test against the null model The 272
package ldquolme4rdquo (Bates and Maechler 2010) was used in the software program R 212 273
(httpwwwr-projectorg) 274
Relationships between migratory speed and river flow the same day as river 275
entry and cumulative changes in river flow from one two and three days before river 276
entry were tested with linear regression analyses Possible significant p-values were 277
corrected for multiple comparisons using the Bonferroni procedure 278
279
280
RESULTS 281
13
Fifty-nine of the 74 confirmed wild salmon (80) were registered in the river 282
mouth (array 6) and 56 (76) entered the river Of those 15 fish that did not enter 283
the river mouth five were recaptured by anglers in the fjord seven left the fjord 284
(registered in array 1) and the remaining three were only registered some few times 285
at array 2 Genetic assignment tests supported the homing of the 56 salmon to their 286
natal river (JG Davidsen unpublished data) Data from these 56 salmon are used in 287
the following analyses 288
289
ENVIRONMENTAL DATA 290
The river flow in River Alta decreased during the period 5ndash26 July from 130 291
m3 s-1 to 75 m3 s-1 Thereafter it increased again (Fig 2) 292
In summer the surface layer in the Alta Fjord consists of brackish water due 293
to the large freshwater supply from the river The Alta fjord is a wide fjord where the 294
Coriolis effect on the circulation is considerable (Svendsen 1995) allowing cross-295
fjord gradients in current velocities salinity and temperature Theoretically the 296
brackish water would therefore follow the eastern side of the Alta fjord towards the 297
sea This was clearly seen in the conductivity temperature and depth (CTD) sections 298
from July 13 (Fig 3) when the lowest salinities were measured on the eastern side of 299
the fjord on array 1ndash3 (only array 2 and 3 are shown in the figure) One week 300
earlier the vertical salinity gradients were stronger in the upper 4 m while the 301
horizontal gradients were weaker This difference can be explained by the larger river 302
runoff in early July than mid-July combined with stronger winds (up to 8 m s-1) with 303
northerly components spreading the surface water across the fjord Thus in array 1 304
and 2 the brackish water (salinity less than 30) was found only along the eastern side 305
14
on the 13 July while covering the entire fjord section one week earlier At array 3 306
the brackish water covered the upper 3ndash4 m all along the array both days 307
The currents at both current meter locations were highly variable and did not 308
co-vary (Fig 4) Surface temperature varied during the study period between 11 and 309
17 ordmC 310
311
HORIZONTAL DISTRIBUTION 312
Most of the salmon (n = 70 95) were captured tagged and released on the 313
eastern side of the fjord Only four salmon (5) were captured on the western side 314
(Fig 1) When passing the array 2 where 55 of the 56 salmon were registered the 315
horizontal distribution corresponded to the distribution at release (Chi-square test P = 316
022 n = 55) Forty salmon (73) were registered on the eastern side 11 (20) in the 317
central part and four (7) on the western side 318
When passing the array 3 (Fig 1) more salmon migrated in the central and 319
south-western part of the fjord (Chi-square test P lt 0001 n = 55) Twelve salmon 320
(22) were registered on the north-eastern side 23 (42) in the central part and 20 321
(36) on the south-western side In the array 4 and 5 salmon were equally 322
distributed between the eastern (45 46 respectively) and western side (41 323
50 respectively) but only few individuals migrated in the central part (14 4 324
respectively) The horizontal distribution along the third AL array 3 in 2007 differed 325
between periods with and without wind During periods with no wind most salmon 326
passed the array on the north-eastern side while when the wind was blowing from the 327
north (321ndash50deg) most salmon were found in the central part of the array (Chi-square 328
test df = 2 P lt 001) Such difference was not observed when salmon passed array 329
2 4 or 5 330
15
There was no correlation between the passage time at array 3 and the current 331
direction (inout of the fjord) at either the north-eastern (Chi-square test df = 1 P = 332
086) or south-western current meter (Chi-square test df =1 P = 016) (Fig 4) The 333
current speeds (lt 20 cm s-1 Fig 4) were consistently well below the estimated 334
migratory speed of the salmon between the river mouth (array 6) and array 1 335
(average 63 cm s-1) 336
337
SWIMMING DEPTH 338
The mean swimming depth when crossing array 2ndash5 varied from 05ndash24 339
meter (Table 1) When approaching the estuary salmon swam closer to the surface 340
There was no difference in swimming depth between males and females Seven of the 341
lsquocontrolrsquo fish (the fish that returned to the river again in 2008) had depth sensing tags 342
Mean migration depth was 5 m (range 0ndash8 SD = 2) at array 1 4 m (range 0ndash6 SD 343
= 2) at array 3 and 5 m (range 0ndash9 SD = 3) at array 5 which was slightly deeper 344
than the newly tagged fish 345
346
TIMING OF RIVER ENTRY 347
Females entered the river on average six days before the males (Welchrsquos t-test 348
df = 42 P = 002) Timing of river entry did not depend on river flow on the day of 349
entry (r2 = 016 P = 006) or on cumulative changes from one (r2 = 0007 P = 070) 350
two (r2 = 0003 P = 081) or three days before entry (r2 = 0003 P = 080) No 351
difference in the timing of river entry was found in relation to the tides (Table 2) 352
There was also no difference in the timing of river entry (day-of-the-year day or 353
night river flow tidal cycle) in relation to fork length or body mass since only 14 354
16
of the variation (Table 3) of the constrained axes in the redundancy analysis was 355
explained by the timing of river entry between different sizes of salmon 356
There was a clear difference in the light intensities between day (50 000ndash209 424 lx) 357
and night (183ndash20 000 lx) during the study period (5ndash24 July) but no significant 358
difference was observed in the timing of river entry between day and night or in the 359
combination of tidal water and day or night (Table 2) Thirty salmon entered the river 360
during day-time and 26 during night time (Chi-square test df = 1 p-value = 062) 361
362
MIGRATORY SPEEDS 363
Mean migratory speed from release to river entry was 97 km day-1 (01 LF s-364
1) but with large individual variation (n = 54 range 07ndash331 km day-1 SD = 80) 365
The mean speed was lower (Welchrsquos t-test df = 50 P = 0003) from release to the 366
array 2 (93 km day-101 LF s-1 n = 52 range 05ndash710 km day-1 SD = 122) than 367
from array 2 to the river mouth (165 km day-102 LF s-1 n = 51 range 06ndash610 km 368
day-1 SD = 137) Median migratory speed (Fig 5) was fastest in zone 1 (06 LF s-1) 369
and decreased as the fish migrated towards the river mouth (01 LF s-1) (05 LF s-1 04 370
LF s-1and 01 LF s-1for zones 2‐4 respectively Linear mixed‐effects model n = 159 P 371
lt 0001) 372
Migratory speed from ALS array one to the river mouth did not depend on the 373
river flow on the day of river entry (r2 = 0007 P = 055) or on cumulative changes in 374
water flow from one (r2 = 0019 P = 031) two (r2 = 0028 P = 022) or three days 375
before entry (r2 = 0013 P = 041) There was also no relationship between migratory 376
speed in zone four (the last 2 km before river entry) and river flow on the day of river 377
entry (r2 = 0033 P = 029) or changes in river flow from the day before entry (r2 = 378
0037 P = 027) 379
17
For the eight returning Atlantic salmon in 2008 (lsquocontrolrsquo group tagged the 380
year before) the median migratory speed decreased as they approached the inner part 381
of the fjord similar to the newly tagged fish (Fig 5) Median migratory speed from 382
array 1 to the river mouth was 272 km day-1 (range 19ndash538 km day-1 SD = 199) 383
which was higher than when salmon were tagged and initially studied in 2007 384
However while the lsquocontrolrsquo group was registered at array 1 the registrations in 385
2007 started at array 2 Therefore a larger part of the fjord was included in 2008 386
387
388
DISCUSSION 389
These results from the relatively pristine Alta Fjord confirmed the hypothesis 390
that horizontal adult migration path was closer to the coastline as the fish approached 391
the river mouth but the distribution was influenced by brackish water distribution 392
northerly winds spread the brackish water across the fjord and the Atlantic salmon 393
seemed to follow this Further the results supported the hypothesis that the migration 394
occurred closer to the surface as the salmon approached the river mouth however the 395
findings could not confirm that river entry was facilitated by increased water 396
discharge and ebb tide and occurred mainly during the night The results confirmed 397
the hypothesis that the marine migration speed of returning Atlantic salmon declined 398
towards the river mouth however the hypothesis that marine migration speeds 399
increased with increasing river discharge was not supported A similar behaviour 400
between newly tagged fish and those tagged the year before their homing migration 401
supported the hypothesis that the migration pattern was not largely affected by short-402
term capture handling and tagging effects 403
404
18
HORIZONTAL DISTRIBUTION 405
Atlantic salmon generally followed the coastline during their homing 406
migration which may suggest that the coastline was used as a guide for orientating to 407
the river The complex interface between open ocean and up-river migration pose 408
special challenges and salmon may use elements of many orientation systems (Quinn 409
et al 1989 Pascual and Quinn 1991 Olson and Quinn 1993) It is widely accepted 410
that salmon at least partly rely on olfactory information to orientate to their home 411
river (Brannon 1981 Stabell 1982 Quinn 1990) The fact that most of the returning 412
adults were observed on the eastern side in the outer and central part of the fjord 413
where the lowest salinities were measured may suggest that the fish used this side of 414
the fjord because it provided the best conditions to locate and recognise the river At 415
array 3 in the inner part of the fjord the brackish layer covered the entire array and 416
here the returning adults utilized both sides of the fjord 417
Despite finding no correlation between the current direction measured at 3 m 418
depth and migratory pattern at array 3 there was a significant relationship between 419
wind direction and horizontal distribution of salmon when passing this array This 420
may indicate that the salmon distribution was influenced by wind induced spreading 421
of river water across the array The same pattern was observed during the outward 422
post-smolts migration studied in the same fjord in the same year (Davidsen et al 423
2009) 424
Despite the wind induced spreading of river water across the fjord mean 425
migratory speed was always higher than measured current velocities so it seems that 426
salmon had an active swimming behaviour when passing the array 3 In other 427
studies Atlantic salmon have been found to be influenced by the tidal current by 428
19
generally moving with the tide (eg Aprahamian et al 1998) but also to swim with 429
lower ground speed during ebb tide and higher during flood tides (Smith et al 1981) 430
431
SWIMMING DEPTH 432
As salmon approached the estuary they swam closer to the surface Since the 433
brackish water from the river outlet is in the upper part of the water column one 434
explanation for this behaviour may be that they use the brackish water layer to locate 435
and recognise the river (Quinn 1990) The attraction may be due to both the lower 436
salinity level and the river odour Earlier gillnet studies have shown that returning 437
Atlantic salmon usually remain near the surface (1ndash5 m depth) but occasionally make 438
downwards movements in the water column (Stasko et al 1973) Westerberg (1982) 439
and Doslashving et al (1985) reported that Atlantic salmon with acoustic tags moved up 440
and down in the water column in association with fine-scale hydrographic 441
stratification and they both concluded that salmon searched for vertical gradients of 442
odours from the home river rather than horizontal gradients Another reason to 443
migrate closer to the sea surface when approaching the river is to acclimate to the 444
fresh water Quinn (1990) suggested that by migrating in and out of the brackish 445
water layer at the top of the water column in the estuary salmonids can adjust to the 446
salinity of their environment as they make the transition from salt water to freshwater 447
448
TIMING OF RIVER ENTRY 449
Females entered the river in average six days earlier than males which is 450
consistent with findings in other studies (Dahl et al 2004 Niemelauml et al 2006) Dahl 451
et al (2004) suggested that the earlier river entry of female Atlantic salmon may be 452
due to females being older than males when performing their spawning migration 453
20
Several previous studies indicate that older (larger) fish usually arrive earlier than 454
younger (smaller) individuals (Power 1981 Jonsson et al 1990a) However in the 455
present study there were no differences in size or age between the two sexes 456
Changes in river flow did not influence the timing of river entry Increased 457
water discharge appears to be an important proximate factor stimulating adult Atlantic 458
salmon to enter small rivers from the sea (Jonsson et al 2007) However this stimuli 459
may act in combination with other environmental factors such as water temperature 460
light tides and water chemistry (Jonsson 1991 Potter et al 1992 Smith and Smith 461
1997) The fact that no correlation between river flow tidal cycle and river entry was 462
found in this study may be due to the generally large discharge of the River Alta (75ndash463
130 m3 s-1 during the study) In a large river like this it may not be critical for salmon 464
to enter the river at high river flow in order to safely migrate upstream or have the ebb 465
tide to facilitate the recognition of the outflowing fresh water from the home river 466
This is supported by the fact that day-of-the-year day or night time river flow and 467
tidal cycle at the time of river entry in total explained only 14 of the variation 468
between different sizes of the salmon This suggests that parameters other than those 469
included in the analysis may be important for timing of river entry or that timing of 470
river entry in the River Alta simply depends on the time salmon reach the estuary and 471
river mouth If the latter is the case timing of river entry may depend on factors 472
influencing the migration in the outer fjord or open sea 473
It has been suggested that the correlation between increased discharge and the 474
time of river entry in large rivers is not due to the stimulus for Atlantic salmon to 475
enter the river per se but rather that increased freshwater supply to near coastal areas 476
may aid salmon to recognise and find their natal river increasing the number of fish 477
entering fresh water compared to low flow periods (Thorstad et al 2010) In the 478
21
present study there was no correlation between time of river entry and changes in 479
river flow one two and three days before entry However since salmon were tagged 480
and monitored in the last part of the spawning run there may already have been 481
enough freshwater in the fjord system to guide the salmon The observation that river 482
entry not is correlated with river flow in large rivers is also supported by other studies 483
(Dahl et al 2004 Karppinen et al 2004) 484
Adult salmon entered the river during all phases of the tidal cycle It has been 485
suggested that Atlantic salmon entering the river during strong ebb currents may have 486
been attracted by the outward flow of fresh water (Potter et al 1992) However there 487
is little consensus among studies about the relationship between tidal phase and river 488
entry (Potter 1988 Potter et al 1992 Smith and Smith 1997 Karppinen et al 2004) 489
Given the wide variation in the physical chemical and hydrographic characteristics of 490
estuaries this variation in the migratory responses of Atlantic salmon to the tidal 491
cycle is perhaps not surprising (Smith and Smith 1997) In general different sizes 492
forms and shapes of rivers may result in different relationships between Atlantic 493
salmon behaviour and environmental factors 494
The absence of a clear diel pattern in the timing of river mouth passage 495
differed from that observed in a post-smolt study in the River Alta when more post-496
smolts passed the river mouth at night during migration towards the sea (Davidsen et 497
al 2009) Nocturnal migration is thought to be an adaptive behaviour to reduce 498
predation by visual predators like seals (Solomon 1982) and has been observed in 499
several studies of returning Atlantic salmon (eg Potter 1988 Smith and Smith 1997) 500
Even though the northern River Alta is situated on a latitude with midnight sun light 501
intensities were still lower than 20 000 lx at night in contrast to the 50 000ndash200 000 502
lx measured during day time The fact that no difference in the diel migration pattern 503
22
was observed for adult salmon may be because they do not experience the same 504
predation level as the smaller post-smolts 505
506
MIGRATORY SPEEDS 507
The migratory speed slowed as salmon approached the estuary and salmon 508
had a lower migratory speed in the innermost part of the estuary (zone four) than in 509
the open fjord (zone onendashthree) This change in travel rates may be an indication of a 510
physiological need to adapt to the fresh water in the river time to orientate towards 511
the river mouth and to recognise the home river (Hansen and Quinn 1998) or to wait 512
for optimal conditions for upstream migration (Jonsson et al 1990b) The finding of 513
decreasing travel rates when approaching the estuary confirm results from mark and 514
recapture studies (Hansen et al 1993 Hansen and Quinn 1998) 515
516
CONTROL FISH TAGGED THE PRECEDING YEAR 517
The migration behaviour of the eight returning Atlantic salmon in 2008 518
(lsquocontrolrsquo group tagged the year before) did not differ from the newly tagged fish 519
Similar to the newly tagged fish median migratory speed decreased as they 520
approached the inner part of the fjord and the fish migrated close (4ndash5 m) to the 521
surface The migration behaviour seemed therefore not affected by capture handling 522
and tagging This is in accordance with a laboratory study indicating that swimming 523
performance of Atlantic salmon was not affected by transmitters used in the present 524
study (Thorstad et al 2000) To our knowledge this study is first one using multiyear 525
tags to capture the migration behaviour of Atlantic salmon while Welch et al (2011) 526
have used this method on juvenile Pacific salmon 527
528
23
529
ACKNOWLEDGEMENTS 530
This study was financed by the Norwegian Research Council (project no 531
17601S40) the Norwegian Institute for Nature Research the Directorate for Nature 532
Management and the University of Tromsoslash The Norwegian Water Resources and 533
Energy Directorate provided data on the river flow The crew onboard the Research 534
Vessel ldquoJohan Ruudrdquo the staff at Alta Laksefiskeri Interessentselskap (ALI) the local 535
bag net fishermen Amund Suhr Anette Grimsrud Davidsen Cedar Chittenden and 536
Jenny Jensen are all thanked for their extensive help during the field work and Gunnel 537
Oslashstborg for scale analyses Helge Meissner is thanked for assistance with genotyping 538
and Svein-Erik Fevolden and Anne K Praeligbel for valuable discussions concerning the 539
genetics Timothy Sheehan and two anonymous referees are thanked for their valuable 540
comments on an earlier version of the manuscript The experimental procedures 541
concur with the national ethical requirements and were approved by the Norwegian 542
National Animal Research Authority 543
544
24
545
REFERENCES 546
547
Alabaster JS Gough PJ and Brooker WJ 1991 The environmental requirements 548
of Atlantic salmon Salmo salar L during their passage through the Thames 549
estuary 1982-89 J Fish Biol 38 741-762 550
Aprahamian MW Jones GO and Gough PJ 1998 Movement of adult Atlantic 551
salmon in the Usk estuary Wales J Fish Biol 53 221-225 552
Banks JW 1969 A review of the litterature on the upstream migration of adult 553
salmonids J Fish Biol 1 85-136 554
Bates D and Maechler M (2010) Package ldquolme4rdquo Reference manual for the 555
package Available at httpcranr-projectorgwebpackageslme4lme4pdf 556
(Assessed 22062012) 557
Brannon EL 1981 Orientation mechanisms of homing salmonids In Salmon and 558
trout migratory behaviour symposium Edited by EL Brannon and EO Salo 559
University of Washington Seattle pp 219-227 560
Cooke SJ Iverson SJ Stokesbury MJW Hinch SG Fisk AT Smith P 561
VanderZwaag D Brattey J and Whoriskey F 2011 Ocean Tracking 562
Network Canada A network approach to addressing critical issues in fisheries 563
and resource management with implications for ocean governance Fisheries 564
36 583-592 565
Dahl J Dannewitz J Karlsson L Petersson E Loumlf A and Ragnarsson B 2004 566
The timing of spawning migration implications of environmental variation 567
life history and sex Can J Zool 82 1864-1870 568
25
Davidsen JG Rikardsen AH Halttunen E Thorstad EB Oslashkland F Letcher 569
BH Skarethhamar J and Naeligsje TF 2009 Migratory behaviour and survival 570
rates of wild northern Atlantic salmon (Salmo salar) post-smolts effects of 571
environmental factors J Fish Biol 75 1700-1718 572
Doslashving KB Westergaringrd H and Johnsen PB 1985 Role of olfaction in the 573
behavioural and neuronal responses of Atlantic salmon Salmo salar to 574
hydrographic stratification Can J Fish Aquat Sci 42 1658-1667 575
Fiske P Lund RA and Hansen LP 2005 Identifying fish farm escapees In Stock 576
identification methods Edited by SX Cadrin KD Friedland and JD 577
Waldman Elsevier Academic Press Amsterdam pp 659-680 578
Halttunen E Rikardsen AH Davidsen JG Thorstad EB and Dempson JB 579
2009 Survival migration speed and swimming depth of Atlantic salmon kelts 580
during sea entry and fjord migration In Tagging and tracking of Marine 581
Animals with Electronic Devices Reviews Methods and Technologies in Fish 582
Biology and Fisheries 9 Edited by JL Nielsen H Arrizabalaga N Fragoso 583
A Hobday M Lutcavage and J Sibert Springer Dordrecht pp 35-49 584
Hansen LP Jonsson N and Jonsson B 1993 Oceanic migration in homing 585
Atlantic salmon Anim Behav 45 927-941 586
Hansen LP and Quinn TP 1998 The marine phase of the Atlantic salmon (Salmo 587
salar) life cycle with comparisons to pacific salmon Can J Fish Aquat Sci 588
55 104-118 589
Heggberget TG Oslashkland F and Ugedal O 1993 Distribution and migratory 590
behaviour of adult wild and farmed Atlantic salmon (Salmo salar) during 591
return migration Aquaculture 118 73-83 592
ICES (2011) Report of the Working Group on North Atlantic Salmon (WGNAS) 593
26
ICES 2011ACOM09 286 pp Available at 594
httpwwwicesdkreportsACOM2011WGNASwgnas_2011_finalpdf 595
(Assessed 22062012) 596
Jonsson B Jonsson N and Hansen LP 1990a Does juvenile experience affect 597
migration and spawning of adult Atlantic salmon Behav Ecol Sociobiol 26 598
225-230 599
Jonsson B Jonsson N and Hansen LP 2007 Factors affecting river entry of adult 600
Atlantic salmon in a small river J Fish Biol 71 943-956 601
Jonsson N 1991 Influence of water flow water temperature and light on fish 602
migration in rivers Nord J Freshwat Res 66 20-35 603
Jonsson N Jonsson B and Hansen LP 1990b Partial segregation in the timing of 604
migration of Atlantic salmon of different ages Anim Behav 40 313-321 605
Karppinen P Erkinaro J Niemelauml E Moen K and Oslashkland F 2004 Return 606
migration of one-sea-winter Atlantic salmon in the River Tana J Fish Biol 607
64 1179-1192 608
Lacroix GL and Voegeli FA 2000 Development of automated monitoring 609
systems for ultrasonic transmitters In Fish Telemetry Proceedings of the 3rd 610
Conference on Fish Telemetry in Europe Edited by A Moore and IC 611
Russell CEFAS Lowestoft UK pp 37-50 612
Legendre P and Legendre L 1998 Numerical ecology p 853 Elsevier Science BV 613
Amsterdam 614
Lund RA and Hansen LP 1991 Identification of wild and reared Atlantic salmon 615
Salmo salar L using scale characters Aquacult Fish Manage 22 499-508 616
Niemelauml E Orell P Erkinaro J Dempson J Broslashrs S Svenning M and 617
Hassinen E 2006 Previously spawned Atlantic salmon ascend a large 618
27
subarctic river earlier than their maiden counterparts J Fish Biol 69 1151ndash619
1163 620
Olson AF and Quinn TP 1993 Vertical and horizontal movements of adult 621
chinook salmon Oncorhynchus tshawytscha in the Columbia River estuary 622
Fishery Bulletin of the Fish and Wildlife Service 91 171-178 623
Parrish DL Behnke RJ Gephard SR McCormick SD and Reeves GH 1998 624
Why arenrsquot there more Atlantic salmon (Salmo salar) Can J Fish Aquat 625
Sci 55 281-287 626
Pascual MA and Quinn TP 1991 Evaluation of alternative models of the coastal 627
migration of adult Fraser River sockeye salmon (Oncorhynchus nerka) Can J 628
Fish Aquat Sci 48 799-810 629
Pierce GJ Boyle PR and Thompson PM 1990 Diet selection by seals In 630
Trophic Relationships in the Marine Environment Edited by M Barnes and 631
RN Gibson Aberdeen University Press Aberdeen pp 222-238 632
Potter ECE 1988 Movements of Atlantic salmon Salmo salar L in an estuary in 633
south-west England J Fish Biol 33 153-159 634
Potter ECE Solomon DJ and Buckley AA 1992 Estuarine movements of adult 635
Atlantic salmon (Salmo salar L) in Christchurch Harbour southern England 636
In Wildlife telemetry remote monitoring and tracking of animals Edited by 637
IG Priede and SM Swift Ellis Horwood Limited Chichester England pp 638
400-409 639
Power G 1981 Stock Characteristics and Catches of Atlantic Salmon (Salmo salar) 640
in Quebec and Newfoundland and Labrador in Relation to Environmental 641
Variables Can J Fish Aquat Sci 38 1601-1611 642
28
Quinn TP 1990 Current controversies in the study of salmon homing Ethol Ecol 643
Evol 2(1) 49-63 644
Quinn TP Terahart BA and Groot C 1989 Migratory orientation and vertical 645
movements of homing adult sockeye salmon Oncorhynchus nerka in coastal 646
waters Anim Behav 37 587-599 647
Smith GW 1990 The relationship between river flow and net catches of salmon 648
(Salmo salar L) in and around the mouth of the Aberdeenshire Dee between 649
1973 and 1986 Fish Res 10 73-91 650
Smith GW Hawkins AD Urquhart GG and Shearer WM 1981 Orientation 651
and energetic efficiency in the offshore movements of returning Atlantic 652
salmon Salmo salar L Scott Fish Res Rep 21 1-22 653
Smith IP and Smith GW 1997 Tidal and diel timing of river entry by adult 654
Atlantic salmon returning to the Aberdeenshire Dee Scotland J Fish Biol 50 655
463-474 656
Solomon DJ 1982 Smolt migration in Atlantic salmon (Salmo salar L) and sea 657
trout (Salmo trutta L) In Salmon and trout migratory behavior symposium 658
Edited by EL Brannon and EO Salo University of Washington Seattle pp 659
196-203 660
Stabell OB 1982 Homing of Atlantic salmon in relation to olfaction and genetics In 661
Salmon and trout migratory behaviour symposium Edited by EL Brannon 662
and EO Salo University of Washington Seattle pp 238-246 663
Stasko AB Sutterlin AM Rommel SAj and Elson PF 1973 Migration-664
orientation of Atlantic salmon (Salmo salar L) In International Atlantic 665
Salmon Symposium Special Publication Series Edited by MW Smith and 666
29
WM Carter International Atlantic Salmon Foundation New York pp 119-667
137 668
Svendsen H 1995 Physical oceanography of coupled fjord-coast systems in northern 669
Norway with special focus on frontal dynamics and tides In Ecology of fjords 670
and coastal waters Edited by HR Skjoldal C Hopkins KJ Erikstad and 671
HP Leinaas Elsevier Science Publ B V Amsterdam pp 149-164 672
Thorstad EB Heggberget TG and Oslashkland F 1998 Migratory behaviour of adult 673
wild and escaped farmed Atlantic salmon Salmo salar L before during and 674
after spawning in a Norwegian river Aquacult Res 29 419-428 675
Thorstad EB Whoriskey F Uglem I Moore A Rikardsen AH and Finstad B 676
2012 A critical life stage of the Atlantic salmon Salmo salar behaviour and 677
survival during the smolt and initial post-smolt migration J Fish Biol 81 678
500-542 679
Thorstad EB Whoriskey FG Rikardsen AH and Aarestrup K 2010 Aquatic 680
nomads the life and migrations of the Atlantic salmon In Atlantic Salmon 681
Ecology Edited by Oslash Aas S Einum A Klemetsen and J Skurdal Wiley-682
Blackwell New York pp 1-32 683
Thorstad EB Oslashkland F Aarestrup K and Heggberget TG 2008 Factors 684
affecting the within-river spawning migration of Atlantic salmon with 685
emphasis on human impacts Rev Fish Biol Fish 18 345-371 686
Thorstad EB Oslashkland F and Finstad B 2000 Effects of telemetry transmitters on 687
swimming performance of adult Atlantic salmon J Fish Biol 57 531-535 688
Treacutepanier S Rodriacuteguez MA and Magnan P 1996 Spawning migrations in 689
landlocked Atlantic salmon time series modelling of river discharge and water 690
temperature effects J Fish Biol 48 925-936 691
30
Ugedal O Naeligsje TF Thorstad EB Forseth T Saksgaringrd L and Heggberget 692
TG 2008 Twenty years of hydropower regulation in the River Alta long 693
term changes in abundance of juvenile and adult Atlantic salmon 694
Hydrobiologia 609 9-23 695
Welch DW Melnychuk MC Payne JC Rechisky EL Porter AD Jackson 696
GD Ward BR Vincent SP Wood CC and Semmens J 2011 In situ 697
Measurement of Coastal Ocean Movements and Survival of Juvenile Pacific 698
Salmon Proc Natl Acad Sci USA 108 8708-8713 699
Westerberg H 1982 Ultrasonic tracking of Atlantic salmon (Salmo salar L) ndash II 700
Swimming depth and temperature stratification Rep Inst Fresh Res 701
Drottningholm 60 102-120 702
1
TABLES 1
Table 1 Mean swimming depth registered at the time Atlantic salmon (Salmo salar) passed 2
the array 2ndash5 in the Alta Fjord Mean values are based on individual means Welchrsquos t-test 3
was used to test for significant difference between male and female swimming depth 4
5
ALS
Array
n
Mean
(m)
SD individual
mean (range)
(m)
Deepest
individual
recording
(m)
Mean
depth
females
(m)
Mean
depth
males
(m)
p-value
(between
sexes)
2 23 24 37 (00ndash161) 297 26 18 057
3 24 11 15 (00ndash64) 189 09 14 036
4 18 15 19 (00ndash67) 109 14 17 075
5 21 05 07 (00ndash18) 146 04 09 018
2
Table 2 Comparisons of the number and proportions of homing Atlantic salmon (Salmo 6
salar) entering the river during 1) different stages of the tidal cycle and 2) for different 7
combinations of day and night and different stages of the tidal cycle Chi-square-tests were 8
used to test for differences between different stages of the tidal cycle and between the 9
different combinations of day and night and different stages of the tidal cycle 10
11
Number
(n =56) P-value
High tide 15 27
Ebbing tide 13 23
Low tide 9 16
Flooding tide 19 34 029
High tide day time 7 13
High tide night time 8 14
Ebbing tide day time 7 13
Ebbing tide night time 6 11
Low tide day time 5 9
Low tide night time 4 7
Flooding tide day time 11 20
Flooding tide night time 8 14 071
12
3
Table 3 Results from a redundancy analysis (RDA) exploring whether timing of river entry 13
(day-of-the-year day or night river flow tidal cycle) of Atlantic salmon (Salmo salar) 14
depended on fork length or body mass The proportion of constrained and unconstrained 15
inertia (the sum of the variance from all included parameters) from total inertia was 16
calculated which in RDA gives the proportion of variance 17
18
19
Inertia Proportion
Total 20000 10000
Constrained 02846 01423
Unconstrained 17154 08577
0
N
5
km RiverAlta
Alta Fjord
70deg30deg20deg
65deg
Norway Sweden
Finland
1
2
34
5
Z 1Z 1 Z 2Z 2
Z 3Z 3Z 4Z 47 6
10
11
12
13
14
15
16
40
50
60
70
80
90
100
110
120
130
140
57 127 197 267 28
Tem
pera
ture
(degC
)
Riv
er fl
ow (m
3 s-1
)
Date 2007
0 7 0 7 1 0 0 7 1 3 0 7 1 6 0 7 1 9 0 7 2 2 0 7 2 5 0 7 - 1 0
- 5
0
5
1 0
1 5
2 0
0 7 0 7 1 0 0 7 1 3 0 7 1 6 0 7 1 9 0 7 2 2 0 7 2 5 0 7 - 1 0
- 5
0
5
1 0
1 5
2 0
Cur
rent
vel
ocity
com
pone
nt (c
m s-1
) C
urre
nt v
eloc
ity c
ompo
nent
(cm
s-1
)
Date 2007
12
34
00 05 10 15 20
Fjord zone (year 2007)
Migratory speed (bl sminus1)
AB
C
00 05 10 15 20
Fjord zone (year 2008)
Migratory speed (bl sminus1)
1
FIGURE CAPTIONS 1
2
Figure 1 Map of the lower part of River Alta and the Alta Fjord showing the position 3
of the bag nets ( ) and the release sites ( ) ALS array 1 is indicated with () while 4
ALS arrays 2ndash5 are indicated by grey and black lines Most fish passed these ALSs in the 5
darker parts of the lines The two ALSs in the river mouth (array 6) and the three ALSs 6
(array 7) in the river are given by () The map also shows the position of the two current 7
meters in ALS array 3 ( ) the four zones (Z1ndash4) and the weather station () In the 8
following year (2008) were only array 1 3 5 and 6 present 9
10
11
Figure 2 Daily river flow (- - - - -) and water temperature (___) in the River Alta 12
13
14
Figure 3 Salinity distribution recorded at 0ndash12 m depth across ALS array 2 (a amp c) and ALS 15
array 3 (b amp d) in the Alta Fjord on 6 July (a amp b) and 13 July (c amp d) 2007 16
17
18
Figure 4 Current velocity components at 3 m depth at the north-eastern (upper panel) and 19
south-western (lower panel) side of the Alta Fjord at the ALS array 3 Positive values are 20
towards the fjord head and negative values are towards the fjord mouth indicates time of 21
individual Atlantic salmon (Salmo salar) passage 22
23
2
Figure 5 Migratory speeds of homing Atlantic salmon (Salmo salar) in the Alta Fjord in 2007 24
and 2008 In 2007 the fjord was divided into four zones (see map Fig 1) In 2008 zone A 25
was the area from ALS1ndash3 zone B from ALS3ndash5 and zone C from ALS5ndash6 The box-26
and-whisker plots give the median values (black lines) the interquartile ranges (box 50 of 27
the data falling into this) and the 5th and 95th percentiles (whiskers) 28
29
- cjfas-2012-0352-final1
-
- Homing behaviour of Atlantic salmon (Salmo salar) during final phase of marine migration and river entry
-
- Table 1-3
- Figure 1
- Figure 2
-
- Slide Number 1
-
- Figure 3
-
- Slide Number 1
-
- Figure 4
-
- Slide Number 1
-
- Figure 5
- FIGURE CAPTIONS
-
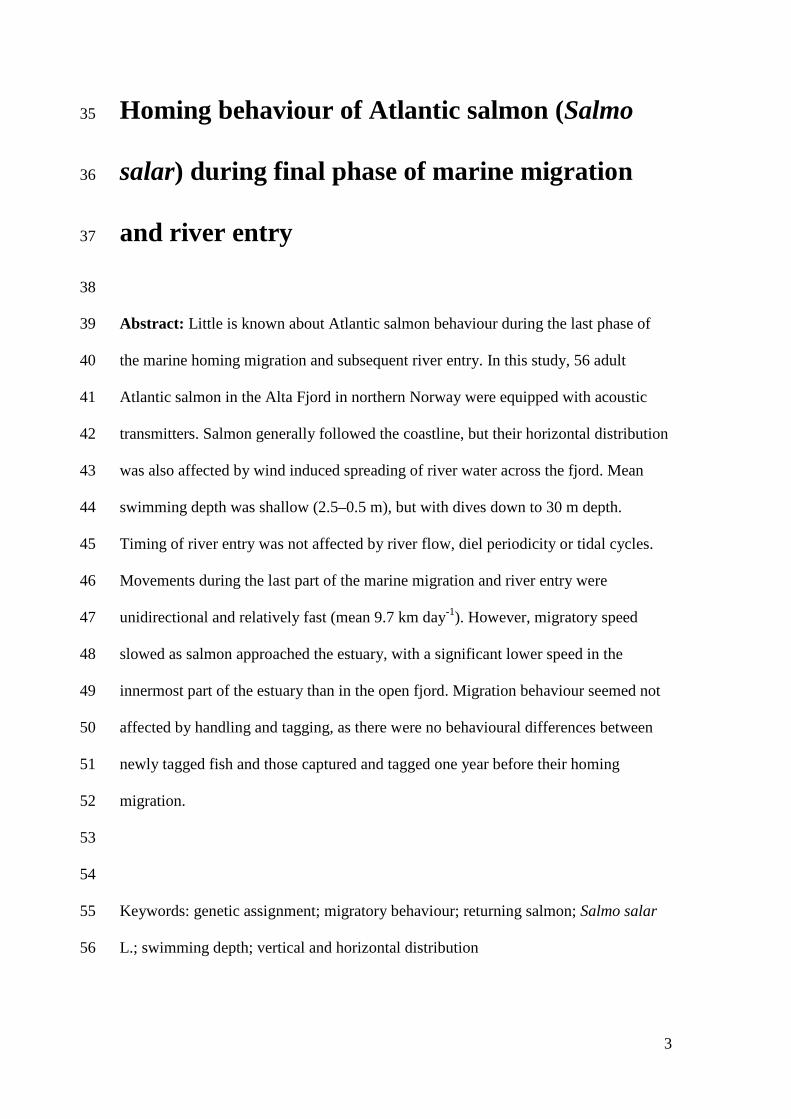
3
Homing behaviour of Atlantic salmon (Salmo 35
salar) during final phase of marine migration 36
and river entry 37
38
Abstract Little is known about Atlantic salmon behaviour during the last phase of 39
the marine homing migration and subsequent river entry In this study 56 adult 40
Atlantic salmon in the Alta Fjord in northern Norway were equipped with acoustic 41
transmitters Salmon generally followed the coastline but their horizontal distribution 42
was also affected by wind induced spreading of river water across the fjord Mean 43
swimming depth was shallow (25ndash05 m) but with dives down to 30 m depth 44
Timing of river entry was not affected by river flow diel periodicity or tidal cycles 45
Movements during the last part of the marine migration and river entry were 46
unidirectional and relatively fast (mean 97 km day-1) However migratory speed 47
slowed as salmon approached the estuary with a significant lower speed in the 48
innermost part of the estuary than in the open fjord Migration behaviour seemed not 49
affected by handling and tagging as there were no behavioural differences between 50
newly tagged fish and those captured and tagged one year before their homing 51
migration 52
53
54
Keywords genetic assignment migratory behaviour returning salmon Salmo salar 55
L swimming depth vertical and horizontal distribution56
4
INTRODUCTION 57
Atlantic salmon (Salmo salar L) is a species of great biological cultural and 58
economic importance Abundance marine survival and in some cases growth have 59
declined in large parts of the species distribution range for unknown reasons (Parrish 60
et al 1998 ICES 2011) The anadromous life cycle involves long and complex 61
migrations through different habitats Knowledge on migration timing and patterns 62
and how these are affected by environmental factors is crucial to identify critical life 63
stages and anthropogenic impacts and to be able to implement effective mitigation 64
measures 65
Few studies have focused on the marine migration behaviour mainly due to 66
methodological constraints Radio telemetry has been used to track individual Atlantic 67
salmon in freshwater (Heggberget et al 1993 Karppinen et al 2004) resulting in 68
substantial knowledge on within-river migration of adults returning for spawning 69
(Thorstad et al 2008) Due to the high electrolyte level radio telemetry cannot be 70
used in seawater Recent improvements of acoustic telemetry methods have opened 71
new opportunities to follow individual fish in near coastal areas (Lacroix and Voegeli 72
2000 Cooke et al 2011) This has resulted in a number of studies of marine post-73
smolt migration towards feeding areas in the ocean (Thorstad et al 2012) but studies 74
of adults during their return migration are still few 75
There appears to be two phases of the marine migration from the ocean to the 76
natal river an initial phase with navigation from feeding areas towards the coast and 77
a second phase with more precise orientation in coastal waters (Hansen et al 1993) 78
This second phase is of special concern since near shore areas are often densely 79
populated and heavily affected by human activities such as boat traffic harbour and 80
industry infrastructure aquaculture pollution and fishing which may affect migration 81
5
patterns (Pierce et al 1990 Smith 1990 Alabaster et al 1991) Near-coastal areas 82
may also be complex habitats forming transition zones between rivers and the ocean 83
being subjects to both marine (tides waves saline water) and riverine influences 84
(freshwater and sediments) To collect basic information about the generally preferred 85
migration pattern the ideal situation is to study the migration in a natural environment 86
with minimal anthropogenic factors possibly influencing the migratory behaviour and 87
progression Such information is required when evaluating the movements in 88
declining populations from areas heavily influenced by for instance obstacles altered 89
water quality and global warming Northern areas like the Alta Fjord where this study 90
was performed are relatively pristine with a sparse human population and little 91
industrial development and other constructions Information about fish migration in 92
these areas may therefore be important in understanding the basic migratory behavior 93
A large number of studies have examined the effects of environmental factors 94
upon the timing of river entry on adult Atlantic salmon based on data from riverine 95
counting fences (eg Dahl et al 2004 Jonsson et al 2007) One challenge associated 96
with detecting relationships between environmental variables and the upstream 97
migration using such methods is the lack of information on how many fish are present 98
downstream of the counting site (Treacutepanier et al 1996) An increase in upstream 99
counts may not necessarily mean that conditions are improved but could reflect 100
increased fish abundance for other reasons (Thorstad et al 2008) or increased 101
detection probability On the contrary environmental conditions may be favourable 102
for upstream migration but count data may show little migration activity if there are 103
no fish available in the area Moreover fish counters are usually placed in fishways 104
traps or dams and the environmental factors important to stimulate salmon to pass 105
such sites may be site specific and different from natural river sections with other or 106
6
no migration barriers (Banks 1969 Thorstad et al 2008) Tagging fish with acoustic 107
transmitters enables us to follow their behaviour both before and during river entry to 108
analyse the impacts of environmental factors on river entry in natural rivers without 109
fishways or other obstacles 110
The aim of this study was to analyse Atlantic salmon migration pattern during 111
the last part of the spawning migration through a pristine coastal area and during river 112
entry using acoustic telemetry methods We tested the following hypotheses 1) The 113
horizontal distribution of Atlantic salmon is closer to the coastline as the fish 114
approach the river mouth since river water may be used as a guide for orientating to 115
the river 2) Swimming depths are closer to the surface as salmon approach the 116
estuary which may happen if olfactory clues from the river in the upper part of the 117
water column facilitate location and recognition the river (Quinn 1990) 3) River entry 118
is stimulated by increased water discharge in the river and occurs mainly during the 119
night and ebb tide according to previous studies based on fish counts (Jonsson 1991 120
Potter et al 1992 Smith and Smith 1997 Jonsson et al 2007) 4) Marine migration 121
speeds decline towards the river mouth which may happen if the fish need time to 122
ensure recognition of the home river and adapt to freshwater (Hansen and Quinn 123
1998) 5) Marine migration speeds increase with increasing river discharge which 124
may happen if increased freshwater supply to the fjord ease river recognition 125
(Thorstad et al 2010) 6) Migration is not affected by recent capture handling and 126
tagging as suggested by Thorstad et al (2000) which may be tested by use of long 127
lifespan telemetry tags enabling the comparison of the return migration between 128
newly captured and tagged fish and fish tagged a year before the homing migration 129
130
131
7
MATERIAL AND METHODS 132
STUDY AREA 133
The Alta Fjord northern Norway (70degN 23degE) is a large open fjord which is 134
15 km at its widest and 488 m at its deepest (Fig 1) The fjord opens through three 135
channels into the Barents Sea The tidal range is 15ndash25 m The River Alta with a 136
catchment area of 7 400 km2 is the major river draining into the fjord The estuary in 137
this study was defined as the first 2 km of the fjord measured from the river mouth 138
(zone 3 and 4) The mean annual water discharge of the river is 75 m3 sminus1 with a 139
spring flood that is occasionally higher than 1000 m3 sminus1 The river length accessible 140
to Atlantic salmon is 47 km and a hydropower plant was constructed above this 141
stretch in 1987 River Alta is one of the northernmost Atlantic salmon rivers in the 142
world with annual in-river catches between 6 and 32 tonnes during 1974ndash2007 143
(Ugedal et al 2008) Adult salmon return to the river during MayndashAugust and the 144
river temperature varies from 3ndash15deg C during this period A small town with 12 000 145
inhabitants is situated at the mouth of the river 146
147
RECORDING OF SALMON BY AUTOMATIC LISTENING STATIONS AND 148
MANUAL TRACKING 149
In 2007 a total of five arrays with automatic listening stations (ALS) (Vemco 150
Inc Canada model VR2) were deployed in the fjord Three arrays were deployed 31 151
km (array 1 21 ALSs) 17 km (array 2 14 ALSs) and 4 km (array 3 11 ALSs) 152
from the river mouth in lines across the fjord with 400 m separating each ALS (Fig 153
1) The ALSs were deployed 5 m below the surface The arrays were divided into 154
eastern side (three ALSs from east) central part and western side (three ALSs from 155
west) Further ten ALSs were deployed at 3 m depth in two arrays in the river outlet 156
8
28 km (array 4 800 m between each ALS) and 2 km (array 5 400 m between each 157
ALS) from the river mouth In addition two ALSs were deployed 2 m below the 158
surface in the river mouth (array 6) and three ALSs 5 km upstream in the river (array 159
7) In 2008 similar arrays were deployed 31 km (array 1) 4 km (array 3) and 2 160
km (array 5) from the river mouth as well as two ALSs in the river mouth (array 161
6) The sea depth exceeded 30 m at all arrays in the fjord When tagged salmon came 162
within the range of 100ndash600 m from an ALS the individual id code depth (for 30 of 163
the tags) and the time were recorded by the ALS (detection range depended on 164
environmental conditions such as currents waves and haloclines) In array 1ndash5 and 165
river mouth (array 6) the first registration of each salmon was used as the time of 166
arrival The last registration of each individual registered in the river mouth was used 167
as the time of river entry To confirm that salmon registered in the river mouth 168
actually entered the river manual tracking in the river was performed from a boat 169
during JulyndashOctober using a VR100 receiver (Vemco Inc Canada) 170
171
RECORDING OF ENVIRONMENTAL VARIABLES 172
Water temperature salinity tidal cycle light intensity water current and wind 173
speed and direction were recorded in the fjord Water temperature and discharge were 174
recorded in the river Salinity and temperature profiles were recorded at every second 175
ALS across array 1ndash3 down to 12 m depth on 6 and 13 July 2007 at low tide using 176
an SD204 conductivity temperature and depth (CTD) sonde (SAIV AS Norway) 177
SD6000 water current meters (Sensordata AS Norway) were placed three meters 178
below the surface at the south-western and north-eastern side of array 3 (Fig 1) 179
recording the direction and speed of the water current every 30 min The CTD- and 180
current meter datasets were analysed gridded and plotted using Matlab704365 181
9
(R14) The tidal range was measured every 10 min with a depth sensing data storage 182
tag (Star-Oddi Iceland model DST-milli-L) placed at the fjord bottom 1 km from the 183
river mouth Light intensities and wind direction were recorded every 15 min with a 184
light meter and an anemometer with a data logger (Onset Computer Corporation 185
USA model HOBO UA-002-64) placed on a small island in the inner part of the fjord 186
(Fig 1) 187
188
FISH CAPTURE AND TAGGING PROCEDURE 189
Eighty-two Atlantic salmon were trapped in 13 different bag nets (Fig 1) in 190
the Alta Fjord during 3ndash25 July 2007 This is a gentle capture method as the salmon 191
swim freely inside the bag net (Thorstad et al 1998) Scale analysis (Lund and 192
Hansen 1991 Fiske et al 2005) confirmed that 74 of the salmon were wild fish and 193
only these were used in this study Based on external sex characteristics these were 194
37 females (mean fork length (LF) = 93 cm range 80ndash109 cm SD = 6 mean mass = 195
96 kg range 65ndash142 kg SD = 19) 22 males (LF = 95 cm range 66ndash110 cm SD 196
= 11 mean mass = 110 kg range 45ndash180 kg SD = 35) and 15 of unknown sex 197
(mean LF = 86 cm range 61ndash98 cm SD = 9 mean mass = 79 kg range 29ndash125 kg 198
SD = 25) There were no significant differences in fork length (Welchrsquos t-test df = 199
57 P = 026) or mass (Welchrsquos t-test df = 56 P = 007) between the sexes 200
According to scale analysis mean smolt age was 41 years (range 3ndash5) Four fish had 201
spawned once and one fish twice before this spawning season The fish had on 202
average spent 29 years (range 1ndash7) from smoltification until they were captured for 203
this study There were no differences between the sexes in age of smoltification 204
(Welchrsquos t-test df = 47 P = 076) or in time from smoltification until capture for 205
this study (Welchrsquos t-test df = 57 P = 045) 206
10
The Atlantic salmon were brought directly from the bag net into a water tank 207
on board a small research vessel for body measurements (fork length and mass) scale 208
sampling and tagging They were tagged with one of four types of individually coded 209
acoustic transmitters Thelma AS Norway model MP‐13 (n=21 13 times 31 mm mass 210
in waterair of 711g) Thelma AS Norway model LP‐16‐short (n=23 16 x 36 mm 211
mass in waterair of 614 g) Vemco Inc Canada model V13P‐1L (n=21 13 times 36 212
mm mass in waterair of 611 g) or Vemco Inc Canada model V16P‐4H (n=9 213
16x71 mm mass in waterair of 1125g) The 30 Vemco transmitters measured depth 214
with a pressure sensor (accuracy 25 m resolution 022 m) and transmitted this 215
information together with the fish identity code All fish were externally tagged under 216
the dorsal fin with a modified Carlin tag with contact and reward information 217
Individuals were anaesthetised by immersion in an aqueous solution of 2-218
phenoxy ethanol in approximately 3 min (EC No 204-589-7 SIGMA Chemical Co 219
USA 05 ml l-1) The transmitter was inserted through a 20ndash30 cm incision on the 220
ventral surface anterior to the pelvic girdle The transmitter was subsequently pushed 221
gently forward into the body cavity The incision was closed using two to three 222
independent silk sutures (20 Ethicon Belgium) Following recovery (5ndash10 minutes) 223
the salmon were transported 300 m away from the bag net (to avoid recapture in the 224
same bag net) and released Mean distance from the release site to the river mouth 225
was 24 km (range 19ndash34 km SD = 4) (Fig 1) 226
To assess possible effects of being newly tagged on fish behaviour the results 227
were compared to a lsquocontrolrsquo group of eight Atlantic salmon that were acoustically 228
tagged in the same river as kelts in May 2007 (see Halttunen et al 2009 for details) 229
and recorded during return migration as multiple spawners more than one year later 230
in 2008 231
11
232
DATA ANALYSES 233
Differences in the horizontal distribution along the different ALS arrays and 234
differences in the horizontal distribution between periods with and without wind were 235
tested with Chi-square tests To take into account the time lag of wind forces on the 236
water currents mean average wind speed and direction from the last two hours before 237
the passage of salmon in the ALS array were used Due to the low number of salmon 238
registered at each ALS array (range 26ndash33) the wind speeds were divided into only 239
two categories ldquono windrdquo was defined as wind speeds less than 30 m s-1 and ldquowindrdquo 240
as wind speeds from 31ndash134 m s-1 (highest measured value) Brackish water was 241
defined as salinity lt 30 242
Since the individual swimming depths had unequal variance difference in 243
swimming depth between the different ALS arrays was tested with Welchrsquos t-test 244
(two-way t-test assuming unequal variance) 245
The relationship between time of river entry and river flow the same day and 246
cumulative changes in river flow from one two and three days before river entry 247
were tested with linear regression analyses To test if salmon entered the river during 248
day or night night was defined as 2000ndash0800 hours which during the study period 249
corresponded to light intensities less than 20 000 lx Chi-square-tests were used to test 250
for differences between river entry at day or night during different stages of the tidal 251
cycle (divided into three hour phases high ebbing low or flooding tide) and between 252
the different combinations of day and night and different stages of the tidal cycle In 253
order to explore if timing of river entry (day-of-the-year day or night river flow tidal 254
cycle) depended on fork length or body mass a redundancy analysis (RDA Legendre 255
and Legendre 1998) was used as ordination method The proportion of the constrained 256
12
inertia (the sum of the variance from all included parameters) from the total inertia 257
was calculated which in RDA gives the proportion of variance The package ldquoVeganrdquo 258
(Oksanen 2008) was used in the software program R 28 (httpwwwr-projectorg) 259
Day and night and the tidal cycle groups were coded as dummy variables 260
Time spent in the different parts of the fjord system and migratory speeds 261
were calculated for those salmon registered at two subsequent ALS arrays Since not 262
all salmon were registered by all arrays the sample sizes for these analyses were 263
smaller than the total number of salmon registered Migratory speed was estimated as 264
individual body lengths (LF) per second and km per day by using the shortest distance 265
between the actual ALS recording the detection and the river mouth thus giving 266
minimum estimates (Thorstad et al 2004) Individual mean and median values were 267
used to calculate the populations mean and median in order to keep the data points 268
independent Differences in swimming speeds between the four zones were tested as 269
unbalanced unreplicated repeated measurements by fitting a linear mixed model using 270
the restricted maximum likelihood (REML) method The resulting zone term in the 271
fitted model was when tested with a likelihood ratio test against the null model The 272
package ldquolme4rdquo (Bates and Maechler 2010) was used in the software program R 212 273
(httpwwwr-projectorg) 274
Relationships between migratory speed and river flow the same day as river 275
entry and cumulative changes in river flow from one two and three days before river 276
entry were tested with linear regression analyses Possible significant p-values were 277
corrected for multiple comparisons using the Bonferroni procedure 278
279
280
RESULTS 281
13
Fifty-nine of the 74 confirmed wild salmon (80) were registered in the river 282
mouth (array 6) and 56 (76) entered the river Of those 15 fish that did not enter 283
the river mouth five were recaptured by anglers in the fjord seven left the fjord 284
(registered in array 1) and the remaining three were only registered some few times 285
at array 2 Genetic assignment tests supported the homing of the 56 salmon to their 286
natal river (JG Davidsen unpublished data) Data from these 56 salmon are used in 287
the following analyses 288
289
ENVIRONMENTAL DATA 290
The river flow in River Alta decreased during the period 5ndash26 July from 130 291
m3 s-1 to 75 m3 s-1 Thereafter it increased again (Fig 2) 292
In summer the surface layer in the Alta Fjord consists of brackish water due 293
to the large freshwater supply from the river The Alta fjord is a wide fjord where the 294
Coriolis effect on the circulation is considerable (Svendsen 1995) allowing cross-295
fjord gradients in current velocities salinity and temperature Theoretically the 296
brackish water would therefore follow the eastern side of the Alta fjord towards the 297
sea This was clearly seen in the conductivity temperature and depth (CTD) sections 298
from July 13 (Fig 3) when the lowest salinities were measured on the eastern side of 299
the fjord on array 1ndash3 (only array 2 and 3 are shown in the figure) One week 300
earlier the vertical salinity gradients were stronger in the upper 4 m while the 301
horizontal gradients were weaker This difference can be explained by the larger river 302
runoff in early July than mid-July combined with stronger winds (up to 8 m s-1) with 303
northerly components spreading the surface water across the fjord Thus in array 1 304
and 2 the brackish water (salinity less than 30) was found only along the eastern side 305
14
on the 13 July while covering the entire fjord section one week earlier At array 3 306
the brackish water covered the upper 3ndash4 m all along the array both days 307
The currents at both current meter locations were highly variable and did not 308
co-vary (Fig 4) Surface temperature varied during the study period between 11 and 309
17 ordmC 310
311
HORIZONTAL DISTRIBUTION 312
Most of the salmon (n = 70 95) were captured tagged and released on the 313
eastern side of the fjord Only four salmon (5) were captured on the western side 314
(Fig 1) When passing the array 2 where 55 of the 56 salmon were registered the 315
horizontal distribution corresponded to the distribution at release (Chi-square test P = 316
022 n = 55) Forty salmon (73) were registered on the eastern side 11 (20) in the 317
central part and four (7) on the western side 318
When passing the array 3 (Fig 1) more salmon migrated in the central and 319
south-western part of the fjord (Chi-square test P lt 0001 n = 55) Twelve salmon 320
(22) were registered on the north-eastern side 23 (42) in the central part and 20 321
(36) on the south-western side In the array 4 and 5 salmon were equally 322
distributed between the eastern (45 46 respectively) and western side (41 323
50 respectively) but only few individuals migrated in the central part (14 4 324
respectively) The horizontal distribution along the third AL array 3 in 2007 differed 325
between periods with and without wind During periods with no wind most salmon 326
passed the array on the north-eastern side while when the wind was blowing from the 327
north (321ndash50deg) most salmon were found in the central part of the array (Chi-square 328
test df = 2 P lt 001) Such difference was not observed when salmon passed array 329
2 4 or 5 330
15
There was no correlation between the passage time at array 3 and the current 331
direction (inout of the fjord) at either the north-eastern (Chi-square test df = 1 P = 332
086) or south-western current meter (Chi-square test df =1 P = 016) (Fig 4) The 333
current speeds (lt 20 cm s-1 Fig 4) were consistently well below the estimated 334
migratory speed of the salmon between the river mouth (array 6) and array 1 335
(average 63 cm s-1) 336
337
SWIMMING DEPTH 338
The mean swimming depth when crossing array 2ndash5 varied from 05ndash24 339
meter (Table 1) When approaching the estuary salmon swam closer to the surface 340
There was no difference in swimming depth between males and females Seven of the 341
lsquocontrolrsquo fish (the fish that returned to the river again in 2008) had depth sensing tags 342
Mean migration depth was 5 m (range 0ndash8 SD = 2) at array 1 4 m (range 0ndash6 SD 343
= 2) at array 3 and 5 m (range 0ndash9 SD = 3) at array 5 which was slightly deeper 344
than the newly tagged fish 345
346
TIMING OF RIVER ENTRY 347
Females entered the river on average six days before the males (Welchrsquos t-test 348
df = 42 P = 002) Timing of river entry did not depend on river flow on the day of 349
entry (r2 = 016 P = 006) or on cumulative changes from one (r2 = 0007 P = 070) 350
two (r2 = 0003 P = 081) or three days before entry (r2 = 0003 P = 080) No 351
difference in the timing of river entry was found in relation to the tides (Table 2) 352
There was also no difference in the timing of river entry (day-of-the-year day or 353
night river flow tidal cycle) in relation to fork length or body mass since only 14 354
16
of the variation (Table 3) of the constrained axes in the redundancy analysis was 355
explained by the timing of river entry between different sizes of salmon 356
There was a clear difference in the light intensities between day (50 000ndash209 424 lx) 357
and night (183ndash20 000 lx) during the study period (5ndash24 July) but no significant 358
difference was observed in the timing of river entry between day and night or in the 359
combination of tidal water and day or night (Table 2) Thirty salmon entered the river 360
during day-time and 26 during night time (Chi-square test df = 1 p-value = 062) 361
362
MIGRATORY SPEEDS 363
Mean migratory speed from release to river entry was 97 km day-1 (01 LF s-364
1) but with large individual variation (n = 54 range 07ndash331 km day-1 SD = 80) 365
The mean speed was lower (Welchrsquos t-test df = 50 P = 0003) from release to the 366
array 2 (93 km day-101 LF s-1 n = 52 range 05ndash710 km day-1 SD = 122) than 367
from array 2 to the river mouth (165 km day-102 LF s-1 n = 51 range 06ndash610 km 368
day-1 SD = 137) Median migratory speed (Fig 5) was fastest in zone 1 (06 LF s-1) 369
and decreased as the fish migrated towards the river mouth (01 LF s-1) (05 LF s-1 04 370
LF s-1and 01 LF s-1for zones 2‐4 respectively Linear mixed‐effects model n = 159 P 371
lt 0001) 372
Migratory speed from ALS array one to the river mouth did not depend on the 373
river flow on the day of river entry (r2 = 0007 P = 055) or on cumulative changes in 374
water flow from one (r2 = 0019 P = 031) two (r2 = 0028 P = 022) or three days 375
before entry (r2 = 0013 P = 041) There was also no relationship between migratory 376
speed in zone four (the last 2 km before river entry) and river flow on the day of river 377
entry (r2 = 0033 P = 029) or changes in river flow from the day before entry (r2 = 378
0037 P = 027) 379
17
For the eight returning Atlantic salmon in 2008 (lsquocontrolrsquo group tagged the 380
year before) the median migratory speed decreased as they approached the inner part 381
of the fjord similar to the newly tagged fish (Fig 5) Median migratory speed from 382
array 1 to the river mouth was 272 km day-1 (range 19ndash538 km day-1 SD = 199) 383
which was higher than when salmon were tagged and initially studied in 2007 384
However while the lsquocontrolrsquo group was registered at array 1 the registrations in 385
2007 started at array 2 Therefore a larger part of the fjord was included in 2008 386
387
388
DISCUSSION 389
These results from the relatively pristine Alta Fjord confirmed the hypothesis 390
that horizontal adult migration path was closer to the coastline as the fish approached 391
the river mouth but the distribution was influenced by brackish water distribution 392
northerly winds spread the brackish water across the fjord and the Atlantic salmon 393
seemed to follow this Further the results supported the hypothesis that the migration 394
occurred closer to the surface as the salmon approached the river mouth however the 395
findings could not confirm that river entry was facilitated by increased water 396
discharge and ebb tide and occurred mainly during the night The results confirmed 397
the hypothesis that the marine migration speed of returning Atlantic salmon declined 398
towards the river mouth however the hypothesis that marine migration speeds 399
increased with increasing river discharge was not supported A similar behaviour 400
between newly tagged fish and those tagged the year before their homing migration 401
supported the hypothesis that the migration pattern was not largely affected by short-402
term capture handling and tagging effects 403
404
18
HORIZONTAL DISTRIBUTION 405
Atlantic salmon generally followed the coastline during their homing 406
migration which may suggest that the coastline was used as a guide for orientating to 407
the river The complex interface between open ocean and up-river migration pose 408
special challenges and salmon may use elements of many orientation systems (Quinn 409
et al 1989 Pascual and Quinn 1991 Olson and Quinn 1993) It is widely accepted 410
that salmon at least partly rely on olfactory information to orientate to their home 411
river (Brannon 1981 Stabell 1982 Quinn 1990) The fact that most of the returning 412
adults were observed on the eastern side in the outer and central part of the fjord 413
where the lowest salinities were measured may suggest that the fish used this side of 414
the fjord because it provided the best conditions to locate and recognise the river At 415
array 3 in the inner part of the fjord the brackish layer covered the entire array and 416
here the returning adults utilized both sides of the fjord 417
Despite finding no correlation between the current direction measured at 3 m 418
depth and migratory pattern at array 3 there was a significant relationship between 419
wind direction and horizontal distribution of salmon when passing this array This 420
may indicate that the salmon distribution was influenced by wind induced spreading 421
of river water across the array The same pattern was observed during the outward 422
post-smolts migration studied in the same fjord in the same year (Davidsen et al 423
2009) 424
Despite the wind induced spreading of river water across the fjord mean 425
migratory speed was always higher than measured current velocities so it seems that 426
salmon had an active swimming behaviour when passing the array 3 In other 427
studies Atlantic salmon have been found to be influenced by the tidal current by 428
19
generally moving with the tide (eg Aprahamian et al 1998) but also to swim with 429
lower ground speed during ebb tide and higher during flood tides (Smith et al 1981) 430
431
SWIMMING DEPTH 432
As salmon approached the estuary they swam closer to the surface Since the 433
brackish water from the river outlet is in the upper part of the water column one 434
explanation for this behaviour may be that they use the brackish water layer to locate 435
and recognise the river (Quinn 1990) The attraction may be due to both the lower 436
salinity level and the river odour Earlier gillnet studies have shown that returning 437
Atlantic salmon usually remain near the surface (1ndash5 m depth) but occasionally make 438
downwards movements in the water column (Stasko et al 1973) Westerberg (1982) 439
and Doslashving et al (1985) reported that Atlantic salmon with acoustic tags moved up 440
and down in the water column in association with fine-scale hydrographic 441
stratification and they both concluded that salmon searched for vertical gradients of 442
odours from the home river rather than horizontal gradients Another reason to 443
migrate closer to the sea surface when approaching the river is to acclimate to the 444
fresh water Quinn (1990) suggested that by migrating in and out of the brackish 445
water layer at the top of the water column in the estuary salmonids can adjust to the 446
salinity of their environment as they make the transition from salt water to freshwater 447
448
TIMING OF RIVER ENTRY 449
Females entered the river in average six days earlier than males which is 450
consistent with findings in other studies (Dahl et al 2004 Niemelauml et al 2006) Dahl 451
et al (2004) suggested that the earlier river entry of female Atlantic salmon may be 452
due to females being older than males when performing their spawning migration 453
20
Several previous studies indicate that older (larger) fish usually arrive earlier than 454
younger (smaller) individuals (Power 1981 Jonsson et al 1990a) However in the 455
present study there were no differences in size or age between the two sexes 456
Changes in river flow did not influence the timing of river entry Increased 457
water discharge appears to be an important proximate factor stimulating adult Atlantic 458
salmon to enter small rivers from the sea (Jonsson et al 2007) However this stimuli 459
may act in combination with other environmental factors such as water temperature 460
light tides and water chemistry (Jonsson 1991 Potter et al 1992 Smith and Smith 461
1997) The fact that no correlation between river flow tidal cycle and river entry was 462
found in this study may be due to the generally large discharge of the River Alta (75ndash463
130 m3 s-1 during the study) In a large river like this it may not be critical for salmon 464
to enter the river at high river flow in order to safely migrate upstream or have the ebb 465
tide to facilitate the recognition of the outflowing fresh water from the home river 466
This is supported by the fact that day-of-the-year day or night time river flow and 467
tidal cycle at the time of river entry in total explained only 14 of the variation 468
between different sizes of the salmon This suggests that parameters other than those 469
included in the analysis may be important for timing of river entry or that timing of 470
river entry in the River Alta simply depends on the time salmon reach the estuary and 471
river mouth If the latter is the case timing of river entry may depend on factors 472
influencing the migration in the outer fjord or open sea 473
It has been suggested that the correlation between increased discharge and the 474
time of river entry in large rivers is not due to the stimulus for Atlantic salmon to 475
enter the river per se but rather that increased freshwater supply to near coastal areas 476
may aid salmon to recognise and find their natal river increasing the number of fish 477
entering fresh water compared to low flow periods (Thorstad et al 2010) In the 478
21
present study there was no correlation between time of river entry and changes in 479
river flow one two and three days before entry However since salmon were tagged 480
and monitored in the last part of the spawning run there may already have been 481
enough freshwater in the fjord system to guide the salmon The observation that river 482
entry not is correlated with river flow in large rivers is also supported by other studies 483
(Dahl et al 2004 Karppinen et al 2004) 484
Adult salmon entered the river during all phases of the tidal cycle It has been 485
suggested that Atlantic salmon entering the river during strong ebb currents may have 486
been attracted by the outward flow of fresh water (Potter et al 1992) However there 487
is little consensus among studies about the relationship between tidal phase and river 488
entry (Potter 1988 Potter et al 1992 Smith and Smith 1997 Karppinen et al 2004) 489
Given the wide variation in the physical chemical and hydrographic characteristics of 490
estuaries this variation in the migratory responses of Atlantic salmon to the tidal 491
cycle is perhaps not surprising (Smith and Smith 1997) In general different sizes 492
forms and shapes of rivers may result in different relationships between Atlantic 493
salmon behaviour and environmental factors 494
The absence of a clear diel pattern in the timing of river mouth passage 495
differed from that observed in a post-smolt study in the River Alta when more post-496
smolts passed the river mouth at night during migration towards the sea (Davidsen et 497
al 2009) Nocturnal migration is thought to be an adaptive behaviour to reduce 498
predation by visual predators like seals (Solomon 1982) and has been observed in 499
several studies of returning Atlantic salmon (eg Potter 1988 Smith and Smith 1997) 500
Even though the northern River Alta is situated on a latitude with midnight sun light 501
intensities were still lower than 20 000 lx at night in contrast to the 50 000ndash200 000 502
lx measured during day time The fact that no difference in the diel migration pattern 503
22
was observed for adult salmon may be because they do not experience the same 504
predation level as the smaller post-smolts 505
506
MIGRATORY SPEEDS 507
The migratory speed slowed as salmon approached the estuary and salmon 508
had a lower migratory speed in the innermost part of the estuary (zone four) than in 509
the open fjord (zone onendashthree) This change in travel rates may be an indication of a 510
physiological need to adapt to the fresh water in the river time to orientate towards 511
the river mouth and to recognise the home river (Hansen and Quinn 1998) or to wait 512
for optimal conditions for upstream migration (Jonsson et al 1990b) The finding of 513
decreasing travel rates when approaching the estuary confirm results from mark and 514
recapture studies (Hansen et al 1993 Hansen and Quinn 1998) 515
516
CONTROL FISH TAGGED THE PRECEDING YEAR 517
The migration behaviour of the eight returning Atlantic salmon in 2008 518
(lsquocontrolrsquo group tagged the year before) did not differ from the newly tagged fish 519
Similar to the newly tagged fish median migratory speed decreased as they 520
approached the inner part of the fjord and the fish migrated close (4ndash5 m) to the 521
surface The migration behaviour seemed therefore not affected by capture handling 522
and tagging This is in accordance with a laboratory study indicating that swimming 523
performance of Atlantic salmon was not affected by transmitters used in the present 524
study (Thorstad et al 2000) To our knowledge this study is first one using multiyear 525
tags to capture the migration behaviour of Atlantic salmon while Welch et al (2011) 526
have used this method on juvenile Pacific salmon 527
528
23
529
ACKNOWLEDGEMENTS 530
This study was financed by the Norwegian Research Council (project no 531
17601S40) the Norwegian Institute for Nature Research the Directorate for Nature 532
Management and the University of Tromsoslash The Norwegian Water Resources and 533
Energy Directorate provided data on the river flow The crew onboard the Research 534
Vessel ldquoJohan Ruudrdquo the staff at Alta Laksefiskeri Interessentselskap (ALI) the local 535
bag net fishermen Amund Suhr Anette Grimsrud Davidsen Cedar Chittenden and 536
Jenny Jensen are all thanked for their extensive help during the field work and Gunnel 537
Oslashstborg for scale analyses Helge Meissner is thanked for assistance with genotyping 538
and Svein-Erik Fevolden and Anne K Praeligbel for valuable discussions concerning the 539
genetics Timothy Sheehan and two anonymous referees are thanked for their valuable 540
comments on an earlier version of the manuscript The experimental procedures 541
concur with the national ethical requirements and were approved by the Norwegian 542
National Animal Research Authority 543
544
24
545
REFERENCES 546
547
Alabaster JS Gough PJ and Brooker WJ 1991 The environmental requirements 548
of Atlantic salmon Salmo salar L during their passage through the Thames 549
estuary 1982-89 J Fish Biol 38 741-762 550
Aprahamian MW Jones GO and Gough PJ 1998 Movement of adult Atlantic 551
salmon in the Usk estuary Wales J Fish Biol 53 221-225 552
Banks JW 1969 A review of the litterature on the upstream migration of adult 553
salmonids J Fish Biol 1 85-136 554
Bates D and Maechler M (2010) Package ldquolme4rdquo Reference manual for the 555
package Available at httpcranr-projectorgwebpackageslme4lme4pdf 556
(Assessed 22062012) 557
Brannon EL 1981 Orientation mechanisms of homing salmonids In Salmon and 558
trout migratory behaviour symposium Edited by EL Brannon and EO Salo 559
University of Washington Seattle pp 219-227 560
Cooke SJ Iverson SJ Stokesbury MJW Hinch SG Fisk AT Smith P 561
VanderZwaag D Brattey J and Whoriskey F 2011 Ocean Tracking 562
Network Canada A network approach to addressing critical issues in fisheries 563
and resource management with implications for ocean governance Fisheries 564
36 583-592 565
Dahl J Dannewitz J Karlsson L Petersson E Loumlf A and Ragnarsson B 2004 566
The timing of spawning migration implications of environmental variation 567
life history and sex Can J Zool 82 1864-1870 568
25
Davidsen JG Rikardsen AH Halttunen E Thorstad EB Oslashkland F Letcher 569
BH Skarethhamar J and Naeligsje TF 2009 Migratory behaviour and survival 570
rates of wild northern Atlantic salmon (Salmo salar) post-smolts effects of 571
environmental factors J Fish Biol 75 1700-1718 572
Doslashving KB Westergaringrd H and Johnsen PB 1985 Role of olfaction in the 573
behavioural and neuronal responses of Atlantic salmon Salmo salar to 574
hydrographic stratification Can J Fish Aquat Sci 42 1658-1667 575
Fiske P Lund RA and Hansen LP 2005 Identifying fish farm escapees In Stock 576
identification methods Edited by SX Cadrin KD Friedland and JD 577
Waldman Elsevier Academic Press Amsterdam pp 659-680 578
Halttunen E Rikardsen AH Davidsen JG Thorstad EB and Dempson JB 579
2009 Survival migration speed and swimming depth of Atlantic salmon kelts 580
during sea entry and fjord migration In Tagging and tracking of Marine 581
Animals with Electronic Devices Reviews Methods and Technologies in Fish 582
Biology and Fisheries 9 Edited by JL Nielsen H Arrizabalaga N Fragoso 583
A Hobday M Lutcavage and J Sibert Springer Dordrecht pp 35-49 584
Hansen LP Jonsson N and Jonsson B 1993 Oceanic migration in homing 585
Atlantic salmon Anim Behav 45 927-941 586
Hansen LP and Quinn TP 1998 The marine phase of the Atlantic salmon (Salmo 587
salar) life cycle with comparisons to pacific salmon Can J Fish Aquat Sci 588
55 104-118 589
Heggberget TG Oslashkland F and Ugedal O 1993 Distribution and migratory 590
behaviour of adult wild and farmed Atlantic salmon (Salmo salar) during 591
return migration Aquaculture 118 73-83 592
ICES (2011) Report of the Working Group on North Atlantic Salmon (WGNAS) 593
26
ICES 2011ACOM09 286 pp Available at 594
httpwwwicesdkreportsACOM2011WGNASwgnas_2011_finalpdf 595
(Assessed 22062012) 596
Jonsson B Jonsson N and Hansen LP 1990a Does juvenile experience affect 597
migration and spawning of adult Atlantic salmon Behav Ecol Sociobiol 26 598
225-230 599
Jonsson B Jonsson N and Hansen LP 2007 Factors affecting river entry of adult 600
Atlantic salmon in a small river J Fish Biol 71 943-956 601
Jonsson N 1991 Influence of water flow water temperature and light on fish 602
migration in rivers Nord J Freshwat Res 66 20-35 603
Jonsson N Jonsson B and Hansen LP 1990b Partial segregation in the timing of 604
migration of Atlantic salmon of different ages Anim Behav 40 313-321 605
Karppinen P Erkinaro J Niemelauml E Moen K and Oslashkland F 2004 Return 606
migration of one-sea-winter Atlantic salmon in the River Tana J Fish Biol 607
64 1179-1192 608
Lacroix GL and Voegeli FA 2000 Development of automated monitoring 609
systems for ultrasonic transmitters In Fish Telemetry Proceedings of the 3rd 610
Conference on Fish Telemetry in Europe Edited by A Moore and IC 611
Russell CEFAS Lowestoft UK pp 37-50 612
Legendre P and Legendre L 1998 Numerical ecology p 853 Elsevier Science BV 613
Amsterdam 614
Lund RA and Hansen LP 1991 Identification of wild and reared Atlantic salmon 615
Salmo salar L using scale characters Aquacult Fish Manage 22 499-508 616
Niemelauml E Orell P Erkinaro J Dempson J Broslashrs S Svenning M and 617
Hassinen E 2006 Previously spawned Atlantic salmon ascend a large 618
27
subarctic river earlier than their maiden counterparts J Fish Biol 69 1151ndash619
1163 620
Olson AF and Quinn TP 1993 Vertical and horizontal movements of adult 621
chinook salmon Oncorhynchus tshawytscha in the Columbia River estuary 622
Fishery Bulletin of the Fish and Wildlife Service 91 171-178 623
Parrish DL Behnke RJ Gephard SR McCormick SD and Reeves GH 1998 624
Why arenrsquot there more Atlantic salmon (Salmo salar) Can J Fish Aquat 625
Sci 55 281-287 626
Pascual MA and Quinn TP 1991 Evaluation of alternative models of the coastal 627
migration of adult Fraser River sockeye salmon (Oncorhynchus nerka) Can J 628
Fish Aquat Sci 48 799-810 629
Pierce GJ Boyle PR and Thompson PM 1990 Diet selection by seals In 630
Trophic Relationships in the Marine Environment Edited by M Barnes and 631
RN Gibson Aberdeen University Press Aberdeen pp 222-238 632
Potter ECE 1988 Movements of Atlantic salmon Salmo salar L in an estuary in 633
south-west England J Fish Biol 33 153-159 634
Potter ECE Solomon DJ and Buckley AA 1992 Estuarine movements of adult 635
Atlantic salmon (Salmo salar L) in Christchurch Harbour southern England 636
In Wildlife telemetry remote monitoring and tracking of animals Edited by 637
IG Priede and SM Swift Ellis Horwood Limited Chichester England pp 638
400-409 639
Power G 1981 Stock Characteristics and Catches of Atlantic Salmon (Salmo salar) 640
in Quebec and Newfoundland and Labrador in Relation to Environmental 641
Variables Can J Fish Aquat Sci 38 1601-1611 642
28
Quinn TP 1990 Current controversies in the study of salmon homing Ethol Ecol 643
Evol 2(1) 49-63 644
Quinn TP Terahart BA and Groot C 1989 Migratory orientation and vertical 645
movements of homing adult sockeye salmon Oncorhynchus nerka in coastal 646
waters Anim Behav 37 587-599 647
Smith GW 1990 The relationship between river flow and net catches of salmon 648
(Salmo salar L) in and around the mouth of the Aberdeenshire Dee between 649
1973 and 1986 Fish Res 10 73-91 650
Smith GW Hawkins AD Urquhart GG and Shearer WM 1981 Orientation 651
and energetic efficiency in the offshore movements of returning Atlantic 652
salmon Salmo salar L Scott Fish Res Rep 21 1-22 653
Smith IP and Smith GW 1997 Tidal and diel timing of river entry by adult 654
Atlantic salmon returning to the Aberdeenshire Dee Scotland J Fish Biol 50 655
463-474 656
Solomon DJ 1982 Smolt migration in Atlantic salmon (Salmo salar L) and sea 657
trout (Salmo trutta L) In Salmon and trout migratory behavior symposium 658
Edited by EL Brannon and EO Salo University of Washington Seattle pp 659
196-203 660
Stabell OB 1982 Homing of Atlantic salmon in relation to olfaction and genetics In 661
Salmon and trout migratory behaviour symposium Edited by EL Brannon 662
and EO Salo University of Washington Seattle pp 238-246 663
Stasko AB Sutterlin AM Rommel SAj and Elson PF 1973 Migration-664
orientation of Atlantic salmon (Salmo salar L) In International Atlantic 665
Salmon Symposium Special Publication Series Edited by MW Smith and 666
29
WM Carter International Atlantic Salmon Foundation New York pp 119-667
137 668
Svendsen H 1995 Physical oceanography of coupled fjord-coast systems in northern 669
Norway with special focus on frontal dynamics and tides In Ecology of fjords 670
and coastal waters Edited by HR Skjoldal C Hopkins KJ Erikstad and 671
HP Leinaas Elsevier Science Publ B V Amsterdam pp 149-164 672
Thorstad EB Heggberget TG and Oslashkland F 1998 Migratory behaviour of adult 673
wild and escaped farmed Atlantic salmon Salmo salar L before during and 674
after spawning in a Norwegian river Aquacult Res 29 419-428 675
Thorstad EB Whoriskey F Uglem I Moore A Rikardsen AH and Finstad B 676
2012 A critical life stage of the Atlantic salmon Salmo salar behaviour and 677
survival during the smolt and initial post-smolt migration J Fish Biol 81 678
500-542 679
Thorstad EB Whoriskey FG Rikardsen AH and Aarestrup K 2010 Aquatic 680
nomads the life and migrations of the Atlantic salmon In Atlantic Salmon 681
Ecology Edited by Oslash Aas S Einum A Klemetsen and J Skurdal Wiley-682
Blackwell New York pp 1-32 683
Thorstad EB Oslashkland F Aarestrup K and Heggberget TG 2008 Factors 684
affecting the within-river spawning migration of Atlantic salmon with 685
emphasis on human impacts Rev Fish Biol Fish 18 345-371 686
Thorstad EB Oslashkland F and Finstad B 2000 Effects of telemetry transmitters on 687
swimming performance of adult Atlantic salmon J Fish Biol 57 531-535 688
Treacutepanier S Rodriacuteguez MA and Magnan P 1996 Spawning migrations in 689
landlocked Atlantic salmon time series modelling of river discharge and water 690
temperature effects J Fish Biol 48 925-936 691
30
Ugedal O Naeligsje TF Thorstad EB Forseth T Saksgaringrd L and Heggberget 692
TG 2008 Twenty years of hydropower regulation in the River Alta long 693
term changes in abundance of juvenile and adult Atlantic salmon 694
Hydrobiologia 609 9-23 695
Welch DW Melnychuk MC Payne JC Rechisky EL Porter AD Jackson 696
GD Ward BR Vincent SP Wood CC and Semmens J 2011 In situ 697
Measurement of Coastal Ocean Movements and Survival of Juvenile Pacific 698
Salmon Proc Natl Acad Sci USA 108 8708-8713 699
Westerberg H 1982 Ultrasonic tracking of Atlantic salmon (Salmo salar L) ndash II 700
Swimming depth and temperature stratification Rep Inst Fresh Res 701
Drottningholm 60 102-120 702
1
TABLES 1
Table 1 Mean swimming depth registered at the time Atlantic salmon (Salmo salar) passed 2
the array 2ndash5 in the Alta Fjord Mean values are based on individual means Welchrsquos t-test 3
was used to test for significant difference between male and female swimming depth 4
5
ALS
Array
n
Mean
(m)
SD individual
mean (range)
(m)
Deepest
individual
recording
(m)
Mean
depth
females
(m)
Mean
depth
males
(m)
p-value
(between
sexes)
2 23 24 37 (00ndash161) 297 26 18 057
3 24 11 15 (00ndash64) 189 09 14 036
4 18 15 19 (00ndash67) 109 14 17 075
5 21 05 07 (00ndash18) 146 04 09 018
2
Table 2 Comparisons of the number and proportions of homing Atlantic salmon (Salmo 6
salar) entering the river during 1) different stages of the tidal cycle and 2) for different 7
combinations of day and night and different stages of the tidal cycle Chi-square-tests were 8
used to test for differences between different stages of the tidal cycle and between the 9
different combinations of day and night and different stages of the tidal cycle 10
11
Number
(n =56) P-value
High tide 15 27
Ebbing tide 13 23
Low tide 9 16
Flooding tide 19 34 029
High tide day time 7 13
High tide night time 8 14
Ebbing tide day time 7 13
Ebbing tide night time 6 11
Low tide day time 5 9
Low tide night time 4 7
Flooding tide day time 11 20
Flooding tide night time 8 14 071
12
3
Table 3 Results from a redundancy analysis (RDA) exploring whether timing of river entry 13
(day-of-the-year day or night river flow tidal cycle) of Atlantic salmon (Salmo salar) 14
depended on fork length or body mass The proportion of constrained and unconstrained 15
inertia (the sum of the variance from all included parameters) from total inertia was 16
calculated which in RDA gives the proportion of variance 17
18
19
Inertia Proportion
Total 20000 10000
Constrained 02846 01423
Unconstrained 17154 08577
0
N
5
km RiverAlta
Alta Fjord
70deg30deg20deg
65deg
Norway Sweden
Finland
1
2
34
5
Z 1Z 1 Z 2Z 2
Z 3Z 3Z 4Z 47 6
10
11
12
13
14
15
16
40
50
60
70
80
90
100
110
120
130
140
57 127 197 267 28
Tem
pera
ture
(degC
)
Riv
er fl
ow (m
3 s-1
)
Date 2007
0 7 0 7 1 0 0 7 1 3 0 7 1 6 0 7 1 9 0 7 2 2 0 7 2 5 0 7 - 1 0
- 5
0
5
1 0
1 5
2 0
0 7 0 7 1 0 0 7 1 3 0 7 1 6 0 7 1 9 0 7 2 2 0 7 2 5 0 7 - 1 0
- 5
0
5
1 0
1 5
2 0
Cur
rent
vel
ocity
com
pone
nt (c
m s-1
) C
urre
nt v
eloc
ity c
ompo
nent
(cm
s-1
)
Date 2007
12
34
00 05 10 15 20
Fjord zone (year 2007)
Migratory speed (bl sminus1)
AB
C
00 05 10 15 20
Fjord zone (year 2008)
Migratory speed (bl sminus1)
1
FIGURE CAPTIONS 1
2
Figure 1 Map of the lower part of River Alta and the Alta Fjord showing the position 3
of the bag nets ( ) and the release sites ( ) ALS array 1 is indicated with () while 4
ALS arrays 2ndash5 are indicated by grey and black lines Most fish passed these ALSs in the 5
darker parts of the lines The two ALSs in the river mouth (array 6) and the three ALSs 6
(array 7) in the river are given by () The map also shows the position of the two current 7
meters in ALS array 3 ( ) the four zones (Z1ndash4) and the weather station () In the 8
following year (2008) were only array 1 3 5 and 6 present 9
10
11
Figure 2 Daily river flow (- - - - -) and water temperature (___) in the River Alta 12
13
14
Figure 3 Salinity distribution recorded at 0ndash12 m depth across ALS array 2 (a amp c) and ALS 15
array 3 (b amp d) in the Alta Fjord on 6 July (a amp b) and 13 July (c amp d) 2007 16
17
18
Figure 4 Current velocity components at 3 m depth at the north-eastern (upper panel) and 19
south-western (lower panel) side of the Alta Fjord at the ALS array 3 Positive values are 20
towards the fjord head and negative values are towards the fjord mouth indicates time of 21
individual Atlantic salmon (Salmo salar) passage 22
23
2
Figure 5 Migratory speeds of homing Atlantic salmon (Salmo salar) in the Alta Fjord in 2007 24
and 2008 In 2007 the fjord was divided into four zones (see map Fig 1) In 2008 zone A 25
was the area from ALS1ndash3 zone B from ALS3ndash5 and zone C from ALS5ndash6 The box-26
and-whisker plots give the median values (black lines) the interquartile ranges (box 50 of 27
the data falling into this) and the 5th and 95th percentiles (whiskers) 28
29
- cjfas-2012-0352-final1
-
- Homing behaviour of Atlantic salmon (Salmo salar) during final phase of marine migration and river entry
-
- Table 1-3
- Figure 1
- Figure 2
-
- Slide Number 1
-
- Figure 3
-
- Slide Number 1
-
- Figure 4
-
- Slide Number 1
-
- Figure 5
- FIGURE CAPTIONS
-

5
patterns (Pierce et al 1990 Smith 1990 Alabaster et al 1991) Near-coastal areas 82
may also be complex habitats forming transition zones between rivers and the ocean 83
being subjects to both marine (tides waves saline water) and riverine influences 84
(freshwater and sediments) To collect basic information about the generally preferred 85
migration pattern the ideal situation is to study the migration in a natural environment 86
with minimal anthropogenic factors possibly influencing the migratory behaviour and 87
progression Such information is required when evaluating the movements in 88
declining populations from areas heavily influenced by for instance obstacles altered 89
water quality and global warming Northern areas like the Alta Fjord where this study 90
was performed are relatively pristine with a sparse human population and little 91
industrial development and other constructions Information about fish migration in 92
these areas may therefore be important in understanding the basic migratory behavior 93
A large number of studies have examined the effects of environmental factors 94
upon the timing of river entry on adult Atlantic salmon based on data from riverine 95
counting fences (eg Dahl et al 2004 Jonsson et al 2007) One challenge associated 96
with detecting relationships between environmental variables and the upstream 97
migration using such methods is the lack of information on how many fish are present 98
downstream of the counting site (Treacutepanier et al 1996) An increase in upstream 99
counts may not necessarily mean that conditions are improved but could reflect 100
increased fish abundance for other reasons (Thorstad et al 2008) or increased 101
detection probability On the contrary environmental conditions may be favourable 102
for upstream migration but count data may show little migration activity if there are 103
no fish available in the area Moreover fish counters are usually placed in fishways 104
traps or dams and the environmental factors important to stimulate salmon to pass 105
such sites may be site specific and different from natural river sections with other or 106
6
no migration barriers (Banks 1969 Thorstad et al 2008) Tagging fish with acoustic 107
transmitters enables us to follow their behaviour both before and during river entry to 108
analyse the impacts of environmental factors on river entry in natural rivers without 109
fishways or other obstacles 110
The aim of this study was to analyse Atlantic salmon migration pattern during 111
the last part of the spawning migration through a pristine coastal area and during river 112
entry using acoustic telemetry methods We tested the following hypotheses 1) The 113
horizontal distribution of Atlantic salmon is closer to the coastline as the fish 114
approach the river mouth since river water may be used as a guide for orientating to 115
the river 2) Swimming depths are closer to the surface as salmon approach the 116
estuary which may happen if olfactory clues from the river in the upper part of the 117
water column facilitate location and recognition the river (Quinn 1990) 3) River entry 118
is stimulated by increased water discharge in the river and occurs mainly during the 119
night and ebb tide according to previous studies based on fish counts (Jonsson 1991 120
Potter et al 1992 Smith and Smith 1997 Jonsson et al 2007) 4) Marine migration 121
speeds decline towards the river mouth which may happen if the fish need time to 122
ensure recognition of the home river and adapt to freshwater (Hansen and Quinn 123
1998) 5) Marine migration speeds increase with increasing river discharge which 124
may happen if increased freshwater supply to the fjord ease river recognition 125
(Thorstad et al 2010) 6) Migration is not affected by recent capture handling and 126
tagging as suggested by Thorstad et al (2000) which may be tested by use of long 127
lifespan telemetry tags enabling the comparison of the return migration between 128
newly captured and tagged fish and fish tagged a year before the homing migration 129
130
131
7
MATERIAL AND METHODS 132
STUDY AREA 133
The Alta Fjord northern Norway (70degN 23degE) is a large open fjord which is 134
15 km at its widest and 488 m at its deepest (Fig 1) The fjord opens through three 135
channels into the Barents Sea The tidal range is 15ndash25 m The River Alta with a 136
catchment area of 7 400 km2 is the major river draining into the fjord The estuary in 137
this study was defined as the first 2 km of the fjord measured from the river mouth 138
(zone 3 and 4) The mean annual water discharge of the river is 75 m3 sminus1 with a 139
spring flood that is occasionally higher than 1000 m3 sminus1 The river length accessible 140
to Atlantic salmon is 47 km and a hydropower plant was constructed above this 141
stretch in 1987 River Alta is one of the northernmost Atlantic salmon rivers in the 142
world with annual in-river catches between 6 and 32 tonnes during 1974ndash2007 143
(Ugedal et al 2008) Adult salmon return to the river during MayndashAugust and the 144
river temperature varies from 3ndash15deg C during this period A small town with 12 000 145
inhabitants is situated at the mouth of the river 146
147
RECORDING OF SALMON BY AUTOMATIC LISTENING STATIONS AND 148
MANUAL TRACKING 149
In 2007 a total of five arrays with automatic listening stations (ALS) (Vemco 150
Inc Canada model VR2) were deployed in the fjord Three arrays were deployed 31 151
km (array 1 21 ALSs) 17 km (array 2 14 ALSs) and 4 km (array 3 11 ALSs) 152
from the river mouth in lines across the fjord with 400 m separating each ALS (Fig 153
1) The ALSs were deployed 5 m below the surface The arrays were divided into 154
eastern side (three ALSs from east) central part and western side (three ALSs from 155
west) Further ten ALSs were deployed at 3 m depth in two arrays in the river outlet 156
8
28 km (array 4 800 m between each ALS) and 2 km (array 5 400 m between each 157
ALS) from the river mouth In addition two ALSs were deployed 2 m below the 158
surface in the river mouth (array 6) and three ALSs 5 km upstream in the river (array 159
7) In 2008 similar arrays were deployed 31 km (array 1) 4 km (array 3) and 2 160
km (array 5) from the river mouth as well as two ALSs in the river mouth (array 161
6) The sea depth exceeded 30 m at all arrays in the fjord When tagged salmon came 162
within the range of 100ndash600 m from an ALS the individual id code depth (for 30 of 163
the tags) and the time were recorded by the ALS (detection range depended on 164
environmental conditions such as currents waves and haloclines) In array 1ndash5 and 165
river mouth (array 6) the first registration of each salmon was used as the time of 166
arrival The last registration of each individual registered in the river mouth was used 167
as the time of river entry To confirm that salmon registered in the river mouth 168
actually entered the river manual tracking in the river was performed from a boat 169
during JulyndashOctober using a VR100 receiver (Vemco Inc Canada) 170
171
RECORDING OF ENVIRONMENTAL VARIABLES 172
Water temperature salinity tidal cycle light intensity water current and wind 173
speed and direction were recorded in the fjord Water temperature and discharge were 174
recorded in the river Salinity and temperature profiles were recorded at every second 175
ALS across array 1ndash3 down to 12 m depth on 6 and 13 July 2007 at low tide using 176
an SD204 conductivity temperature and depth (CTD) sonde (SAIV AS Norway) 177
SD6000 water current meters (Sensordata AS Norway) were placed three meters 178
below the surface at the south-western and north-eastern side of array 3 (Fig 1) 179
recording the direction and speed of the water current every 30 min The CTD- and 180
current meter datasets were analysed gridded and plotted using Matlab704365 181
9
(R14) The tidal range was measured every 10 min with a depth sensing data storage 182
tag (Star-Oddi Iceland model DST-milli-L) placed at the fjord bottom 1 km from the 183
river mouth Light intensities and wind direction were recorded every 15 min with a 184
light meter and an anemometer with a data logger (Onset Computer Corporation 185
USA model HOBO UA-002-64) placed on a small island in the inner part of the fjord 186
(Fig 1) 187
188
FISH CAPTURE AND TAGGING PROCEDURE 189
Eighty-two Atlantic salmon were trapped in 13 different bag nets (Fig 1) in 190
the Alta Fjord during 3ndash25 July 2007 This is a gentle capture method as the salmon 191
swim freely inside the bag net (Thorstad et al 1998) Scale analysis (Lund and 192
Hansen 1991 Fiske et al 2005) confirmed that 74 of the salmon were wild fish and 193
only these were used in this study Based on external sex characteristics these were 194
37 females (mean fork length (LF) = 93 cm range 80ndash109 cm SD = 6 mean mass = 195
96 kg range 65ndash142 kg SD = 19) 22 males (LF = 95 cm range 66ndash110 cm SD 196
= 11 mean mass = 110 kg range 45ndash180 kg SD = 35) and 15 of unknown sex 197
(mean LF = 86 cm range 61ndash98 cm SD = 9 mean mass = 79 kg range 29ndash125 kg 198
SD = 25) There were no significant differences in fork length (Welchrsquos t-test df = 199
57 P = 026) or mass (Welchrsquos t-test df = 56 P = 007) between the sexes 200
According to scale analysis mean smolt age was 41 years (range 3ndash5) Four fish had 201
spawned once and one fish twice before this spawning season The fish had on 202
average spent 29 years (range 1ndash7) from smoltification until they were captured for 203
this study There were no differences between the sexes in age of smoltification 204
(Welchrsquos t-test df = 47 P = 076) or in time from smoltification until capture for 205
this study (Welchrsquos t-test df = 57 P = 045) 206
10
The Atlantic salmon were brought directly from the bag net into a water tank 207
on board a small research vessel for body measurements (fork length and mass) scale 208
sampling and tagging They were tagged with one of four types of individually coded 209
acoustic transmitters Thelma AS Norway model MP‐13 (n=21 13 times 31 mm mass 210
in waterair of 711g) Thelma AS Norway model LP‐16‐short (n=23 16 x 36 mm 211
mass in waterair of 614 g) Vemco Inc Canada model V13P‐1L (n=21 13 times 36 212
mm mass in waterair of 611 g) or Vemco Inc Canada model V16P‐4H (n=9 213
16x71 mm mass in waterair of 1125g) The 30 Vemco transmitters measured depth 214
with a pressure sensor (accuracy 25 m resolution 022 m) and transmitted this 215
information together with the fish identity code All fish were externally tagged under 216
the dorsal fin with a modified Carlin tag with contact and reward information 217
Individuals were anaesthetised by immersion in an aqueous solution of 2-218
phenoxy ethanol in approximately 3 min (EC No 204-589-7 SIGMA Chemical Co 219
USA 05 ml l-1) The transmitter was inserted through a 20ndash30 cm incision on the 220
ventral surface anterior to the pelvic girdle The transmitter was subsequently pushed 221
gently forward into the body cavity The incision was closed using two to three 222
independent silk sutures (20 Ethicon Belgium) Following recovery (5ndash10 minutes) 223
the salmon were transported 300 m away from the bag net (to avoid recapture in the 224
same bag net) and released Mean distance from the release site to the river mouth 225
was 24 km (range 19ndash34 km SD = 4) (Fig 1) 226
To assess possible effects of being newly tagged on fish behaviour the results 227
were compared to a lsquocontrolrsquo group of eight Atlantic salmon that were acoustically 228
tagged in the same river as kelts in May 2007 (see Halttunen et al 2009 for details) 229
and recorded during return migration as multiple spawners more than one year later 230
in 2008 231
11
232
DATA ANALYSES 233
Differences in the horizontal distribution along the different ALS arrays and 234
differences in the horizontal distribution between periods with and without wind were 235
tested with Chi-square tests To take into account the time lag of wind forces on the 236
water currents mean average wind speed and direction from the last two hours before 237
the passage of salmon in the ALS array were used Due to the low number of salmon 238
registered at each ALS array (range 26ndash33) the wind speeds were divided into only 239
two categories ldquono windrdquo was defined as wind speeds less than 30 m s-1 and ldquowindrdquo 240
as wind speeds from 31ndash134 m s-1 (highest measured value) Brackish water was 241
defined as salinity lt 30 242
Since the individual swimming depths had unequal variance difference in 243
swimming depth between the different ALS arrays was tested with Welchrsquos t-test 244
(two-way t-test assuming unequal variance) 245
The relationship between time of river entry and river flow the same day and 246
cumulative changes in river flow from one two and three days before river entry 247
were tested with linear regression analyses To test if salmon entered the river during 248
day or night night was defined as 2000ndash0800 hours which during the study period 249
corresponded to light intensities less than 20 000 lx Chi-square-tests were used to test 250
for differences between river entry at day or night during different stages of the tidal 251
cycle (divided into three hour phases high ebbing low or flooding tide) and between 252
the different combinations of day and night and different stages of the tidal cycle In 253
order to explore if timing of river entry (day-of-the-year day or night river flow tidal 254
cycle) depended on fork length or body mass a redundancy analysis (RDA Legendre 255
and Legendre 1998) was used as ordination method The proportion of the constrained 256
12
inertia (the sum of the variance from all included parameters) from the total inertia 257
was calculated which in RDA gives the proportion of variance The package ldquoVeganrdquo 258
(Oksanen 2008) was used in the software program R 28 (httpwwwr-projectorg) 259
Day and night and the tidal cycle groups were coded as dummy variables 260
Time spent in the different parts of the fjord system and migratory speeds 261
were calculated for those salmon registered at two subsequent ALS arrays Since not 262
all salmon were registered by all arrays the sample sizes for these analyses were 263
smaller than the total number of salmon registered Migratory speed was estimated as 264
individual body lengths (LF) per second and km per day by using the shortest distance 265
between the actual ALS recording the detection and the river mouth thus giving 266
minimum estimates (Thorstad et al 2004) Individual mean and median values were 267
used to calculate the populations mean and median in order to keep the data points 268
independent Differences in swimming speeds between the four zones were tested as 269
unbalanced unreplicated repeated measurements by fitting a linear mixed model using 270
the restricted maximum likelihood (REML) method The resulting zone term in the 271
fitted model was when tested with a likelihood ratio test against the null model The 272
package ldquolme4rdquo (Bates and Maechler 2010) was used in the software program R 212 273
(httpwwwr-projectorg) 274
Relationships between migratory speed and river flow the same day as river 275
entry and cumulative changes in river flow from one two and three days before river 276
entry were tested with linear regression analyses Possible significant p-values were 277
corrected for multiple comparisons using the Bonferroni procedure 278
279
280
RESULTS 281
13
Fifty-nine of the 74 confirmed wild salmon (80) were registered in the river 282
mouth (array 6) and 56 (76) entered the river Of those 15 fish that did not enter 283
the river mouth five were recaptured by anglers in the fjord seven left the fjord 284
(registered in array 1) and the remaining three were only registered some few times 285
at array 2 Genetic assignment tests supported the homing of the 56 salmon to their 286
natal river (JG Davidsen unpublished data) Data from these 56 salmon are used in 287
the following analyses 288
289
ENVIRONMENTAL DATA 290
The river flow in River Alta decreased during the period 5ndash26 July from 130 291
m3 s-1 to 75 m3 s-1 Thereafter it increased again (Fig 2) 292
In summer the surface layer in the Alta Fjord consists of brackish water due 293
to the large freshwater supply from the river The Alta fjord is a wide fjord where the 294
Coriolis effect on the circulation is considerable (Svendsen 1995) allowing cross-295
fjord gradients in current velocities salinity and temperature Theoretically the 296
brackish water would therefore follow the eastern side of the Alta fjord towards the 297
sea This was clearly seen in the conductivity temperature and depth (CTD) sections 298
from July 13 (Fig 3) when the lowest salinities were measured on the eastern side of 299
the fjord on array 1ndash3 (only array 2 and 3 are shown in the figure) One week 300
earlier the vertical salinity gradients were stronger in the upper 4 m while the 301
horizontal gradients were weaker This difference can be explained by the larger river 302
runoff in early July than mid-July combined with stronger winds (up to 8 m s-1) with 303
northerly components spreading the surface water across the fjord Thus in array 1 304
and 2 the brackish water (salinity less than 30) was found only along the eastern side 305
14
on the 13 July while covering the entire fjord section one week earlier At array 3 306
the brackish water covered the upper 3ndash4 m all along the array both days 307
The currents at both current meter locations were highly variable and did not 308
co-vary (Fig 4) Surface temperature varied during the study period between 11 and 309
17 ordmC 310
311
HORIZONTAL DISTRIBUTION 312
Most of the salmon (n = 70 95) were captured tagged and released on the 313
eastern side of the fjord Only four salmon (5) were captured on the western side 314
(Fig 1) When passing the array 2 where 55 of the 56 salmon were registered the 315
horizontal distribution corresponded to the distribution at release (Chi-square test P = 316
022 n = 55) Forty salmon (73) were registered on the eastern side 11 (20) in the 317
central part and four (7) on the western side 318
When passing the array 3 (Fig 1) more salmon migrated in the central and 319
south-western part of the fjord (Chi-square test P lt 0001 n = 55) Twelve salmon 320
(22) were registered on the north-eastern side 23 (42) in the central part and 20 321
(36) on the south-western side In the array 4 and 5 salmon were equally 322
distributed between the eastern (45 46 respectively) and western side (41 323
50 respectively) but only few individuals migrated in the central part (14 4 324
respectively) The horizontal distribution along the third AL array 3 in 2007 differed 325
between periods with and without wind During periods with no wind most salmon 326
passed the array on the north-eastern side while when the wind was blowing from the 327
north (321ndash50deg) most salmon were found in the central part of the array (Chi-square 328
test df = 2 P lt 001) Such difference was not observed when salmon passed array 329
2 4 or 5 330
15
There was no correlation between the passage time at array 3 and the current 331
direction (inout of the fjord) at either the north-eastern (Chi-square test df = 1 P = 332
086) or south-western current meter (Chi-square test df =1 P = 016) (Fig 4) The 333
current speeds (lt 20 cm s-1 Fig 4) were consistently well below the estimated 334
migratory speed of the salmon between the river mouth (array 6) and array 1 335
(average 63 cm s-1) 336
337
SWIMMING DEPTH 338
The mean swimming depth when crossing array 2ndash5 varied from 05ndash24 339
meter (Table 1) When approaching the estuary salmon swam closer to the surface 340
There was no difference in swimming depth between males and females Seven of the 341
lsquocontrolrsquo fish (the fish that returned to the river again in 2008) had depth sensing tags 342
Mean migration depth was 5 m (range 0ndash8 SD = 2) at array 1 4 m (range 0ndash6 SD 343
= 2) at array 3 and 5 m (range 0ndash9 SD = 3) at array 5 which was slightly deeper 344
than the newly tagged fish 345
346
TIMING OF RIVER ENTRY 347
Females entered the river on average six days before the males (Welchrsquos t-test 348
df = 42 P = 002) Timing of river entry did not depend on river flow on the day of 349
entry (r2 = 016 P = 006) or on cumulative changes from one (r2 = 0007 P = 070) 350
two (r2 = 0003 P = 081) or three days before entry (r2 = 0003 P = 080) No 351
difference in the timing of river entry was found in relation to the tides (Table 2) 352
There was also no difference in the timing of river entry (day-of-the-year day or 353
night river flow tidal cycle) in relation to fork length or body mass since only 14 354
16
of the variation (Table 3) of the constrained axes in the redundancy analysis was 355
explained by the timing of river entry between different sizes of salmon 356
There was a clear difference in the light intensities between day (50 000ndash209 424 lx) 357
and night (183ndash20 000 lx) during the study period (5ndash24 July) but no significant 358
difference was observed in the timing of river entry between day and night or in the 359
combination of tidal water and day or night (Table 2) Thirty salmon entered the river 360
during day-time and 26 during night time (Chi-square test df = 1 p-value = 062) 361
362
MIGRATORY SPEEDS 363
Mean migratory speed from release to river entry was 97 km day-1 (01 LF s-364
1) but with large individual variation (n = 54 range 07ndash331 km day-1 SD = 80) 365
The mean speed was lower (Welchrsquos t-test df = 50 P = 0003) from release to the 366
array 2 (93 km day-101 LF s-1 n = 52 range 05ndash710 km day-1 SD = 122) than 367
from array 2 to the river mouth (165 km day-102 LF s-1 n = 51 range 06ndash610 km 368
day-1 SD = 137) Median migratory speed (Fig 5) was fastest in zone 1 (06 LF s-1) 369
and decreased as the fish migrated towards the river mouth (01 LF s-1) (05 LF s-1 04 370
LF s-1and 01 LF s-1for zones 2‐4 respectively Linear mixed‐effects model n = 159 P 371
lt 0001) 372
Migratory speed from ALS array one to the river mouth did not depend on the 373
river flow on the day of river entry (r2 = 0007 P = 055) or on cumulative changes in 374
water flow from one (r2 = 0019 P = 031) two (r2 = 0028 P = 022) or three days 375
before entry (r2 = 0013 P = 041) There was also no relationship between migratory 376
speed in zone four (the last 2 km before river entry) and river flow on the day of river 377
entry (r2 = 0033 P = 029) or changes in river flow from the day before entry (r2 = 378
0037 P = 027) 379
17
For the eight returning Atlantic salmon in 2008 (lsquocontrolrsquo group tagged the 380
year before) the median migratory speed decreased as they approached the inner part 381
of the fjord similar to the newly tagged fish (Fig 5) Median migratory speed from 382
array 1 to the river mouth was 272 km day-1 (range 19ndash538 km day-1 SD = 199) 383
which was higher than when salmon were tagged and initially studied in 2007 384
However while the lsquocontrolrsquo group was registered at array 1 the registrations in 385
2007 started at array 2 Therefore a larger part of the fjord was included in 2008 386
387
388
DISCUSSION 389
These results from the relatively pristine Alta Fjord confirmed the hypothesis 390
that horizontal adult migration path was closer to the coastline as the fish approached 391
the river mouth but the distribution was influenced by brackish water distribution 392
northerly winds spread the brackish water across the fjord and the Atlantic salmon 393
seemed to follow this Further the results supported the hypothesis that the migration 394
occurred closer to the surface as the salmon approached the river mouth however the 395
findings could not confirm that river entry was facilitated by increased water 396
discharge and ebb tide and occurred mainly during the night The results confirmed 397
the hypothesis that the marine migration speed of returning Atlantic salmon declined 398
towards the river mouth however the hypothesis that marine migration speeds 399
increased with increasing river discharge was not supported A similar behaviour 400
between newly tagged fish and those tagged the year before their homing migration 401
supported the hypothesis that the migration pattern was not largely affected by short-402
term capture handling and tagging effects 403
404
18
HORIZONTAL DISTRIBUTION 405
Atlantic salmon generally followed the coastline during their homing 406
migration which may suggest that the coastline was used as a guide for orientating to 407
the river The complex interface between open ocean and up-river migration pose 408
special challenges and salmon may use elements of many orientation systems (Quinn 409
et al 1989 Pascual and Quinn 1991 Olson and Quinn 1993) It is widely accepted 410
that salmon at least partly rely on olfactory information to orientate to their home 411
river (Brannon 1981 Stabell 1982 Quinn 1990) The fact that most of the returning 412
adults were observed on the eastern side in the outer and central part of the fjord 413
where the lowest salinities were measured may suggest that the fish used this side of 414
the fjord because it provided the best conditions to locate and recognise the river At 415
array 3 in the inner part of the fjord the brackish layer covered the entire array and 416
here the returning adults utilized both sides of the fjord 417
Despite finding no correlation between the current direction measured at 3 m 418
depth and migratory pattern at array 3 there was a significant relationship between 419
wind direction and horizontal distribution of salmon when passing this array This 420
may indicate that the salmon distribution was influenced by wind induced spreading 421
of river water across the array The same pattern was observed during the outward 422
post-smolts migration studied in the same fjord in the same year (Davidsen et al 423
2009) 424
Despite the wind induced spreading of river water across the fjord mean 425
migratory speed was always higher than measured current velocities so it seems that 426
salmon had an active swimming behaviour when passing the array 3 In other 427
studies Atlantic salmon have been found to be influenced by the tidal current by 428
19
generally moving with the tide (eg Aprahamian et al 1998) but also to swim with 429
lower ground speed during ebb tide and higher during flood tides (Smith et al 1981) 430
431
SWIMMING DEPTH 432
As salmon approached the estuary they swam closer to the surface Since the 433
brackish water from the river outlet is in the upper part of the water column one 434
explanation for this behaviour may be that they use the brackish water layer to locate 435
and recognise the river (Quinn 1990) The attraction may be due to both the lower 436
salinity level and the river odour Earlier gillnet studies have shown that returning 437
Atlantic salmon usually remain near the surface (1ndash5 m depth) but occasionally make 438
downwards movements in the water column (Stasko et al 1973) Westerberg (1982) 439
and Doslashving et al (1985) reported that Atlantic salmon with acoustic tags moved up 440
and down in the water column in association with fine-scale hydrographic 441
stratification and they both concluded that salmon searched for vertical gradients of 442
odours from the home river rather than horizontal gradients Another reason to 443
migrate closer to the sea surface when approaching the river is to acclimate to the 444
fresh water Quinn (1990) suggested that by migrating in and out of the brackish 445
water layer at the top of the water column in the estuary salmonids can adjust to the 446
salinity of their environment as they make the transition from salt water to freshwater 447
448
TIMING OF RIVER ENTRY 449
Females entered the river in average six days earlier than males which is 450
consistent with findings in other studies (Dahl et al 2004 Niemelauml et al 2006) Dahl 451
et al (2004) suggested that the earlier river entry of female Atlantic salmon may be 452
due to females being older than males when performing their spawning migration 453
20
Several previous studies indicate that older (larger) fish usually arrive earlier than 454
younger (smaller) individuals (Power 1981 Jonsson et al 1990a) However in the 455
present study there were no differences in size or age between the two sexes 456
Changes in river flow did not influence the timing of river entry Increased 457
water discharge appears to be an important proximate factor stimulating adult Atlantic 458
salmon to enter small rivers from the sea (Jonsson et al 2007) However this stimuli 459
may act in combination with other environmental factors such as water temperature 460
light tides and water chemistry (Jonsson 1991 Potter et al 1992 Smith and Smith 461
1997) The fact that no correlation between river flow tidal cycle and river entry was 462
found in this study may be due to the generally large discharge of the River Alta (75ndash463
130 m3 s-1 during the study) In a large river like this it may not be critical for salmon 464
to enter the river at high river flow in order to safely migrate upstream or have the ebb 465
tide to facilitate the recognition of the outflowing fresh water from the home river 466
This is supported by the fact that day-of-the-year day or night time river flow and 467
tidal cycle at the time of river entry in total explained only 14 of the variation 468
between different sizes of the salmon This suggests that parameters other than those 469
included in the analysis may be important for timing of river entry or that timing of 470
river entry in the River Alta simply depends on the time salmon reach the estuary and 471
river mouth If the latter is the case timing of river entry may depend on factors 472
influencing the migration in the outer fjord or open sea 473
It has been suggested that the correlation between increased discharge and the 474
time of river entry in large rivers is not due to the stimulus for Atlantic salmon to 475
enter the river per se but rather that increased freshwater supply to near coastal areas 476
may aid salmon to recognise and find their natal river increasing the number of fish 477
entering fresh water compared to low flow periods (Thorstad et al 2010) In the 478
21
present study there was no correlation between time of river entry and changes in 479
river flow one two and three days before entry However since salmon were tagged 480
and monitored in the last part of the spawning run there may already have been 481
enough freshwater in the fjord system to guide the salmon The observation that river 482
entry not is correlated with river flow in large rivers is also supported by other studies 483
(Dahl et al 2004 Karppinen et al 2004) 484
Adult salmon entered the river during all phases of the tidal cycle It has been 485
suggested that Atlantic salmon entering the river during strong ebb currents may have 486
been attracted by the outward flow of fresh water (Potter et al 1992) However there 487
is little consensus among studies about the relationship between tidal phase and river 488
entry (Potter 1988 Potter et al 1992 Smith and Smith 1997 Karppinen et al 2004) 489
Given the wide variation in the physical chemical and hydrographic characteristics of 490
estuaries this variation in the migratory responses of Atlantic salmon to the tidal 491
cycle is perhaps not surprising (Smith and Smith 1997) In general different sizes 492
forms and shapes of rivers may result in different relationships between Atlantic 493
salmon behaviour and environmental factors 494
The absence of a clear diel pattern in the timing of river mouth passage 495
differed from that observed in a post-smolt study in the River Alta when more post-496
smolts passed the river mouth at night during migration towards the sea (Davidsen et 497
al 2009) Nocturnal migration is thought to be an adaptive behaviour to reduce 498
predation by visual predators like seals (Solomon 1982) and has been observed in 499
several studies of returning Atlantic salmon (eg Potter 1988 Smith and Smith 1997) 500
Even though the northern River Alta is situated on a latitude with midnight sun light 501
intensities were still lower than 20 000 lx at night in contrast to the 50 000ndash200 000 502
lx measured during day time The fact that no difference in the diel migration pattern 503
22
was observed for adult salmon may be because they do not experience the same 504
predation level as the smaller post-smolts 505
506
MIGRATORY SPEEDS 507
The migratory speed slowed as salmon approached the estuary and salmon 508
had a lower migratory speed in the innermost part of the estuary (zone four) than in 509
the open fjord (zone onendashthree) This change in travel rates may be an indication of a 510
physiological need to adapt to the fresh water in the river time to orientate towards 511
the river mouth and to recognise the home river (Hansen and Quinn 1998) or to wait 512
for optimal conditions for upstream migration (Jonsson et al 1990b) The finding of 513
decreasing travel rates when approaching the estuary confirm results from mark and 514
recapture studies (Hansen et al 1993 Hansen and Quinn 1998) 515
516
CONTROL FISH TAGGED THE PRECEDING YEAR 517
The migration behaviour of the eight returning Atlantic salmon in 2008 518
(lsquocontrolrsquo group tagged the year before) did not differ from the newly tagged fish 519
Similar to the newly tagged fish median migratory speed decreased as they 520
approached the inner part of the fjord and the fish migrated close (4ndash5 m) to the 521
surface The migration behaviour seemed therefore not affected by capture handling 522
and tagging This is in accordance with a laboratory study indicating that swimming 523
performance of Atlantic salmon was not affected by transmitters used in the present 524
study (Thorstad et al 2000) To our knowledge this study is first one using multiyear 525
tags to capture the migration behaviour of Atlantic salmon while Welch et al (2011) 526
have used this method on juvenile Pacific salmon 527
528
23
529
ACKNOWLEDGEMENTS 530
This study was financed by the Norwegian Research Council (project no 531
17601S40) the Norwegian Institute for Nature Research the Directorate for Nature 532
Management and the University of Tromsoslash The Norwegian Water Resources and 533
Energy Directorate provided data on the river flow The crew onboard the Research 534
Vessel ldquoJohan Ruudrdquo the staff at Alta Laksefiskeri Interessentselskap (ALI) the local 535
bag net fishermen Amund Suhr Anette Grimsrud Davidsen Cedar Chittenden and 536
Jenny Jensen are all thanked for their extensive help during the field work and Gunnel 537
Oslashstborg for scale analyses Helge Meissner is thanked for assistance with genotyping 538
and Svein-Erik Fevolden and Anne K Praeligbel for valuable discussions concerning the 539
genetics Timothy Sheehan and two anonymous referees are thanked for their valuable 540
comments on an earlier version of the manuscript The experimental procedures 541
concur with the national ethical requirements and were approved by the Norwegian 542
National Animal Research Authority 543
544
24
545
REFERENCES 546
547
Alabaster JS Gough PJ and Brooker WJ 1991 The environmental requirements 548
of Atlantic salmon Salmo salar L during their passage through the Thames 549
estuary 1982-89 J Fish Biol 38 741-762 550
Aprahamian MW Jones GO and Gough PJ 1998 Movement of adult Atlantic 551
salmon in the Usk estuary Wales J Fish Biol 53 221-225 552
Banks JW 1969 A review of the litterature on the upstream migration of adult 553
salmonids J Fish Biol 1 85-136 554
Bates D and Maechler M (2010) Package ldquolme4rdquo Reference manual for the 555
package Available at httpcranr-projectorgwebpackageslme4lme4pdf 556
(Assessed 22062012) 557
Brannon EL 1981 Orientation mechanisms of homing salmonids In Salmon and 558
trout migratory behaviour symposium Edited by EL Brannon and EO Salo 559
University of Washington Seattle pp 219-227 560
Cooke SJ Iverson SJ Stokesbury MJW Hinch SG Fisk AT Smith P 561
VanderZwaag D Brattey J and Whoriskey F 2011 Ocean Tracking 562
Network Canada A network approach to addressing critical issues in fisheries 563
and resource management with implications for ocean governance Fisheries 564
36 583-592 565
Dahl J Dannewitz J Karlsson L Petersson E Loumlf A and Ragnarsson B 2004 566
The timing of spawning migration implications of environmental variation 567
life history and sex Can J Zool 82 1864-1870 568
25
Davidsen JG Rikardsen AH Halttunen E Thorstad EB Oslashkland F Letcher 569
BH Skarethhamar J and Naeligsje TF 2009 Migratory behaviour and survival 570
rates of wild northern Atlantic salmon (Salmo salar) post-smolts effects of 571
environmental factors J Fish Biol 75 1700-1718 572
Doslashving KB Westergaringrd H and Johnsen PB 1985 Role of olfaction in the 573
behavioural and neuronal responses of Atlantic salmon Salmo salar to 574
hydrographic stratification Can J Fish Aquat Sci 42 1658-1667 575
Fiske P Lund RA and Hansen LP 2005 Identifying fish farm escapees In Stock 576
identification methods Edited by SX Cadrin KD Friedland and JD 577
Waldman Elsevier Academic Press Amsterdam pp 659-680 578
Halttunen E Rikardsen AH Davidsen JG Thorstad EB and Dempson JB 579
2009 Survival migration speed and swimming depth of Atlantic salmon kelts 580
during sea entry and fjord migration In Tagging and tracking of Marine 581
Animals with Electronic Devices Reviews Methods and Technologies in Fish 582
Biology and Fisheries 9 Edited by JL Nielsen H Arrizabalaga N Fragoso 583
A Hobday M Lutcavage and J Sibert Springer Dordrecht pp 35-49 584
Hansen LP Jonsson N and Jonsson B 1993 Oceanic migration in homing 585
Atlantic salmon Anim Behav 45 927-941 586
Hansen LP and Quinn TP 1998 The marine phase of the Atlantic salmon (Salmo 587
salar) life cycle with comparisons to pacific salmon Can J Fish Aquat Sci 588
55 104-118 589
Heggberget TG Oslashkland F and Ugedal O 1993 Distribution and migratory 590
behaviour of adult wild and farmed Atlantic salmon (Salmo salar) during 591
return migration Aquaculture 118 73-83 592
ICES (2011) Report of the Working Group on North Atlantic Salmon (WGNAS) 593
26
ICES 2011ACOM09 286 pp Available at 594
httpwwwicesdkreportsACOM2011WGNASwgnas_2011_finalpdf 595
(Assessed 22062012) 596
Jonsson B Jonsson N and Hansen LP 1990a Does juvenile experience affect 597
migration and spawning of adult Atlantic salmon Behav Ecol Sociobiol 26 598
225-230 599
Jonsson B Jonsson N and Hansen LP 2007 Factors affecting river entry of adult 600
Atlantic salmon in a small river J Fish Biol 71 943-956 601
Jonsson N 1991 Influence of water flow water temperature and light on fish 602
migration in rivers Nord J Freshwat Res 66 20-35 603
Jonsson N Jonsson B and Hansen LP 1990b Partial segregation in the timing of 604
migration of Atlantic salmon of different ages Anim Behav 40 313-321 605
Karppinen P Erkinaro J Niemelauml E Moen K and Oslashkland F 2004 Return 606
migration of one-sea-winter Atlantic salmon in the River Tana J Fish Biol 607
64 1179-1192 608
Lacroix GL and Voegeli FA 2000 Development of automated monitoring 609
systems for ultrasonic transmitters In Fish Telemetry Proceedings of the 3rd 610
Conference on Fish Telemetry in Europe Edited by A Moore and IC 611
Russell CEFAS Lowestoft UK pp 37-50 612
Legendre P and Legendre L 1998 Numerical ecology p 853 Elsevier Science BV 613
Amsterdam 614
Lund RA and Hansen LP 1991 Identification of wild and reared Atlantic salmon 615
Salmo salar L using scale characters Aquacult Fish Manage 22 499-508 616
Niemelauml E Orell P Erkinaro J Dempson J Broslashrs S Svenning M and 617
Hassinen E 2006 Previously spawned Atlantic salmon ascend a large 618
27
subarctic river earlier than their maiden counterparts J Fish Biol 69 1151ndash619
1163 620
Olson AF and Quinn TP 1993 Vertical and horizontal movements of adult 621
chinook salmon Oncorhynchus tshawytscha in the Columbia River estuary 622
Fishery Bulletin of the Fish and Wildlife Service 91 171-178 623
Parrish DL Behnke RJ Gephard SR McCormick SD and Reeves GH 1998 624
Why arenrsquot there more Atlantic salmon (Salmo salar) Can J Fish Aquat 625
Sci 55 281-287 626
Pascual MA and Quinn TP 1991 Evaluation of alternative models of the coastal 627
migration of adult Fraser River sockeye salmon (Oncorhynchus nerka) Can J 628
Fish Aquat Sci 48 799-810 629
Pierce GJ Boyle PR and Thompson PM 1990 Diet selection by seals In 630
Trophic Relationships in the Marine Environment Edited by M Barnes and 631
RN Gibson Aberdeen University Press Aberdeen pp 222-238 632
Potter ECE 1988 Movements of Atlantic salmon Salmo salar L in an estuary in 633
south-west England J Fish Biol 33 153-159 634
Potter ECE Solomon DJ and Buckley AA 1992 Estuarine movements of adult 635
Atlantic salmon (Salmo salar L) in Christchurch Harbour southern England 636
In Wildlife telemetry remote monitoring and tracking of animals Edited by 637
IG Priede and SM Swift Ellis Horwood Limited Chichester England pp 638
400-409 639
Power G 1981 Stock Characteristics and Catches of Atlantic Salmon (Salmo salar) 640
in Quebec and Newfoundland and Labrador in Relation to Environmental 641
Variables Can J Fish Aquat Sci 38 1601-1611 642
28
Quinn TP 1990 Current controversies in the study of salmon homing Ethol Ecol 643
Evol 2(1) 49-63 644
Quinn TP Terahart BA and Groot C 1989 Migratory orientation and vertical 645
movements of homing adult sockeye salmon Oncorhynchus nerka in coastal 646
waters Anim Behav 37 587-599 647
Smith GW 1990 The relationship between river flow and net catches of salmon 648
(Salmo salar L) in and around the mouth of the Aberdeenshire Dee between 649
1973 and 1986 Fish Res 10 73-91 650
Smith GW Hawkins AD Urquhart GG and Shearer WM 1981 Orientation 651
and energetic efficiency in the offshore movements of returning Atlantic 652
salmon Salmo salar L Scott Fish Res Rep 21 1-22 653
Smith IP and Smith GW 1997 Tidal and diel timing of river entry by adult 654
Atlantic salmon returning to the Aberdeenshire Dee Scotland J Fish Biol 50 655
463-474 656
Solomon DJ 1982 Smolt migration in Atlantic salmon (Salmo salar L) and sea 657
trout (Salmo trutta L) In Salmon and trout migratory behavior symposium 658
Edited by EL Brannon and EO Salo University of Washington Seattle pp 659
196-203 660
Stabell OB 1982 Homing of Atlantic salmon in relation to olfaction and genetics In 661
Salmon and trout migratory behaviour symposium Edited by EL Brannon 662
and EO Salo University of Washington Seattle pp 238-246 663
Stasko AB Sutterlin AM Rommel SAj and Elson PF 1973 Migration-664
orientation of Atlantic salmon (Salmo salar L) In International Atlantic 665
Salmon Symposium Special Publication Series Edited by MW Smith and 666
29
WM Carter International Atlantic Salmon Foundation New York pp 119-667
137 668
Svendsen H 1995 Physical oceanography of coupled fjord-coast systems in northern 669
Norway with special focus on frontal dynamics and tides In Ecology of fjords 670
and coastal waters Edited by HR Skjoldal C Hopkins KJ Erikstad and 671
HP Leinaas Elsevier Science Publ B V Amsterdam pp 149-164 672
Thorstad EB Heggberget TG and Oslashkland F 1998 Migratory behaviour of adult 673
wild and escaped farmed Atlantic salmon Salmo salar L before during and 674
after spawning in a Norwegian river Aquacult Res 29 419-428 675
Thorstad EB Whoriskey F Uglem I Moore A Rikardsen AH and Finstad B 676
2012 A critical life stage of the Atlantic salmon Salmo salar behaviour and 677
survival during the smolt and initial post-smolt migration J Fish Biol 81 678
500-542 679
Thorstad EB Whoriskey FG Rikardsen AH and Aarestrup K 2010 Aquatic 680
nomads the life and migrations of the Atlantic salmon In Atlantic Salmon 681
Ecology Edited by Oslash Aas S Einum A Klemetsen and J Skurdal Wiley-682
Blackwell New York pp 1-32 683
Thorstad EB Oslashkland F Aarestrup K and Heggberget TG 2008 Factors 684
affecting the within-river spawning migration of Atlantic salmon with 685
emphasis on human impacts Rev Fish Biol Fish 18 345-371 686
Thorstad EB Oslashkland F and Finstad B 2000 Effects of telemetry transmitters on 687
swimming performance of adult Atlantic salmon J Fish Biol 57 531-535 688
Treacutepanier S Rodriacuteguez MA and Magnan P 1996 Spawning migrations in 689
landlocked Atlantic salmon time series modelling of river discharge and water 690
temperature effects J Fish Biol 48 925-936 691
30
Ugedal O Naeligsje TF Thorstad EB Forseth T Saksgaringrd L and Heggberget 692
TG 2008 Twenty years of hydropower regulation in the River Alta long 693
term changes in abundance of juvenile and adult Atlantic salmon 694
Hydrobiologia 609 9-23 695
Welch DW Melnychuk MC Payne JC Rechisky EL Porter AD Jackson 696
GD Ward BR Vincent SP Wood CC and Semmens J 2011 In situ 697
Measurement of Coastal Ocean Movements and Survival of Juvenile Pacific 698
Salmon Proc Natl Acad Sci USA 108 8708-8713 699
Westerberg H 1982 Ultrasonic tracking of Atlantic salmon (Salmo salar L) ndash II 700
Swimming depth and temperature stratification Rep Inst Fresh Res 701
Drottningholm 60 102-120 702
1
TABLES 1
Table 1 Mean swimming depth registered at the time Atlantic salmon (Salmo salar) passed 2
the array 2ndash5 in the Alta Fjord Mean values are based on individual means Welchrsquos t-test 3
was used to test for significant difference between male and female swimming depth 4
5
ALS
Array
n
Mean
(m)
SD individual
mean (range)
(m)
Deepest
individual
recording
(m)
Mean
depth
females
(m)
Mean
depth
males
(m)
p-value
(between
sexes)
2 23 24 37 (00ndash161) 297 26 18 057
3 24 11 15 (00ndash64) 189 09 14 036
4 18 15 19 (00ndash67) 109 14 17 075
5 21 05 07 (00ndash18) 146 04 09 018
2
Table 2 Comparisons of the number and proportions of homing Atlantic salmon (Salmo 6
salar) entering the river during 1) different stages of the tidal cycle and 2) for different 7
combinations of day and night and different stages of the tidal cycle Chi-square-tests were 8
used to test for differences between different stages of the tidal cycle and between the 9
different combinations of day and night and different stages of the tidal cycle 10
11
Number
(n =56) P-value
High tide 15 27
Ebbing tide 13 23
Low tide 9 16
Flooding tide 19 34 029
High tide day time 7 13
High tide night time 8 14
Ebbing tide day time 7 13
Ebbing tide night time 6 11
Low tide day time 5 9
Low tide night time 4 7
Flooding tide day time 11 20
Flooding tide night time 8 14 071
12
3
Table 3 Results from a redundancy analysis (RDA) exploring whether timing of river entry 13
(day-of-the-year day or night river flow tidal cycle) of Atlantic salmon (Salmo salar) 14
depended on fork length or body mass The proportion of constrained and unconstrained 15
inertia (the sum of the variance from all included parameters) from total inertia was 16
calculated which in RDA gives the proportion of variance 17
18
19
Inertia Proportion
Total 20000 10000
Constrained 02846 01423
Unconstrained 17154 08577
0
N
5
km RiverAlta
Alta Fjord
70deg30deg20deg
65deg
Norway Sweden
Finland
1
2
34
5
Z 1Z 1 Z 2Z 2
Z 3Z 3Z 4Z 47 6
10
11
12
13
14
15
16
40
50
60
70
80
90
100
110
120
130
140
57 127 197 267 28
Tem
pera
ture
(degC
)
Riv
er fl
ow (m
3 s-1
)
Date 2007
0 7 0 7 1 0 0 7 1 3 0 7 1 6 0 7 1 9 0 7 2 2 0 7 2 5 0 7 - 1 0
- 5
0
5
1 0
1 5
2 0
0 7 0 7 1 0 0 7 1 3 0 7 1 6 0 7 1 9 0 7 2 2 0 7 2 5 0 7 - 1 0
- 5
0
5
1 0
1 5
2 0
Cur
rent
vel
ocity
com
pone
nt (c
m s-1
) C
urre
nt v
eloc
ity c
ompo
nent
(cm
s-1
)
Date 2007
12
34
00 05 10 15 20
Fjord zone (year 2007)
Migratory speed (bl sminus1)
AB
C
00 05 10 15 20
Fjord zone (year 2008)
Migratory speed (bl sminus1)
1
FIGURE CAPTIONS 1
2
Figure 1 Map of the lower part of River Alta and the Alta Fjord showing the position 3
of the bag nets ( ) and the release sites ( ) ALS array 1 is indicated with () while 4
ALS arrays 2ndash5 are indicated by grey and black lines Most fish passed these ALSs in the 5
darker parts of the lines The two ALSs in the river mouth (array 6) and the three ALSs 6
(array 7) in the river are given by () The map also shows the position of the two current 7
meters in ALS array 3 ( ) the four zones (Z1ndash4) and the weather station () In the 8
following year (2008) were only array 1 3 5 and 6 present 9
10
11
Figure 2 Daily river flow (- - - - -) and water temperature (___) in the River Alta 12
13
14
Figure 3 Salinity distribution recorded at 0ndash12 m depth across ALS array 2 (a amp c) and ALS 15
array 3 (b amp d) in the Alta Fjord on 6 July (a amp b) and 13 July (c amp d) 2007 16
17
18
Figure 4 Current velocity components at 3 m depth at the north-eastern (upper panel) and 19
south-western (lower panel) side of the Alta Fjord at the ALS array 3 Positive values are 20
towards the fjord head and negative values are towards the fjord mouth indicates time of 21
individual Atlantic salmon (Salmo salar) passage 22
23
2
Figure 5 Migratory speeds of homing Atlantic salmon (Salmo salar) in the Alta Fjord in 2007 24
and 2008 In 2007 the fjord was divided into four zones (see map Fig 1) In 2008 zone A 25
was the area from ALS1ndash3 zone B from ALS3ndash5 and zone C from ALS5ndash6 The box-26
and-whisker plots give the median values (black lines) the interquartile ranges (box 50 of 27
the data falling into this) and the 5th and 95th percentiles (whiskers) 28
29
- cjfas-2012-0352-final1
-
- Homing behaviour of Atlantic salmon (Salmo salar) during final phase of marine migration and river entry
-
- Table 1-3
- Figure 1
- Figure 2
-
- Slide Number 1
-
- Figure 3
-
- Slide Number 1
-
- Figure 4
-
- Slide Number 1
-
- Figure 5
- FIGURE CAPTIONS
-
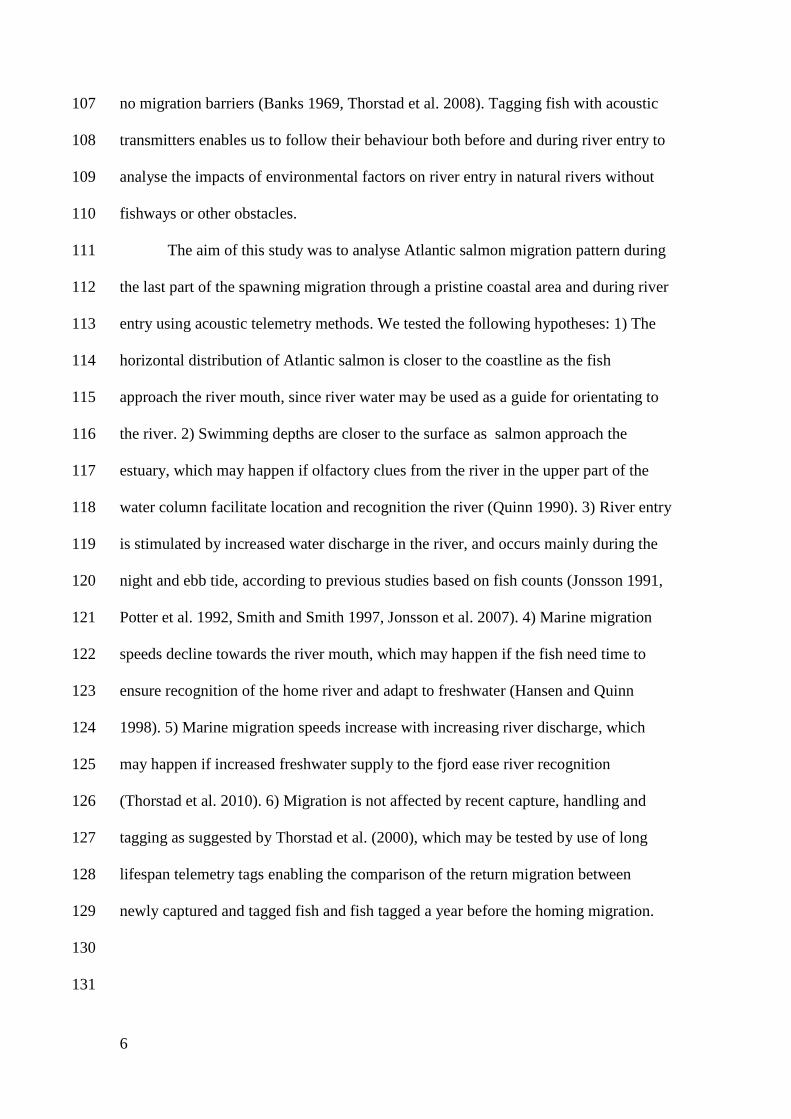
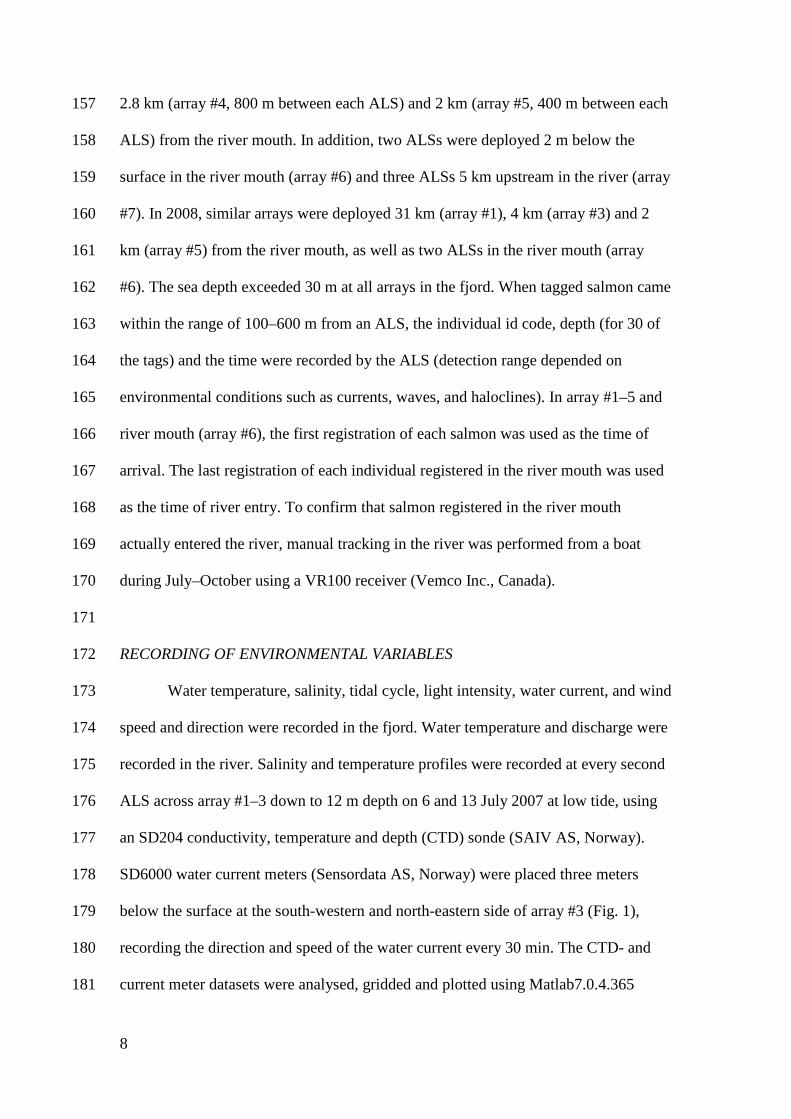
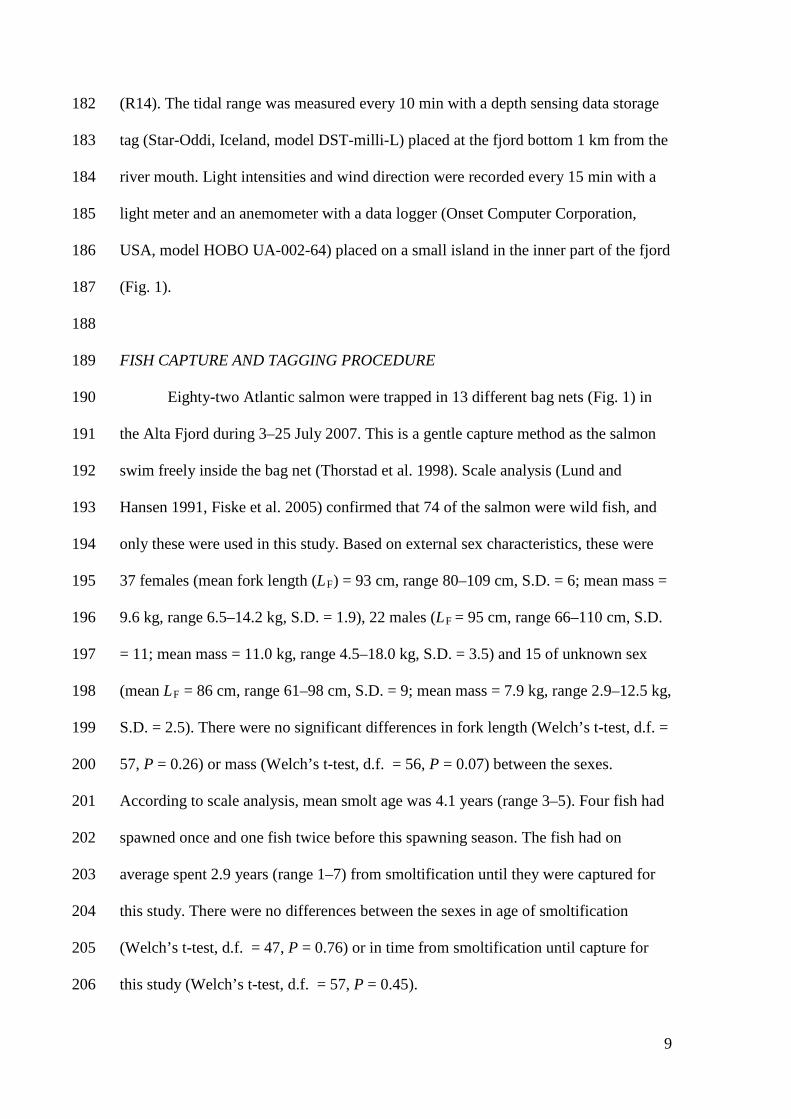
10
The Atlantic salmon were brought directly from the bag net into a water tank 207
on board a small research vessel for body measurements (fork length and mass) scale 208
sampling and tagging They were tagged with one of four types of individually coded 209
acoustic transmitters Thelma AS Norway model MP‐13 (n=21 13 times 31 mm mass 210
in waterair of 711g) Thelma AS Norway model LP‐16‐short (n=23 16 x 36 mm 211
mass in waterair of 614 g) Vemco Inc Canada model V13P‐1L (n=21 13 times 36 212
mm mass in waterair of 611 g) or Vemco Inc Canada model V16P‐4H (n=9 213
16x71 mm mass in waterair of 1125g) The 30 Vemco transmitters measured depth 214
with a pressure sensor (accuracy 25 m resolution 022 m) and transmitted this 215
information together with the fish identity code All fish were externally tagged under 216
the dorsal fin with a modified Carlin tag with contact and reward information 217
Individuals were anaesthetised by immersion in an aqueous solution of 2-218
phenoxy ethanol in approximately 3 min (EC No 204-589-7 SIGMA Chemical Co 219
USA 05 ml l-1) The transmitter was inserted through a 20ndash30 cm incision on the 220
ventral surface anterior to the pelvic girdle The transmitter was subsequently pushed 221
gently forward into the body cavity The incision was closed using two to three 222
independent silk sutures (20 Ethicon Belgium) Following recovery (5ndash10 minutes) 223
the salmon were transported 300 m away from the bag net (to avoid recapture in the 224
same bag net) and released Mean distance from the release site to the river mouth 225
was 24 km (range 19ndash34 km SD = 4) (Fig 1) 226
To assess possible effects of being newly tagged on fish behaviour the results 227
were compared to a lsquocontrolrsquo group of eight Atlantic salmon that were acoustically 228
tagged in the same river as kelts in May 2007 (see Halttunen et al 2009 for details) 229
and recorded during return migration as multiple spawners more than one year later 230
in 2008 231
11
232
DATA ANALYSES 233
Differences in the horizontal distribution along the different ALS arrays and 234
differences in the horizontal distribution between periods with and without wind were 235
tested with Chi-square tests To take into account the time lag of wind forces on the 236
water currents mean average wind speed and direction from the last two hours before 237
the passage of salmon in the ALS array were used Due to the low number of salmon 238
registered at each ALS array (range 26ndash33) the wind speeds were divided into only 239
two categories ldquono windrdquo was defined as wind speeds less than 30 m s-1 and ldquowindrdquo 240
as wind speeds from 31ndash134 m s-1 (highest measured value) Brackish water was 241
defined as salinity lt 30 242
Since the individual swimming depths had unequal variance difference in 243
swimming depth between the different ALS arrays was tested with Welchrsquos t-test 244
(two-way t-test assuming unequal variance) 245
The relationship between time of river entry and river flow the same day and 246
cumulative changes in river flow from one two and three days before river entry 247
were tested with linear regression analyses To test if salmon entered the river during 248
day or night night was defined as 2000ndash0800 hours which during the study period 249
corresponded to light intensities less than 20 000 lx Chi-square-tests were used to test 250
for differences between river entry at day or night during different stages of the tidal 251
cycle (divided into three hour phases high ebbing low or flooding tide) and between 252
the different combinations of day and night and different stages of the tidal cycle In 253
order to explore if timing of river entry (day-of-the-year day or night river flow tidal 254
cycle) depended on fork length or body mass a redundancy analysis (RDA Legendre 255
and Legendre 1998) was used as ordination method The proportion of the constrained 256
12
inertia (the sum of the variance from all included parameters) from the total inertia 257
was calculated which in RDA gives the proportion of variance The package ldquoVeganrdquo 258
(Oksanen 2008) was used in the software program R 28 (httpwwwr-projectorg) 259
Day and night and the tidal cycle groups were coded as dummy variables 260
Time spent in the different parts of the fjord system and migratory speeds 261
were calculated for those salmon registered at two subsequent ALS arrays Since not 262
all salmon were registered by all arrays the sample sizes for these analyses were 263
smaller than the total number of salmon registered Migratory speed was estimated as 264
individual body lengths (LF) per second and km per day by using the shortest distance 265
between the actual ALS recording the detection and the river mouth thus giving 266
minimum estimates (Thorstad et al 2004) Individual mean and median values were 267
used to calculate the populations mean and median in order to keep the data points 268
independent Differences in swimming speeds between the four zones were tested as 269
unbalanced unreplicated repeated measurements by fitting a linear mixed model using 270
the restricted maximum likelihood (REML) method The resulting zone term in the 271
fitted model was when tested with a likelihood ratio test against the null model The 272
package ldquolme4rdquo (Bates and Maechler 2010) was used in the software program R 212 273
(httpwwwr-projectorg) 274
Relationships between migratory speed and river flow the same day as river 275
entry and cumulative changes in river flow from one two and three days before river 276
entry were tested with linear regression analyses Possible significant p-values were 277
corrected for multiple comparisons using the Bonferroni procedure 278
279
280
RESULTS 281
13
Fifty-nine of the 74 confirmed wild salmon (80) were registered in the river 282
mouth (array 6) and 56 (76) entered the river Of those 15 fish that did not enter 283
the river mouth five were recaptured by anglers in the fjord seven left the fjord 284
(registered in array 1) and the remaining three were only registered some few times 285
at array 2 Genetic assignment tests supported the homing of the 56 salmon to their 286
natal river (JG Davidsen unpublished data) Data from these 56 salmon are used in 287
the following analyses 288
289
ENVIRONMENTAL DATA 290
The river flow in River Alta decreased during the period 5ndash26 July from 130 291
m3 s-1 to 75 m3 s-1 Thereafter it increased again (Fig 2) 292
In summer the surface layer in the Alta Fjord consists of brackish water due 293
to the large freshwater supply from the river The Alta fjord is a wide fjord where the 294
Coriolis effect on the circulation is considerable (Svendsen 1995) allowing cross-295
fjord gradients in current velocities salinity and temperature Theoretically the 296
brackish water would therefore follow the eastern side of the Alta fjord towards the 297
sea This was clearly seen in the conductivity temperature and depth (CTD) sections 298
from July 13 (Fig 3) when the lowest salinities were measured on the eastern side of 299
the fjord on array 1ndash3 (only array 2 and 3 are shown in the figure) One week 300
earlier the vertical salinity gradients were stronger in the upper 4 m while the 301
horizontal gradients were weaker This difference can be explained by the larger river 302
runoff in early July than mid-July combined with stronger winds (up to 8 m s-1) with 303
northerly components spreading the surface water across the fjord Thus in array 1 304
and 2 the brackish water (salinity less than 30) was found only along the eastern side 305
14
on the 13 July while covering the entire fjord section one week earlier At array 3 306
the brackish water covered the upper 3ndash4 m all along the array both days 307
The currents at both current meter locations were highly variable and did not 308
co-vary (Fig 4) Surface temperature varied during the study period between 11 and 309
17 ordmC 310
311
HORIZONTAL DISTRIBUTION 312
Most of the salmon (n = 70 95) were captured tagged and released on the 313
eastern side of the fjord Only four salmon (5) were captured on the western side 314
(Fig 1) When passing the array 2 where 55 of the 56 salmon were registered the 315
horizontal distribution corresponded to the distribution at release (Chi-square test P = 316
022 n = 55) Forty salmon (73) were registered on the eastern side 11 (20) in the 317
central part and four (7) on the western side 318
When passing the array 3 (Fig 1) more salmon migrated in the central and 319
south-western part of the fjord (Chi-square test P lt 0001 n = 55) Twelve salmon 320
(22) were registered on the north-eastern side 23 (42) in the central part and 20 321
(36) on the south-western side In the array 4 and 5 salmon were equally 322
distributed between the eastern (45 46 respectively) and western side (41 323
50 respectively) but only few individuals migrated in the central part (14 4 324
respectively) The horizontal distribution along the third AL array 3 in 2007 differed 325
between periods with and without wind During periods with no wind most salmon 326
passed the array on the north-eastern side while when the wind was blowing from the 327
north (321ndash50deg) most salmon were found in the central part of the array (Chi-square 328
test df = 2 P lt 001) Such difference was not observed when salmon passed array 329
2 4 or 5 330
15
There was no correlation between the passage time at array 3 and the current 331
direction (inout of the fjord) at either the north-eastern (Chi-square test df = 1 P = 332
086) or south-western current meter (Chi-square test df =1 P = 016) (Fig 4) The 333
current speeds (lt 20 cm s-1 Fig 4) were consistently well below the estimated 334
migratory speed of the salmon between the river mouth (array 6) and array 1 335
(average 63 cm s-1) 336
337
SWIMMING DEPTH 338
The mean swimming depth when crossing array 2ndash5 varied from 05ndash24 339
meter (Table 1) When approaching the estuary salmon swam closer to the surface 340
There was no difference in swimming depth between males and females Seven of the 341
lsquocontrolrsquo fish (the fish that returned to the river again in 2008) had depth sensing tags 342
Mean migration depth was 5 m (range 0ndash8 SD = 2) at array 1 4 m (range 0ndash6 SD 343
= 2) at array 3 and 5 m (range 0ndash9 SD = 3) at array 5 which was slightly deeper 344
than the newly tagged fish 345
346
TIMING OF RIVER ENTRY 347
Females entered the river on average six days before the males (Welchrsquos t-test 348
df = 42 P = 002) Timing of river entry did not depend on river flow on the day of 349
entry (r2 = 016 P = 006) or on cumulative changes from one (r2 = 0007 P = 070) 350
two (r2 = 0003 P = 081) or three days before entry (r2 = 0003 P = 080) No 351
difference in the timing of river entry was found in relation to the tides (Table 2) 352
There was also no difference in the timing of river entry (day-of-the-year day or 353
night river flow tidal cycle) in relation to fork length or body mass since only 14 354
16
of the variation (Table 3) of the constrained axes in the redundancy analysis was 355
explained by the timing of river entry between different sizes of salmon 356
There was a clear difference in the light intensities between day (50 000ndash209 424 lx) 357
and night (183ndash20 000 lx) during the study period (5ndash24 July) but no significant 358
difference was observed in the timing of river entry between day and night or in the 359
combination of tidal water and day or night (Table 2) Thirty salmon entered the river 360
during day-time and 26 during night time (Chi-square test df = 1 p-value = 062) 361
362
MIGRATORY SPEEDS 363
Mean migratory speed from release to river entry was 97 km day-1 (01 LF s-364
1) but with large individual variation (n = 54 range 07ndash331 km day-1 SD = 80) 365
The mean speed was lower (Welchrsquos t-test df = 50 P = 0003) from release to the 366
array 2 (93 km day-101 LF s-1 n = 52 range 05ndash710 km day-1 SD = 122) than 367
from array 2 to the river mouth (165 km day-102 LF s-1 n = 51 range 06ndash610 km 368
day-1 SD = 137) Median migratory speed (Fig 5) was fastest in zone 1 (06 LF s-1) 369
and decreased as the fish migrated towards the river mouth (01 LF s-1) (05 LF s-1 04 370
LF s-1and 01 LF s-1for zones 2‐4 respectively Linear mixed‐effects model n = 159 P 371
lt 0001) 372
Migratory speed from ALS array one to the river mouth did not depend on the 373
river flow on the day of river entry (r2 = 0007 P = 055) or on cumulative changes in 374
water flow from one (r2 = 0019 P = 031) two (r2 = 0028 P = 022) or three days 375
before entry (r2 = 0013 P = 041) There was also no relationship between migratory 376
speed in zone four (the last 2 km before river entry) and river flow on the day of river 377
entry (r2 = 0033 P = 029) or changes in river flow from the day before entry (r2 = 378
0037 P = 027) 379
17
For the eight returning Atlantic salmon in 2008 (lsquocontrolrsquo group tagged the 380
year before) the median migratory speed decreased as they approached the inner part 381
of the fjord similar to the newly tagged fish (Fig 5) Median migratory speed from 382
array 1 to the river mouth was 272 km day-1 (range 19ndash538 km day-1 SD = 199) 383
which was higher than when salmon were tagged and initially studied in 2007 384
However while the lsquocontrolrsquo group was registered at array 1 the registrations in 385
2007 started at array 2 Therefore a larger part of the fjord was included in 2008 386
387
388
DISCUSSION 389
These results from the relatively pristine Alta Fjord confirmed the hypothesis 390
that horizontal adult migration path was closer to the coastline as the fish approached 391
the river mouth but the distribution was influenced by brackish water distribution 392
northerly winds spread the brackish water across the fjord and the Atlantic salmon 393
seemed to follow this Further the results supported the hypothesis that the migration 394
occurred closer to the surface as the salmon approached the river mouth however the 395
findings could not confirm that river entry was facilitated by increased water 396
discharge and ebb tide and occurred mainly during the night The results confirmed 397
the hypothesis that the marine migration speed of returning Atlantic salmon declined 398
towards the river mouth however the hypothesis that marine migration speeds 399
increased with increasing river discharge was not supported A similar behaviour 400
between newly tagged fish and those tagged the year before their homing migration 401
supported the hypothesis that the migration pattern was not largely affected by short-402
term capture handling and tagging effects 403
404
18
HORIZONTAL DISTRIBUTION 405
Atlantic salmon generally followed the coastline during their homing 406
migration which may suggest that the coastline was used as a guide for orientating to 407
the river The complex interface between open ocean and up-river migration pose 408
special challenges and salmon may use elements of many orientation systems (Quinn 409
et al 1989 Pascual and Quinn 1991 Olson and Quinn 1993) It is widely accepted 410
that salmon at least partly rely on olfactory information to orientate to their home 411
river (Brannon 1981 Stabell 1982 Quinn 1990) The fact that most of the returning 412
adults were observed on the eastern side in the outer and central part of the fjord 413
where the lowest salinities were measured may suggest that the fish used this side of 414
the fjord because it provided the best conditions to locate and recognise the river At 415
array 3 in the inner part of the fjord the brackish layer covered the entire array and 416
here the returning adults utilized both sides of the fjord 417
Despite finding no correlation between the current direction measured at 3 m 418
depth and migratory pattern at array 3 there was a significant relationship between 419
wind direction and horizontal distribution of salmon when passing this array This 420
may indicate that the salmon distribution was influenced by wind induced spreading 421
of river water across the array The same pattern was observed during the outward 422
post-smolts migration studied in the same fjord in the same year (Davidsen et al 423
2009) 424
Despite the wind induced spreading of river water across the fjord mean 425
migratory speed was always higher than measured current velocities so it seems that 426
salmon had an active swimming behaviour when passing the array 3 In other 427
studies Atlantic salmon have been found to be influenced by the tidal current by 428
19
generally moving with the tide (eg Aprahamian et al 1998) but also to swim with 429
lower ground speed during ebb tide and higher during flood tides (Smith et al 1981) 430
431
SWIMMING DEPTH 432
As salmon approached the estuary they swam closer to the surface Since the 433
brackish water from the river outlet is in the upper part of the water column one 434
explanation for this behaviour may be that they use the brackish water layer to locate 435
and recognise the river (Quinn 1990) The attraction may be due to both the lower 436
salinity level and the river odour Earlier gillnet studies have shown that returning 437
Atlantic salmon usually remain near the surface (1ndash5 m depth) but occasionally make 438
downwards movements in the water column (Stasko et al 1973) Westerberg (1982) 439
and Doslashving et al (1985) reported that Atlantic salmon with acoustic tags moved up 440
and down in the water column in association with fine-scale hydrographic 441
stratification and they both concluded that salmon searched for vertical gradients of 442
odours from the home river rather than horizontal gradients Another reason to 443
migrate closer to the sea surface when approaching the river is to acclimate to the 444
fresh water Quinn (1990) suggested that by migrating in and out of the brackish 445
water layer at the top of the water column in the estuary salmonids can adjust to the 446
salinity of their environment as they make the transition from salt water to freshwater 447
448
TIMING OF RIVER ENTRY 449
Females entered the river in average six days earlier than males which is 450
consistent with findings in other studies (Dahl et al 2004 Niemelauml et al 2006) Dahl 451
et al (2004) suggested that the earlier river entry of female Atlantic salmon may be 452
due to females being older than males when performing their spawning migration 453
20
Several previous studies indicate that older (larger) fish usually arrive earlier than 454
younger (smaller) individuals (Power 1981 Jonsson et al 1990a) However in the 455
present study there were no differences in size or age between the two sexes 456
Changes in river flow did not influence the timing of river entry Increased 457
water discharge appears to be an important proximate factor stimulating adult Atlantic 458
salmon to enter small rivers from the sea (Jonsson et al 2007) However this stimuli 459
may act in combination with other environmental factors such as water temperature 460
light tides and water chemistry (Jonsson 1991 Potter et al 1992 Smith and Smith 461
1997) The fact that no correlation between river flow tidal cycle and river entry was 462
found in this study may be due to the generally large discharge of the River Alta (75ndash463
130 m3 s-1 during the study) In a large river like this it may not be critical for salmon 464
to enter the river at high river flow in order to safely migrate upstream or have the ebb 465
tide to facilitate the recognition of the outflowing fresh water from the home river 466
This is supported by the fact that day-of-the-year day or night time river flow and 467
tidal cycle at the time of river entry in total explained only 14 of the variation 468
between different sizes of the salmon This suggests that parameters other than those 469
included in the analysis may be important for timing of river entry or that timing of 470
river entry in the River Alta simply depends on the time salmon reach the estuary and 471
river mouth If the latter is the case timing of river entry may depend on factors 472
influencing the migration in the outer fjord or open sea 473
It has been suggested that the correlation between increased discharge and the 474
time of river entry in large rivers is not due to the stimulus for Atlantic salmon to 475
enter the river per se but rather that increased freshwater supply to near coastal areas 476
may aid salmon to recognise and find their natal river increasing the number of fish 477
entering fresh water compared to low flow periods (Thorstad et al 2010) In the 478
21
present study there was no correlation between time of river entry and changes in 479
river flow one two and three days before entry However since salmon were tagged 480
and monitored in the last part of the spawning run there may already have been 481
enough freshwater in the fjord system to guide the salmon The observation that river 482
entry not is correlated with river flow in large rivers is also supported by other studies 483
(Dahl et al 2004 Karppinen et al 2004) 484
Adult salmon entered the river during all phases of the tidal cycle It has been 485
suggested that Atlantic salmon entering the river during strong ebb currents may have 486
been attracted by the outward flow of fresh water (Potter et al 1992) However there 487
is little consensus among studies about the relationship between tidal phase and river 488
entry (Potter 1988 Potter et al 1992 Smith and Smith 1997 Karppinen et al 2004) 489
Given the wide variation in the physical chemical and hydrographic characteristics of 490
estuaries this variation in the migratory responses of Atlantic salmon to the tidal 491
cycle is perhaps not surprising (Smith and Smith 1997) In general different sizes 492
forms and shapes of rivers may result in different relationships between Atlantic 493
salmon behaviour and environmental factors 494
The absence of a clear diel pattern in the timing of river mouth passage 495
differed from that observed in a post-smolt study in the River Alta when more post-496
smolts passed the river mouth at night during migration towards the sea (Davidsen et 497
al 2009) Nocturnal migration is thought to be an adaptive behaviour to reduce 498
predation by visual predators like seals (Solomon 1982) and has been observed in 499
several studies of returning Atlantic salmon (eg Potter 1988 Smith and Smith 1997) 500
Even though the northern River Alta is situated on a latitude with midnight sun light 501
intensities were still lower than 20 000 lx at night in contrast to the 50 000ndash200 000 502
lx measured during day time The fact that no difference in the diel migration pattern 503
22
was observed for adult salmon may be because they do not experience the same 504
predation level as the smaller post-smolts 505
506
MIGRATORY SPEEDS 507
The migratory speed slowed as salmon approached the estuary and salmon 508
had a lower migratory speed in the innermost part of the estuary (zone four) than in 509
the open fjord (zone onendashthree) This change in travel rates may be an indication of a 510
physiological need to adapt to the fresh water in the river time to orientate towards 511
the river mouth and to recognise the home river (Hansen and Quinn 1998) or to wait 512
for optimal conditions for upstream migration (Jonsson et al 1990b) The finding of 513
decreasing travel rates when approaching the estuary confirm results from mark and 514
recapture studies (Hansen et al 1993 Hansen and Quinn 1998) 515
516
CONTROL FISH TAGGED THE PRECEDING YEAR 517
The migration behaviour of the eight returning Atlantic salmon in 2008 518
(lsquocontrolrsquo group tagged the year before) did not differ from the newly tagged fish 519
Similar to the newly tagged fish median migratory speed decreased as they 520
approached the inner part of the fjord and the fish migrated close (4ndash5 m) to the 521
surface The migration behaviour seemed therefore not affected by capture handling 522
and tagging This is in accordance with a laboratory study indicating that swimming 523
performance of Atlantic salmon was not affected by transmitters used in the present 524
study (Thorstad et al 2000) To our knowledge this study is first one using multiyear 525
tags to capture the migration behaviour of Atlantic salmon while Welch et al (2011) 526
have used this method on juvenile Pacific salmon 527
528
23
529
ACKNOWLEDGEMENTS 530
This study was financed by the Norwegian Research Council (project no 531
17601S40) the Norwegian Institute for Nature Research the Directorate for Nature 532
Management and the University of Tromsoslash The Norwegian Water Resources and 533
Energy Directorate provided data on the river flow The crew onboard the Research 534
Vessel ldquoJohan Ruudrdquo the staff at Alta Laksefiskeri Interessentselskap (ALI) the local 535
bag net fishermen Amund Suhr Anette Grimsrud Davidsen Cedar Chittenden and 536
Jenny Jensen are all thanked for their extensive help during the field work and Gunnel 537
Oslashstborg for scale analyses Helge Meissner is thanked for assistance with genotyping 538
and Svein-Erik Fevolden and Anne K Praeligbel for valuable discussions concerning the 539
genetics Timothy Sheehan and two anonymous referees are thanked for their valuable 540
comments on an earlier version of the manuscript The experimental procedures 541
concur with the national ethical requirements and were approved by the Norwegian 542
National Animal Research Authority 543
544
24
545
REFERENCES 546
547
Alabaster JS Gough PJ and Brooker WJ 1991 The environmental requirements 548
of Atlantic salmon Salmo salar L during their passage through the Thames 549
estuary 1982-89 J Fish Biol 38 741-762 550
Aprahamian MW Jones GO and Gough PJ 1998 Movement of adult Atlantic 551
salmon in the Usk estuary Wales J Fish Biol 53 221-225 552
Banks JW 1969 A review of the litterature on the upstream migration of adult 553
salmonids J Fish Biol 1 85-136 554
Bates D and Maechler M (2010) Package ldquolme4rdquo Reference manual for the 555
package Available at httpcranr-projectorgwebpackageslme4lme4pdf 556
(Assessed 22062012) 557
Brannon EL 1981 Orientation mechanisms of homing salmonids In Salmon and 558
trout migratory behaviour symposium Edited by EL Brannon and EO Salo 559
University of Washington Seattle pp 219-227 560
Cooke SJ Iverson SJ Stokesbury MJW Hinch SG Fisk AT Smith P 561
VanderZwaag D Brattey J and Whoriskey F 2011 Ocean Tracking 562
Network Canada A network approach to addressing critical issues in fisheries 563
and resource management with implications for ocean governance Fisheries 564
36 583-592 565
Dahl J Dannewitz J Karlsson L Petersson E Loumlf A and Ragnarsson B 2004 566
The timing of spawning migration implications of environmental variation 567
life history and sex Can J Zool 82 1864-1870 568
25
Davidsen JG Rikardsen AH Halttunen E Thorstad EB Oslashkland F Letcher 569
BH Skarethhamar J and Naeligsje TF 2009 Migratory behaviour and survival 570
rates of wild northern Atlantic salmon (Salmo salar) post-smolts effects of 571
environmental factors J Fish Biol 75 1700-1718 572
Doslashving KB Westergaringrd H and Johnsen PB 1985 Role of olfaction in the 573
behavioural and neuronal responses of Atlantic salmon Salmo salar to 574
hydrographic stratification Can J Fish Aquat Sci 42 1658-1667 575
Fiske P Lund RA and Hansen LP 2005 Identifying fish farm escapees In Stock 576
identification methods Edited by SX Cadrin KD Friedland and JD 577
Waldman Elsevier Academic Press Amsterdam pp 659-680 578
Halttunen E Rikardsen AH Davidsen JG Thorstad EB and Dempson JB 579
2009 Survival migration speed and swimming depth of Atlantic salmon kelts 580
during sea entry and fjord migration In Tagging and tracking of Marine 581
Animals with Electronic Devices Reviews Methods and Technologies in Fish 582
Biology and Fisheries 9 Edited by JL Nielsen H Arrizabalaga N Fragoso 583
A Hobday M Lutcavage and J Sibert Springer Dordrecht pp 35-49 584
Hansen LP Jonsson N and Jonsson B 1993 Oceanic migration in homing 585
Atlantic salmon Anim Behav 45 927-941 586
Hansen LP and Quinn TP 1998 The marine phase of the Atlantic salmon (Salmo 587
salar) life cycle with comparisons to pacific salmon Can J Fish Aquat Sci 588
55 104-118 589
Heggberget TG Oslashkland F and Ugedal O 1993 Distribution and migratory 590
behaviour of adult wild and farmed Atlantic salmon (Salmo salar) during 591
return migration Aquaculture 118 73-83 592
ICES (2011) Report of the Working Group on North Atlantic Salmon (WGNAS) 593
26
ICES 2011ACOM09 286 pp Available at 594
httpwwwicesdkreportsACOM2011WGNASwgnas_2011_finalpdf 595
(Assessed 22062012) 596
Jonsson B Jonsson N and Hansen LP 1990a Does juvenile experience affect 597
migration and spawning of adult Atlantic salmon Behav Ecol Sociobiol 26 598
225-230 599
Jonsson B Jonsson N and Hansen LP 2007 Factors affecting river entry of adult 600
Atlantic salmon in a small river J Fish Biol 71 943-956 601
Jonsson N 1991 Influence of water flow water temperature and light on fish 602
migration in rivers Nord J Freshwat Res 66 20-35 603
Jonsson N Jonsson B and Hansen LP 1990b Partial segregation in the timing of 604
migration of Atlantic salmon of different ages Anim Behav 40 313-321 605
Karppinen P Erkinaro J Niemelauml E Moen K and Oslashkland F 2004 Return 606
migration of one-sea-winter Atlantic salmon in the River Tana J Fish Biol 607
64 1179-1192 608
Lacroix GL and Voegeli FA 2000 Development of automated monitoring 609
systems for ultrasonic transmitters In Fish Telemetry Proceedings of the 3rd 610
Conference on Fish Telemetry in Europe Edited by A Moore and IC 611
Russell CEFAS Lowestoft UK pp 37-50 612
Legendre P and Legendre L 1998 Numerical ecology p 853 Elsevier Science BV 613
Amsterdam 614
Lund RA and Hansen LP 1991 Identification of wild and reared Atlantic salmon 615
Salmo salar L using scale characters Aquacult Fish Manage 22 499-508 616
Niemelauml E Orell P Erkinaro J Dempson J Broslashrs S Svenning M and 617
Hassinen E 2006 Previously spawned Atlantic salmon ascend a large 618
27
subarctic river earlier than their maiden counterparts J Fish Biol 69 1151ndash619
1163 620
Olson AF and Quinn TP 1993 Vertical and horizontal movements of adult 621
chinook salmon Oncorhynchus tshawytscha in the Columbia River estuary 622
Fishery Bulletin of the Fish and Wildlife Service 91 171-178 623
Parrish DL Behnke RJ Gephard SR McCormick SD and Reeves GH 1998 624
Why arenrsquot there more Atlantic salmon (Salmo salar) Can J Fish Aquat 625
Sci 55 281-287 626
Pascual MA and Quinn TP 1991 Evaluation of alternative models of the coastal 627
migration of adult Fraser River sockeye salmon (Oncorhynchus nerka) Can J 628
Fish Aquat Sci 48 799-810 629
Pierce GJ Boyle PR and Thompson PM 1990 Diet selection by seals In 630
Trophic Relationships in the Marine Environment Edited by M Barnes and 631
RN Gibson Aberdeen University Press Aberdeen pp 222-238 632
Potter ECE 1988 Movements of Atlantic salmon Salmo salar L in an estuary in 633
south-west England J Fish Biol 33 153-159 634
Potter ECE Solomon DJ and Buckley AA 1992 Estuarine movements of adult 635
Atlantic salmon (Salmo salar L) in Christchurch Harbour southern England 636
In Wildlife telemetry remote monitoring and tracking of animals Edited by 637
IG Priede and SM Swift Ellis Horwood Limited Chichester England pp 638
400-409 639
Power G 1981 Stock Characteristics and Catches of Atlantic Salmon (Salmo salar) 640
in Quebec and Newfoundland and Labrador in Relation to Environmental 641
Variables Can J Fish Aquat Sci 38 1601-1611 642
28
Quinn TP 1990 Current controversies in the study of salmon homing Ethol Ecol 643
Evol 2(1) 49-63 644
Quinn TP Terahart BA and Groot C 1989 Migratory orientation and vertical 645
movements of homing adult sockeye salmon Oncorhynchus nerka in coastal 646
waters Anim Behav 37 587-599 647
Smith GW 1990 The relationship between river flow and net catches of salmon 648
(Salmo salar L) in and around the mouth of the Aberdeenshire Dee between 649
1973 and 1986 Fish Res 10 73-91 650
Smith GW Hawkins AD Urquhart GG and Shearer WM 1981 Orientation 651
and energetic efficiency in the offshore movements of returning Atlantic 652
salmon Salmo salar L Scott Fish Res Rep 21 1-22 653
Smith IP and Smith GW 1997 Tidal and diel timing of river entry by adult 654
Atlantic salmon returning to the Aberdeenshire Dee Scotland J Fish Biol 50 655
463-474 656
Solomon DJ 1982 Smolt migration in Atlantic salmon (Salmo salar L) and sea 657
trout (Salmo trutta L) In Salmon and trout migratory behavior symposium 658
Edited by EL Brannon and EO Salo University of Washington Seattle pp 659
196-203 660
Stabell OB 1982 Homing of Atlantic salmon in relation to olfaction and genetics In 661
Salmon and trout migratory behaviour symposium Edited by EL Brannon 662
and EO Salo University of Washington Seattle pp 238-246 663
Stasko AB Sutterlin AM Rommel SAj and Elson PF 1973 Migration-664
orientation of Atlantic salmon (Salmo salar L) In International Atlantic 665
Salmon Symposium Special Publication Series Edited by MW Smith and 666
29
WM Carter International Atlantic Salmon Foundation New York pp 119-667
137 668
Svendsen H 1995 Physical oceanography of coupled fjord-coast systems in northern 669
Norway with special focus on frontal dynamics and tides In Ecology of fjords 670
and coastal waters Edited by HR Skjoldal C Hopkins KJ Erikstad and 671
HP Leinaas Elsevier Science Publ B V Amsterdam pp 149-164 672
Thorstad EB Heggberget TG and Oslashkland F 1998 Migratory behaviour of adult 673
wild and escaped farmed Atlantic salmon Salmo salar L before during and 674
after spawning in a Norwegian river Aquacult Res 29 419-428 675
Thorstad EB Whoriskey F Uglem I Moore A Rikardsen AH and Finstad B 676
2012 A critical life stage of the Atlantic salmon Salmo salar behaviour and 677
survival during the smolt and initial post-smolt migration J Fish Biol 81 678
500-542 679
Thorstad EB Whoriskey FG Rikardsen AH and Aarestrup K 2010 Aquatic 680
nomads the life and migrations of the Atlantic salmon In Atlantic Salmon 681
Ecology Edited by Oslash Aas S Einum A Klemetsen and J Skurdal Wiley-682
Blackwell New York pp 1-32 683
Thorstad EB Oslashkland F Aarestrup K and Heggberget TG 2008 Factors 684
affecting the within-river spawning migration of Atlantic salmon with 685
emphasis on human impacts Rev Fish Biol Fish 18 345-371 686
Thorstad EB Oslashkland F and Finstad B 2000 Effects of telemetry transmitters on 687
swimming performance of adult Atlantic salmon J Fish Biol 57 531-535 688
Treacutepanier S Rodriacuteguez MA and Magnan P 1996 Spawning migrations in 689
landlocked Atlantic salmon time series modelling of river discharge and water 690
temperature effects J Fish Biol 48 925-936 691
30
Ugedal O Naeligsje TF Thorstad EB Forseth T Saksgaringrd L and Heggberget 692
TG 2008 Twenty years of hydropower regulation in the River Alta long 693
term changes in abundance of juvenile and adult Atlantic salmon 694
Hydrobiologia 609 9-23 695
Welch DW Melnychuk MC Payne JC Rechisky EL Porter AD Jackson 696
GD Ward BR Vincent SP Wood CC and Semmens J 2011 In situ 697
Measurement of Coastal Ocean Movements and Survival of Juvenile Pacific 698
Salmon Proc Natl Acad Sci USA 108 8708-8713 699
Westerberg H 1982 Ultrasonic tracking of Atlantic salmon (Salmo salar L) ndash II 700
Swimming depth and temperature stratification Rep Inst Fresh Res 701
Drottningholm 60 102-120 702
1
TABLES 1
Table 1 Mean swimming depth registered at the time Atlantic salmon (Salmo salar) passed 2
the array 2ndash5 in the Alta Fjord Mean values are based on individual means Welchrsquos t-test 3
was used to test for significant difference between male and female swimming depth 4
5
ALS
Array
n
Mean
(m)
SD individual
mean (range)
(m)
Deepest
individual
recording
(m)
Mean
depth
females
(m)
Mean
depth
males
(m)
p-value
(between
sexes)
2 23 24 37 (00ndash161) 297 26 18 057
3 24 11 15 (00ndash64) 189 09 14 036
4 18 15 19 (00ndash67) 109 14 17 075
5 21 05 07 (00ndash18) 146 04 09 018
2
Table 2 Comparisons of the number and proportions of homing Atlantic salmon (Salmo 6
salar) entering the river during 1) different stages of the tidal cycle and 2) for different 7
combinations of day and night and different stages of the tidal cycle Chi-square-tests were 8
used to test for differences between different stages of the tidal cycle and between the 9
different combinations of day and night and different stages of the tidal cycle 10
11
Number
(n =56) P-value
High tide 15 27
Ebbing tide 13 23
Low tide 9 16
Flooding tide 19 34 029
High tide day time 7 13
High tide night time 8 14
Ebbing tide day time 7 13
Ebbing tide night time 6 11
Low tide day time 5 9
Low tide night time 4 7
Flooding tide day time 11 20
Flooding tide night time 8 14 071
12
3
Table 3 Results from a redundancy analysis (RDA) exploring whether timing of river entry 13
(day-of-the-year day or night river flow tidal cycle) of Atlantic salmon (Salmo salar) 14
depended on fork length or body mass The proportion of constrained and unconstrained 15
inertia (the sum of the variance from all included parameters) from total inertia was 16
calculated which in RDA gives the proportion of variance 17
18
19
Inertia Proportion
Total 20000 10000
Constrained 02846 01423
Unconstrained 17154 08577
0
N
5
km RiverAlta
Alta Fjord
70deg30deg20deg
65deg
Norway Sweden
Finland
1
2
34
5
Z 1Z 1 Z 2Z 2
Z 3Z 3Z 4Z 47 6
10
11
12
13
14
15
16
40
50
60
70
80
90
100
110
120
130
140
57 127 197 267 28
Tem
pera
ture
(degC
)
Riv
er fl
ow (m
3 s-1
)
Date 2007
0 7 0 7 1 0 0 7 1 3 0 7 1 6 0 7 1 9 0 7 2 2 0 7 2 5 0 7 - 1 0
- 5
0
5
1 0
1 5
2 0
0 7 0 7 1 0 0 7 1 3 0 7 1 6 0 7 1 9 0 7 2 2 0 7 2 5 0 7 - 1 0
- 5
0
5
1 0
1 5
2 0
Cur
rent
vel
ocity
com
pone
nt (c
m s-1
) C
urre
nt v
eloc
ity c
ompo
nent
(cm
s-1
)
Date 2007
12
34
00 05 10 15 20
Fjord zone (year 2007)
Migratory speed (bl sminus1)
AB
C
00 05 10 15 20
Fjord zone (year 2008)
Migratory speed (bl sminus1)
1
FIGURE CAPTIONS 1
2
Figure 1 Map of the lower part of River Alta and the Alta Fjord showing the position 3
of the bag nets ( ) and the release sites ( ) ALS array 1 is indicated with () while 4
ALS arrays 2ndash5 are indicated by grey and black lines Most fish passed these ALSs in the 5
darker parts of the lines The two ALSs in the river mouth (array 6) and the three ALSs 6
(array 7) in the river are given by () The map also shows the position of the two current 7
meters in ALS array 3 ( ) the four zones (Z1ndash4) and the weather station () In the 8
following year (2008) were only array 1 3 5 and 6 present 9
10
11
Figure 2 Daily river flow (- - - - -) and water temperature (___) in the River Alta 12
13
14
Figure 3 Salinity distribution recorded at 0ndash12 m depth across ALS array 2 (a amp c) and ALS 15
array 3 (b amp d) in the Alta Fjord on 6 July (a amp b) and 13 July (c amp d) 2007 16
17
18
Figure 4 Current velocity components at 3 m depth at the north-eastern (upper panel) and 19
south-western (lower panel) side of the Alta Fjord at the ALS array 3 Positive values are 20
towards the fjord head and negative values are towards the fjord mouth indicates time of 21
individual Atlantic salmon (Salmo salar) passage 22
23
2
Figure 5 Migratory speeds of homing Atlantic salmon (Salmo salar) in the Alta Fjord in 2007 24
and 2008 In 2007 the fjord was divided into four zones (see map Fig 1) In 2008 zone A 25
was the area from ALS1ndash3 zone B from ALS3ndash5 and zone C from ALS5ndash6 The box-26
and-whisker plots give the median values (black lines) the interquartile ranges (box 50 of 27
the data falling into this) and the 5th and 95th percentiles (whiskers) 28
29
- cjfas-2012-0352-final1
-
- Homing behaviour of Atlantic salmon (Salmo salar) during final phase of marine migration and river entry
-
- Table 1-3
- Figure 1
- Figure 2
-
- Slide Number 1
-
- Figure 3
-
- Slide Number 1
-
- Figure 4
-
- Slide Number 1
-
- Figure 5
- FIGURE CAPTIONS
-

11
232
DATA ANALYSES 233
Differences in the horizontal distribution along the different ALS arrays and 234
differences in the horizontal distribution between periods with and without wind were 235
tested with Chi-square tests To take into account the time lag of wind forces on the 236
water currents mean average wind speed and direction from the last two hours before 237
the passage of salmon in the ALS array were used Due to the low number of salmon 238
registered at each ALS array (range 26ndash33) the wind speeds were divided into only 239
two categories ldquono windrdquo was defined as wind speeds less than 30 m s-1 and ldquowindrdquo 240
as wind speeds from 31ndash134 m s-1 (highest measured value) Brackish water was 241
defined as salinity lt 30 242
Since the individual swimming depths had unequal variance difference in 243
swimming depth between the different ALS arrays was tested with Welchrsquos t-test 244
(two-way t-test assuming unequal variance) 245
The relationship between time of river entry and river flow the same day and 246
cumulative changes in river flow from one two and three days before river entry 247
were tested with linear regression analyses To test if salmon entered the river during 248
day or night night was defined as 2000ndash0800 hours which during the study period 249
corresponded to light intensities less than 20 000 lx Chi-square-tests were used to test 250
for differences between river entry at day or night during different stages of the tidal 251
cycle (divided into three hour phases high ebbing low or flooding tide) and between 252
the different combinations of day and night and different stages of the tidal cycle In 253
order to explore if timing of river entry (day-of-the-year day or night river flow tidal 254
cycle) depended on fork length or body mass a redundancy analysis (RDA Legendre 255
and Legendre 1998) was used as ordination method The proportion of the constrained 256
12
inertia (the sum of the variance from all included parameters) from the total inertia 257
was calculated which in RDA gives the proportion of variance The package ldquoVeganrdquo 258
(Oksanen 2008) was used in the software program R 28 (httpwwwr-projectorg) 259
Day and night and the tidal cycle groups were coded as dummy variables 260
Time spent in the different parts of the fjord system and migratory speeds 261
were calculated for those salmon registered at two subsequent ALS arrays Since not 262
all salmon were registered by all arrays the sample sizes for these analyses were 263
smaller than the total number of salmon registered Migratory speed was estimated as 264
individual body lengths (LF) per second and km per day by using the shortest distance 265
between the actual ALS recording the detection and the river mouth thus giving 266
minimum estimates (Thorstad et al 2004) Individual mean and median values were 267
used to calculate the populations mean and median in order to keep the data points 268
independent Differences in swimming speeds between the four zones were tested as 269
unbalanced unreplicated repeated measurements by fitting a linear mixed model using 270
the restricted maximum likelihood (REML) method The resulting zone term in the 271
fitted model was when tested with a likelihood ratio test against the null model The 272
package ldquolme4rdquo (Bates and Maechler 2010) was used in the software program R 212 273
(httpwwwr-projectorg) 274
Relationships between migratory speed and river flow the same day as river 275
entry and cumulative changes in river flow from one two and three days before river 276
entry were tested with linear regression analyses Possible significant p-values were 277
corrected for multiple comparisons using the Bonferroni procedure 278
279
280
RESULTS 281
13
Fifty-nine of the 74 confirmed wild salmon (80) were registered in the river 282
mouth (array 6) and 56 (76) entered the river Of those 15 fish that did not enter 283
the river mouth five were recaptured by anglers in the fjord seven left the fjord 284
(registered in array 1) and the remaining three were only registered some few times 285
at array 2 Genetic assignment tests supported the homing of the 56 salmon to their 286
natal river (JG Davidsen unpublished data) Data from these 56 salmon are used in 287
the following analyses 288
289
ENVIRONMENTAL DATA 290
The river flow in River Alta decreased during the period 5ndash26 July from 130 291
m3 s-1 to 75 m3 s-1 Thereafter it increased again (Fig 2) 292
In summer the surface layer in the Alta Fjord consists of brackish water due 293
to the large freshwater supply from the river The Alta fjord is a wide fjord where the 294
Coriolis effect on the circulation is considerable (Svendsen 1995) allowing cross-295
fjord gradients in current velocities salinity and temperature Theoretically the 296
brackish water would therefore follow the eastern side of the Alta fjord towards the 297
sea This was clearly seen in the conductivity temperature and depth (CTD) sections 298
from July 13 (Fig 3) when the lowest salinities were measured on the eastern side of 299
the fjord on array 1ndash3 (only array 2 and 3 are shown in the figure) One week 300
earlier the vertical salinity gradients were stronger in the upper 4 m while the 301
horizontal gradients were weaker This difference can be explained by the larger river 302
runoff in early July than mid-July combined with stronger winds (up to 8 m s-1) with 303
northerly components spreading the surface water across the fjord Thus in array 1 304
and 2 the brackish water (salinity less than 30) was found only along the eastern side 305
14
on the 13 July while covering the entire fjord section one week earlier At array 3 306
the brackish water covered the upper 3ndash4 m all along the array both days 307
The currents at both current meter locations were highly variable and did not 308
co-vary (Fig 4) Surface temperature varied during the study period between 11 and 309
17 ordmC 310
311
HORIZONTAL DISTRIBUTION 312
Most of the salmon (n = 70 95) were captured tagged and released on the 313
eastern side of the fjord Only four salmon (5) were captured on the western side 314
(Fig 1) When passing the array 2 where 55 of the 56 salmon were registered the 315
horizontal distribution corresponded to the distribution at release (Chi-square test P = 316
022 n = 55) Forty salmon (73) were registered on the eastern side 11 (20) in the 317
central part and four (7) on the western side 318
When passing the array 3 (Fig 1) more salmon migrated in the central and 319
south-western part of the fjord (Chi-square test P lt 0001 n = 55) Twelve salmon 320
(22) were registered on the north-eastern side 23 (42) in the central part and 20 321
(36) on the south-western side In the array 4 and 5 salmon were equally 322
distributed between the eastern (45 46 respectively) and western side (41 323
50 respectively) but only few individuals migrated in the central part (14 4 324
respectively) The horizontal distribution along the third AL array 3 in 2007 differed 325
between periods with and without wind During periods with no wind most salmon 326
passed the array on the north-eastern side while when the wind was blowing from the 327
north (321ndash50deg) most salmon were found in the central part of the array (Chi-square 328
test df = 2 P lt 001) Such difference was not observed when salmon passed array 329
2 4 or 5 330
15
There was no correlation between the passage time at array 3 and the current 331
direction (inout of the fjord) at either the north-eastern (Chi-square test df = 1 P = 332
086) or south-western current meter (Chi-square test df =1 P = 016) (Fig 4) The 333
current speeds (lt 20 cm s-1 Fig 4) were consistently well below the estimated 334
migratory speed of the salmon between the river mouth (array 6) and array 1 335
(average 63 cm s-1) 336
337
SWIMMING DEPTH 338
The mean swimming depth when crossing array 2ndash5 varied from 05ndash24 339
meter (Table 1) When approaching the estuary salmon swam closer to the surface 340
There was no difference in swimming depth between males and females Seven of the 341
lsquocontrolrsquo fish (the fish that returned to the river again in 2008) had depth sensing tags 342
Mean migration depth was 5 m (range 0ndash8 SD = 2) at array 1 4 m (range 0ndash6 SD 343
= 2) at array 3 and 5 m (range 0ndash9 SD = 3) at array 5 which was slightly deeper 344
than the newly tagged fish 345
346
TIMING OF RIVER ENTRY 347
Females entered the river on average six days before the males (Welchrsquos t-test 348
df = 42 P = 002) Timing of river entry did not depend on river flow on the day of 349
entry (r2 = 016 P = 006) or on cumulative changes from one (r2 = 0007 P = 070) 350
two (r2 = 0003 P = 081) or three days before entry (r2 = 0003 P = 080) No 351
difference in the timing of river entry was found in relation to the tides (Table 2) 352
There was also no difference in the timing of river entry (day-of-the-year day or 353
night river flow tidal cycle) in relation to fork length or body mass since only 14 354
16
of the variation (Table 3) of the constrained axes in the redundancy analysis was 355
explained by the timing of river entry between different sizes of salmon 356
There was a clear difference in the light intensities between day (50 000ndash209 424 lx) 357
and night (183ndash20 000 lx) during the study period (5ndash24 July) but no significant 358
difference was observed in the timing of river entry between day and night or in the 359
combination of tidal water and day or night (Table 2) Thirty salmon entered the river 360
during day-time and 26 during night time (Chi-square test df = 1 p-value = 062) 361
362
MIGRATORY SPEEDS 363
Mean migratory speed from release to river entry was 97 km day-1 (01 LF s-364
1) but with large individual variation (n = 54 range 07ndash331 km day-1 SD = 80) 365
The mean speed was lower (Welchrsquos t-test df = 50 P = 0003) from release to the 366
array 2 (93 km day-101 LF s-1 n = 52 range 05ndash710 km day-1 SD = 122) than 367
from array 2 to the river mouth (165 km day-102 LF s-1 n = 51 range 06ndash610 km 368
day-1 SD = 137) Median migratory speed (Fig 5) was fastest in zone 1 (06 LF s-1) 369
and decreased as the fish migrated towards the river mouth (01 LF s-1) (05 LF s-1 04 370
LF s-1and 01 LF s-1for zones 2‐4 respectively Linear mixed‐effects model n = 159 P 371
lt 0001) 372
Migratory speed from ALS array one to the river mouth did not depend on the 373
river flow on the day of river entry (r2 = 0007 P = 055) or on cumulative changes in 374
water flow from one (r2 = 0019 P = 031) two (r2 = 0028 P = 022) or three days 375
before entry (r2 = 0013 P = 041) There was also no relationship between migratory 376
speed in zone four (the last 2 km before river entry) and river flow on the day of river 377
entry (r2 = 0033 P = 029) or changes in river flow from the day before entry (r2 = 378
0037 P = 027) 379
17
For the eight returning Atlantic salmon in 2008 (lsquocontrolrsquo group tagged the 380
year before) the median migratory speed decreased as they approached the inner part 381
of the fjord similar to the newly tagged fish (Fig 5) Median migratory speed from 382
array 1 to the river mouth was 272 km day-1 (range 19ndash538 km day-1 SD = 199) 383
which was higher than when salmon were tagged and initially studied in 2007 384
However while the lsquocontrolrsquo group was registered at array 1 the registrations in 385
2007 started at array 2 Therefore a larger part of the fjord was included in 2008 386
387
388
DISCUSSION 389
These results from the relatively pristine Alta Fjord confirmed the hypothesis 390
that horizontal adult migration path was closer to the coastline as the fish approached 391
the river mouth but the distribution was influenced by brackish water distribution 392
northerly winds spread the brackish water across the fjord and the Atlantic salmon 393
seemed to follow this Further the results supported the hypothesis that the migration 394
occurred closer to the surface as the salmon approached the river mouth however the 395
findings could not confirm that river entry was facilitated by increased water 396
discharge and ebb tide and occurred mainly during the night The results confirmed 397
the hypothesis that the marine migration speed of returning Atlantic salmon declined 398
towards the river mouth however the hypothesis that marine migration speeds 399
increased with increasing river discharge was not supported A similar behaviour 400
between newly tagged fish and those tagged the year before their homing migration 401
supported the hypothesis that the migration pattern was not largely affected by short-402
term capture handling and tagging effects 403
404
18
HORIZONTAL DISTRIBUTION 405
Atlantic salmon generally followed the coastline during their homing 406
migration which may suggest that the coastline was used as a guide for orientating to 407
the river The complex interface between open ocean and up-river migration pose 408
special challenges and salmon may use elements of many orientation systems (Quinn 409
et al 1989 Pascual and Quinn 1991 Olson and Quinn 1993) It is widely accepted 410
that salmon at least partly rely on olfactory information to orientate to their home 411
river (Brannon 1981 Stabell 1982 Quinn 1990) The fact that most of the returning 412
adults were observed on the eastern side in the outer and central part of the fjord 413
where the lowest salinities were measured may suggest that the fish used this side of 414
the fjord because it provided the best conditions to locate and recognise the river At 415
array 3 in the inner part of the fjord the brackish layer covered the entire array and 416
here the returning adults utilized both sides of the fjord 417
Despite finding no correlation between the current direction measured at 3 m 418
depth and migratory pattern at array 3 there was a significant relationship between 419
wind direction and horizontal distribution of salmon when passing this array This 420
may indicate that the salmon distribution was influenced by wind induced spreading 421
of river water across the array The same pattern was observed during the outward 422
post-smolts migration studied in the same fjord in the same year (Davidsen et al 423
2009) 424
Despite the wind induced spreading of river water across the fjord mean 425
migratory speed was always higher than measured current velocities so it seems that 426
salmon had an active swimming behaviour when passing the array 3 In other 427
studies Atlantic salmon have been found to be influenced by the tidal current by 428
19
generally moving with the tide (eg Aprahamian et al 1998) but also to swim with 429
lower ground speed during ebb tide and higher during flood tides (Smith et al 1981) 430
431
SWIMMING DEPTH 432
As salmon approached the estuary they swam closer to the surface Since the 433
brackish water from the river outlet is in the upper part of the water column one 434
explanation for this behaviour may be that they use the brackish water layer to locate 435
and recognise the river (Quinn 1990) The attraction may be due to both the lower 436
salinity level and the river odour Earlier gillnet studies have shown that returning 437
Atlantic salmon usually remain near the surface (1ndash5 m depth) but occasionally make 438
downwards movements in the water column (Stasko et al 1973) Westerberg (1982) 439
and Doslashving et al (1985) reported that Atlantic salmon with acoustic tags moved up 440
and down in the water column in association with fine-scale hydrographic 441
stratification and they both concluded that salmon searched for vertical gradients of 442
odours from the home river rather than horizontal gradients Another reason to 443
migrate closer to the sea surface when approaching the river is to acclimate to the 444
fresh water Quinn (1990) suggested that by migrating in and out of the brackish 445
water layer at the top of the water column in the estuary salmonids can adjust to the 446
salinity of their environment as they make the transition from salt water to freshwater 447
448
TIMING OF RIVER ENTRY 449
Females entered the river in average six days earlier than males which is 450
consistent with findings in other studies (Dahl et al 2004 Niemelauml et al 2006) Dahl 451
et al (2004) suggested that the earlier river entry of female Atlantic salmon may be 452
due to females being older than males when performing their spawning migration 453
20
Several previous studies indicate that older (larger) fish usually arrive earlier than 454
younger (smaller) individuals (Power 1981 Jonsson et al 1990a) However in the 455
present study there were no differences in size or age between the two sexes 456
Changes in river flow did not influence the timing of river entry Increased 457
water discharge appears to be an important proximate factor stimulating adult Atlantic 458
salmon to enter small rivers from the sea (Jonsson et al 2007) However this stimuli 459
may act in combination with other environmental factors such as water temperature 460
light tides and water chemistry (Jonsson 1991 Potter et al 1992 Smith and Smith 461
1997) The fact that no correlation between river flow tidal cycle and river entry was 462
found in this study may be due to the generally large discharge of the River Alta (75ndash463
130 m3 s-1 during the study) In a large river like this it may not be critical for salmon 464
to enter the river at high river flow in order to safely migrate upstream or have the ebb 465
tide to facilitate the recognition of the outflowing fresh water from the home river 466
This is supported by the fact that day-of-the-year day or night time river flow and 467
tidal cycle at the time of river entry in total explained only 14 of the variation 468
between different sizes of the salmon This suggests that parameters other than those 469
included in the analysis may be important for timing of river entry or that timing of 470
river entry in the River Alta simply depends on the time salmon reach the estuary and 471
river mouth If the latter is the case timing of river entry may depend on factors 472
influencing the migration in the outer fjord or open sea 473
It has been suggested that the correlation between increased discharge and the 474
time of river entry in large rivers is not due to the stimulus for Atlantic salmon to 475
enter the river per se but rather that increased freshwater supply to near coastal areas 476
may aid salmon to recognise and find their natal river increasing the number of fish 477
entering fresh water compared to low flow periods (Thorstad et al 2010) In the 478
21
present study there was no correlation between time of river entry and changes in 479
river flow one two and three days before entry However since salmon were tagged 480
and monitored in the last part of the spawning run there may already have been 481
enough freshwater in the fjord system to guide the salmon The observation that river 482
entry not is correlated with river flow in large rivers is also supported by other studies 483
(Dahl et al 2004 Karppinen et al 2004) 484
Adult salmon entered the river during all phases of the tidal cycle It has been 485
suggested that Atlantic salmon entering the river during strong ebb currents may have 486
been attracted by the outward flow of fresh water (Potter et al 1992) However there 487
is little consensus among studies about the relationship between tidal phase and river 488
entry (Potter 1988 Potter et al 1992 Smith and Smith 1997 Karppinen et al 2004) 489
Given the wide variation in the physical chemical and hydrographic characteristics of 490
estuaries this variation in the migratory responses of Atlantic salmon to the tidal 491
cycle is perhaps not surprising (Smith and Smith 1997) In general different sizes 492
forms and shapes of rivers may result in different relationships between Atlantic 493
salmon behaviour and environmental factors 494
The absence of a clear diel pattern in the timing of river mouth passage 495
differed from that observed in a post-smolt study in the River Alta when more post-496
smolts passed the river mouth at night during migration towards the sea (Davidsen et 497
al 2009) Nocturnal migration is thought to be an adaptive behaviour to reduce 498
predation by visual predators like seals (Solomon 1982) and has been observed in 499
several studies of returning Atlantic salmon (eg Potter 1988 Smith and Smith 1997) 500
Even though the northern River Alta is situated on a latitude with midnight sun light 501
intensities were still lower than 20 000 lx at night in contrast to the 50 000ndash200 000 502
lx measured during day time The fact that no difference in the diel migration pattern 503
22
was observed for adult salmon may be because they do not experience the same 504
predation level as the smaller post-smolts 505
506
MIGRATORY SPEEDS 507
The migratory speed slowed as salmon approached the estuary and salmon 508
had a lower migratory speed in the innermost part of the estuary (zone four) than in 509
the open fjord (zone onendashthree) This change in travel rates may be an indication of a 510
physiological need to adapt to the fresh water in the river time to orientate towards 511
the river mouth and to recognise the home river (Hansen and Quinn 1998) or to wait 512
for optimal conditions for upstream migration (Jonsson et al 1990b) The finding of 513
decreasing travel rates when approaching the estuary confirm results from mark and 514
recapture studies (Hansen et al 1993 Hansen and Quinn 1998) 515
516
CONTROL FISH TAGGED THE PRECEDING YEAR 517
The migration behaviour of the eight returning Atlantic salmon in 2008 518
(lsquocontrolrsquo group tagged the year before) did not differ from the newly tagged fish 519
Similar to the newly tagged fish median migratory speed decreased as they 520
approached the inner part of the fjord and the fish migrated close (4ndash5 m) to the 521
surface The migration behaviour seemed therefore not affected by capture handling 522
and tagging This is in accordance with a laboratory study indicating that swimming 523
performance of Atlantic salmon was not affected by transmitters used in the present 524
study (Thorstad et al 2000) To our knowledge this study is first one using multiyear 525
tags to capture the migration behaviour of Atlantic salmon while Welch et al (2011) 526
have used this method on juvenile Pacific salmon 527
528
23
529
ACKNOWLEDGEMENTS 530
This study was financed by the Norwegian Research Council (project no 531
17601S40) the Norwegian Institute for Nature Research the Directorate for Nature 532
Management and the University of Tromsoslash The Norwegian Water Resources and 533
Energy Directorate provided data on the river flow The crew onboard the Research 534
Vessel ldquoJohan Ruudrdquo the staff at Alta Laksefiskeri Interessentselskap (ALI) the local 535
bag net fishermen Amund Suhr Anette Grimsrud Davidsen Cedar Chittenden and 536
Jenny Jensen are all thanked for their extensive help during the field work and Gunnel 537
Oslashstborg for scale analyses Helge Meissner is thanked for assistance with genotyping 538
and Svein-Erik Fevolden and Anne K Praeligbel for valuable discussions concerning the 539
genetics Timothy Sheehan and two anonymous referees are thanked for their valuable 540
comments on an earlier version of the manuscript The experimental procedures 541
concur with the national ethical requirements and were approved by the Norwegian 542
National Animal Research Authority 543
544
24
545
REFERENCES 546
547
Alabaster JS Gough PJ and Brooker WJ 1991 The environmental requirements 548
of Atlantic salmon Salmo salar L during their passage through the Thames 549
estuary 1982-89 J Fish Biol 38 741-762 550
Aprahamian MW Jones GO and Gough PJ 1998 Movement of adult Atlantic 551
salmon in the Usk estuary Wales J Fish Biol 53 221-225 552
Banks JW 1969 A review of the litterature on the upstream migration of adult 553
salmonids J Fish Biol 1 85-136 554
Bates D and Maechler M (2010) Package ldquolme4rdquo Reference manual for the 555
package Available at httpcranr-projectorgwebpackageslme4lme4pdf 556
(Assessed 22062012) 557
Brannon EL 1981 Orientation mechanisms of homing salmonids In Salmon and 558
trout migratory behaviour symposium Edited by EL Brannon and EO Salo 559
University of Washington Seattle pp 219-227 560
Cooke SJ Iverson SJ Stokesbury MJW Hinch SG Fisk AT Smith P 561
VanderZwaag D Brattey J and Whoriskey F 2011 Ocean Tracking 562
Network Canada A network approach to addressing critical issues in fisheries 563
and resource management with implications for ocean governance Fisheries 564
36 583-592 565
Dahl J Dannewitz J Karlsson L Petersson E Loumlf A and Ragnarsson B 2004 566
The timing of spawning migration implications of environmental variation 567
life history and sex Can J Zool 82 1864-1870 568
25
Davidsen JG Rikardsen AH Halttunen E Thorstad EB Oslashkland F Letcher 569
BH Skarethhamar J and Naeligsje TF 2009 Migratory behaviour and survival 570
rates of wild northern Atlantic salmon (Salmo salar) post-smolts effects of 571
environmental factors J Fish Biol 75 1700-1718 572
Doslashving KB Westergaringrd H and Johnsen PB 1985 Role of olfaction in the 573
behavioural and neuronal responses of Atlantic salmon Salmo salar to 574
hydrographic stratification Can J Fish Aquat Sci 42 1658-1667 575
Fiske P Lund RA and Hansen LP 2005 Identifying fish farm escapees In Stock 576
identification methods Edited by SX Cadrin KD Friedland and JD 577
Waldman Elsevier Academic Press Amsterdam pp 659-680 578
Halttunen E Rikardsen AH Davidsen JG Thorstad EB and Dempson JB 579
2009 Survival migration speed and swimming depth of Atlantic salmon kelts 580
during sea entry and fjord migration In Tagging and tracking of Marine 581
Animals with Electronic Devices Reviews Methods and Technologies in Fish 582
Biology and Fisheries 9 Edited by JL Nielsen H Arrizabalaga N Fragoso 583
A Hobday M Lutcavage and J Sibert Springer Dordrecht pp 35-49 584
Hansen LP Jonsson N and Jonsson B 1993 Oceanic migration in homing 585
Atlantic salmon Anim Behav 45 927-941 586
Hansen LP and Quinn TP 1998 The marine phase of the Atlantic salmon (Salmo 587
salar) life cycle with comparisons to pacific salmon Can J Fish Aquat Sci 588
55 104-118 589
Heggberget TG Oslashkland F and Ugedal O 1993 Distribution and migratory 590
behaviour of adult wild and farmed Atlantic salmon (Salmo salar) during 591
return migration Aquaculture 118 73-83 592
ICES (2011) Report of the Working Group on North Atlantic Salmon (WGNAS) 593
26
ICES 2011ACOM09 286 pp Available at 594
httpwwwicesdkreportsACOM2011WGNASwgnas_2011_finalpdf 595
(Assessed 22062012) 596
Jonsson B Jonsson N and Hansen LP 1990a Does juvenile experience affect 597
migration and spawning of adult Atlantic salmon Behav Ecol Sociobiol 26 598
225-230 599
Jonsson B Jonsson N and Hansen LP 2007 Factors affecting river entry of adult 600
Atlantic salmon in a small river J Fish Biol 71 943-956 601
Jonsson N 1991 Influence of water flow water temperature and light on fish 602
migration in rivers Nord J Freshwat Res 66 20-35 603
Jonsson N Jonsson B and Hansen LP 1990b Partial segregation in the timing of 604
migration of Atlantic salmon of different ages Anim Behav 40 313-321 605
Karppinen P Erkinaro J Niemelauml E Moen K and Oslashkland F 2004 Return 606
migration of one-sea-winter Atlantic salmon in the River Tana J Fish Biol 607
64 1179-1192 608
Lacroix GL and Voegeli FA 2000 Development of automated monitoring 609
systems for ultrasonic transmitters In Fish Telemetry Proceedings of the 3rd 610
Conference on Fish Telemetry in Europe Edited by A Moore and IC 611
Russell CEFAS Lowestoft UK pp 37-50 612
Legendre P and Legendre L 1998 Numerical ecology p 853 Elsevier Science BV 613
Amsterdam 614
Lund RA and Hansen LP 1991 Identification of wild and reared Atlantic salmon 615
Salmo salar L using scale characters Aquacult Fish Manage 22 499-508 616
Niemelauml E Orell P Erkinaro J Dempson J Broslashrs S Svenning M and 617
Hassinen E 2006 Previously spawned Atlantic salmon ascend a large 618
27
subarctic river earlier than their maiden counterparts J Fish Biol 69 1151ndash619
1163 620
Olson AF and Quinn TP 1993 Vertical and horizontal movements of adult 621
chinook salmon Oncorhynchus tshawytscha in the Columbia River estuary 622
Fishery Bulletin of the Fish and Wildlife Service 91 171-178 623
Parrish DL Behnke RJ Gephard SR McCormick SD and Reeves GH 1998 624
Why arenrsquot there more Atlantic salmon (Salmo salar) Can J Fish Aquat 625
Sci 55 281-287 626
Pascual MA and Quinn TP 1991 Evaluation of alternative models of the coastal 627
migration of adult Fraser River sockeye salmon (Oncorhynchus nerka) Can J 628
Fish Aquat Sci 48 799-810 629
Pierce GJ Boyle PR and Thompson PM 1990 Diet selection by seals In 630
Trophic Relationships in the Marine Environment Edited by M Barnes and 631
RN Gibson Aberdeen University Press Aberdeen pp 222-238 632
Potter ECE 1988 Movements of Atlantic salmon Salmo salar L in an estuary in 633
south-west England J Fish Biol 33 153-159 634
Potter ECE Solomon DJ and Buckley AA 1992 Estuarine movements of adult 635
Atlantic salmon (Salmo salar L) in Christchurch Harbour southern England 636
In Wildlife telemetry remote monitoring and tracking of animals Edited by 637
IG Priede and SM Swift Ellis Horwood Limited Chichester England pp 638
400-409 639
Power G 1981 Stock Characteristics and Catches of Atlantic Salmon (Salmo salar) 640
in Quebec and Newfoundland and Labrador in Relation to Environmental 641
Variables Can J Fish Aquat Sci 38 1601-1611 642
28
Quinn TP 1990 Current controversies in the study of salmon homing Ethol Ecol 643
Evol 2(1) 49-63 644
Quinn TP Terahart BA and Groot C 1989 Migratory orientation and vertical 645
movements of homing adult sockeye salmon Oncorhynchus nerka in coastal 646
waters Anim Behav 37 587-599 647
Smith GW 1990 The relationship between river flow and net catches of salmon 648
(Salmo salar L) in and around the mouth of the Aberdeenshire Dee between 649
1973 and 1986 Fish Res 10 73-91 650
Smith GW Hawkins AD Urquhart GG and Shearer WM 1981 Orientation 651
and energetic efficiency in the offshore movements of returning Atlantic 652
salmon Salmo salar L Scott Fish Res Rep 21 1-22 653
Smith IP and Smith GW 1997 Tidal and diel timing of river entry by adult 654
Atlantic salmon returning to the Aberdeenshire Dee Scotland J Fish Biol 50 655
463-474 656
Solomon DJ 1982 Smolt migration in Atlantic salmon (Salmo salar L) and sea 657
trout (Salmo trutta L) In Salmon and trout migratory behavior symposium 658
Edited by EL Brannon and EO Salo University of Washington Seattle pp 659
196-203 660
Stabell OB 1982 Homing of Atlantic salmon in relation to olfaction and genetics In 661
Salmon and trout migratory behaviour symposium Edited by EL Brannon 662
and EO Salo University of Washington Seattle pp 238-246 663
Stasko AB Sutterlin AM Rommel SAj and Elson PF 1973 Migration-664
orientation of Atlantic salmon (Salmo salar L) In International Atlantic 665
Salmon Symposium Special Publication Series Edited by MW Smith and 666
29
WM Carter International Atlantic Salmon Foundation New York pp 119-667
137 668
Svendsen H 1995 Physical oceanography of coupled fjord-coast systems in northern 669
Norway with special focus on frontal dynamics and tides In Ecology of fjords 670
and coastal waters Edited by HR Skjoldal C Hopkins KJ Erikstad and 671
HP Leinaas Elsevier Science Publ B V Amsterdam pp 149-164 672
Thorstad EB Heggberget TG and Oslashkland F 1998 Migratory behaviour of adult 673
wild and escaped farmed Atlantic salmon Salmo salar L before during and 674
after spawning in a Norwegian river Aquacult Res 29 419-428 675
Thorstad EB Whoriskey F Uglem I Moore A Rikardsen AH and Finstad B 676
2012 A critical life stage of the Atlantic salmon Salmo salar behaviour and 677
survival during the smolt and initial post-smolt migration J Fish Biol 81 678
500-542 679
Thorstad EB Whoriskey FG Rikardsen AH and Aarestrup K 2010 Aquatic 680
nomads the life and migrations of the Atlantic salmon In Atlantic Salmon 681
Ecology Edited by Oslash Aas S Einum A Klemetsen and J Skurdal Wiley-682
Blackwell New York pp 1-32 683
Thorstad EB Oslashkland F Aarestrup K and Heggberget TG 2008 Factors 684
affecting the within-river spawning migration of Atlantic salmon with 685
emphasis on human impacts Rev Fish Biol Fish 18 345-371 686
Thorstad EB Oslashkland F and Finstad B 2000 Effects of telemetry transmitters on 687
swimming performance of adult Atlantic salmon J Fish Biol 57 531-535 688
Treacutepanier S Rodriacuteguez MA and Magnan P 1996 Spawning migrations in 689
landlocked Atlantic salmon time series modelling of river discharge and water 690
temperature effects J Fish Biol 48 925-936 691
30
Ugedal O Naeligsje TF Thorstad EB Forseth T Saksgaringrd L and Heggberget 692
TG 2008 Twenty years of hydropower regulation in the River Alta long 693
term changes in abundance of juvenile and adult Atlantic salmon 694
Hydrobiologia 609 9-23 695
Welch DW Melnychuk MC Payne JC Rechisky EL Porter AD Jackson 696
GD Ward BR Vincent SP Wood CC and Semmens J 2011 In situ 697
Measurement of Coastal Ocean Movements and Survival of Juvenile Pacific 698
Salmon Proc Natl Acad Sci USA 108 8708-8713 699
Westerberg H 1982 Ultrasonic tracking of Atlantic salmon (Salmo salar L) ndash II 700
Swimming depth and temperature stratification Rep Inst Fresh Res 701
Drottningholm 60 102-120 702
1
TABLES 1
Table 1 Mean swimming depth registered at the time Atlantic salmon (Salmo salar) passed 2
the array 2ndash5 in the Alta Fjord Mean values are based on individual means Welchrsquos t-test 3
was used to test for significant difference between male and female swimming depth 4
5
ALS
Array
n
Mean
(m)
SD individual
mean (range)
(m)
Deepest
individual
recording
(m)
Mean
depth
females
(m)
Mean
depth
males
(m)
p-value
(between
sexes)
2 23 24 37 (00ndash161) 297 26 18 057
3 24 11 15 (00ndash64) 189 09 14 036
4 18 15 19 (00ndash67) 109 14 17 075
5 21 05 07 (00ndash18) 146 04 09 018
2
Table 2 Comparisons of the number and proportions of homing Atlantic salmon (Salmo 6
salar) entering the river during 1) different stages of the tidal cycle and 2) for different 7
combinations of day and night and different stages of the tidal cycle Chi-square-tests were 8
used to test for differences between different stages of the tidal cycle and between the 9
different combinations of day and night and different stages of the tidal cycle 10
11
Number
(n =56) P-value
High tide 15 27
Ebbing tide 13 23
Low tide 9 16
Flooding tide 19 34 029
High tide day time 7 13
High tide night time 8 14
Ebbing tide day time 7 13
Ebbing tide night time 6 11
Low tide day time 5 9
Low tide night time 4 7
Flooding tide day time 11 20
Flooding tide night time 8 14 071
12
3
Table 3 Results from a redundancy analysis (RDA) exploring whether timing of river entry 13
(day-of-the-year day or night river flow tidal cycle) of Atlantic salmon (Salmo salar) 14
depended on fork length or body mass The proportion of constrained and unconstrained 15
inertia (the sum of the variance from all included parameters) from total inertia was 16
calculated which in RDA gives the proportion of variance 17
18
19
Inertia Proportion
Total 20000 10000
Constrained 02846 01423
Unconstrained 17154 08577
0
N
5
km RiverAlta
Alta Fjord
70deg30deg20deg
65deg
Norway Sweden
Finland
1
2
34
5
Z 1Z 1 Z 2Z 2
Z 3Z 3Z 4Z 47 6
10
11
12
13
14
15
16
40
50
60
70
80
90
100
110
120
130
140
57 127 197 267 28
Tem
pera
ture
(degC
)
Riv
er fl
ow (m
3 s-1
)
Date 2007
0 7 0 7 1 0 0 7 1 3 0 7 1 6 0 7 1 9 0 7 2 2 0 7 2 5 0 7 - 1 0
- 5
0
5
1 0
1 5
2 0
0 7 0 7 1 0 0 7 1 3 0 7 1 6 0 7 1 9 0 7 2 2 0 7 2 5 0 7 - 1 0
- 5
0
5
1 0
1 5
2 0
Cur
rent
vel
ocity
com
pone
nt (c
m s-1
) C
urre
nt v
eloc
ity c
ompo
nent
(cm
s-1
)
Date 2007
12
34
00 05 10 15 20
Fjord zone (year 2007)
Migratory speed (bl sminus1)
AB
C
00 05 10 15 20
Fjord zone (year 2008)
Migratory speed (bl sminus1)
1
FIGURE CAPTIONS 1
2
Figure 1 Map of the lower part of River Alta and the Alta Fjord showing the position 3
of the bag nets ( ) and the release sites ( ) ALS array 1 is indicated with () while 4
ALS arrays 2ndash5 are indicated by grey and black lines Most fish passed these ALSs in the 5
darker parts of the lines The two ALSs in the river mouth (array 6) and the three ALSs 6
(array 7) in the river are given by () The map also shows the position of the two current 7
meters in ALS array 3 ( ) the four zones (Z1ndash4) and the weather station () In the 8
following year (2008) were only array 1 3 5 and 6 present 9
10
11
Figure 2 Daily river flow (- - - - -) and water temperature (___) in the River Alta 12
13
14
Figure 3 Salinity distribution recorded at 0ndash12 m depth across ALS array 2 (a amp c) and ALS 15
array 3 (b amp d) in the Alta Fjord on 6 July (a amp b) and 13 July (c amp d) 2007 16
17
18
Figure 4 Current velocity components at 3 m depth at the north-eastern (upper panel) and 19
south-western (lower panel) side of the Alta Fjord at the ALS array 3 Positive values are 20
towards the fjord head and negative values are towards the fjord mouth indicates time of 21
individual Atlantic salmon (Salmo salar) passage 22
23
2
Figure 5 Migratory speeds of homing Atlantic salmon (Salmo salar) in the Alta Fjord in 2007 24
and 2008 In 2007 the fjord was divided into four zones (see map Fig 1) In 2008 zone A 25
was the area from ALS1ndash3 zone B from ALS3ndash5 and zone C from ALS5ndash6 The box-26
and-whisker plots give the median values (black lines) the interquartile ranges (box 50 of 27
the data falling into this) and the 5th and 95th percentiles (whiskers) 28
29
- cjfas-2012-0352-final1
-
- Homing behaviour of Atlantic salmon (Salmo salar) during final phase of marine migration and river entry
-
- Table 1-3
- Figure 1
- Figure 2
-
- Slide Number 1
-
- Figure 3
-
- Slide Number 1
-
- Figure 4
-
- Slide Number 1
-
- Figure 5
- FIGURE CAPTIONS
-
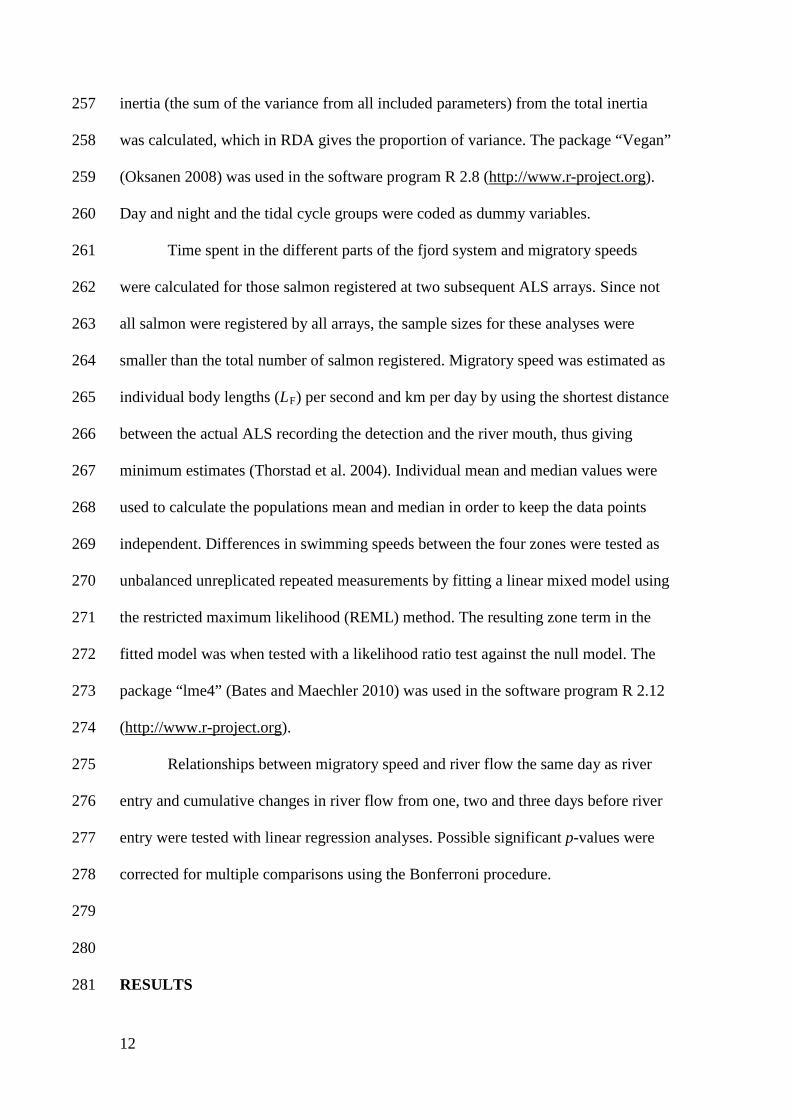
12
inertia (the sum of the variance from all included parameters) from the total inertia 257
was calculated which in RDA gives the proportion of variance The package ldquoVeganrdquo 258
(Oksanen 2008) was used in the software program R 28 (httpwwwr-projectorg) 259
Day and night and the tidal cycle groups were coded as dummy variables 260
Time spent in the different parts of the fjord system and migratory speeds 261
were calculated for those salmon registered at two subsequent ALS arrays Since not 262
all salmon were registered by all arrays the sample sizes for these analyses were 263
smaller than the total number of salmon registered Migratory speed was estimated as 264
individual body lengths (LF) per second and km per day by using the shortest distance 265
between the actual ALS recording the detection and the river mouth thus giving 266
minimum estimates (Thorstad et al 2004) Individual mean and median values were 267
used to calculate the populations mean and median in order to keep the data points 268
independent Differences in swimming speeds between the four zones were tested as 269
unbalanced unreplicated repeated measurements by fitting a linear mixed model using 270
the restricted maximum likelihood (REML) method The resulting zone term in the 271
fitted model was when tested with a likelihood ratio test against the null model The 272
package ldquolme4rdquo (Bates and Maechler 2010) was used in the software program R 212 273
(httpwwwr-projectorg) 274
Relationships between migratory speed and river flow the same day as river 275
entry and cumulative changes in river flow from one two and three days before river 276
entry were tested with linear regression analyses Possible significant p-values were 277
corrected for multiple comparisons using the Bonferroni procedure 278
279
280
RESULTS 281
13
Fifty-nine of the 74 confirmed wild salmon (80) were registered in the river 282
mouth (array 6) and 56 (76) entered the river Of those 15 fish that did not enter 283
the river mouth five were recaptured by anglers in the fjord seven left the fjord 284
(registered in array 1) and the remaining three were only registered some few times 285
at array 2 Genetic assignment tests supported the homing of the 56 salmon to their 286
natal river (JG Davidsen unpublished data) Data from these 56 salmon are used in 287
the following analyses 288
289
ENVIRONMENTAL DATA 290
The river flow in River Alta decreased during the period 5ndash26 July from 130 291
m3 s-1 to 75 m3 s-1 Thereafter it increased again (Fig 2) 292
In summer the surface layer in the Alta Fjord consists of brackish water due 293
to the large freshwater supply from the river The Alta fjord is a wide fjord where the 294
Coriolis effect on the circulation is considerable (Svendsen 1995) allowing cross-295
fjord gradients in current velocities salinity and temperature Theoretically the 296
brackish water would therefore follow the eastern side of the Alta fjord towards the 297
sea This was clearly seen in the conductivity temperature and depth (CTD) sections 298
from July 13 (Fig 3) when the lowest salinities were measured on the eastern side of 299
the fjord on array 1ndash3 (only array 2 and 3 are shown in the figure) One week 300
earlier the vertical salinity gradients were stronger in the upper 4 m while the 301
horizontal gradients were weaker This difference can be explained by the larger river 302
runoff in early July than mid-July combined with stronger winds (up to 8 m s-1) with 303
northerly components spreading the surface water across the fjord Thus in array 1 304
and 2 the brackish water (salinity less than 30) was found only along the eastern side 305
14
on the 13 July while covering the entire fjord section one week earlier At array 3 306
the brackish water covered the upper 3ndash4 m all along the array both days 307
The currents at both current meter locations were highly variable and did not 308
co-vary (Fig 4) Surface temperature varied during the study period between 11 and 309
17 ordmC 310
311
HORIZONTAL DISTRIBUTION 312
Most of the salmon (n = 70 95) were captured tagged and released on the 313
eastern side of the fjord Only four salmon (5) were captured on the western side 314
(Fig 1) When passing the array 2 where 55 of the 56 salmon were registered the 315
horizontal distribution corresponded to the distribution at release (Chi-square test P = 316
022 n = 55) Forty salmon (73) were registered on the eastern side 11 (20) in the 317
central part and four (7) on the western side 318
When passing the array 3 (Fig 1) more salmon migrated in the central and 319
south-western part of the fjord (Chi-square test P lt 0001 n = 55) Twelve salmon 320
(22) were registered on the north-eastern side 23 (42) in the central part and 20 321
(36) on the south-western side In the array 4 and 5 salmon were equally 322
distributed between the eastern (45 46 respectively) and western side (41 323
50 respectively) but only few individuals migrated in the central part (14 4 324
respectively) The horizontal distribution along the third AL array 3 in 2007 differed 325
between periods with and without wind During periods with no wind most salmon 326
passed the array on the north-eastern side while when the wind was blowing from the 327
north (321ndash50deg) most salmon were found in the central part of the array (Chi-square 328
test df = 2 P lt 001) Such difference was not observed when salmon passed array 329
2 4 or 5 330
15
There was no correlation between the passage time at array 3 and the current 331
direction (inout of the fjord) at either the north-eastern (Chi-square test df = 1 P = 332
086) or south-western current meter (Chi-square test df =1 P = 016) (Fig 4) The 333
current speeds (lt 20 cm s-1 Fig 4) were consistently well below the estimated 334
migratory speed of the salmon between the river mouth (array 6) and array 1 335
(average 63 cm s-1) 336
337
SWIMMING DEPTH 338
The mean swimming depth when crossing array 2ndash5 varied from 05ndash24 339
meter (Table 1) When approaching the estuary salmon swam closer to the surface 340
There was no difference in swimming depth between males and females Seven of the 341
lsquocontrolrsquo fish (the fish that returned to the river again in 2008) had depth sensing tags 342
Mean migration depth was 5 m (range 0ndash8 SD = 2) at array 1 4 m (range 0ndash6 SD 343
= 2) at array 3 and 5 m (range 0ndash9 SD = 3) at array 5 which was slightly deeper 344
than the newly tagged fish 345
346
TIMING OF RIVER ENTRY 347
Females entered the river on average six days before the males (Welchrsquos t-test 348
df = 42 P = 002) Timing of river entry did not depend on river flow on the day of 349
entry (r2 = 016 P = 006) or on cumulative changes from one (r2 = 0007 P = 070) 350
two (r2 = 0003 P = 081) or three days before entry (r2 = 0003 P = 080) No 351
difference in the timing of river entry was found in relation to the tides (Table 2) 352
There was also no difference in the timing of river entry (day-of-the-year day or 353
night river flow tidal cycle) in relation to fork length or body mass since only 14 354
16
of the variation (Table 3) of the constrained axes in the redundancy analysis was 355
explained by the timing of river entry between different sizes of salmon 356
There was a clear difference in the light intensities between day (50 000ndash209 424 lx) 357
and night (183ndash20 000 lx) during the study period (5ndash24 July) but no significant 358
difference was observed in the timing of river entry between day and night or in the 359
combination of tidal water and day or night (Table 2) Thirty salmon entered the river 360
during day-time and 26 during night time (Chi-square test df = 1 p-value = 062) 361
362
MIGRATORY SPEEDS 363
Mean migratory speed from release to river entry was 97 km day-1 (01 LF s-364
1) but with large individual variation (n = 54 range 07ndash331 km day-1 SD = 80) 365
The mean speed was lower (Welchrsquos t-test df = 50 P = 0003) from release to the 366
array 2 (93 km day-101 LF s-1 n = 52 range 05ndash710 km day-1 SD = 122) than 367
from array 2 to the river mouth (165 km day-102 LF s-1 n = 51 range 06ndash610 km 368
day-1 SD = 137) Median migratory speed (Fig 5) was fastest in zone 1 (06 LF s-1) 369
and decreased as the fish migrated towards the river mouth (01 LF s-1) (05 LF s-1 04 370
LF s-1and 01 LF s-1for zones 2‐4 respectively Linear mixed‐effects model n = 159 P 371
lt 0001) 372
Migratory speed from ALS array one to the river mouth did not depend on the 373
river flow on the day of river entry (r2 = 0007 P = 055) or on cumulative changes in 374
water flow from one (r2 = 0019 P = 031) two (r2 = 0028 P = 022) or three days 375
before entry (r2 = 0013 P = 041) There was also no relationship between migratory 376
speed in zone four (the last 2 km before river entry) and river flow on the day of river 377
entry (r2 = 0033 P = 029) or changes in river flow from the day before entry (r2 = 378
0037 P = 027) 379
17
For the eight returning Atlantic salmon in 2008 (lsquocontrolrsquo group tagged the 380
year before) the median migratory speed decreased as they approached the inner part 381
of the fjord similar to the newly tagged fish (Fig 5) Median migratory speed from 382
array 1 to the river mouth was 272 km day-1 (range 19ndash538 km day-1 SD = 199) 383
which was higher than when salmon were tagged and initially studied in 2007 384
However while the lsquocontrolrsquo group was registered at array 1 the registrations in 385
2007 started at array 2 Therefore a larger part of the fjord was included in 2008 386
387
388
DISCUSSION 389
These results from the relatively pristine Alta Fjord confirmed the hypothesis 390
that horizontal adult migration path was closer to the coastline as the fish approached 391
the river mouth but the distribution was influenced by brackish water distribution 392
northerly winds spread the brackish water across the fjord and the Atlantic salmon 393
seemed to follow this Further the results supported the hypothesis that the migration 394
occurred closer to the surface as the salmon approached the river mouth however the 395
findings could not confirm that river entry was facilitated by increased water 396
discharge and ebb tide and occurred mainly during the night The results confirmed 397
the hypothesis that the marine migration speed of returning Atlantic salmon declined 398
towards the river mouth however the hypothesis that marine migration speeds 399
increased with increasing river discharge was not supported A similar behaviour 400
between newly tagged fish and those tagged the year before their homing migration 401
supported the hypothesis that the migration pattern was not largely affected by short-402
term capture handling and tagging effects 403
404
18
HORIZONTAL DISTRIBUTION 405
Atlantic salmon generally followed the coastline during their homing 406
migration which may suggest that the coastline was used as a guide for orientating to 407
the river The complex interface between open ocean and up-river migration pose 408
special challenges and salmon may use elements of many orientation systems (Quinn 409
et al 1989 Pascual and Quinn 1991 Olson and Quinn 1993) It is widely accepted 410
that salmon at least partly rely on olfactory information to orientate to their home 411
river (Brannon 1981 Stabell 1982 Quinn 1990) The fact that most of the returning 412
adults were observed on the eastern side in the outer and central part of the fjord 413
where the lowest salinities were measured may suggest that the fish used this side of 414
the fjord because it provided the best conditions to locate and recognise the river At 415
array 3 in the inner part of the fjord the brackish layer covered the entire array and 416
here the returning adults utilized both sides of the fjord 417
Despite finding no correlation between the current direction measured at 3 m 418
depth and migratory pattern at array 3 there was a significant relationship between 419
wind direction and horizontal distribution of salmon when passing this array This 420
may indicate that the salmon distribution was influenced by wind induced spreading 421
of river water across the array The same pattern was observed during the outward 422
post-smolts migration studied in the same fjord in the same year (Davidsen et al 423
2009) 424
Despite the wind induced spreading of river water across the fjord mean 425
migratory speed was always higher than measured current velocities so it seems that 426
salmon had an active swimming behaviour when passing the array 3 In other 427
studies Atlantic salmon have been found to be influenced by the tidal current by 428
19
generally moving with the tide (eg Aprahamian et al 1998) but also to swim with 429
lower ground speed during ebb tide and higher during flood tides (Smith et al 1981) 430
431
SWIMMING DEPTH 432
As salmon approached the estuary they swam closer to the surface Since the 433
brackish water from the river outlet is in the upper part of the water column one 434
explanation for this behaviour may be that they use the brackish water layer to locate 435
and recognise the river (Quinn 1990) The attraction may be due to both the lower 436
salinity level and the river odour Earlier gillnet studies have shown that returning 437
Atlantic salmon usually remain near the surface (1ndash5 m depth) but occasionally make 438
downwards movements in the water column (Stasko et al 1973) Westerberg (1982) 439
and Doslashving et al (1985) reported that Atlantic salmon with acoustic tags moved up 440
and down in the water column in association with fine-scale hydrographic 441
stratification and they both concluded that salmon searched for vertical gradients of 442
odours from the home river rather than horizontal gradients Another reason to 443
migrate closer to the sea surface when approaching the river is to acclimate to the 444
fresh water Quinn (1990) suggested that by migrating in and out of the brackish 445
water layer at the top of the water column in the estuary salmonids can adjust to the 446
salinity of their environment as they make the transition from salt water to freshwater 447
448
TIMING OF RIVER ENTRY 449
Females entered the river in average six days earlier than males which is 450
consistent with findings in other studies (Dahl et al 2004 Niemelauml et al 2006) Dahl 451
et al (2004) suggested that the earlier river entry of female Atlantic salmon may be 452
due to females being older than males when performing their spawning migration 453
20
Several previous studies indicate that older (larger) fish usually arrive earlier than 454
younger (smaller) individuals (Power 1981 Jonsson et al 1990a) However in the 455
present study there were no differences in size or age between the two sexes 456
Changes in river flow did not influence the timing of river entry Increased 457
water discharge appears to be an important proximate factor stimulating adult Atlantic 458
salmon to enter small rivers from the sea (Jonsson et al 2007) However this stimuli 459
may act in combination with other environmental factors such as water temperature 460
light tides and water chemistry (Jonsson 1991 Potter et al 1992 Smith and Smith 461
1997) The fact that no correlation between river flow tidal cycle and river entry was 462
found in this study may be due to the generally large discharge of the River Alta (75ndash463
130 m3 s-1 during the study) In a large river like this it may not be critical for salmon 464
to enter the river at high river flow in order to safely migrate upstream or have the ebb 465
tide to facilitate the recognition of the outflowing fresh water from the home river 466
This is supported by the fact that day-of-the-year day or night time river flow and 467
tidal cycle at the time of river entry in total explained only 14 of the variation 468
between different sizes of the salmon This suggests that parameters other than those 469
included in the analysis may be important for timing of river entry or that timing of 470
river entry in the River Alta simply depends on the time salmon reach the estuary and 471
river mouth If the latter is the case timing of river entry may depend on factors 472
influencing the migration in the outer fjord or open sea 473
It has been suggested that the correlation between increased discharge and the 474
time of river entry in large rivers is not due to the stimulus for Atlantic salmon to 475
enter the river per se but rather that increased freshwater supply to near coastal areas 476
may aid salmon to recognise and find their natal river increasing the number of fish 477
entering fresh water compared to low flow periods (Thorstad et al 2010) In the 478
21
present study there was no correlation between time of river entry and changes in 479
river flow one two and three days before entry However since salmon were tagged 480
and monitored in the last part of the spawning run there may already have been 481
enough freshwater in the fjord system to guide the salmon The observation that river 482
entry not is correlated with river flow in large rivers is also supported by other studies 483
(Dahl et al 2004 Karppinen et al 2004) 484
Adult salmon entered the river during all phases of the tidal cycle It has been 485
suggested that Atlantic salmon entering the river during strong ebb currents may have 486
been attracted by the outward flow of fresh water (Potter et al 1992) However there 487
is little consensus among studies about the relationship between tidal phase and river 488
entry (Potter 1988 Potter et al 1992 Smith and Smith 1997 Karppinen et al 2004) 489
Given the wide variation in the physical chemical and hydrographic characteristics of 490
estuaries this variation in the migratory responses of Atlantic salmon to the tidal 491
cycle is perhaps not surprising (Smith and Smith 1997) In general different sizes 492
forms and shapes of rivers may result in different relationships between Atlantic 493
salmon behaviour and environmental factors 494
The absence of a clear diel pattern in the timing of river mouth passage 495
differed from that observed in a post-smolt study in the River Alta when more post-496
smolts passed the river mouth at night during migration towards the sea (Davidsen et 497
al 2009) Nocturnal migration is thought to be an adaptive behaviour to reduce 498
predation by visual predators like seals (Solomon 1982) and has been observed in 499
several studies of returning Atlantic salmon (eg Potter 1988 Smith and Smith 1997) 500
Even though the northern River Alta is situated on a latitude with midnight sun light 501
intensities were still lower than 20 000 lx at night in contrast to the 50 000ndash200 000 502
lx measured during day time The fact that no difference in the diel migration pattern 503
22
was observed for adult salmon may be because they do not experience the same 504
predation level as the smaller post-smolts 505
506
MIGRATORY SPEEDS 507
The migratory speed slowed as salmon approached the estuary and salmon 508
had a lower migratory speed in the innermost part of the estuary (zone four) than in 509
the open fjord (zone onendashthree) This change in travel rates may be an indication of a 510
physiological need to adapt to the fresh water in the river time to orientate towards 511
the river mouth and to recognise the home river (Hansen and Quinn 1998) or to wait 512
for optimal conditions for upstream migration (Jonsson et al 1990b) The finding of 513
decreasing travel rates when approaching the estuary confirm results from mark and 514
recapture studies (Hansen et al 1993 Hansen and Quinn 1998) 515
516
CONTROL FISH TAGGED THE PRECEDING YEAR 517
The migration behaviour of the eight returning Atlantic salmon in 2008 518
(lsquocontrolrsquo group tagged the year before) did not differ from the newly tagged fish 519
Similar to the newly tagged fish median migratory speed decreased as they 520
approached the inner part of the fjord and the fish migrated close (4ndash5 m) to the 521
surface The migration behaviour seemed therefore not affected by capture handling 522
and tagging This is in accordance with a laboratory study indicating that swimming 523
performance of Atlantic salmon was not affected by transmitters used in the present 524
study (Thorstad et al 2000) To our knowledge this study is first one using multiyear 525
tags to capture the migration behaviour of Atlantic salmon while Welch et al (2011) 526
have used this method on juvenile Pacific salmon 527
528
23
529
ACKNOWLEDGEMENTS 530
This study was financed by the Norwegian Research Council (project no 531
17601S40) the Norwegian Institute for Nature Research the Directorate for Nature 532
Management and the University of Tromsoslash The Norwegian Water Resources and 533
Energy Directorate provided data on the river flow The crew onboard the Research 534
Vessel ldquoJohan Ruudrdquo the staff at Alta Laksefiskeri Interessentselskap (ALI) the local 535
bag net fishermen Amund Suhr Anette Grimsrud Davidsen Cedar Chittenden and 536
Jenny Jensen are all thanked for their extensive help during the field work and Gunnel 537
Oslashstborg for scale analyses Helge Meissner is thanked for assistance with genotyping 538
and Svein-Erik Fevolden and Anne K Praeligbel for valuable discussions concerning the 539
genetics Timothy Sheehan and two anonymous referees are thanked for their valuable 540
comments on an earlier version of the manuscript The experimental procedures 541
concur with the national ethical requirements and were approved by the Norwegian 542
National Animal Research Authority 543
544
24
545
REFERENCES 546
547
Alabaster JS Gough PJ and Brooker WJ 1991 The environmental requirements 548
of Atlantic salmon Salmo salar L during their passage through the Thames 549
estuary 1982-89 J Fish Biol 38 741-762 550
Aprahamian MW Jones GO and Gough PJ 1998 Movement of adult Atlantic 551
salmon in the Usk estuary Wales J Fish Biol 53 221-225 552
Banks JW 1969 A review of the litterature on the upstream migration of adult 553
salmonids J Fish Biol 1 85-136 554
Bates D and Maechler M (2010) Package ldquolme4rdquo Reference manual for the 555
package Available at httpcranr-projectorgwebpackageslme4lme4pdf 556
(Assessed 22062012) 557
Brannon EL 1981 Orientation mechanisms of homing salmonids In Salmon and 558
trout migratory behaviour symposium Edited by EL Brannon and EO Salo 559
University of Washington Seattle pp 219-227 560
Cooke SJ Iverson SJ Stokesbury MJW Hinch SG Fisk AT Smith P 561
VanderZwaag D Brattey J and Whoriskey F 2011 Ocean Tracking 562
Network Canada A network approach to addressing critical issues in fisheries 563
and resource management with implications for ocean governance Fisheries 564
36 583-592 565
Dahl J Dannewitz J Karlsson L Petersson E Loumlf A and Ragnarsson B 2004 566
The timing of spawning migration implications of environmental variation 567
life history and sex Can J Zool 82 1864-1870 568
25
Davidsen JG Rikardsen AH Halttunen E Thorstad EB Oslashkland F Letcher 569
BH Skarethhamar J and Naeligsje TF 2009 Migratory behaviour and survival 570
rates of wild northern Atlantic salmon (Salmo salar) post-smolts effects of 571
environmental factors J Fish Biol 75 1700-1718 572
Doslashving KB Westergaringrd H and Johnsen PB 1985 Role of olfaction in the 573
behavioural and neuronal responses of Atlantic salmon Salmo salar to 574
hydrographic stratification Can J Fish Aquat Sci 42 1658-1667 575
Fiske P Lund RA and Hansen LP 2005 Identifying fish farm escapees In Stock 576
identification methods Edited by SX Cadrin KD Friedland and JD 577
Waldman Elsevier Academic Press Amsterdam pp 659-680 578
Halttunen E Rikardsen AH Davidsen JG Thorstad EB and Dempson JB 579
2009 Survival migration speed and swimming depth of Atlantic salmon kelts 580
during sea entry and fjord migration In Tagging and tracking of Marine 581
Animals with Electronic Devices Reviews Methods and Technologies in Fish 582
Biology and Fisheries 9 Edited by JL Nielsen H Arrizabalaga N Fragoso 583
A Hobday M Lutcavage and J Sibert Springer Dordrecht pp 35-49 584
Hansen LP Jonsson N and Jonsson B 1993 Oceanic migration in homing 585
Atlantic salmon Anim Behav 45 927-941 586
Hansen LP and Quinn TP 1998 The marine phase of the Atlantic salmon (Salmo 587
salar) life cycle with comparisons to pacific salmon Can J Fish Aquat Sci 588
55 104-118 589
Heggberget TG Oslashkland F and Ugedal O 1993 Distribution and migratory 590
behaviour of adult wild and farmed Atlantic salmon (Salmo salar) during 591
return migration Aquaculture 118 73-83 592
ICES (2011) Report of the Working Group on North Atlantic Salmon (WGNAS) 593
26
ICES 2011ACOM09 286 pp Available at 594
httpwwwicesdkreportsACOM2011WGNASwgnas_2011_finalpdf 595
(Assessed 22062012) 596
Jonsson B Jonsson N and Hansen LP 1990a Does juvenile experience affect 597
migration and spawning of adult Atlantic salmon Behav Ecol Sociobiol 26 598
225-230 599
Jonsson B Jonsson N and Hansen LP 2007 Factors affecting river entry of adult 600
Atlantic salmon in a small river J Fish Biol 71 943-956 601
Jonsson N 1991 Influence of water flow water temperature and light on fish 602
migration in rivers Nord J Freshwat Res 66 20-35 603
Jonsson N Jonsson B and Hansen LP 1990b Partial segregation in the timing of 604
migration of Atlantic salmon of different ages Anim Behav 40 313-321 605
Karppinen P Erkinaro J Niemelauml E Moen K and Oslashkland F 2004 Return 606
migration of one-sea-winter Atlantic salmon in the River Tana J Fish Biol 607
64 1179-1192 608
Lacroix GL and Voegeli FA 2000 Development of automated monitoring 609
systems for ultrasonic transmitters In Fish Telemetry Proceedings of the 3rd 610
Conference on Fish Telemetry in Europe Edited by A Moore and IC 611
Russell CEFAS Lowestoft UK pp 37-50 612
Legendre P and Legendre L 1998 Numerical ecology p 853 Elsevier Science BV 613
Amsterdam 614
Lund RA and Hansen LP 1991 Identification of wild and reared Atlantic salmon 615
Salmo salar L using scale characters Aquacult Fish Manage 22 499-508 616
Niemelauml E Orell P Erkinaro J Dempson J Broslashrs S Svenning M and 617
Hassinen E 2006 Previously spawned Atlantic salmon ascend a large 618
27
subarctic river earlier than their maiden counterparts J Fish Biol 69 1151ndash619
1163 620
Olson AF and Quinn TP 1993 Vertical and horizontal movements of adult 621
chinook salmon Oncorhynchus tshawytscha in the Columbia River estuary 622
Fishery Bulletin of the Fish and Wildlife Service 91 171-178 623
Parrish DL Behnke RJ Gephard SR McCormick SD and Reeves GH 1998 624
Why arenrsquot there more Atlantic salmon (Salmo salar) Can J Fish Aquat 625
Sci 55 281-287 626
Pascual MA and Quinn TP 1991 Evaluation of alternative models of the coastal 627
migration of adult Fraser River sockeye salmon (Oncorhynchus nerka) Can J 628
Fish Aquat Sci 48 799-810 629
Pierce GJ Boyle PR and Thompson PM 1990 Diet selection by seals In 630
Trophic Relationships in the Marine Environment Edited by M Barnes and 631
RN Gibson Aberdeen University Press Aberdeen pp 222-238 632
Potter ECE 1988 Movements of Atlantic salmon Salmo salar L in an estuary in 633
south-west England J Fish Biol 33 153-159 634
Potter ECE Solomon DJ and Buckley AA 1992 Estuarine movements of adult 635
Atlantic salmon (Salmo salar L) in Christchurch Harbour southern England 636
In Wildlife telemetry remote monitoring and tracking of animals Edited by 637
IG Priede and SM Swift Ellis Horwood Limited Chichester England pp 638
400-409 639
Power G 1981 Stock Characteristics and Catches of Atlantic Salmon (Salmo salar) 640
in Quebec and Newfoundland and Labrador in Relation to Environmental 641
Variables Can J Fish Aquat Sci 38 1601-1611 642
28
Quinn TP 1990 Current controversies in the study of salmon homing Ethol Ecol 643
Evol 2(1) 49-63 644
Quinn TP Terahart BA and Groot C 1989 Migratory orientation and vertical 645
movements of homing adult sockeye salmon Oncorhynchus nerka in coastal 646
waters Anim Behav 37 587-599 647
Smith GW 1990 The relationship between river flow and net catches of salmon 648
(Salmo salar L) in and around the mouth of the Aberdeenshire Dee between 649
1973 and 1986 Fish Res 10 73-91 650
Smith GW Hawkins AD Urquhart GG and Shearer WM 1981 Orientation 651
and energetic efficiency in the offshore movements of returning Atlantic 652
salmon Salmo salar L Scott Fish Res Rep 21 1-22 653
Smith IP and Smith GW 1997 Tidal and diel timing of river entry by adult 654
Atlantic salmon returning to the Aberdeenshire Dee Scotland J Fish Biol 50 655
463-474 656
Solomon DJ 1982 Smolt migration in Atlantic salmon (Salmo salar L) and sea 657
trout (Salmo trutta L) In Salmon and trout migratory behavior symposium 658
Edited by EL Brannon and EO Salo University of Washington Seattle pp 659
196-203 660
Stabell OB 1982 Homing of Atlantic salmon in relation to olfaction and genetics In 661
Salmon and trout migratory behaviour symposium Edited by EL Brannon 662
and EO Salo University of Washington Seattle pp 238-246 663
Stasko AB Sutterlin AM Rommel SAj and Elson PF 1973 Migration-664
orientation of Atlantic salmon (Salmo salar L) In International Atlantic 665
Salmon Symposium Special Publication Series Edited by MW Smith and 666
29
WM Carter International Atlantic Salmon Foundation New York pp 119-667
137 668
Svendsen H 1995 Physical oceanography of coupled fjord-coast systems in northern 669
Norway with special focus on frontal dynamics and tides In Ecology of fjords 670
and coastal waters Edited by HR Skjoldal C Hopkins KJ Erikstad and 671
HP Leinaas Elsevier Science Publ B V Amsterdam pp 149-164 672
Thorstad EB Heggberget TG and Oslashkland F 1998 Migratory behaviour of adult 673
wild and escaped farmed Atlantic salmon Salmo salar L before during and 674
after spawning in a Norwegian river Aquacult Res 29 419-428 675
Thorstad EB Whoriskey F Uglem I Moore A Rikardsen AH and Finstad B 676
2012 A critical life stage of the Atlantic salmon Salmo salar behaviour and 677
survival during the smolt and initial post-smolt migration J Fish Biol 81 678
500-542 679
Thorstad EB Whoriskey FG Rikardsen AH and Aarestrup K 2010 Aquatic 680
nomads the life and migrations of the Atlantic salmon In Atlantic Salmon 681
Ecology Edited by Oslash Aas S Einum A Klemetsen and J Skurdal Wiley-682
Blackwell New York pp 1-32 683
Thorstad EB Oslashkland F Aarestrup K and Heggberget TG 2008 Factors 684
affecting the within-river spawning migration of Atlantic salmon with 685
emphasis on human impacts Rev Fish Biol Fish 18 345-371 686
Thorstad EB Oslashkland F and Finstad B 2000 Effects of telemetry transmitters on 687
swimming performance of adult Atlantic salmon J Fish Biol 57 531-535 688
Treacutepanier S Rodriacuteguez MA and Magnan P 1996 Spawning migrations in 689
landlocked Atlantic salmon time series modelling of river discharge and water 690
temperature effects J Fish Biol 48 925-936 691
30
Ugedal O Naeligsje TF Thorstad EB Forseth T Saksgaringrd L and Heggberget 692
TG 2008 Twenty years of hydropower regulation in the River Alta long 693
term changes in abundance of juvenile and adult Atlantic salmon 694
Hydrobiologia 609 9-23 695
Welch DW Melnychuk MC Payne JC Rechisky EL Porter AD Jackson 696
GD Ward BR Vincent SP Wood CC and Semmens J 2011 In situ 697
Measurement of Coastal Ocean Movements and Survival of Juvenile Pacific 698
Salmon Proc Natl Acad Sci USA 108 8708-8713 699
Westerberg H 1982 Ultrasonic tracking of Atlantic salmon (Salmo salar L) ndash II 700
Swimming depth and temperature stratification Rep Inst Fresh Res 701
Drottningholm 60 102-120 702
1
TABLES 1
Table 1 Mean swimming depth registered at the time Atlantic salmon (Salmo salar) passed 2
the array 2ndash5 in the Alta Fjord Mean values are based on individual means Welchrsquos t-test 3
was used to test for significant difference between male and female swimming depth 4
5
ALS
Array
n
Mean
(m)
SD individual
mean (range)
(m)
Deepest
individual
recording
(m)
Mean
depth
females
(m)
Mean
depth
males
(m)
p-value
(between
sexes)
2 23 24 37 (00ndash161) 297 26 18 057
3 24 11 15 (00ndash64) 189 09 14 036
4 18 15 19 (00ndash67) 109 14 17 075
5 21 05 07 (00ndash18) 146 04 09 018
2
Table 2 Comparisons of the number and proportions of homing Atlantic salmon (Salmo 6
salar) entering the river during 1) different stages of the tidal cycle and 2) for different 7
combinations of day and night and different stages of the tidal cycle Chi-square-tests were 8
used to test for differences between different stages of the tidal cycle and between the 9
different combinations of day and night and different stages of the tidal cycle 10
11
Number
(n =56) P-value
High tide 15 27
Ebbing tide 13 23
Low tide 9 16
Flooding tide 19 34 029
High tide day time 7 13
High tide night time 8 14
Ebbing tide day time 7 13
Ebbing tide night time 6 11
Low tide day time 5 9
Low tide night time 4 7
Flooding tide day time 11 20
Flooding tide night time 8 14 071
12
3
Table 3 Results from a redundancy analysis (RDA) exploring whether timing of river entry 13
(day-of-the-year day or night river flow tidal cycle) of Atlantic salmon (Salmo salar) 14
depended on fork length or body mass The proportion of constrained and unconstrained 15
inertia (the sum of the variance from all included parameters) from total inertia was 16
calculated which in RDA gives the proportion of variance 17
18
19
Inertia Proportion
Total 20000 10000
Constrained 02846 01423
Unconstrained 17154 08577
0
N
5
km RiverAlta
Alta Fjord
70deg30deg20deg
65deg
Norway Sweden
Finland
1
2
34
5
Z 1Z 1 Z 2Z 2
Z 3Z 3Z 4Z 47 6
10
11
12
13
14
15
16
40
50
60
70
80
90
100
110
120
130
140
57 127 197 267 28
Tem
pera
ture
(degC
)
Riv
er fl
ow (m
3 s-1
)
Date 2007
0 7 0 7 1 0 0 7 1 3 0 7 1 6 0 7 1 9 0 7 2 2 0 7 2 5 0 7 - 1 0
- 5
0
5
1 0
1 5
2 0
0 7 0 7 1 0 0 7 1 3 0 7 1 6 0 7 1 9 0 7 2 2 0 7 2 5 0 7 - 1 0
- 5
0
5
1 0
1 5
2 0
Cur
rent
vel
ocity
com
pone
nt (c
m s-1
) C
urre
nt v
eloc
ity c
ompo
nent
(cm
s-1
)
Date 2007
12
34
00 05 10 15 20
Fjord zone (year 2007)
Migratory speed (bl sminus1)
AB
C
00 05 10 15 20
Fjord zone (year 2008)
Migratory speed (bl sminus1)
1
FIGURE CAPTIONS 1
2
Figure 1 Map of the lower part of River Alta and the Alta Fjord showing the position 3
of the bag nets ( ) and the release sites ( ) ALS array 1 is indicated with () while 4
ALS arrays 2ndash5 are indicated by grey and black lines Most fish passed these ALSs in the 5
darker parts of the lines The two ALSs in the river mouth (array 6) and the three ALSs 6
(array 7) in the river are given by () The map also shows the position of the two current 7
meters in ALS array 3 ( ) the four zones (Z1ndash4) and the weather station () In the 8
following year (2008) were only array 1 3 5 and 6 present 9
10
11
Figure 2 Daily river flow (- - - - -) and water temperature (___) in the River Alta 12
13
14
Figure 3 Salinity distribution recorded at 0ndash12 m depth across ALS array 2 (a amp c) and ALS 15
array 3 (b amp d) in the Alta Fjord on 6 July (a amp b) and 13 July (c amp d) 2007 16
17
18
Figure 4 Current velocity components at 3 m depth at the north-eastern (upper panel) and 19
south-western (lower panel) side of the Alta Fjord at the ALS array 3 Positive values are 20
towards the fjord head and negative values are towards the fjord mouth indicates time of 21
individual Atlantic salmon (Salmo salar) passage 22
23
2
Figure 5 Migratory speeds of homing Atlantic salmon (Salmo salar) in the Alta Fjord in 2007 24
and 2008 In 2007 the fjord was divided into four zones (see map Fig 1) In 2008 zone A 25
was the area from ALS1ndash3 zone B from ALS3ndash5 and zone C from ALS5ndash6 The box-26
and-whisker plots give the median values (black lines) the interquartile ranges (box 50 of 27
the data falling into this) and the 5th and 95th percentiles (whiskers) 28
29
- cjfas-2012-0352-final1
-
- Homing behaviour of Atlantic salmon (Salmo salar) during final phase of marine migration and river entry
-
- Table 1-3
- Figure 1
- Figure 2
-
- Slide Number 1
-
- Figure 3
-
- Slide Number 1
-
- Figure 4
-
- Slide Number 1
-
- Figure 5
- FIGURE CAPTIONS
-
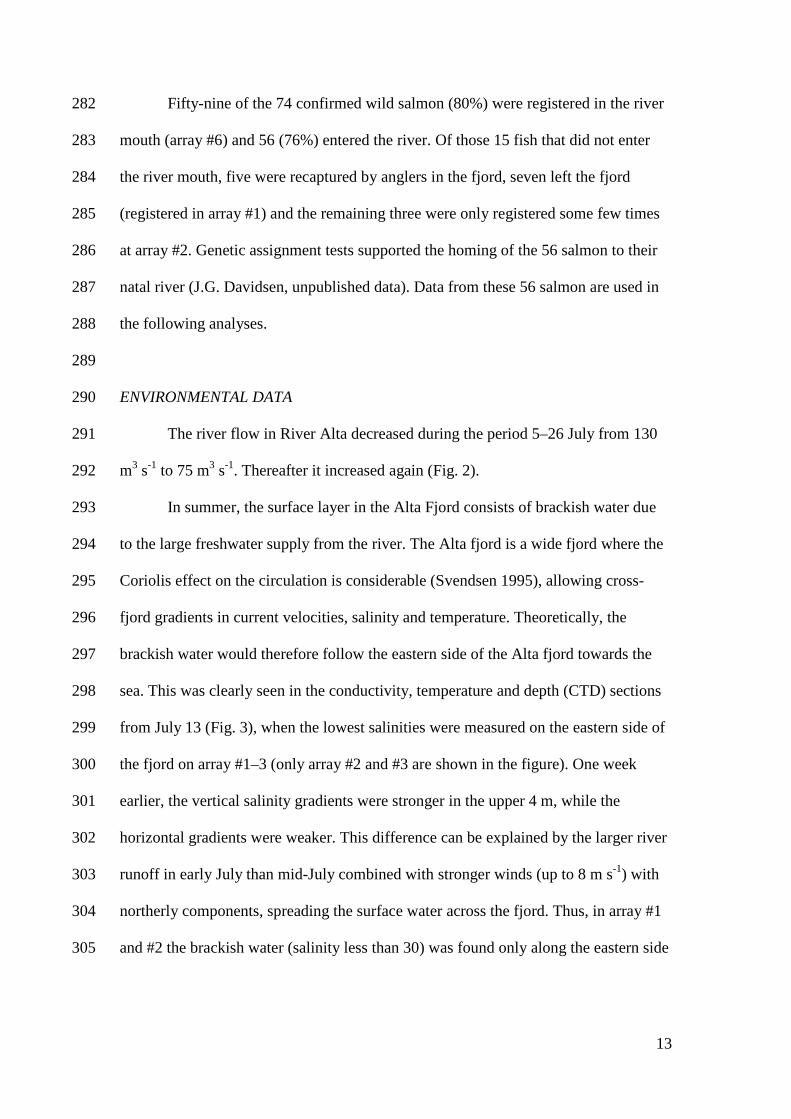
13
Fifty-nine of the 74 confirmed wild salmon (80) were registered in the river 282
mouth (array 6) and 56 (76) entered the river Of those 15 fish that did not enter 283
the river mouth five were recaptured by anglers in the fjord seven left the fjord 284
(registered in array 1) and the remaining three were only registered some few times 285
at array 2 Genetic assignment tests supported the homing of the 56 salmon to their 286
natal river (JG Davidsen unpublished data) Data from these 56 salmon are used in 287
the following analyses 288
289
ENVIRONMENTAL DATA 290
The river flow in River Alta decreased during the period 5ndash26 July from 130 291
m3 s-1 to 75 m3 s-1 Thereafter it increased again (Fig 2) 292
In summer the surface layer in the Alta Fjord consists of brackish water due 293
to the large freshwater supply from the river The Alta fjord is a wide fjord where the 294
Coriolis effect on the circulation is considerable (Svendsen 1995) allowing cross-295
fjord gradients in current velocities salinity and temperature Theoretically the 296
brackish water would therefore follow the eastern side of the Alta fjord towards the 297
sea This was clearly seen in the conductivity temperature and depth (CTD) sections 298
from July 13 (Fig 3) when the lowest salinities were measured on the eastern side of 299
the fjord on array 1ndash3 (only array 2 and 3 are shown in the figure) One week 300
earlier the vertical salinity gradients were stronger in the upper 4 m while the 301
horizontal gradients were weaker This difference can be explained by the larger river 302
runoff in early July than mid-July combined with stronger winds (up to 8 m s-1) with 303
northerly components spreading the surface water across the fjord Thus in array 1 304
and 2 the brackish water (salinity less than 30) was found only along the eastern side 305
14
on the 13 July while covering the entire fjord section one week earlier At array 3 306
the brackish water covered the upper 3ndash4 m all along the array both days 307
The currents at both current meter locations were highly variable and did not 308
co-vary (Fig 4) Surface temperature varied during the study period between 11 and 309
17 ordmC 310
311
HORIZONTAL DISTRIBUTION 312
Most of the salmon (n = 70 95) were captured tagged and released on the 313
eastern side of the fjord Only four salmon (5) were captured on the western side 314
(Fig 1) When passing the array 2 where 55 of the 56 salmon were registered the 315
horizontal distribution corresponded to the distribution at release (Chi-square test P = 316
022 n = 55) Forty salmon (73) were registered on the eastern side 11 (20) in the 317
central part and four (7) on the western side 318
When passing the array 3 (Fig 1) more salmon migrated in the central and 319
south-western part of the fjord (Chi-square test P lt 0001 n = 55) Twelve salmon 320
(22) were registered on the north-eastern side 23 (42) in the central part and 20 321
(36) on the south-western side In the array 4 and 5 salmon were equally 322
distributed between the eastern (45 46 respectively) and western side (41 323
50 respectively) but only few individuals migrated in the central part (14 4 324
respectively) The horizontal distribution along the third AL array 3 in 2007 differed 325
between periods with and without wind During periods with no wind most salmon 326
passed the array on the north-eastern side while when the wind was blowing from the 327
north (321ndash50deg) most salmon were found in the central part of the array (Chi-square 328
test df = 2 P lt 001) Such difference was not observed when salmon passed array 329
2 4 or 5 330
15
There was no correlation between the passage time at array 3 and the current 331
direction (inout of the fjord) at either the north-eastern (Chi-square test df = 1 P = 332
086) or south-western current meter (Chi-square test df =1 P = 016) (Fig 4) The 333
current speeds (lt 20 cm s-1 Fig 4) were consistently well below the estimated 334
migratory speed of the salmon between the river mouth (array 6) and array 1 335
(average 63 cm s-1) 336
337
SWIMMING DEPTH 338
The mean swimming depth when crossing array 2ndash5 varied from 05ndash24 339
meter (Table 1) When approaching the estuary salmon swam closer to the surface 340
There was no difference in swimming depth between males and females Seven of the 341
lsquocontrolrsquo fish (the fish that returned to the river again in 2008) had depth sensing tags 342
Mean migration depth was 5 m (range 0ndash8 SD = 2) at array 1 4 m (range 0ndash6 SD 343
= 2) at array 3 and 5 m (range 0ndash9 SD = 3) at array 5 which was slightly deeper 344
than the newly tagged fish 345
346
TIMING OF RIVER ENTRY 347
Females entered the river on average six days before the males (Welchrsquos t-test 348
df = 42 P = 002) Timing of river entry did not depend on river flow on the day of 349
entry (r2 = 016 P = 006) or on cumulative changes from one (r2 = 0007 P = 070) 350
two (r2 = 0003 P = 081) or three days before entry (r2 = 0003 P = 080) No 351
difference in the timing of river entry was found in relation to the tides (Table 2) 352
There was also no difference in the timing of river entry (day-of-the-year day or 353
night river flow tidal cycle) in relation to fork length or body mass since only 14 354
16
of the variation (Table 3) of the constrained axes in the redundancy analysis was 355
explained by the timing of river entry between different sizes of salmon 356
There was a clear difference in the light intensities between day (50 000ndash209 424 lx) 357
and night (183ndash20 000 lx) during the study period (5ndash24 July) but no significant 358
difference was observed in the timing of river entry between day and night or in the 359
combination of tidal water and day or night (Table 2) Thirty salmon entered the river 360
during day-time and 26 during night time (Chi-square test df = 1 p-value = 062) 361
362
MIGRATORY SPEEDS 363
Mean migratory speed from release to river entry was 97 km day-1 (01 LF s-364
1) but with large individual variation (n = 54 range 07ndash331 km day-1 SD = 80) 365
The mean speed was lower (Welchrsquos t-test df = 50 P = 0003) from release to the 366
array 2 (93 km day-101 LF s-1 n = 52 range 05ndash710 km day-1 SD = 122) than 367
from array 2 to the river mouth (165 km day-102 LF s-1 n = 51 range 06ndash610 km 368
day-1 SD = 137) Median migratory speed (Fig 5) was fastest in zone 1 (06 LF s-1) 369
and decreased as the fish migrated towards the river mouth (01 LF s-1) (05 LF s-1 04 370
LF s-1and 01 LF s-1for zones 2‐4 respectively Linear mixed‐effects model n = 159 P 371
lt 0001) 372
Migratory speed from ALS array one to the river mouth did not depend on the 373
river flow on the day of river entry (r2 = 0007 P = 055) or on cumulative changes in 374
water flow from one (r2 = 0019 P = 031) two (r2 = 0028 P = 022) or three days 375
before entry (r2 = 0013 P = 041) There was also no relationship between migratory 376
speed in zone four (the last 2 km before river entry) and river flow on the day of river 377
entry (r2 = 0033 P = 029) or changes in river flow from the day before entry (r2 = 378
0037 P = 027) 379
17
For the eight returning Atlantic salmon in 2008 (lsquocontrolrsquo group tagged the 380
year before) the median migratory speed decreased as they approached the inner part 381
of the fjord similar to the newly tagged fish (Fig 5) Median migratory speed from 382
array 1 to the river mouth was 272 km day-1 (range 19ndash538 km day-1 SD = 199) 383
which was higher than when salmon were tagged and initially studied in 2007 384
However while the lsquocontrolrsquo group was registered at array 1 the registrations in 385
2007 started at array 2 Therefore a larger part of the fjord was included in 2008 386
387
388
DISCUSSION 389
These results from the relatively pristine Alta Fjord confirmed the hypothesis 390
that horizontal adult migration path was closer to the coastline as the fish approached 391
the river mouth but the distribution was influenced by brackish water distribution 392
northerly winds spread the brackish water across the fjord and the Atlantic salmon 393
seemed to follow this Further the results supported the hypothesis that the migration 394
occurred closer to the surface as the salmon approached the river mouth however the 395
findings could not confirm that river entry was facilitated by increased water 396
discharge and ebb tide and occurred mainly during the night The results confirmed 397
the hypothesis that the marine migration speed of returning Atlantic salmon declined 398
towards the river mouth however the hypothesis that marine migration speeds 399
increased with increasing river discharge was not supported A similar behaviour 400
between newly tagged fish and those tagged the year before their homing migration 401
supported the hypothesis that the migration pattern was not largely affected by short-402
term capture handling and tagging effects 403
404
18
HORIZONTAL DISTRIBUTION 405
Atlantic salmon generally followed the coastline during their homing 406
migration which may suggest that the coastline was used as a guide for orientating to 407
the river The complex interface between open ocean and up-river migration pose 408
special challenges and salmon may use elements of many orientation systems (Quinn 409
et al 1989 Pascual and Quinn 1991 Olson and Quinn 1993) It is widely accepted 410
that salmon at least partly rely on olfactory information to orientate to their home 411
river (Brannon 1981 Stabell 1982 Quinn 1990) The fact that most of the returning 412
adults were observed on the eastern side in the outer and central part of the fjord 413
where the lowest salinities were measured may suggest that the fish used this side of 414
the fjord because it provided the best conditions to locate and recognise the river At 415
array 3 in the inner part of the fjord the brackish layer covered the entire array and 416
here the returning adults utilized both sides of the fjord 417
Despite finding no correlation between the current direction measured at 3 m 418
depth and migratory pattern at array 3 there was a significant relationship between 419
wind direction and horizontal distribution of salmon when passing this array This 420
may indicate that the salmon distribution was influenced by wind induced spreading 421
of river water across the array The same pattern was observed during the outward 422
post-smolts migration studied in the same fjord in the same year (Davidsen et al 423
2009) 424
Despite the wind induced spreading of river water across the fjord mean 425
migratory speed was always higher than measured current velocities so it seems that 426
salmon had an active swimming behaviour when passing the array 3 In other 427
studies Atlantic salmon have been found to be influenced by the tidal current by 428
19
generally moving with the tide (eg Aprahamian et al 1998) but also to swim with 429
lower ground speed during ebb tide and higher during flood tides (Smith et al 1981) 430
431
SWIMMING DEPTH 432
As salmon approached the estuary they swam closer to the surface Since the 433
brackish water from the river outlet is in the upper part of the water column one 434
explanation for this behaviour may be that they use the brackish water layer to locate 435
and recognise the river (Quinn 1990) The attraction may be due to both the lower 436
salinity level and the river odour Earlier gillnet studies have shown that returning 437
Atlantic salmon usually remain near the surface (1ndash5 m depth) but occasionally make 438
downwards movements in the water column (Stasko et al 1973) Westerberg (1982) 439
and Doslashving et al (1985) reported that Atlantic salmon with acoustic tags moved up 440
and down in the water column in association with fine-scale hydrographic 441
stratification and they both concluded that salmon searched for vertical gradients of 442
odours from the home river rather than horizontal gradients Another reason to 443
migrate closer to the sea surface when approaching the river is to acclimate to the 444
fresh water Quinn (1990) suggested that by migrating in and out of the brackish 445
water layer at the top of the water column in the estuary salmonids can adjust to the 446
salinity of their environment as they make the transition from salt water to freshwater 447
448
TIMING OF RIVER ENTRY 449
Females entered the river in average six days earlier than males which is 450
consistent with findings in other studies (Dahl et al 2004 Niemelauml et al 2006) Dahl 451
et al (2004) suggested that the earlier river entry of female Atlantic salmon may be 452
due to females being older than males when performing their spawning migration 453
20
Several previous studies indicate that older (larger) fish usually arrive earlier than 454
younger (smaller) individuals (Power 1981 Jonsson et al 1990a) However in the 455
present study there were no differences in size or age between the two sexes 456
Changes in river flow did not influence the timing of river entry Increased 457
water discharge appears to be an important proximate factor stimulating adult Atlantic 458
salmon to enter small rivers from the sea (Jonsson et al 2007) However this stimuli 459
may act in combination with other environmental factors such as water temperature 460
light tides and water chemistry (Jonsson 1991 Potter et al 1992 Smith and Smith 461
1997) The fact that no correlation between river flow tidal cycle and river entry was 462
found in this study may be due to the generally large discharge of the River Alta (75ndash463
130 m3 s-1 during the study) In a large river like this it may not be critical for salmon 464
to enter the river at high river flow in order to safely migrate upstream or have the ebb 465
tide to facilitate the recognition of the outflowing fresh water from the home river 466
This is supported by the fact that day-of-the-year day or night time river flow and 467
tidal cycle at the time of river entry in total explained only 14 of the variation 468
between different sizes of the salmon This suggests that parameters other than those 469
included in the analysis may be important for timing of river entry or that timing of 470
river entry in the River Alta simply depends on the time salmon reach the estuary and 471
river mouth If the latter is the case timing of river entry may depend on factors 472
influencing the migration in the outer fjord or open sea 473
It has been suggested that the correlation between increased discharge and the 474
time of river entry in large rivers is not due to the stimulus for Atlantic salmon to 475
enter the river per se but rather that increased freshwater supply to near coastal areas 476
may aid salmon to recognise and find their natal river increasing the number of fish 477
entering fresh water compared to low flow periods (Thorstad et al 2010) In the 478
21
present study there was no correlation between time of river entry and changes in 479
river flow one two and three days before entry However since salmon were tagged 480
and monitored in the last part of the spawning run there may already have been 481
enough freshwater in the fjord system to guide the salmon The observation that river 482
entry not is correlated with river flow in large rivers is also supported by other studies 483
(Dahl et al 2004 Karppinen et al 2004) 484
Adult salmon entered the river during all phases of the tidal cycle It has been 485
suggested that Atlantic salmon entering the river during strong ebb currents may have 486
been attracted by the outward flow of fresh water (Potter et al 1992) However there 487
is little consensus among studies about the relationship between tidal phase and river 488
entry (Potter 1988 Potter et al 1992 Smith and Smith 1997 Karppinen et al 2004) 489
Given the wide variation in the physical chemical and hydrographic characteristics of 490
estuaries this variation in the migratory responses of Atlantic salmon to the tidal 491
cycle is perhaps not surprising (Smith and Smith 1997) In general different sizes 492
forms and shapes of rivers may result in different relationships between Atlantic 493
salmon behaviour and environmental factors 494
The absence of a clear diel pattern in the timing of river mouth passage 495
differed from that observed in a post-smolt study in the River Alta when more post-496
smolts passed the river mouth at night during migration towards the sea (Davidsen et 497
al 2009) Nocturnal migration is thought to be an adaptive behaviour to reduce 498
predation by visual predators like seals (Solomon 1982) and has been observed in 499
several studies of returning Atlantic salmon (eg Potter 1988 Smith and Smith 1997) 500
Even though the northern River Alta is situated on a latitude with midnight sun light 501
intensities were still lower than 20 000 lx at night in contrast to the 50 000ndash200 000 502
lx measured during day time The fact that no difference in the diel migration pattern 503
22
was observed for adult salmon may be because they do not experience the same 504
predation level as the smaller post-smolts 505
506
MIGRATORY SPEEDS 507
The migratory speed slowed as salmon approached the estuary and salmon 508
had a lower migratory speed in the innermost part of the estuary (zone four) than in 509
the open fjord (zone onendashthree) This change in travel rates may be an indication of a 510
physiological need to adapt to the fresh water in the river time to orientate towards 511
the river mouth and to recognise the home river (Hansen and Quinn 1998) or to wait 512
for optimal conditions for upstream migration (Jonsson et al 1990b) The finding of 513
decreasing travel rates when approaching the estuary confirm results from mark and 514
recapture studies (Hansen et al 1993 Hansen and Quinn 1998) 515
516
CONTROL FISH TAGGED THE PRECEDING YEAR 517
The migration behaviour of the eight returning Atlantic salmon in 2008 518
(lsquocontrolrsquo group tagged the year before) did not differ from the newly tagged fish 519
Similar to the newly tagged fish median migratory speed decreased as they 520
approached the inner part of the fjord and the fish migrated close (4ndash5 m) to the 521
surface The migration behaviour seemed therefore not affected by capture handling 522
and tagging This is in accordance with a laboratory study indicating that swimming 523
performance of Atlantic salmon was not affected by transmitters used in the present 524
study (Thorstad et al 2000) To our knowledge this study is first one using multiyear 525
tags to capture the migration behaviour of Atlantic salmon while Welch et al (2011) 526
have used this method on juvenile Pacific salmon 527
528
23
529
ACKNOWLEDGEMENTS 530
This study was financed by the Norwegian Research Council (project no 531
17601S40) the Norwegian Institute for Nature Research the Directorate for Nature 532
Management and the University of Tromsoslash The Norwegian Water Resources and 533
Energy Directorate provided data on the river flow The crew onboard the Research 534
Vessel ldquoJohan Ruudrdquo the staff at Alta Laksefiskeri Interessentselskap (ALI) the local 535
bag net fishermen Amund Suhr Anette Grimsrud Davidsen Cedar Chittenden and 536
Jenny Jensen are all thanked for their extensive help during the field work and Gunnel 537
Oslashstborg for scale analyses Helge Meissner is thanked for assistance with genotyping 538
and Svein-Erik Fevolden and Anne K Praeligbel for valuable discussions concerning the 539
genetics Timothy Sheehan and two anonymous referees are thanked for their valuable 540
comments on an earlier version of the manuscript The experimental procedures 541
concur with the national ethical requirements and were approved by the Norwegian 542
National Animal Research Authority 543
544
24
545
REFERENCES 546
547
Alabaster JS Gough PJ and Brooker WJ 1991 The environmental requirements 548
of Atlantic salmon Salmo salar L during their passage through the Thames 549
estuary 1982-89 J Fish Biol 38 741-762 550
Aprahamian MW Jones GO and Gough PJ 1998 Movement of adult Atlantic 551
salmon in the Usk estuary Wales J Fish Biol 53 221-225 552
Banks JW 1969 A review of the litterature on the upstream migration of adult 553
salmonids J Fish Biol 1 85-136 554
Bates D and Maechler M (2010) Package ldquolme4rdquo Reference manual for the 555
package Available at httpcranr-projectorgwebpackageslme4lme4pdf 556
(Assessed 22062012) 557
Brannon EL 1981 Orientation mechanisms of homing salmonids In Salmon and 558
trout migratory behaviour symposium Edited by EL Brannon and EO Salo 559
University of Washington Seattle pp 219-227 560
Cooke SJ Iverson SJ Stokesbury MJW Hinch SG Fisk AT Smith P 561
VanderZwaag D Brattey J and Whoriskey F 2011 Ocean Tracking 562
Network Canada A network approach to addressing critical issues in fisheries 563
and resource management with implications for ocean governance Fisheries 564
36 583-592 565
Dahl J Dannewitz J Karlsson L Petersson E Loumlf A and Ragnarsson B 2004 566
The timing of spawning migration implications of environmental variation 567
life history and sex Can J Zool 82 1864-1870 568
25
Davidsen JG Rikardsen AH Halttunen E Thorstad EB Oslashkland F Letcher 569
BH Skarethhamar J and Naeligsje TF 2009 Migratory behaviour and survival 570
rates of wild northern Atlantic salmon (Salmo salar) post-smolts effects of 571
environmental factors J Fish Biol 75 1700-1718 572
Doslashving KB Westergaringrd H and Johnsen PB 1985 Role of olfaction in the 573
behavioural and neuronal responses of Atlantic salmon Salmo salar to 574
hydrographic stratification Can J Fish Aquat Sci 42 1658-1667 575
Fiske P Lund RA and Hansen LP 2005 Identifying fish farm escapees In Stock 576
identification methods Edited by SX Cadrin KD Friedland and JD 577
Waldman Elsevier Academic Press Amsterdam pp 659-680 578
Halttunen E Rikardsen AH Davidsen JG Thorstad EB and Dempson JB 579
2009 Survival migration speed and swimming depth of Atlantic salmon kelts 580
during sea entry and fjord migration In Tagging and tracking of Marine 581
Animals with Electronic Devices Reviews Methods and Technologies in Fish 582
Biology and Fisheries 9 Edited by JL Nielsen H Arrizabalaga N Fragoso 583
A Hobday M Lutcavage and J Sibert Springer Dordrecht pp 35-49 584
Hansen LP Jonsson N and Jonsson B 1993 Oceanic migration in homing 585
Atlantic salmon Anim Behav 45 927-941 586
Hansen LP and Quinn TP 1998 The marine phase of the Atlantic salmon (Salmo 587
salar) life cycle with comparisons to pacific salmon Can J Fish Aquat Sci 588
55 104-118 589
Heggberget TG Oslashkland F and Ugedal O 1993 Distribution and migratory 590
behaviour of adult wild and farmed Atlantic salmon (Salmo salar) during 591
return migration Aquaculture 118 73-83 592
ICES (2011) Report of the Working Group on North Atlantic Salmon (WGNAS) 593
26
ICES 2011ACOM09 286 pp Available at 594
httpwwwicesdkreportsACOM2011WGNASwgnas_2011_finalpdf 595
(Assessed 22062012) 596
Jonsson B Jonsson N and Hansen LP 1990a Does juvenile experience affect 597
migration and spawning of adult Atlantic salmon Behav Ecol Sociobiol 26 598
225-230 599
Jonsson B Jonsson N and Hansen LP 2007 Factors affecting river entry of adult 600
Atlantic salmon in a small river J Fish Biol 71 943-956 601
Jonsson N 1991 Influence of water flow water temperature and light on fish 602
migration in rivers Nord J Freshwat Res 66 20-35 603
Jonsson N Jonsson B and Hansen LP 1990b Partial segregation in the timing of 604
migration of Atlantic salmon of different ages Anim Behav 40 313-321 605
Karppinen P Erkinaro J Niemelauml E Moen K and Oslashkland F 2004 Return 606
migration of one-sea-winter Atlantic salmon in the River Tana J Fish Biol 607
64 1179-1192 608
Lacroix GL and Voegeli FA 2000 Development of automated monitoring 609
systems for ultrasonic transmitters In Fish Telemetry Proceedings of the 3rd 610
Conference on Fish Telemetry in Europe Edited by A Moore and IC 611
Russell CEFAS Lowestoft UK pp 37-50 612
Legendre P and Legendre L 1998 Numerical ecology p 853 Elsevier Science BV 613
Amsterdam 614
Lund RA and Hansen LP 1991 Identification of wild and reared Atlantic salmon 615
Salmo salar L using scale characters Aquacult Fish Manage 22 499-508 616
Niemelauml E Orell P Erkinaro J Dempson J Broslashrs S Svenning M and 617
Hassinen E 2006 Previously spawned Atlantic salmon ascend a large 618
27
subarctic river earlier than their maiden counterparts J Fish Biol 69 1151ndash619
1163 620
Olson AF and Quinn TP 1993 Vertical and horizontal movements of adult 621
chinook salmon Oncorhynchus tshawytscha in the Columbia River estuary 622
Fishery Bulletin of the Fish and Wildlife Service 91 171-178 623
Parrish DL Behnke RJ Gephard SR McCormick SD and Reeves GH 1998 624
Why arenrsquot there more Atlantic salmon (Salmo salar) Can J Fish Aquat 625
Sci 55 281-287 626
Pascual MA and Quinn TP 1991 Evaluation of alternative models of the coastal 627
migration of adult Fraser River sockeye salmon (Oncorhynchus nerka) Can J 628
Fish Aquat Sci 48 799-810 629
Pierce GJ Boyle PR and Thompson PM 1990 Diet selection by seals In 630
Trophic Relationships in the Marine Environment Edited by M Barnes and 631
RN Gibson Aberdeen University Press Aberdeen pp 222-238 632
Potter ECE 1988 Movements of Atlantic salmon Salmo salar L in an estuary in 633
south-west England J Fish Biol 33 153-159 634
Potter ECE Solomon DJ and Buckley AA 1992 Estuarine movements of adult 635
Atlantic salmon (Salmo salar L) in Christchurch Harbour southern England 636
In Wildlife telemetry remote monitoring and tracking of animals Edited by 637
IG Priede and SM Swift Ellis Horwood Limited Chichester England pp 638
400-409 639
Power G 1981 Stock Characteristics and Catches of Atlantic Salmon (Salmo salar) 640
in Quebec and Newfoundland and Labrador in Relation to Environmental 641
Variables Can J Fish Aquat Sci 38 1601-1611 642
28
Quinn TP 1990 Current controversies in the study of salmon homing Ethol Ecol 643
Evol 2(1) 49-63 644
Quinn TP Terahart BA and Groot C 1989 Migratory orientation and vertical 645
movements of homing adult sockeye salmon Oncorhynchus nerka in coastal 646
waters Anim Behav 37 587-599 647
Smith GW 1990 The relationship between river flow and net catches of salmon 648
(Salmo salar L) in and around the mouth of the Aberdeenshire Dee between 649
1973 and 1986 Fish Res 10 73-91 650
Smith GW Hawkins AD Urquhart GG and Shearer WM 1981 Orientation 651
and energetic efficiency in the offshore movements of returning Atlantic 652
salmon Salmo salar L Scott Fish Res Rep 21 1-22 653
Smith IP and Smith GW 1997 Tidal and diel timing of river entry by adult 654
Atlantic salmon returning to the Aberdeenshire Dee Scotland J Fish Biol 50 655
463-474 656
Solomon DJ 1982 Smolt migration in Atlantic salmon (Salmo salar L) and sea 657
trout (Salmo trutta L) In Salmon and trout migratory behavior symposium 658
Edited by EL Brannon and EO Salo University of Washington Seattle pp 659
196-203 660
Stabell OB 1982 Homing of Atlantic salmon in relation to olfaction and genetics In 661
Salmon and trout migratory behaviour symposium Edited by EL Brannon 662
and EO Salo University of Washington Seattle pp 238-246 663
Stasko AB Sutterlin AM Rommel SAj and Elson PF 1973 Migration-664
orientation of Atlantic salmon (Salmo salar L) In International Atlantic 665
Salmon Symposium Special Publication Series Edited by MW Smith and 666
29
WM Carter International Atlantic Salmon Foundation New York pp 119-667
137 668
Svendsen H 1995 Physical oceanography of coupled fjord-coast systems in northern 669
Norway with special focus on frontal dynamics and tides In Ecology of fjords 670
and coastal waters Edited by HR Skjoldal C Hopkins KJ Erikstad and 671
HP Leinaas Elsevier Science Publ B V Amsterdam pp 149-164 672
Thorstad EB Heggberget TG and Oslashkland F 1998 Migratory behaviour of adult 673
wild and escaped farmed Atlantic salmon Salmo salar L before during and 674
after spawning in a Norwegian river Aquacult Res 29 419-428 675
Thorstad EB Whoriskey F Uglem I Moore A Rikardsen AH and Finstad B 676
2012 A critical life stage of the Atlantic salmon Salmo salar behaviour and 677
survival during the smolt and initial post-smolt migration J Fish Biol 81 678
500-542 679
Thorstad EB Whoriskey FG Rikardsen AH and Aarestrup K 2010 Aquatic 680
nomads the life and migrations of the Atlantic salmon In Atlantic Salmon 681
Ecology Edited by Oslash Aas S Einum A Klemetsen and J Skurdal Wiley-682
Blackwell New York pp 1-32 683
Thorstad EB Oslashkland F Aarestrup K and Heggberget TG 2008 Factors 684
affecting the within-river spawning migration of Atlantic salmon with 685
emphasis on human impacts Rev Fish Biol Fish 18 345-371 686
Thorstad EB Oslashkland F and Finstad B 2000 Effects of telemetry transmitters on 687
swimming performance of adult Atlantic salmon J Fish Biol 57 531-535 688
Treacutepanier S Rodriacuteguez MA and Magnan P 1996 Spawning migrations in 689
landlocked Atlantic salmon time series modelling of river discharge and water 690
temperature effects J Fish Biol 48 925-936 691
30
Ugedal O Naeligsje TF Thorstad EB Forseth T Saksgaringrd L and Heggberget 692
TG 2008 Twenty years of hydropower regulation in the River Alta long 693
term changes in abundance of juvenile and adult Atlantic salmon 694
Hydrobiologia 609 9-23 695
Welch DW Melnychuk MC Payne JC Rechisky EL Porter AD Jackson 696
GD Ward BR Vincent SP Wood CC and Semmens J 2011 In situ 697
Measurement of Coastal Ocean Movements and Survival of Juvenile Pacific 698
Salmon Proc Natl Acad Sci USA 108 8708-8713 699
Westerberg H 1982 Ultrasonic tracking of Atlantic salmon (Salmo salar L) ndash II 700
Swimming depth and temperature stratification Rep Inst Fresh Res 701
Drottningholm 60 102-120 702
1
TABLES 1
Table 1 Mean swimming depth registered at the time Atlantic salmon (Salmo salar) passed 2
the array 2ndash5 in the Alta Fjord Mean values are based on individual means Welchrsquos t-test 3
was used to test for significant difference between male and female swimming depth 4
5
ALS
Array
n
Mean
(m)
SD individual
mean (range)
(m)
Deepest
individual
recording
(m)
Mean
depth
females
(m)
Mean
depth
males
(m)
p-value
(between
sexes)
2 23 24 37 (00ndash161) 297 26 18 057
3 24 11 15 (00ndash64) 189 09 14 036
4 18 15 19 (00ndash67) 109 14 17 075
5 21 05 07 (00ndash18) 146 04 09 018
2
Table 2 Comparisons of the number and proportions of homing Atlantic salmon (Salmo 6
salar) entering the river during 1) different stages of the tidal cycle and 2) for different 7
combinations of day and night and different stages of the tidal cycle Chi-square-tests were 8
used to test for differences between different stages of the tidal cycle and between the 9
different combinations of day and night and different stages of the tidal cycle 10
11
Number
(n =56) P-value
High tide 15 27
Ebbing tide 13 23
Low tide 9 16
Flooding tide 19 34 029
High tide day time 7 13
High tide night time 8 14
Ebbing tide day time 7 13
Ebbing tide night time 6 11
Low tide day time 5 9
Low tide night time 4 7
Flooding tide day time 11 20
Flooding tide night time 8 14 071
12
3
Table 3 Results from a redundancy analysis (RDA) exploring whether timing of river entry 13
(day-of-the-year day or night river flow tidal cycle) of Atlantic salmon (Salmo salar) 14
depended on fork length or body mass The proportion of constrained and unconstrained 15
inertia (the sum of the variance from all included parameters) from total inertia was 16
calculated which in RDA gives the proportion of variance 17
18
19
Inertia Proportion
Total 20000 10000
Constrained 02846 01423
Unconstrained 17154 08577
0
N
5
km RiverAlta
Alta Fjord
70deg30deg20deg
65deg
Norway Sweden
Finland
1
2
34
5
Z 1Z 1 Z 2Z 2
Z 3Z 3Z 4Z 47 6
10
11
12
13
14
15
16
40
50
60
70
80
90
100
110
120
130
140
57 127 197 267 28
Tem
pera
ture
(degC
)
Riv
er fl
ow (m
3 s-1
)
Date 2007
0 7 0 7 1 0 0 7 1 3 0 7 1 6 0 7 1 9 0 7 2 2 0 7 2 5 0 7 - 1 0
- 5
0
5
1 0
1 5
2 0
0 7 0 7 1 0 0 7 1 3 0 7 1 6 0 7 1 9 0 7 2 2 0 7 2 5 0 7 - 1 0
- 5
0
5
1 0
1 5
2 0
Cur
rent
vel
ocity
com
pone
nt (c
m s-1
) C
urre
nt v
eloc
ity c
ompo
nent
(cm
s-1
)
Date 2007
12
34
00 05 10 15 20
Fjord zone (year 2007)
Migratory speed (bl sminus1)
AB
C
00 05 10 15 20
Fjord zone (year 2008)
Migratory speed (bl sminus1)
1
FIGURE CAPTIONS 1
2
Figure 1 Map of the lower part of River Alta and the Alta Fjord showing the position 3
of the bag nets ( ) and the release sites ( ) ALS array 1 is indicated with () while 4
ALS arrays 2ndash5 are indicated by grey and black lines Most fish passed these ALSs in the 5
darker parts of the lines The two ALSs in the river mouth (array 6) and the three ALSs 6
(array 7) in the river are given by () The map also shows the position of the two current 7
meters in ALS array 3 ( ) the four zones (Z1ndash4) and the weather station () In the 8
following year (2008) were only array 1 3 5 and 6 present 9
10
11
Figure 2 Daily river flow (- - - - -) and water temperature (___) in the River Alta 12
13
14
Figure 3 Salinity distribution recorded at 0ndash12 m depth across ALS array 2 (a amp c) and ALS 15
array 3 (b amp d) in the Alta Fjord on 6 July (a amp b) and 13 July (c amp d) 2007 16
17
18
Figure 4 Current velocity components at 3 m depth at the north-eastern (upper panel) and 19
south-western (lower panel) side of the Alta Fjord at the ALS array 3 Positive values are 20
towards the fjord head and negative values are towards the fjord mouth indicates time of 21
individual Atlantic salmon (Salmo salar) passage 22
23
2
Figure 5 Migratory speeds of homing Atlantic salmon (Salmo salar) in the Alta Fjord in 2007 24
and 2008 In 2007 the fjord was divided into four zones (see map Fig 1) In 2008 zone A 25
was the area from ALS1ndash3 zone B from ALS3ndash5 and zone C from ALS5ndash6 The box-26
and-whisker plots give the median values (black lines) the interquartile ranges (box 50 of 27
the data falling into this) and the 5th and 95th percentiles (whiskers) 28
29
- cjfas-2012-0352-final1
-
- Homing behaviour of Atlantic salmon (Salmo salar) during final phase of marine migration and river entry
-
- Table 1-3
- Figure 1
- Figure 2
-
- Slide Number 1
-
- Figure 3
-
- Slide Number 1
-
- Figure 4
-
- Slide Number 1
-
- Figure 5
- FIGURE CAPTIONS
-
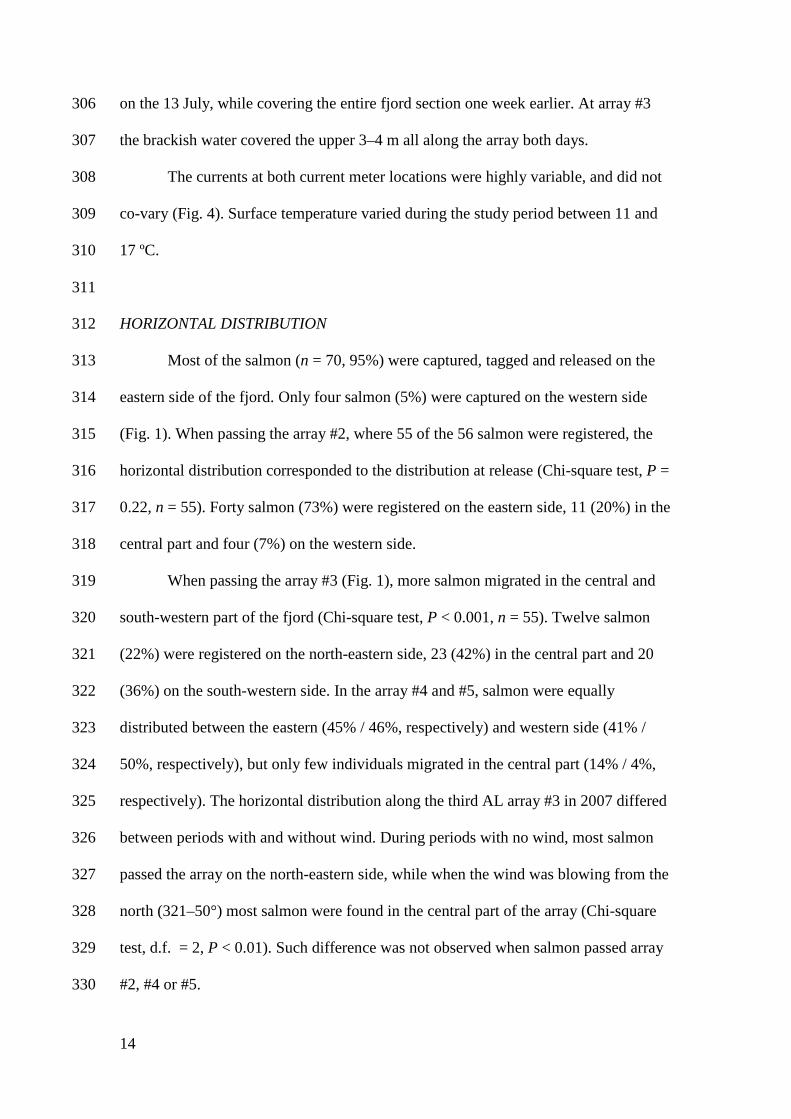
14
on the 13 July while covering the entire fjord section one week earlier At array 3 306
the brackish water covered the upper 3ndash4 m all along the array both days 307
The currents at both current meter locations were highly variable and did not 308
co-vary (Fig 4) Surface temperature varied during the study period between 11 and 309
17 ordmC 310
311
HORIZONTAL DISTRIBUTION 312
Most of the salmon (n = 70 95) were captured tagged and released on the 313
eastern side of the fjord Only four salmon (5) were captured on the western side 314
(Fig 1) When passing the array 2 where 55 of the 56 salmon were registered the 315
horizontal distribution corresponded to the distribution at release (Chi-square test P = 316
022 n = 55) Forty salmon (73) were registered on the eastern side 11 (20) in the 317
central part and four (7) on the western side 318
When passing the array 3 (Fig 1) more salmon migrated in the central and 319
south-western part of the fjord (Chi-square test P lt 0001 n = 55) Twelve salmon 320
(22) were registered on the north-eastern side 23 (42) in the central part and 20 321
(36) on the south-western side In the array 4 and 5 salmon were equally 322
distributed between the eastern (45 46 respectively) and western side (41 323
50 respectively) but only few individuals migrated in the central part (14 4 324
respectively) The horizontal distribution along the third AL array 3 in 2007 differed 325
between periods with and without wind During periods with no wind most salmon 326
passed the array on the north-eastern side while when the wind was blowing from the 327
north (321ndash50deg) most salmon were found in the central part of the array (Chi-square 328
test df = 2 P lt 001) Such difference was not observed when salmon passed array 329
2 4 or 5 330
15
There was no correlation between the passage time at array 3 and the current 331
direction (inout of the fjord) at either the north-eastern (Chi-square test df = 1 P = 332
086) or south-western current meter (Chi-square test df =1 P = 016) (Fig 4) The 333
current speeds (lt 20 cm s-1 Fig 4) were consistently well below the estimated 334
migratory speed of the salmon between the river mouth (array 6) and array 1 335
(average 63 cm s-1) 336
337
SWIMMING DEPTH 338
The mean swimming depth when crossing array 2ndash5 varied from 05ndash24 339
meter (Table 1) When approaching the estuary salmon swam closer to the surface 340
There was no difference in swimming depth between males and females Seven of the 341
lsquocontrolrsquo fish (the fish that returned to the river again in 2008) had depth sensing tags 342
Mean migration depth was 5 m (range 0ndash8 SD = 2) at array 1 4 m (range 0ndash6 SD 343
= 2) at array 3 and 5 m (range 0ndash9 SD = 3) at array 5 which was slightly deeper 344
than the newly tagged fish 345
346
TIMING OF RIVER ENTRY 347
Females entered the river on average six days before the males (Welchrsquos t-test 348
df = 42 P = 002) Timing of river entry did not depend on river flow on the day of 349
entry (r2 = 016 P = 006) or on cumulative changes from one (r2 = 0007 P = 070) 350
two (r2 = 0003 P = 081) or three days before entry (r2 = 0003 P = 080) No 351
difference in the timing of river entry was found in relation to the tides (Table 2) 352
There was also no difference in the timing of river entry (day-of-the-year day or 353
night river flow tidal cycle) in relation to fork length or body mass since only 14 354
16
of the variation (Table 3) of the constrained axes in the redundancy analysis was 355
explained by the timing of river entry between different sizes of salmon 356
There was a clear difference in the light intensities between day (50 000ndash209 424 lx) 357
and night (183ndash20 000 lx) during the study period (5ndash24 July) but no significant 358
difference was observed in the timing of river entry between day and night or in the 359
combination of tidal water and day or night (Table 2) Thirty salmon entered the river 360
during day-time and 26 during night time (Chi-square test df = 1 p-value = 062) 361
362
MIGRATORY SPEEDS 363
Mean migratory speed from release to river entry was 97 km day-1 (01 LF s-364
1) but with large individual variation (n = 54 range 07ndash331 km day-1 SD = 80) 365
The mean speed was lower (Welchrsquos t-test df = 50 P = 0003) from release to the 366
array 2 (93 km day-101 LF s-1 n = 52 range 05ndash710 km day-1 SD = 122) than 367
from array 2 to the river mouth (165 km day-102 LF s-1 n = 51 range 06ndash610 km 368
day-1 SD = 137) Median migratory speed (Fig 5) was fastest in zone 1 (06 LF s-1) 369
and decreased as the fish migrated towards the river mouth (01 LF s-1) (05 LF s-1 04 370
LF s-1and 01 LF s-1for zones 2‐4 respectively Linear mixed‐effects model n = 159 P 371
lt 0001) 372
Migratory speed from ALS array one to the river mouth did not depend on the 373
river flow on the day of river entry (r2 = 0007 P = 055) or on cumulative changes in 374
water flow from one (r2 = 0019 P = 031) two (r2 = 0028 P = 022) or three days 375
before entry (r2 = 0013 P = 041) There was also no relationship between migratory 376
speed in zone four (the last 2 km before river entry) and river flow on the day of river 377
entry (r2 = 0033 P = 029) or changes in river flow from the day before entry (r2 = 378
0037 P = 027) 379
17
For the eight returning Atlantic salmon in 2008 (lsquocontrolrsquo group tagged the 380
year before) the median migratory speed decreased as they approached the inner part 381
of the fjord similar to the newly tagged fish (Fig 5) Median migratory speed from 382
array 1 to the river mouth was 272 km day-1 (range 19ndash538 km day-1 SD = 199) 383
which was higher than when salmon were tagged and initially studied in 2007 384
However while the lsquocontrolrsquo group was registered at array 1 the registrations in 385
2007 started at array 2 Therefore a larger part of the fjord was included in 2008 386
387
388
DISCUSSION 389
These results from the relatively pristine Alta Fjord confirmed the hypothesis 390
that horizontal adult migration path was closer to the coastline as the fish approached 391
the river mouth but the distribution was influenced by brackish water distribution 392
northerly winds spread the brackish water across the fjord and the Atlantic salmon 393
seemed to follow this Further the results supported the hypothesis that the migration 394
occurred closer to the surface as the salmon approached the river mouth however the 395
findings could not confirm that river entry was facilitated by increased water 396
discharge and ebb tide and occurred mainly during the night The results confirmed 397
the hypothesis that the marine migration speed of returning Atlantic salmon declined 398
towards the river mouth however the hypothesis that marine migration speeds 399
increased with increasing river discharge was not supported A similar behaviour 400
between newly tagged fish and those tagged the year before their homing migration 401
supported the hypothesis that the migration pattern was not largely affected by short-402
term capture handling and tagging effects 403
404
18
HORIZONTAL DISTRIBUTION 405
Atlantic salmon generally followed the coastline during their homing 406
migration which may suggest that the coastline was used as a guide for orientating to 407
the river The complex interface between open ocean and up-river migration pose 408
special challenges and salmon may use elements of many orientation systems (Quinn 409
et al 1989 Pascual and Quinn 1991 Olson and Quinn 1993) It is widely accepted 410
that salmon at least partly rely on olfactory information to orientate to their home 411
river (Brannon 1981 Stabell 1982 Quinn 1990) The fact that most of the returning 412
adults were observed on the eastern side in the outer and central part of the fjord 413
where the lowest salinities were measured may suggest that the fish used this side of 414
the fjord because it provided the best conditions to locate and recognise the river At 415
array 3 in the inner part of the fjord the brackish layer covered the entire array and 416
here the returning adults utilized both sides of the fjord 417
Despite finding no correlation between the current direction measured at 3 m 418
depth and migratory pattern at array 3 there was a significant relationship between 419
wind direction and horizontal distribution of salmon when passing this array This 420
may indicate that the salmon distribution was influenced by wind induced spreading 421
of river water across the array The same pattern was observed during the outward 422
post-smolts migration studied in the same fjord in the same year (Davidsen et al 423
2009) 424
Despite the wind induced spreading of river water across the fjord mean 425
migratory speed was always higher than measured current velocities so it seems that 426
salmon had an active swimming behaviour when passing the array 3 In other 427
studies Atlantic salmon have been found to be influenced by the tidal current by 428
19
generally moving with the tide (eg Aprahamian et al 1998) but also to swim with 429
lower ground speed during ebb tide and higher during flood tides (Smith et al 1981) 430
431
SWIMMING DEPTH 432
As salmon approached the estuary they swam closer to the surface Since the 433
brackish water from the river outlet is in the upper part of the water column one 434
explanation for this behaviour may be that they use the brackish water layer to locate 435
and recognise the river (Quinn 1990) The attraction may be due to both the lower 436
salinity level and the river odour Earlier gillnet studies have shown that returning 437
Atlantic salmon usually remain near the surface (1ndash5 m depth) but occasionally make 438
downwards movements in the water column (Stasko et al 1973) Westerberg (1982) 439
and Doslashving et al (1985) reported that Atlantic salmon with acoustic tags moved up 440
and down in the water column in association with fine-scale hydrographic 441
stratification and they both concluded that salmon searched for vertical gradients of 442
odours from the home river rather than horizontal gradients Another reason to 443
migrate closer to the sea surface when approaching the river is to acclimate to the 444
fresh water Quinn (1990) suggested that by migrating in and out of the brackish 445
water layer at the top of the water column in the estuary salmonids can adjust to the 446
salinity of their environment as they make the transition from salt water to freshwater 447
448
TIMING OF RIVER ENTRY 449
Females entered the river in average six days earlier than males which is 450
consistent with findings in other studies (Dahl et al 2004 Niemelauml et al 2006) Dahl 451
et al (2004) suggested that the earlier river entry of female Atlantic salmon may be 452
due to females being older than males when performing their spawning migration 453
20
Several previous studies indicate that older (larger) fish usually arrive earlier than 454
younger (smaller) individuals (Power 1981 Jonsson et al 1990a) However in the 455
present study there were no differences in size or age between the two sexes 456
Changes in river flow did not influence the timing of river entry Increased 457
water discharge appears to be an important proximate factor stimulating adult Atlantic 458
salmon to enter small rivers from the sea (Jonsson et al 2007) However this stimuli 459
may act in combination with other environmental factors such as water temperature 460
light tides and water chemistry (Jonsson 1991 Potter et al 1992 Smith and Smith 461
1997) The fact that no correlation between river flow tidal cycle and river entry was 462
found in this study may be due to the generally large discharge of the River Alta (75ndash463
130 m3 s-1 during the study) In a large river like this it may not be critical for salmon 464
to enter the river at high river flow in order to safely migrate upstream or have the ebb 465
tide to facilitate the recognition of the outflowing fresh water from the home river 466
This is supported by the fact that day-of-the-year day or night time river flow and 467
tidal cycle at the time of river entry in total explained only 14 of the variation 468
between different sizes of the salmon This suggests that parameters other than those 469
included in the analysis may be important for timing of river entry or that timing of 470
river entry in the River Alta simply depends on the time salmon reach the estuary and 471
river mouth If the latter is the case timing of river entry may depend on factors 472
influencing the migration in the outer fjord or open sea 473
It has been suggested that the correlation between increased discharge and the 474
time of river entry in large rivers is not due to the stimulus for Atlantic salmon to 475
enter the river per se but rather that increased freshwater supply to near coastal areas 476
may aid salmon to recognise and find their natal river increasing the number of fish 477
entering fresh water compared to low flow periods (Thorstad et al 2010) In the 478
21
present study there was no correlation between time of river entry and changes in 479
river flow one two and three days before entry However since salmon were tagged 480
and monitored in the last part of the spawning run there may already have been 481
enough freshwater in the fjord system to guide the salmon The observation that river 482
entry not is correlated with river flow in large rivers is also supported by other studies 483
(Dahl et al 2004 Karppinen et al 2004) 484
Adult salmon entered the river during all phases of the tidal cycle It has been 485
suggested that Atlantic salmon entering the river during strong ebb currents may have 486
been attracted by the outward flow of fresh water (Potter et al 1992) However there 487
is little consensus among studies about the relationship between tidal phase and river 488
entry (Potter 1988 Potter et al 1992 Smith and Smith 1997 Karppinen et al 2004) 489
Given the wide variation in the physical chemical and hydrographic characteristics of 490
estuaries this variation in the migratory responses of Atlantic salmon to the tidal 491
cycle is perhaps not surprising (Smith and Smith 1997) In general different sizes 492
forms and shapes of rivers may result in different relationships between Atlantic 493
salmon behaviour and environmental factors 494
The absence of a clear diel pattern in the timing of river mouth passage 495
differed from that observed in a post-smolt study in the River Alta when more post-496
smolts passed the river mouth at night during migration towards the sea (Davidsen et 497
al 2009) Nocturnal migration is thought to be an adaptive behaviour to reduce 498
predation by visual predators like seals (Solomon 1982) and has been observed in 499
several studies of returning Atlantic salmon (eg Potter 1988 Smith and Smith 1997) 500
Even though the northern River Alta is situated on a latitude with midnight sun light 501
intensities were still lower than 20 000 lx at night in contrast to the 50 000ndash200 000 502
lx measured during day time The fact that no difference in the diel migration pattern 503
22
was observed for adult salmon may be because they do not experience the same 504
predation level as the smaller post-smolts 505
506
MIGRATORY SPEEDS 507
The migratory speed slowed as salmon approached the estuary and salmon 508
had a lower migratory speed in the innermost part of the estuary (zone four) than in 509
the open fjord (zone onendashthree) This change in travel rates may be an indication of a 510
physiological need to adapt to the fresh water in the river time to orientate towards 511
the river mouth and to recognise the home river (Hansen and Quinn 1998) or to wait 512
for optimal conditions for upstream migration (Jonsson et al 1990b) The finding of 513
decreasing travel rates when approaching the estuary confirm results from mark and 514
recapture studies (Hansen et al 1993 Hansen and Quinn 1998) 515
516
CONTROL FISH TAGGED THE PRECEDING YEAR 517
The migration behaviour of the eight returning Atlantic salmon in 2008 518
(lsquocontrolrsquo group tagged the year before) did not differ from the newly tagged fish 519
Similar to the newly tagged fish median migratory speed decreased as they 520
approached the inner part of the fjord and the fish migrated close (4ndash5 m) to the 521
surface The migration behaviour seemed therefore not affected by capture handling 522
and tagging This is in accordance with a laboratory study indicating that swimming 523
performance of Atlantic salmon was not affected by transmitters used in the present 524
study (Thorstad et al 2000) To our knowledge this study is first one using multiyear 525
tags to capture the migration behaviour of Atlantic salmon while Welch et al (2011) 526
have used this method on juvenile Pacific salmon 527
528
23
529
ACKNOWLEDGEMENTS 530
This study was financed by the Norwegian Research Council (project no 531
17601S40) the Norwegian Institute for Nature Research the Directorate for Nature 532
Management and the University of Tromsoslash The Norwegian Water Resources and 533
Energy Directorate provided data on the river flow The crew onboard the Research 534
Vessel ldquoJohan Ruudrdquo the staff at Alta Laksefiskeri Interessentselskap (ALI) the local 535
bag net fishermen Amund Suhr Anette Grimsrud Davidsen Cedar Chittenden and 536
Jenny Jensen are all thanked for their extensive help during the field work and Gunnel 537
Oslashstborg for scale analyses Helge Meissner is thanked for assistance with genotyping 538
and Svein-Erik Fevolden and Anne K Praeligbel for valuable discussions concerning the 539
genetics Timothy Sheehan and two anonymous referees are thanked for their valuable 540
comments on an earlier version of the manuscript The experimental procedures 541
concur with the national ethical requirements and were approved by the Norwegian 542
National Animal Research Authority 543
544
24
545
REFERENCES 546
547
Alabaster JS Gough PJ and Brooker WJ 1991 The environmental requirements 548
of Atlantic salmon Salmo salar L during their passage through the Thames 549
estuary 1982-89 J Fish Biol 38 741-762 550
Aprahamian MW Jones GO and Gough PJ 1998 Movement of adult Atlantic 551
salmon in the Usk estuary Wales J Fish Biol 53 221-225 552
Banks JW 1969 A review of the litterature on the upstream migration of adult 553
salmonids J Fish Biol 1 85-136 554
Bates D and Maechler M (2010) Package ldquolme4rdquo Reference manual for the 555
package Available at httpcranr-projectorgwebpackageslme4lme4pdf 556
(Assessed 22062012) 557
Brannon EL 1981 Orientation mechanisms of homing salmonids In Salmon and 558
trout migratory behaviour symposium Edited by EL Brannon and EO Salo 559
University of Washington Seattle pp 219-227 560
Cooke SJ Iverson SJ Stokesbury MJW Hinch SG Fisk AT Smith P 561
VanderZwaag D Brattey J and Whoriskey F 2011 Ocean Tracking 562
Network Canada A network approach to addressing critical issues in fisheries 563
and resource management with implications for ocean governance Fisheries 564
36 583-592 565
Dahl J Dannewitz J Karlsson L Petersson E Loumlf A and Ragnarsson B 2004 566
The timing of spawning migration implications of environmental variation 567
life history and sex Can J Zool 82 1864-1870 568
25
Davidsen JG Rikardsen AH Halttunen E Thorstad EB Oslashkland F Letcher 569
BH Skarethhamar J and Naeligsje TF 2009 Migratory behaviour and survival 570
rates of wild northern Atlantic salmon (Salmo salar) post-smolts effects of 571
environmental factors J Fish Biol 75 1700-1718 572
Doslashving KB Westergaringrd H and Johnsen PB 1985 Role of olfaction in the 573
behavioural and neuronal responses of Atlantic salmon Salmo salar to 574
hydrographic stratification Can J Fish Aquat Sci 42 1658-1667 575
Fiske P Lund RA and Hansen LP 2005 Identifying fish farm escapees In Stock 576
identification methods Edited by SX Cadrin KD Friedland and JD 577
Waldman Elsevier Academic Press Amsterdam pp 659-680 578
Halttunen E Rikardsen AH Davidsen JG Thorstad EB and Dempson JB 579
2009 Survival migration speed and swimming depth of Atlantic salmon kelts 580
during sea entry and fjord migration In Tagging and tracking of Marine 581
Animals with Electronic Devices Reviews Methods and Technologies in Fish 582
Biology and Fisheries 9 Edited by JL Nielsen H Arrizabalaga N Fragoso 583
A Hobday M Lutcavage and J Sibert Springer Dordrecht pp 35-49 584
Hansen LP Jonsson N and Jonsson B 1993 Oceanic migration in homing 585
Atlantic salmon Anim Behav 45 927-941 586
Hansen LP and Quinn TP 1998 The marine phase of the Atlantic salmon (Salmo 587
salar) life cycle with comparisons to pacific salmon Can J Fish Aquat Sci 588
55 104-118 589
Heggberget TG Oslashkland F and Ugedal O 1993 Distribution and migratory 590
behaviour of adult wild and farmed Atlantic salmon (Salmo salar) during 591
return migration Aquaculture 118 73-83 592
ICES (2011) Report of the Working Group on North Atlantic Salmon (WGNAS) 593
26
ICES 2011ACOM09 286 pp Available at 594
httpwwwicesdkreportsACOM2011WGNASwgnas_2011_finalpdf 595
(Assessed 22062012) 596
Jonsson B Jonsson N and Hansen LP 1990a Does juvenile experience affect 597
migration and spawning of adult Atlantic salmon Behav Ecol Sociobiol 26 598
225-230 599
Jonsson B Jonsson N and Hansen LP 2007 Factors affecting river entry of adult 600
Atlantic salmon in a small river J Fish Biol 71 943-956 601
Jonsson N 1991 Influence of water flow water temperature and light on fish 602
migration in rivers Nord J Freshwat Res 66 20-35 603
Jonsson N Jonsson B and Hansen LP 1990b Partial segregation in the timing of 604
migration of Atlantic salmon of different ages Anim Behav 40 313-321 605
Karppinen P Erkinaro J Niemelauml E Moen K and Oslashkland F 2004 Return 606
migration of one-sea-winter Atlantic salmon in the River Tana J Fish Biol 607
64 1179-1192 608
Lacroix GL and Voegeli FA 2000 Development of automated monitoring 609
systems for ultrasonic transmitters In Fish Telemetry Proceedings of the 3rd 610
Conference on Fish Telemetry in Europe Edited by A Moore and IC 611
Russell CEFAS Lowestoft UK pp 37-50 612
Legendre P and Legendre L 1998 Numerical ecology p 853 Elsevier Science BV 613
Amsterdam 614
Lund RA and Hansen LP 1991 Identification of wild and reared Atlantic salmon 615
Salmo salar L using scale characters Aquacult Fish Manage 22 499-508 616
Niemelauml E Orell P Erkinaro J Dempson J Broslashrs S Svenning M and 617
Hassinen E 2006 Previously spawned Atlantic salmon ascend a large 618
27
subarctic river earlier than their maiden counterparts J Fish Biol 69 1151ndash619
1163 620
Olson AF and Quinn TP 1993 Vertical and horizontal movements of adult 621
chinook salmon Oncorhynchus tshawytscha in the Columbia River estuary 622
Fishery Bulletin of the Fish and Wildlife Service 91 171-178 623
Parrish DL Behnke RJ Gephard SR McCormick SD and Reeves GH 1998 624
Why arenrsquot there more Atlantic salmon (Salmo salar) Can J Fish Aquat 625
Sci 55 281-287 626
Pascual MA and Quinn TP 1991 Evaluation of alternative models of the coastal 627
migration of adult Fraser River sockeye salmon (Oncorhynchus nerka) Can J 628
Fish Aquat Sci 48 799-810 629
Pierce GJ Boyle PR and Thompson PM 1990 Diet selection by seals In 630
Trophic Relationships in the Marine Environment Edited by M Barnes and 631
RN Gibson Aberdeen University Press Aberdeen pp 222-238 632
Potter ECE 1988 Movements of Atlantic salmon Salmo salar L in an estuary in 633
south-west England J Fish Biol 33 153-159 634
Potter ECE Solomon DJ and Buckley AA 1992 Estuarine movements of adult 635
Atlantic salmon (Salmo salar L) in Christchurch Harbour southern England 636
In Wildlife telemetry remote monitoring and tracking of animals Edited by 637
IG Priede and SM Swift Ellis Horwood Limited Chichester England pp 638
400-409 639
Power G 1981 Stock Characteristics and Catches of Atlantic Salmon (Salmo salar) 640
in Quebec and Newfoundland and Labrador in Relation to Environmental 641
Variables Can J Fish Aquat Sci 38 1601-1611 642
28
Quinn TP 1990 Current controversies in the study of salmon homing Ethol Ecol 643
Evol 2(1) 49-63 644
Quinn TP Terahart BA and Groot C 1989 Migratory orientation and vertical 645
movements of homing adult sockeye salmon Oncorhynchus nerka in coastal 646
waters Anim Behav 37 587-599 647
Smith GW 1990 The relationship between river flow and net catches of salmon 648
(Salmo salar L) in and around the mouth of the Aberdeenshire Dee between 649
1973 and 1986 Fish Res 10 73-91 650
Smith GW Hawkins AD Urquhart GG and Shearer WM 1981 Orientation 651
and energetic efficiency in the offshore movements of returning Atlantic 652
salmon Salmo salar L Scott Fish Res Rep 21 1-22 653
Smith IP and Smith GW 1997 Tidal and diel timing of river entry by adult 654
Atlantic salmon returning to the Aberdeenshire Dee Scotland J Fish Biol 50 655
463-474 656
Solomon DJ 1982 Smolt migration in Atlantic salmon (Salmo salar L) and sea 657
trout (Salmo trutta L) In Salmon and trout migratory behavior symposium 658
Edited by EL Brannon and EO Salo University of Washington Seattle pp 659
196-203 660
Stabell OB 1982 Homing of Atlantic salmon in relation to olfaction and genetics In 661
Salmon and trout migratory behaviour symposium Edited by EL Brannon 662
and EO Salo University of Washington Seattle pp 238-246 663
Stasko AB Sutterlin AM Rommel SAj and Elson PF 1973 Migration-664
orientation of Atlantic salmon (Salmo salar L) In International Atlantic 665
Salmon Symposium Special Publication Series Edited by MW Smith and 666
29
WM Carter International Atlantic Salmon Foundation New York pp 119-667
137 668
Svendsen H 1995 Physical oceanography of coupled fjord-coast systems in northern 669
Norway with special focus on frontal dynamics and tides In Ecology of fjords 670
and coastal waters Edited by HR Skjoldal C Hopkins KJ Erikstad and 671
HP Leinaas Elsevier Science Publ B V Amsterdam pp 149-164 672
Thorstad EB Heggberget TG and Oslashkland F 1998 Migratory behaviour of adult 673
wild and escaped farmed Atlantic salmon Salmo salar L before during and 674
after spawning in a Norwegian river Aquacult Res 29 419-428 675
Thorstad EB Whoriskey F Uglem I Moore A Rikardsen AH and Finstad B 676
2012 A critical life stage of the Atlantic salmon Salmo salar behaviour and 677
survival during the smolt and initial post-smolt migration J Fish Biol 81 678
500-542 679
Thorstad EB Whoriskey FG Rikardsen AH and Aarestrup K 2010 Aquatic 680
nomads the life and migrations of the Atlantic salmon In Atlantic Salmon 681
Ecology Edited by Oslash Aas S Einum A Klemetsen and J Skurdal Wiley-682
Blackwell New York pp 1-32 683
Thorstad EB Oslashkland F Aarestrup K and Heggberget TG 2008 Factors 684
affecting the within-river spawning migration of Atlantic salmon with 685
emphasis on human impacts Rev Fish Biol Fish 18 345-371 686
Thorstad EB Oslashkland F and Finstad B 2000 Effects of telemetry transmitters on 687
swimming performance of adult Atlantic salmon J Fish Biol 57 531-535 688
Treacutepanier S Rodriacuteguez MA and Magnan P 1996 Spawning migrations in 689
landlocked Atlantic salmon time series modelling of river discharge and water 690
temperature effects J Fish Biol 48 925-936 691
30
Ugedal O Naeligsje TF Thorstad EB Forseth T Saksgaringrd L and Heggberget 692
TG 2008 Twenty years of hydropower regulation in the River Alta long 693
term changes in abundance of juvenile and adult Atlantic salmon 694
Hydrobiologia 609 9-23 695
Welch DW Melnychuk MC Payne JC Rechisky EL Porter AD Jackson 696
GD Ward BR Vincent SP Wood CC and Semmens J 2011 In situ 697
Measurement of Coastal Ocean Movements and Survival of Juvenile Pacific 698
Salmon Proc Natl Acad Sci USA 108 8708-8713 699
Westerberg H 1982 Ultrasonic tracking of Atlantic salmon (Salmo salar L) ndash II 700
Swimming depth and temperature stratification Rep Inst Fresh Res 701
Drottningholm 60 102-120 702
1
TABLES 1
Table 1 Mean swimming depth registered at the time Atlantic salmon (Salmo salar) passed 2
the array 2ndash5 in the Alta Fjord Mean values are based on individual means Welchrsquos t-test 3
was used to test for significant difference between male and female swimming depth 4
5
ALS
Array
n
Mean
(m)
SD individual
mean (range)
(m)
Deepest
individual
recording
(m)
Mean
depth
females
(m)
Mean
depth
males
(m)
p-value
(between
sexes)
2 23 24 37 (00ndash161) 297 26 18 057
3 24 11 15 (00ndash64) 189 09 14 036
4 18 15 19 (00ndash67) 109 14 17 075
5 21 05 07 (00ndash18) 146 04 09 018
2
Table 2 Comparisons of the number and proportions of homing Atlantic salmon (Salmo 6
salar) entering the river during 1) different stages of the tidal cycle and 2) for different 7
combinations of day and night and different stages of the tidal cycle Chi-square-tests were 8
used to test for differences between different stages of the tidal cycle and between the 9
different combinations of day and night and different stages of the tidal cycle 10
11
Number
(n =56) P-value
High tide 15 27
Ebbing tide 13 23
Low tide 9 16
Flooding tide 19 34 029
High tide day time 7 13
High tide night time 8 14
Ebbing tide day time 7 13
Ebbing tide night time 6 11
Low tide day time 5 9
Low tide night time 4 7
Flooding tide day time 11 20
Flooding tide night time 8 14 071
12
3
Table 3 Results from a redundancy analysis (RDA) exploring whether timing of river entry 13
(day-of-the-year day or night river flow tidal cycle) of Atlantic salmon (Salmo salar) 14
depended on fork length or body mass The proportion of constrained and unconstrained 15
inertia (the sum of the variance from all included parameters) from total inertia was 16
calculated which in RDA gives the proportion of variance 17
18
19
Inertia Proportion
Total 20000 10000
Constrained 02846 01423
Unconstrained 17154 08577
0
N
5
km RiverAlta
Alta Fjord
70deg30deg20deg
65deg
Norway Sweden
Finland
1
2
34
5
Z 1Z 1 Z 2Z 2
Z 3Z 3Z 4Z 47 6
10
11
12
13
14
15
16
40
50
60
70
80
90
100
110
120
130
140
57 127 197 267 28
Tem
pera
ture
(degC
)
Riv
er fl
ow (m
3 s-1
)
Date 2007
0 7 0 7 1 0 0 7 1 3 0 7 1 6 0 7 1 9 0 7 2 2 0 7 2 5 0 7 - 1 0
- 5
0
5
1 0
1 5
2 0
0 7 0 7 1 0 0 7 1 3 0 7 1 6 0 7 1 9 0 7 2 2 0 7 2 5 0 7 - 1 0
- 5
0
5
1 0
1 5
2 0
Cur
rent
vel
ocity
com
pone
nt (c
m s-1
) C
urre
nt v
eloc
ity c
ompo
nent
(cm
s-1
)
Date 2007
12
34
00 05 10 15 20
Fjord zone (year 2007)
Migratory speed (bl sminus1)
AB
C
00 05 10 15 20
Fjord zone (year 2008)
Migratory speed (bl sminus1)
1
FIGURE CAPTIONS 1
2
Figure 1 Map of the lower part of River Alta and the Alta Fjord showing the position 3
of the bag nets ( ) and the release sites ( ) ALS array 1 is indicated with () while 4
ALS arrays 2ndash5 are indicated by grey and black lines Most fish passed these ALSs in the 5
darker parts of the lines The two ALSs in the river mouth (array 6) and the three ALSs 6
(array 7) in the river are given by () The map also shows the position of the two current 7
meters in ALS array 3 ( ) the four zones (Z1ndash4) and the weather station () In the 8
following year (2008) were only array 1 3 5 and 6 present 9
10
11
Figure 2 Daily river flow (- - - - -) and water temperature (___) in the River Alta 12
13
14
Figure 3 Salinity distribution recorded at 0ndash12 m depth across ALS array 2 (a amp c) and ALS 15
array 3 (b amp d) in the Alta Fjord on 6 July (a amp b) and 13 July (c amp d) 2007 16
17
18
Figure 4 Current velocity components at 3 m depth at the north-eastern (upper panel) and 19
south-western (lower panel) side of the Alta Fjord at the ALS array 3 Positive values are 20
towards the fjord head and negative values are towards the fjord mouth indicates time of 21
individual Atlantic salmon (Salmo salar) passage 22
23
2
Figure 5 Migratory speeds of homing Atlantic salmon (Salmo salar) in the Alta Fjord in 2007 24
and 2008 In 2007 the fjord was divided into four zones (see map Fig 1) In 2008 zone A 25
was the area from ALS1ndash3 zone B from ALS3ndash5 and zone C from ALS5ndash6 The box-26
and-whisker plots give the median values (black lines) the interquartile ranges (box 50 of 27
the data falling into this) and the 5th and 95th percentiles (whiskers) 28
29
- cjfas-2012-0352-final1
-
- Homing behaviour of Atlantic salmon (Salmo salar) during final phase of marine migration and river entry
-
- Table 1-3
- Figure 1
- Figure 2
-
- Slide Number 1
-
- Figure 3
-
- Slide Number 1
-
- Figure 4
-
- Slide Number 1
-
- Figure 5
- FIGURE CAPTIONS
-

15
There was no correlation between the passage time at array 3 and the current 331
direction (inout of the fjord) at either the north-eastern (Chi-square test df = 1 P = 332
086) or south-western current meter (Chi-square test df =1 P = 016) (Fig 4) The 333
current speeds (lt 20 cm s-1 Fig 4) were consistently well below the estimated 334
migratory speed of the salmon between the river mouth (array 6) and array 1 335
(average 63 cm s-1) 336
337
SWIMMING DEPTH 338
The mean swimming depth when crossing array 2ndash5 varied from 05ndash24 339
meter (Table 1) When approaching the estuary salmon swam closer to the surface 340
There was no difference in swimming depth between males and females Seven of the 341
lsquocontrolrsquo fish (the fish that returned to the river again in 2008) had depth sensing tags 342
Mean migration depth was 5 m (range 0ndash8 SD = 2) at array 1 4 m (range 0ndash6 SD 343
= 2) at array 3 and 5 m (range 0ndash9 SD = 3) at array 5 which was slightly deeper 344
than the newly tagged fish 345
346
TIMING OF RIVER ENTRY 347
Females entered the river on average six days before the males (Welchrsquos t-test 348
df = 42 P = 002) Timing of river entry did not depend on river flow on the day of 349
entry (r2 = 016 P = 006) or on cumulative changes from one (r2 = 0007 P = 070) 350
two (r2 = 0003 P = 081) or three days before entry (r2 = 0003 P = 080) No 351
difference in the timing of river entry was found in relation to the tides (Table 2) 352
There was also no difference in the timing of river entry (day-of-the-year day or 353
night river flow tidal cycle) in relation to fork length or body mass since only 14 354
16
of the variation (Table 3) of the constrained axes in the redundancy analysis was 355
explained by the timing of river entry between different sizes of salmon 356
There was a clear difference in the light intensities between day (50 000ndash209 424 lx) 357
and night (183ndash20 000 lx) during the study period (5ndash24 July) but no significant 358
difference was observed in the timing of river entry between day and night or in the 359
combination of tidal water and day or night (Table 2) Thirty salmon entered the river 360
during day-time and 26 during night time (Chi-square test df = 1 p-value = 062) 361
362
MIGRATORY SPEEDS 363
Mean migratory speed from release to river entry was 97 km day-1 (01 LF s-364
1) but with large individual variation (n = 54 range 07ndash331 km day-1 SD = 80) 365
The mean speed was lower (Welchrsquos t-test df = 50 P = 0003) from release to the 366
array 2 (93 km day-101 LF s-1 n = 52 range 05ndash710 km day-1 SD = 122) than 367
from array 2 to the river mouth (165 km day-102 LF s-1 n = 51 range 06ndash610 km 368
day-1 SD = 137) Median migratory speed (Fig 5) was fastest in zone 1 (06 LF s-1) 369
and decreased as the fish migrated towards the river mouth (01 LF s-1) (05 LF s-1 04 370
LF s-1and 01 LF s-1for zones 2‐4 respectively Linear mixed‐effects model n = 159 P 371
lt 0001) 372
Migratory speed from ALS array one to the river mouth did not depend on the 373
river flow on the day of river entry (r2 = 0007 P = 055) or on cumulative changes in 374
water flow from one (r2 = 0019 P = 031) two (r2 = 0028 P = 022) or three days 375
before entry (r2 = 0013 P = 041) There was also no relationship between migratory 376
speed in zone four (the last 2 km before river entry) and river flow on the day of river 377
entry (r2 = 0033 P = 029) or changes in river flow from the day before entry (r2 = 378
0037 P = 027) 379
17
For the eight returning Atlantic salmon in 2008 (lsquocontrolrsquo group tagged the 380
year before) the median migratory speed decreased as they approached the inner part 381
of the fjord similar to the newly tagged fish (Fig 5) Median migratory speed from 382
array 1 to the river mouth was 272 km day-1 (range 19ndash538 km day-1 SD = 199) 383
which was higher than when salmon were tagged and initially studied in 2007 384
However while the lsquocontrolrsquo group was registered at array 1 the registrations in 385
2007 started at array 2 Therefore a larger part of the fjord was included in 2008 386
387
388
DISCUSSION 389
These results from the relatively pristine Alta Fjord confirmed the hypothesis 390
that horizontal adult migration path was closer to the coastline as the fish approached 391
the river mouth but the distribution was influenced by brackish water distribution 392
northerly winds spread the brackish water across the fjord and the Atlantic salmon 393
seemed to follow this Further the results supported the hypothesis that the migration 394
occurred closer to the surface as the salmon approached the river mouth however the 395
findings could not confirm that river entry was facilitated by increased water 396
discharge and ebb tide and occurred mainly during the night The results confirmed 397
the hypothesis that the marine migration speed of returning Atlantic salmon declined 398
towards the river mouth however the hypothesis that marine migration speeds 399
increased with increasing river discharge was not supported A similar behaviour 400
between newly tagged fish and those tagged the year before their homing migration 401
supported the hypothesis that the migration pattern was not largely affected by short-402
term capture handling and tagging effects 403
404
18
HORIZONTAL DISTRIBUTION 405
Atlantic salmon generally followed the coastline during their homing 406
migration which may suggest that the coastline was used as a guide for orientating to 407
the river The complex interface between open ocean and up-river migration pose 408
special challenges and salmon may use elements of many orientation systems (Quinn 409
et al 1989 Pascual and Quinn 1991 Olson and Quinn 1993) It is widely accepted 410
that salmon at least partly rely on olfactory information to orientate to their home 411
river (Brannon 1981 Stabell 1982 Quinn 1990) The fact that most of the returning 412
adults were observed on the eastern side in the outer and central part of the fjord 413
where the lowest salinities were measured may suggest that the fish used this side of 414
the fjord because it provided the best conditions to locate and recognise the river At 415
array 3 in the inner part of the fjord the brackish layer covered the entire array and 416
here the returning adults utilized both sides of the fjord 417
Despite finding no correlation between the current direction measured at 3 m 418
depth and migratory pattern at array 3 there was a significant relationship between 419
wind direction and horizontal distribution of salmon when passing this array This 420
may indicate that the salmon distribution was influenced by wind induced spreading 421
of river water across the array The same pattern was observed during the outward 422
post-smolts migration studied in the same fjord in the same year (Davidsen et al 423
2009) 424
Despite the wind induced spreading of river water across the fjord mean 425
migratory speed was always higher than measured current velocities so it seems that 426
salmon had an active swimming behaviour when passing the array 3 In other 427
studies Atlantic salmon have been found to be influenced by the tidal current by 428
19
generally moving with the tide (eg Aprahamian et al 1998) but also to swim with 429
lower ground speed during ebb tide and higher during flood tides (Smith et al 1981) 430
431
SWIMMING DEPTH 432
As salmon approached the estuary they swam closer to the surface Since the 433
brackish water from the river outlet is in the upper part of the water column one 434
explanation for this behaviour may be that they use the brackish water layer to locate 435
and recognise the river (Quinn 1990) The attraction may be due to both the lower 436
salinity level and the river odour Earlier gillnet studies have shown that returning 437
Atlantic salmon usually remain near the surface (1ndash5 m depth) but occasionally make 438
downwards movements in the water column (Stasko et al 1973) Westerberg (1982) 439
and Doslashving et al (1985) reported that Atlantic salmon with acoustic tags moved up 440
and down in the water column in association with fine-scale hydrographic 441
stratification and they both concluded that salmon searched for vertical gradients of 442
odours from the home river rather than horizontal gradients Another reason to 443
migrate closer to the sea surface when approaching the river is to acclimate to the 444
fresh water Quinn (1990) suggested that by migrating in and out of the brackish 445
water layer at the top of the water column in the estuary salmonids can adjust to the 446
salinity of their environment as they make the transition from salt water to freshwater 447
448
TIMING OF RIVER ENTRY 449
Females entered the river in average six days earlier than males which is 450
consistent with findings in other studies (Dahl et al 2004 Niemelauml et al 2006) Dahl 451
et al (2004) suggested that the earlier river entry of female Atlantic salmon may be 452
due to females being older than males when performing their spawning migration 453
20
Several previous studies indicate that older (larger) fish usually arrive earlier than 454
younger (smaller) individuals (Power 1981 Jonsson et al 1990a) However in the 455
present study there were no differences in size or age between the two sexes 456
Changes in river flow did not influence the timing of river entry Increased 457
water discharge appears to be an important proximate factor stimulating adult Atlantic 458
salmon to enter small rivers from the sea (Jonsson et al 2007) However this stimuli 459
may act in combination with other environmental factors such as water temperature 460
light tides and water chemistry (Jonsson 1991 Potter et al 1992 Smith and Smith 461
1997) The fact that no correlation between river flow tidal cycle and river entry was 462
found in this study may be due to the generally large discharge of the River Alta (75ndash463
130 m3 s-1 during the study) In a large river like this it may not be critical for salmon 464
to enter the river at high river flow in order to safely migrate upstream or have the ebb 465
tide to facilitate the recognition of the outflowing fresh water from the home river 466
This is supported by the fact that day-of-the-year day or night time river flow and 467
tidal cycle at the time of river entry in total explained only 14 of the variation 468
between different sizes of the salmon This suggests that parameters other than those 469
included in the analysis may be important for timing of river entry or that timing of 470
river entry in the River Alta simply depends on the time salmon reach the estuary and 471
river mouth If the latter is the case timing of river entry may depend on factors 472
influencing the migration in the outer fjord or open sea 473
It has been suggested that the correlation between increased discharge and the 474
time of river entry in large rivers is not due to the stimulus for Atlantic salmon to 475
enter the river per se but rather that increased freshwater supply to near coastal areas 476
may aid salmon to recognise and find their natal river increasing the number of fish 477
entering fresh water compared to low flow periods (Thorstad et al 2010) In the 478
21
present study there was no correlation between time of river entry and changes in 479
river flow one two and three days before entry However since salmon were tagged 480
and monitored in the last part of the spawning run there may already have been 481
enough freshwater in the fjord system to guide the salmon The observation that river 482
entry not is correlated with river flow in large rivers is also supported by other studies 483
(Dahl et al 2004 Karppinen et al 2004) 484
Adult salmon entered the river during all phases of the tidal cycle It has been 485
suggested that Atlantic salmon entering the river during strong ebb currents may have 486
been attracted by the outward flow of fresh water (Potter et al 1992) However there 487
is little consensus among studies about the relationship between tidal phase and river 488
entry (Potter 1988 Potter et al 1992 Smith and Smith 1997 Karppinen et al 2004) 489
Given the wide variation in the physical chemical and hydrographic characteristics of 490
estuaries this variation in the migratory responses of Atlantic salmon to the tidal 491
cycle is perhaps not surprising (Smith and Smith 1997) In general different sizes 492
forms and shapes of rivers may result in different relationships between Atlantic 493
salmon behaviour and environmental factors 494
The absence of a clear diel pattern in the timing of river mouth passage 495
differed from that observed in a post-smolt study in the River Alta when more post-496
smolts passed the river mouth at night during migration towards the sea (Davidsen et 497
al 2009) Nocturnal migration is thought to be an adaptive behaviour to reduce 498
predation by visual predators like seals (Solomon 1982) and has been observed in 499
several studies of returning Atlantic salmon (eg Potter 1988 Smith and Smith 1997) 500
Even though the northern River Alta is situated on a latitude with midnight sun light 501
intensities were still lower than 20 000 lx at night in contrast to the 50 000ndash200 000 502
lx measured during day time The fact that no difference in the diel migration pattern 503
22
was observed for adult salmon may be because they do not experience the same 504
predation level as the smaller post-smolts 505
506
MIGRATORY SPEEDS 507
The migratory speed slowed as salmon approached the estuary and salmon 508
had a lower migratory speed in the innermost part of the estuary (zone four) than in 509
the open fjord (zone onendashthree) This change in travel rates may be an indication of a 510
physiological need to adapt to the fresh water in the river time to orientate towards 511
the river mouth and to recognise the home river (Hansen and Quinn 1998) or to wait 512
for optimal conditions for upstream migration (Jonsson et al 1990b) The finding of 513
decreasing travel rates when approaching the estuary confirm results from mark and 514
recapture studies (Hansen et al 1993 Hansen and Quinn 1998) 515
516
CONTROL FISH TAGGED THE PRECEDING YEAR 517
The migration behaviour of the eight returning Atlantic salmon in 2008 518
(lsquocontrolrsquo group tagged the year before) did not differ from the newly tagged fish 519
Similar to the newly tagged fish median migratory speed decreased as they 520
approached the inner part of the fjord and the fish migrated close (4ndash5 m) to the 521
surface The migration behaviour seemed therefore not affected by capture handling 522
and tagging This is in accordance with a laboratory study indicating that swimming 523
performance of Atlantic salmon was not affected by transmitters used in the present 524
study (Thorstad et al 2000) To our knowledge this study is first one using multiyear 525
tags to capture the migration behaviour of Atlantic salmon while Welch et al (2011) 526
have used this method on juvenile Pacific salmon 527
528
23
529
ACKNOWLEDGEMENTS 530
This study was financed by the Norwegian Research Council (project no 531
17601S40) the Norwegian Institute for Nature Research the Directorate for Nature 532
Management and the University of Tromsoslash The Norwegian Water Resources and 533
Energy Directorate provided data on the river flow The crew onboard the Research 534
Vessel ldquoJohan Ruudrdquo the staff at Alta Laksefiskeri Interessentselskap (ALI) the local 535
bag net fishermen Amund Suhr Anette Grimsrud Davidsen Cedar Chittenden and 536
Jenny Jensen are all thanked for their extensive help during the field work and Gunnel 537
Oslashstborg for scale analyses Helge Meissner is thanked for assistance with genotyping 538
and Svein-Erik Fevolden and Anne K Praeligbel for valuable discussions concerning the 539
genetics Timothy Sheehan and two anonymous referees are thanked for their valuable 540
comments on an earlier version of the manuscript The experimental procedures 541
concur with the national ethical requirements and were approved by the Norwegian 542
National Animal Research Authority 543
544
24
545
REFERENCES 546
547
Alabaster JS Gough PJ and Brooker WJ 1991 The environmental requirements 548
of Atlantic salmon Salmo salar L during their passage through the Thames 549
estuary 1982-89 J Fish Biol 38 741-762 550
Aprahamian MW Jones GO and Gough PJ 1998 Movement of adult Atlantic 551
salmon in the Usk estuary Wales J Fish Biol 53 221-225 552
Banks JW 1969 A review of the litterature on the upstream migration of adult 553
salmonids J Fish Biol 1 85-136 554
Bates D and Maechler M (2010) Package ldquolme4rdquo Reference manual for the 555
package Available at httpcranr-projectorgwebpackageslme4lme4pdf 556
(Assessed 22062012) 557
Brannon EL 1981 Orientation mechanisms of homing salmonids In Salmon and 558
trout migratory behaviour symposium Edited by EL Brannon and EO Salo 559
University of Washington Seattle pp 219-227 560
Cooke SJ Iverson SJ Stokesbury MJW Hinch SG Fisk AT Smith P 561
VanderZwaag D Brattey J and Whoriskey F 2011 Ocean Tracking 562
Network Canada A network approach to addressing critical issues in fisheries 563
and resource management with implications for ocean governance Fisheries 564
36 583-592 565
Dahl J Dannewitz J Karlsson L Petersson E Loumlf A and Ragnarsson B 2004 566
The timing of spawning migration implications of environmental variation 567
life history and sex Can J Zool 82 1864-1870 568
25
Davidsen JG Rikardsen AH Halttunen E Thorstad EB Oslashkland F Letcher 569
BH Skarethhamar J and Naeligsje TF 2009 Migratory behaviour and survival 570
rates of wild northern Atlantic salmon (Salmo salar) post-smolts effects of 571
environmental factors J Fish Biol 75 1700-1718 572
Doslashving KB Westergaringrd H and Johnsen PB 1985 Role of olfaction in the 573
behavioural and neuronal responses of Atlantic salmon Salmo salar to 574
hydrographic stratification Can J Fish Aquat Sci 42 1658-1667 575
Fiske P Lund RA and Hansen LP 2005 Identifying fish farm escapees In Stock 576
identification methods Edited by SX Cadrin KD Friedland and JD 577
Waldman Elsevier Academic Press Amsterdam pp 659-680 578
Halttunen E Rikardsen AH Davidsen JG Thorstad EB and Dempson JB 579
2009 Survival migration speed and swimming depth of Atlantic salmon kelts 580
during sea entry and fjord migration In Tagging and tracking of Marine 581
Animals with Electronic Devices Reviews Methods and Technologies in Fish 582
Biology and Fisheries 9 Edited by JL Nielsen H Arrizabalaga N Fragoso 583
A Hobday M Lutcavage and J Sibert Springer Dordrecht pp 35-49 584
Hansen LP Jonsson N and Jonsson B 1993 Oceanic migration in homing 585
Atlantic salmon Anim Behav 45 927-941 586
Hansen LP and Quinn TP 1998 The marine phase of the Atlantic salmon (Salmo 587
salar) life cycle with comparisons to pacific salmon Can J Fish Aquat Sci 588
55 104-118 589
Heggberget TG Oslashkland F and Ugedal O 1993 Distribution and migratory 590
behaviour of adult wild and farmed Atlantic salmon (Salmo salar) during 591
return migration Aquaculture 118 73-83 592
ICES (2011) Report of the Working Group on North Atlantic Salmon (WGNAS) 593
26
ICES 2011ACOM09 286 pp Available at 594
httpwwwicesdkreportsACOM2011WGNASwgnas_2011_finalpdf 595
(Assessed 22062012) 596
Jonsson B Jonsson N and Hansen LP 1990a Does juvenile experience affect 597
migration and spawning of adult Atlantic salmon Behav Ecol Sociobiol 26 598
225-230 599
Jonsson B Jonsson N and Hansen LP 2007 Factors affecting river entry of adult 600
Atlantic salmon in a small river J Fish Biol 71 943-956 601
Jonsson N 1991 Influence of water flow water temperature and light on fish 602
migration in rivers Nord J Freshwat Res 66 20-35 603
Jonsson N Jonsson B and Hansen LP 1990b Partial segregation in the timing of 604
migration of Atlantic salmon of different ages Anim Behav 40 313-321 605
Karppinen P Erkinaro J Niemelauml E Moen K and Oslashkland F 2004 Return 606
migration of one-sea-winter Atlantic salmon in the River Tana J Fish Biol 607
64 1179-1192 608
Lacroix GL and Voegeli FA 2000 Development of automated monitoring 609
systems for ultrasonic transmitters In Fish Telemetry Proceedings of the 3rd 610
Conference on Fish Telemetry in Europe Edited by A Moore and IC 611
Russell CEFAS Lowestoft UK pp 37-50 612
Legendre P and Legendre L 1998 Numerical ecology p 853 Elsevier Science BV 613
Amsterdam 614
Lund RA and Hansen LP 1991 Identification of wild and reared Atlantic salmon 615
Salmo salar L using scale characters Aquacult Fish Manage 22 499-508 616
Niemelauml E Orell P Erkinaro J Dempson J Broslashrs S Svenning M and 617
Hassinen E 2006 Previously spawned Atlantic salmon ascend a large 618
27
subarctic river earlier than their maiden counterparts J Fish Biol 69 1151ndash619
1163 620
Olson AF and Quinn TP 1993 Vertical and horizontal movements of adult 621
chinook salmon Oncorhynchus tshawytscha in the Columbia River estuary 622
Fishery Bulletin of the Fish and Wildlife Service 91 171-178 623
Parrish DL Behnke RJ Gephard SR McCormick SD and Reeves GH 1998 624
Why arenrsquot there more Atlantic salmon (Salmo salar) Can J Fish Aquat 625
Sci 55 281-287 626
Pascual MA and Quinn TP 1991 Evaluation of alternative models of the coastal 627
migration of adult Fraser River sockeye salmon (Oncorhynchus nerka) Can J 628
Fish Aquat Sci 48 799-810 629
Pierce GJ Boyle PR and Thompson PM 1990 Diet selection by seals In 630
Trophic Relationships in the Marine Environment Edited by M Barnes and 631
RN Gibson Aberdeen University Press Aberdeen pp 222-238 632
Potter ECE 1988 Movements of Atlantic salmon Salmo salar L in an estuary in 633
south-west England J Fish Biol 33 153-159 634
Potter ECE Solomon DJ and Buckley AA 1992 Estuarine movements of adult 635
Atlantic salmon (Salmo salar L) in Christchurch Harbour southern England 636
In Wildlife telemetry remote monitoring and tracking of animals Edited by 637
IG Priede and SM Swift Ellis Horwood Limited Chichester England pp 638
400-409 639
Power G 1981 Stock Characteristics and Catches of Atlantic Salmon (Salmo salar) 640
in Quebec and Newfoundland and Labrador in Relation to Environmental 641
Variables Can J Fish Aquat Sci 38 1601-1611 642
28
Quinn TP 1990 Current controversies in the study of salmon homing Ethol Ecol 643
Evol 2(1) 49-63 644
Quinn TP Terahart BA and Groot C 1989 Migratory orientation and vertical 645
movements of homing adult sockeye salmon Oncorhynchus nerka in coastal 646
waters Anim Behav 37 587-599 647
Smith GW 1990 The relationship between river flow and net catches of salmon 648
(Salmo salar L) in and around the mouth of the Aberdeenshire Dee between 649
1973 and 1986 Fish Res 10 73-91 650
Smith GW Hawkins AD Urquhart GG and Shearer WM 1981 Orientation 651
and energetic efficiency in the offshore movements of returning Atlantic 652
salmon Salmo salar L Scott Fish Res Rep 21 1-22 653
Smith IP and Smith GW 1997 Tidal and diel timing of river entry by adult 654
Atlantic salmon returning to the Aberdeenshire Dee Scotland J Fish Biol 50 655
463-474 656
Solomon DJ 1982 Smolt migration in Atlantic salmon (Salmo salar L) and sea 657
trout (Salmo trutta L) In Salmon and trout migratory behavior symposium 658
Edited by EL Brannon and EO Salo University of Washington Seattle pp 659
196-203 660
Stabell OB 1982 Homing of Atlantic salmon in relation to olfaction and genetics In 661
Salmon and trout migratory behaviour symposium Edited by EL Brannon 662
and EO Salo University of Washington Seattle pp 238-246 663
Stasko AB Sutterlin AM Rommel SAj and Elson PF 1973 Migration-664
orientation of Atlantic salmon (Salmo salar L) In International Atlantic 665
Salmon Symposium Special Publication Series Edited by MW Smith and 666
29
WM Carter International Atlantic Salmon Foundation New York pp 119-667
137 668
Svendsen H 1995 Physical oceanography of coupled fjord-coast systems in northern 669
Norway with special focus on frontal dynamics and tides In Ecology of fjords 670
and coastal waters Edited by HR Skjoldal C Hopkins KJ Erikstad and 671
HP Leinaas Elsevier Science Publ B V Amsterdam pp 149-164 672
Thorstad EB Heggberget TG and Oslashkland F 1998 Migratory behaviour of adult 673
wild and escaped farmed Atlantic salmon Salmo salar L before during and 674
after spawning in a Norwegian river Aquacult Res 29 419-428 675
Thorstad EB Whoriskey F Uglem I Moore A Rikardsen AH and Finstad B 676
2012 A critical life stage of the Atlantic salmon Salmo salar behaviour and 677
survival during the smolt and initial post-smolt migration J Fish Biol 81 678
500-542 679
Thorstad EB Whoriskey FG Rikardsen AH and Aarestrup K 2010 Aquatic 680
nomads the life and migrations of the Atlantic salmon In Atlantic Salmon 681
Ecology Edited by Oslash Aas S Einum A Klemetsen and J Skurdal Wiley-682
Blackwell New York pp 1-32 683
Thorstad EB Oslashkland F Aarestrup K and Heggberget TG 2008 Factors 684
affecting the within-river spawning migration of Atlantic salmon with 685
emphasis on human impacts Rev Fish Biol Fish 18 345-371 686
Thorstad EB Oslashkland F and Finstad B 2000 Effects of telemetry transmitters on 687
swimming performance of adult Atlantic salmon J Fish Biol 57 531-535 688
Treacutepanier S Rodriacuteguez MA and Magnan P 1996 Spawning migrations in 689
landlocked Atlantic salmon time series modelling of river discharge and water 690
temperature effects J Fish Biol 48 925-936 691
30
Ugedal O Naeligsje TF Thorstad EB Forseth T Saksgaringrd L and Heggberget 692
TG 2008 Twenty years of hydropower regulation in the River Alta long 693
term changes in abundance of juvenile and adult Atlantic salmon 694
Hydrobiologia 609 9-23 695
Welch DW Melnychuk MC Payne JC Rechisky EL Porter AD Jackson 696
GD Ward BR Vincent SP Wood CC and Semmens J 2011 In situ 697
Measurement of Coastal Ocean Movements and Survival of Juvenile Pacific 698
Salmon Proc Natl Acad Sci USA 108 8708-8713 699
Westerberg H 1982 Ultrasonic tracking of Atlantic salmon (Salmo salar L) ndash II 700
Swimming depth and temperature stratification Rep Inst Fresh Res 701
Drottningholm 60 102-120 702
1
TABLES 1
Table 1 Mean swimming depth registered at the time Atlantic salmon (Salmo salar) passed 2
the array 2ndash5 in the Alta Fjord Mean values are based on individual means Welchrsquos t-test 3
was used to test for significant difference between male and female swimming depth 4
5
ALS
Array
n
Mean
(m)
SD individual
mean (range)
(m)
Deepest
individual
recording
(m)
Mean
depth
females
(m)
Mean
depth
males
(m)
p-value
(between
sexes)
2 23 24 37 (00ndash161) 297 26 18 057
3 24 11 15 (00ndash64) 189 09 14 036
4 18 15 19 (00ndash67) 109 14 17 075
5 21 05 07 (00ndash18) 146 04 09 018
2
Table 2 Comparisons of the number and proportions of homing Atlantic salmon (Salmo 6
salar) entering the river during 1) different stages of the tidal cycle and 2) for different 7
combinations of day and night and different stages of the tidal cycle Chi-square-tests were 8
used to test for differences between different stages of the tidal cycle and between the 9
different combinations of day and night and different stages of the tidal cycle 10
11
Number
(n =56) P-value
High tide 15 27
Ebbing tide 13 23
Low tide 9 16
Flooding tide 19 34 029
High tide day time 7 13
High tide night time 8 14
Ebbing tide day time 7 13
Ebbing tide night time 6 11
Low tide day time 5 9
Low tide night time 4 7
Flooding tide day time 11 20
Flooding tide night time 8 14 071
12
3
Table 3 Results from a redundancy analysis (RDA) exploring whether timing of river entry 13
(day-of-the-year day or night river flow tidal cycle) of Atlantic salmon (Salmo salar) 14
depended on fork length or body mass The proportion of constrained and unconstrained 15
inertia (the sum of the variance from all included parameters) from total inertia was 16
calculated which in RDA gives the proportion of variance 17
18
19
Inertia Proportion
Total 20000 10000
Constrained 02846 01423
Unconstrained 17154 08577
0
N
5
km RiverAlta
Alta Fjord
70deg30deg20deg
65deg
Norway Sweden
Finland
1
2
34
5
Z 1Z 1 Z 2Z 2
Z 3Z 3Z 4Z 47 6
10
11
12
13
14
15
16
40
50
60
70
80
90
100
110
120
130
140
57 127 197 267 28
Tem
pera
ture
(degC
)
Riv
er fl
ow (m
3 s-1
)
Date 2007
0 7 0 7 1 0 0 7 1 3 0 7 1 6 0 7 1 9 0 7 2 2 0 7 2 5 0 7 - 1 0
- 5
0
5
1 0
1 5
2 0
0 7 0 7 1 0 0 7 1 3 0 7 1 6 0 7 1 9 0 7 2 2 0 7 2 5 0 7 - 1 0
- 5
0
5
1 0
1 5
2 0
Cur
rent
vel
ocity
com
pone
nt (c
m s-1
) C
urre
nt v
eloc
ity c
ompo
nent
(cm
s-1
)
Date 2007
12
34
00 05 10 15 20
Fjord zone (year 2007)
Migratory speed (bl sminus1)
AB
C
00 05 10 15 20
Fjord zone (year 2008)
Migratory speed (bl sminus1)
1
FIGURE CAPTIONS 1
2
Figure 1 Map of the lower part of River Alta and the Alta Fjord showing the position 3
of the bag nets ( ) and the release sites ( ) ALS array 1 is indicated with () while 4
ALS arrays 2ndash5 are indicated by grey and black lines Most fish passed these ALSs in the 5
darker parts of the lines The two ALSs in the river mouth (array 6) and the three ALSs 6
(array 7) in the river are given by () The map also shows the position of the two current 7
meters in ALS array 3 ( ) the four zones (Z1ndash4) and the weather station () In the 8
following year (2008) were only array 1 3 5 and 6 present 9
10
11
Figure 2 Daily river flow (- - - - -) and water temperature (___) in the River Alta 12
13
14
Figure 3 Salinity distribution recorded at 0ndash12 m depth across ALS array 2 (a amp c) and ALS 15
array 3 (b amp d) in the Alta Fjord on 6 July (a amp b) and 13 July (c amp d) 2007 16
17
18
Figure 4 Current velocity components at 3 m depth at the north-eastern (upper panel) and 19
south-western (lower panel) side of the Alta Fjord at the ALS array 3 Positive values are 20
towards the fjord head and negative values are towards the fjord mouth indicates time of 21
individual Atlantic salmon (Salmo salar) passage 22
23
2
Figure 5 Migratory speeds of homing Atlantic salmon (Salmo salar) in the Alta Fjord in 2007 24
and 2008 In 2007 the fjord was divided into four zones (see map Fig 1) In 2008 zone A 25
was the area from ALS1ndash3 zone B from ALS3ndash5 and zone C from ALS5ndash6 The box-26
and-whisker plots give the median values (black lines) the interquartile ranges (box 50 of 27
the data falling into this) and the 5th and 95th percentiles (whiskers) 28
29
- cjfas-2012-0352-final1
-
- Homing behaviour of Atlantic salmon (Salmo salar) during final phase of marine migration and river entry
-
- Table 1-3
- Figure 1
- Figure 2
-
- Slide Number 1
-
- Figure 3
-
- Slide Number 1
-
- Figure 4
-
- Slide Number 1
-
- Figure 5
- FIGURE CAPTIONS
-

16
of the variation (Table 3) of the constrained axes in the redundancy analysis was 355
explained by the timing of river entry between different sizes of salmon 356
There was a clear difference in the light intensities between day (50 000ndash209 424 lx) 357
and night (183ndash20 000 lx) during the study period (5ndash24 July) but no significant 358
difference was observed in the timing of river entry between day and night or in the 359
combination of tidal water and day or night (Table 2) Thirty salmon entered the river 360
during day-time and 26 during night time (Chi-square test df = 1 p-value = 062) 361
362
MIGRATORY SPEEDS 363
Mean migratory speed from release to river entry was 97 km day-1 (01 LF s-364
1) but with large individual variation (n = 54 range 07ndash331 km day-1 SD = 80) 365
The mean speed was lower (Welchrsquos t-test df = 50 P = 0003) from release to the 366
array 2 (93 km day-101 LF s-1 n = 52 range 05ndash710 km day-1 SD = 122) than 367
from array 2 to the river mouth (165 km day-102 LF s-1 n = 51 range 06ndash610 km 368
day-1 SD = 137) Median migratory speed (Fig 5) was fastest in zone 1 (06 LF s-1) 369
and decreased as the fish migrated towards the river mouth (01 LF s-1) (05 LF s-1 04 370
LF s-1and 01 LF s-1for zones 2‐4 respectively Linear mixed‐effects model n = 159 P 371
lt 0001) 372
Migratory speed from ALS array one to the river mouth did not depend on the 373
river flow on the day of river entry (r2 = 0007 P = 055) or on cumulative changes in 374
water flow from one (r2 = 0019 P = 031) two (r2 = 0028 P = 022) or three days 375
before entry (r2 = 0013 P = 041) There was also no relationship between migratory 376
speed in zone four (the last 2 km before river entry) and river flow on the day of river 377
entry (r2 = 0033 P = 029) or changes in river flow from the day before entry (r2 = 378
0037 P = 027) 379
17
For the eight returning Atlantic salmon in 2008 (lsquocontrolrsquo group tagged the 380
year before) the median migratory speed decreased as they approached the inner part 381
of the fjord similar to the newly tagged fish (Fig 5) Median migratory speed from 382
array 1 to the river mouth was 272 km day-1 (range 19ndash538 km day-1 SD = 199) 383
which was higher than when salmon were tagged and initially studied in 2007 384
However while the lsquocontrolrsquo group was registered at array 1 the registrations in 385
2007 started at array 2 Therefore a larger part of the fjord was included in 2008 386
387
388
DISCUSSION 389
These results from the relatively pristine Alta Fjord confirmed the hypothesis 390
that horizontal adult migration path was closer to the coastline as the fish approached 391
the river mouth but the distribution was influenced by brackish water distribution 392
northerly winds spread the brackish water across the fjord and the Atlantic salmon 393
seemed to follow this Further the results supported the hypothesis that the migration 394
occurred closer to the surface as the salmon approached the river mouth however the 395
findings could not confirm that river entry was facilitated by increased water 396
discharge and ebb tide and occurred mainly during the night The results confirmed 397
the hypothesis that the marine migration speed of returning Atlantic salmon declined 398
towards the river mouth however the hypothesis that marine migration speeds 399
increased with increasing river discharge was not supported A similar behaviour 400
between newly tagged fish and those tagged the year before their homing migration 401
supported the hypothesis that the migration pattern was not largely affected by short-402
term capture handling and tagging effects 403
404
18
HORIZONTAL DISTRIBUTION 405
Atlantic salmon generally followed the coastline during their homing 406
migration which may suggest that the coastline was used as a guide for orientating to 407
the river The complex interface between open ocean and up-river migration pose 408
special challenges and salmon may use elements of many orientation systems (Quinn 409
et al 1989 Pascual and Quinn 1991 Olson and Quinn 1993) It is widely accepted 410
that salmon at least partly rely on olfactory information to orientate to their home 411
river (Brannon 1981 Stabell 1982 Quinn 1990) The fact that most of the returning 412
adults were observed on the eastern side in the outer and central part of the fjord 413
where the lowest salinities were measured may suggest that the fish used this side of 414
the fjord because it provided the best conditions to locate and recognise the river At 415
array 3 in the inner part of the fjord the brackish layer covered the entire array and 416
here the returning adults utilized both sides of the fjord 417
Despite finding no correlation between the current direction measured at 3 m 418
depth and migratory pattern at array 3 there was a significant relationship between 419
wind direction and horizontal distribution of salmon when passing this array This 420
may indicate that the salmon distribution was influenced by wind induced spreading 421
of river water across the array The same pattern was observed during the outward 422
post-smolts migration studied in the same fjord in the same year (Davidsen et al 423
2009) 424
Despite the wind induced spreading of river water across the fjord mean 425
migratory speed was always higher than measured current velocities so it seems that 426
salmon had an active swimming behaviour when passing the array 3 In other 427
studies Atlantic salmon have been found to be influenced by the tidal current by 428
19
generally moving with the tide (eg Aprahamian et al 1998) but also to swim with 429
lower ground speed during ebb tide and higher during flood tides (Smith et al 1981) 430
431
SWIMMING DEPTH 432
As salmon approached the estuary they swam closer to the surface Since the 433
brackish water from the river outlet is in the upper part of the water column one 434
explanation for this behaviour may be that they use the brackish water layer to locate 435
and recognise the river (Quinn 1990) The attraction may be due to both the lower 436
salinity level and the river odour Earlier gillnet studies have shown that returning 437
Atlantic salmon usually remain near the surface (1ndash5 m depth) but occasionally make 438
downwards movements in the water column (Stasko et al 1973) Westerberg (1982) 439
and Doslashving et al (1985) reported that Atlantic salmon with acoustic tags moved up 440
and down in the water column in association with fine-scale hydrographic 441
stratification and they both concluded that salmon searched for vertical gradients of 442
odours from the home river rather than horizontal gradients Another reason to 443
migrate closer to the sea surface when approaching the river is to acclimate to the 444
fresh water Quinn (1990) suggested that by migrating in and out of the brackish 445
water layer at the top of the water column in the estuary salmonids can adjust to the 446
salinity of their environment as they make the transition from salt water to freshwater 447
448
TIMING OF RIVER ENTRY 449
Females entered the river in average six days earlier than males which is 450
consistent with findings in other studies (Dahl et al 2004 Niemelauml et al 2006) Dahl 451
et al (2004) suggested that the earlier river entry of female Atlantic salmon may be 452
due to females being older than males when performing their spawning migration 453
20
Several previous studies indicate that older (larger) fish usually arrive earlier than 454
younger (smaller) individuals (Power 1981 Jonsson et al 1990a) However in the 455
present study there were no differences in size or age between the two sexes 456
Changes in river flow did not influence the timing of river entry Increased 457
water discharge appears to be an important proximate factor stimulating adult Atlantic 458
salmon to enter small rivers from the sea (Jonsson et al 2007) However this stimuli 459
may act in combination with other environmental factors such as water temperature 460
light tides and water chemistry (Jonsson 1991 Potter et al 1992 Smith and Smith 461
1997) The fact that no correlation between river flow tidal cycle and river entry was 462
found in this study may be due to the generally large discharge of the River Alta (75ndash463
130 m3 s-1 during the study) In a large river like this it may not be critical for salmon 464
to enter the river at high river flow in order to safely migrate upstream or have the ebb 465
tide to facilitate the recognition of the outflowing fresh water from the home river 466
This is supported by the fact that day-of-the-year day or night time river flow and 467
tidal cycle at the time of river entry in total explained only 14 of the variation 468
between different sizes of the salmon This suggests that parameters other than those 469
included in the analysis may be important for timing of river entry or that timing of 470
river entry in the River Alta simply depends on the time salmon reach the estuary and 471
river mouth If the latter is the case timing of river entry may depend on factors 472
influencing the migration in the outer fjord or open sea 473
It has been suggested that the correlation between increased discharge and the 474
time of river entry in large rivers is not due to the stimulus for Atlantic salmon to 475
enter the river per se but rather that increased freshwater supply to near coastal areas 476
may aid salmon to recognise and find their natal river increasing the number of fish 477
entering fresh water compared to low flow periods (Thorstad et al 2010) In the 478
21
present study there was no correlation between time of river entry and changes in 479
river flow one two and three days before entry However since salmon were tagged 480
and monitored in the last part of the spawning run there may already have been 481
enough freshwater in the fjord system to guide the salmon The observation that river 482
entry not is correlated with river flow in large rivers is also supported by other studies 483
(Dahl et al 2004 Karppinen et al 2004) 484
Adult salmon entered the river during all phases of the tidal cycle It has been 485
suggested that Atlantic salmon entering the river during strong ebb currents may have 486
been attracted by the outward flow of fresh water (Potter et al 1992) However there 487
is little consensus among studies about the relationship between tidal phase and river 488
entry (Potter 1988 Potter et al 1992 Smith and Smith 1997 Karppinen et al 2004) 489
Given the wide variation in the physical chemical and hydrographic characteristics of 490
estuaries this variation in the migratory responses of Atlantic salmon to the tidal 491
cycle is perhaps not surprising (Smith and Smith 1997) In general different sizes 492
forms and shapes of rivers may result in different relationships between Atlantic 493
salmon behaviour and environmental factors 494
The absence of a clear diel pattern in the timing of river mouth passage 495
differed from that observed in a post-smolt study in the River Alta when more post-496
smolts passed the river mouth at night during migration towards the sea (Davidsen et 497
al 2009) Nocturnal migration is thought to be an adaptive behaviour to reduce 498
predation by visual predators like seals (Solomon 1982) and has been observed in 499
several studies of returning Atlantic salmon (eg Potter 1988 Smith and Smith 1997) 500
Even though the northern River Alta is situated on a latitude with midnight sun light 501
intensities were still lower than 20 000 lx at night in contrast to the 50 000ndash200 000 502
lx measured during day time The fact that no difference in the diel migration pattern 503
22
was observed for adult salmon may be because they do not experience the same 504
predation level as the smaller post-smolts 505
506
MIGRATORY SPEEDS 507
The migratory speed slowed as salmon approached the estuary and salmon 508
had a lower migratory speed in the innermost part of the estuary (zone four) than in 509
the open fjord (zone onendashthree) This change in travel rates may be an indication of a 510
physiological need to adapt to the fresh water in the river time to orientate towards 511
the river mouth and to recognise the home river (Hansen and Quinn 1998) or to wait 512
for optimal conditions for upstream migration (Jonsson et al 1990b) The finding of 513
decreasing travel rates when approaching the estuary confirm results from mark and 514
recapture studies (Hansen et al 1993 Hansen and Quinn 1998) 515
516
CONTROL FISH TAGGED THE PRECEDING YEAR 517
The migration behaviour of the eight returning Atlantic salmon in 2008 518
(lsquocontrolrsquo group tagged the year before) did not differ from the newly tagged fish 519
Similar to the newly tagged fish median migratory speed decreased as they 520
approached the inner part of the fjord and the fish migrated close (4ndash5 m) to the 521
surface The migration behaviour seemed therefore not affected by capture handling 522
and tagging This is in accordance with a laboratory study indicating that swimming 523
performance of Atlantic salmon was not affected by transmitters used in the present 524
study (Thorstad et al 2000) To our knowledge this study is first one using multiyear 525
tags to capture the migration behaviour of Atlantic salmon while Welch et al (2011) 526
have used this method on juvenile Pacific salmon 527
528
23
529
ACKNOWLEDGEMENTS 530
This study was financed by the Norwegian Research Council (project no 531
17601S40) the Norwegian Institute for Nature Research the Directorate for Nature 532
Management and the University of Tromsoslash The Norwegian Water Resources and 533
Energy Directorate provided data on the river flow The crew onboard the Research 534
Vessel ldquoJohan Ruudrdquo the staff at Alta Laksefiskeri Interessentselskap (ALI) the local 535
bag net fishermen Amund Suhr Anette Grimsrud Davidsen Cedar Chittenden and 536
Jenny Jensen are all thanked for their extensive help during the field work and Gunnel 537
Oslashstborg for scale analyses Helge Meissner is thanked for assistance with genotyping 538
and Svein-Erik Fevolden and Anne K Praeligbel for valuable discussions concerning the 539
genetics Timothy Sheehan and two anonymous referees are thanked for their valuable 540
comments on an earlier version of the manuscript The experimental procedures 541
concur with the national ethical requirements and were approved by the Norwegian 542
National Animal Research Authority 543
544
24
545
REFERENCES 546
547
Alabaster JS Gough PJ and Brooker WJ 1991 The environmental requirements 548
of Atlantic salmon Salmo salar L during their passage through the Thames 549
estuary 1982-89 J Fish Biol 38 741-762 550
Aprahamian MW Jones GO and Gough PJ 1998 Movement of adult Atlantic 551
salmon in the Usk estuary Wales J Fish Biol 53 221-225 552
Banks JW 1969 A review of the litterature on the upstream migration of adult 553
salmonids J Fish Biol 1 85-136 554
Bates D and Maechler M (2010) Package ldquolme4rdquo Reference manual for the 555
package Available at httpcranr-projectorgwebpackageslme4lme4pdf 556
(Assessed 22062012) 557
Brannon EL 1981 Orientation mechanisms of homing salmonids In Salmon and 558
trout migratory behaviour symposium Edited by EL Brannon and EO Salo 559
University of Washington Seattle pp 219-227 560
Cooke SJ Iverson SJ Stokesbury MJW Hinch SG Fisk AT Smith P 561
VanderZwaag D Brattey J and Whoriskey F 2011 Ocean Tracking 562
Network Canada A network approach to addressing critical issues in fisheries 563
and resource management with implications for ocean governance Fisheries 564
36 583-592 565
Dahl J Dannewitz J Karlsson L Petersson E Loumlf A and Ragnarsson B 2004 566
The timing of spawning migration implications of environmental variation 567
life history and sex Can J Zool 82 1864-1870 568
25
Davidsen JG Rikardsen AH Halttunen E Thorstad EB Oslashkland F Letcher 569
BH Skarethhamar J and Naeligsje TF 2009 Migratory behaviour and survival 570
rates of wild northern Atlantic salmon (Salmo salar) post-smolts effects of 571
environmental factors J Fish Biol 75 1700-1718 572
Doslashving KB Westergaringrd H and Johnsen PB 1985 Role of olfaction in the 573
behavioural and neuronal responses of Atlantic salmon Salmo salar to 574
hydrographic stratification Can J Fish Aquat Sci 42 1658-1667 575
Fiske P Lund RA and Hansen LP 2005 Identifying fish farm escapees In Stock 576
identification methods Edited by SX Cadrin KD Friedland and JD 577
Waldman Elsevier Academic Press Amsterdam pp 659-680 578
Halttunen E Rikardsen AH Davidsen JG Thorstad EB and Dempson JB 579
2009 Survival migration speed and swimming depth of Atlantic salmon kelts 580
during sea entry and fjord migration In Tagging and tracking of Marine 581
Animals with Electronic Devices Reviews Methods and Technologies in Fish 582
Biology and Fisheries 9 Edited by JL Nielsen H Arrizabalaga N Fragoso 583
A Hobday M Lutcavage and J Sibert Springer Dordrecht pp 35-49 584
Hansen LP Jonsson N and Jonsson B 1993 Oceanic migration in homing 585
Atlantic salmon Anim Behav 45 927-941 586
Hansen LP and Quinn TP 1998 The marine phase of the Atlantic salmon (Salmo 587
salar) life cycle with comparisons to pacific salmon Can J Fish Aquat Sci 588
55 104-118 589
Heggberget TG Oslashkland F and Ugedal O 1993 Distribution and migratory 590
behaviour of adult wild and farmed Atlantic salmon (Salmo salar) during 591
return migration Aquaculture 118 73-83 592
ICES (2011) Report of the Working Group on North Atlantic Salmon (WGNAS) 593
26
ICES 2011ACOM09 286 pp Available at 594
httpwwwicesdkreportsACOM2011WGNASwgnas_2011_finalpdf 595
(Assessed 22062012) 596
Jonsson B Jonsson N and Hansen LP 1990a Does juvenile experience affect 597
migration and spawning of adult Atlantic salmon Behav Ecol Sociobiol 26 598
225-230 599
Jonsson B Jonsson N and Hansen LP 2007 Factors affecting river entry of adult 600
Atlantic salmon in a small river J Fish Biol 71 943-956 601
Jonsson N 1991 Influence of water flow water temperature and light on fish 602
migration in rivers Nord J Freshwat Res 66 20-35 603
Jonsson N Jonsson B and Hansen LP 1990b Partial segregation in the timing of 604
migration of Atlantic salmon of different ages Anim Behav 40 313-321 605
Karppinen P Erkinaro J Niemelauml E Moen K and Oslashkland F 2004 Return 606
migration of one-sea-winter Atlantic salmon in the River Tana J Fish Biol 607
64 1179-1192 608
Lacroix GL and Voegeli FA 2000 Development of automated monitoring 609
systems for ultrasonic transmitters In Fish Telemetry Proceedings of the 3rd 610
Conference on Fish Telemetry in Europe Edited by A Moore and IC 611
Russell CEFAS Lowestoft UK pp 37-50 612
Legendre P and Legendre L 1998 Numerical ecology p 853 Elsevier Science BV 613
Amsterdam 614
Lund RA and Hansen LP 1991 Identification of wild and reared Atlantic salmon 615
Salmo salar L using scale characters Aquacult Fish Manage 22 499-508 616
Niemelauml E Orell P Erkinaro J Dempson J Broslashrs S Svenning M and 617
Hassinen E 2006 Previously spawned Atlantic salmon ascend a large 618
27
subarctic river earlier than their maiden counterparts J Fish Biol 69 1151ndash619
1163 620
Olson AF and Quinn TP 1993 Vertical and horizontal movements of adult 621
chinook salmon Oncorhynchus tshawytscha in the Columbia River estuary 622
Fishery Bulletin of the Fish and Wildlife Service 91 171-178 623
Parrish DL Behnke RJ Gephard SR McCormick SD and Reeves GH 1998 624
Why arenrsquot there more Atlantic salmon (Salmo salar) Can J Fish Aquat 625
Sci 55 281-287 626
Pascual MA and Quinn TP 1991 Evaluation of alternative models of the coastal 627
migration of adult Fraser River sockeye salmon (Oncorhynchus nerka) Can J 628
Fish Aquat Sci 48 799-810 629
Pierce GJ Boyle PR and Thompson PM 1990 Diet selection by seals In 630
Trophic Relationships in the Marine Environment Edited by M Barnes and 631
RN Gibson Aberdeen University Press Aberdeen pp 222-238 632
Potter ECE 1988 Movements of Atlantic salmon Salmo salar L in an estuary in 633
south-west England J Fish Biol 33 153-159 634
Potter ECE Solomon DJ and Buckley AA 1992 Estuarine movements of adult 635
Atlantic salmon (Salmo salar L) in Christchurch Harbour southern England 636
In Wildlife telemetry remote monitoring and tracking of animals Edited by 637
IG Priede and SM Swift Ellis Horwood Limited Chichester England pp 638
400-409 639
Power G 1981 Stock Characteristics and Catches of Atlantic Salmon (Salmo salar) 640
in Quebec and Newfoundland and Labrador in Relation to Environmental 641
Variables Can J Fish Aquat Sci 38 1601-1611 642
28
Quinn TP 1990 Current controversies in the study of salmon homing Ethol Ecol 643
Evol 2(1) 49-63 644
Quinn TP Terahart BA and Groot C 1989 Migratory orientation and vertical 645
movements of homing adult sockeye salmon Oncorhynchus nerka in coastal 646
waters Anim Behav 37 587-599 647
Smith GW 1990 The relationship between river flow and net catches of salmon 648
(Salmo salar L) in and around the mouth of the Aberdeenshire Dee between 649
1973 and 1986 Fish Res 10 73-91 650
Smith GW Hawkins AD Urquhart GG and Shearer WM 1981 Orientation 651
and energetic efficiency in the offshore movements of returning Atlantic 652
salmon Salmo salar L Scott Fish Res Rep 21 1-22 653
Smith IP and Smith GW 1997 Tidal and diel timing of river entry by adult 654
Atlantic salmon returning to the Aberdeenshire Dee Scotland J Fish Biol 50 655
463-474 656
Solomon DJ 1982 Smolt migration in Atlantic salmon (Salmo salar L) and sea 657
trout (Salmo trutta L) In Salmon and trout migratory behavior symposium 658
Edited by EL Brannon and EO Salo University of Washington Seattle pp 659
196-203 660
Stabell OB 1982 Homing of Atlantic salmon in relation to olfaction and genetics In 661
Salmon and trout migratory behaviour symposium Edited by EL Brannon 662
and EO Salo University of Washington Seattle pp 238-246 663
Stasko AB Sutterlin AM Rommel SAj and Elson PF 1973 Migration-664
orientation of Atlantic salmon (Salmo salar L) In International Atlantic 665
Salmon Symposium Special Publication Series Edited by MW Smith and 666
29
WM Carter International Atlantic Salmon Foundation New York pp 119-667
137 668
Svendsen H 1995 Physical oceanography of coupled fjord-coast systems in northern 669
Norway with special focus on frontal dynamics and tides In Ecology of fjords 670
and coastal waters Edited by HR Skjoldal C Hopkins KJ Erikstad and 671
HP Leinaas Elsevier Science Publ B V Amsterdam pp 149-164 672
Thorstad EB Heggberget TG and Oslashkland F 1998 Migratory behaviour of adult 673
wild and escaped farmed Atlantic salmon Salmo salar L before during and 674
after spawning in a Norwegian river Aquacult Res 29 419-428 675
Thorstad EB Whoriskey F Uglem I Moore A Rikardsen AH and Finstad B 676
2012 A critical life stage of the Atlantic salmon Salmo salar behaviour and 677
survival during the smolt and initial post-smolt migration J Fish Biol 81 678
500-542 679
Thorstad EB Whoriskey FG Rikardsen AH and Aarestrup K 2010 Aquatic 680
nomads the life and migrations of the Atlantic salmon In Atlantic Salmon 681
Ecology Edited by Oslash Aas S Einum A Klemetsen and J Skurdal Wiley-682
Blackwell New York pp 1-32 683
Thorstad EB Oslashkland F Aarestrup K and Heggberget TG 2008 Factors 684
affecting the within-river spawning migration of Atlantic salmon with 685
emphasis on human impacts Rev Fish Biol Fish 18 345-371 686
Thorstad EB Oslashkland F and Finstad B 2000 Effects of telemetry transmitters on 687
swimming performance of adult Atlantic salmon J Fish Biol 57 531-535 688
Treacutepanier S Rodriacuteguez MA and Magnan P 1996 Spawning migrations in 689
landlocked Atlantic salmon time series modelling of river discharge and water 690
temperature effects J Fish Biol 48 925-936 691
30
Ugedal O Naeligsje TF Thorstad EB Forseth T Saksgaringrd L and Heggberget 692
TG 2008 Twenty years of hydropower regulation in the River Alta long 693
term changes in abundance of juvenile and adult Atlantic salmon 694
Hydrobiologia 609 9-23 695
Welch DW Melnychuk MC Payne JC Rechisky EL Porter AD Jackson 696
GD Ward BR Vincent SP Wood CC and Semmens J 2011 In situ 697
Measurement of Coastal Ocean Movements and Survival of Juvenile Pacific 698
Salmon Proc Natl Acad Sci USA 108 8708-8713 699
Westerberg H 1982 Ultrasonic tracking of Atlantic salmon (Salmo salar L) ndash II 700
Swimming depth and temperature stratification Rep Inst Fresh Res 701
Drottningholm 60 102-120 702
1
TABLES 1
Table 1 Mean swimming depth registered at the time Atlantic salmon (Salmo salar) passed 2
the array 2ndash5 in the Alta Fjord Mean values are based on individual means Welchrsquos t-test 3
was used to test for significant difference between male and female swimming depth 4
5
ALS
Array
n
Mean
(m)
SD individual
mean (range)
(m)
Deepest
individual
recording
(m)
Mean
depth
females
(m)
Mean
depth
males
(m)
p-value
(between
sexes)
2 23 24 37 (00ndash161) 297 26 18 057
3 24 11 15 (00ndash64) 189 09 14 036
4 18 15 19 (00ndash67) 109 14 17 075
5 21 05 07 (00ndash18) 146 04 09 018
2
Table 2 Comparisons of the number and proportions of homing Atlantic salmon (Salmo 6
salar) entering the river during 1) different stages of the tidal cycle and 2) for different 7
combinations of day and night and different stages of the tidal cycle Chi-square-tests were 8
used to test for differences between different stages of the tidal cycle and between the 9
different combinations of day and night and different stages of the tidal cycle 10
11
Number
(n =56) P-value
High tide 15 27
Ebbing tide 13 23
Low tide 9 16
Flooding tide 19 34 029
High tide day time 7 13
High tide night time 8 14
Ebbing tide day time 7 13
Ebbing tide night time 6 11
Low tide day time 5 9
Low tide night time 4 7
Flooding tide day time 11 20
Flooding tide night time 8 14 071
12
3
Table 3 Results from a redundancy analysis (RDA) exploring whether timing of river entry 13
(day-of-the-year day or night river flow tidal cycle) of Atlantic salmon (Salmo salar) 14
depended on fork length or body mass The proportion of constrained and unconstrained 15
inertia (the sum of the variance from all included parameters) from total inertia was 16
calculated which in RDA gives the proportion of variance 17
18
19
Inertia Proportion
Total 20000 10000
Constrained 02846 01423
Unconstrained 17154 08577
0
N
5
km RiverAlta
Alta Fjord
70deg30deg20deg
65deg
Norway Sweden
Finland
1
2
34
5
Z 1Z 1 Z 2Z 2
Z 3Z 3Z 4Z 47 6
10
11
12
13
14
15
16
40
50
60
70
80
90
100
110
120
130
140
57 127 197 267 28
Tem
pera
ture
(degC
)
Riv
er fl
ow (m
3 s-1
)
Date 2007
0 7 0 7 1 0 0 7 1 3 0 7 1 6 0 7 1 9 0 7 2 2 0 7 2 5 0 7 - 1 0
- 5
0
5
1 0
1 5
2 0
0 7 0 7 1 0 0 7 1 3 0 7 1 6 0 7 1 9 0 7 2 2 0 7 2 5 0 7 - 1 0
- 5
0
5
1 0
1 5
2 0
Cur
rent
vel
ocity
com
pone
nt (c
m s-1
) C
urre
nt v
eloc
ity c
ompo
nent
(cm
s-1
)
Date 2007
12
34
00 05 10 15 20
Fjord zone (year 2007)
Migratory speed (bl sminus1)
AB
C
00 05 10 15 20
Fjord zone (year 2008)
Migratory speed (bl sminus1)
1
FIGURE CAPTIONS 1
2
Figure 1 Map of the lower part of River Alta and the Alta Fjord showing the position 3
of the bag nets ( ) and the release sites ( ) ALS array 1 is indicated with () while 4
ALS arrays 2ndash5 are indicated by grey and black lines Most fish passed these ALSs in the 5
darker parts of the lines The two ALSs in the river mouth (array 6) and the three ALSs 6
(array 7) in the river are given by () The map also shows the position of the two current 7
meters in ALS array 3 ( ) the four zones (Z1ndash4) and the weather station () In the 8
following year (2008) were only array 1 3 5 and 6 present 9
10
11
Figure 2 Daily river flow (- - - - -) and water temperature (___) in the River Alta 12
13
14
Figure 3 Salinity distribution recorded at 0ndash12 m depth across ALS array 2 (a amp c) and ALS 15
array 3 (b amp d) in the Alta Fjord on 6 July (a amp b) and 13 July (c amp d) 2007 16
17
18
Figure 4 Current velocity components at 3 m depth at the north-eastern (upper panel) and 19
south-western (lower panel) side of the Alta Fjord at the ALS array 3 Positive values are 20
towards the fjord head and negative values are towards the fjord mouth indicates time of 21
individual Atlantic salmon (Salmo salar) passage 22
23
2
Figure 5 Migratory speeds of homing Atlantic salmon (Salmo salar) in the Alta Fjord in 2007 24
and 2008 In 2007 the fjord was divided into four zones (see map Fig 1) In 2008 zone A 25
was the area from ALS1ndash3 zone B from ALS3ndash5 and zone C from ALS5ndash6 The box-26
and-whisker plots give the median values (black lines) the interquartile ranges (box 50 of 27
the data falling into this) and the 5th and 95th percentiles (whiskers) 28
29
- cjfas-2012-0352-final1
-
- Homing behaviour of Atlantic salmon (Salmo salar) during final phase of marine migration and river entry
-
- Table 1-3
- Figure 1
- Figure 2
-
- Slide Number 1
-
- Figure 3
-
- Slide Number 1
-
- Figure 4
-
- Slide Number 1
-
- Figure 5
- FIGURE CAPTIONS
-

17
For the eight returning Atlantic salmon in 2008 (lsquocontrolrsquo group tagged the 380
year before) the median migratory speed decreased as they approached the inner part 381
of the fjord similar to the newly tagged fish (Fig 5) Median migratory speed from 382
array 1 to the river mouth was 272 km day-1 (range 19ndash538 km day-1 SD = 199) 383
which was higher than when salmon were tagged and initially studied in 2007 384
However while the lsquocontrolrsquo group was registered at array 1 the registrations in 385
2007 started at array 2 Therefore a larger part of the fjord was included in 2008 386
387
388
DISCUSSION 389
These results from the relatively pristine Alta Fjord confirmed the hypothesis 390
that horizontal adult migration path was closer to the coastline as the fish approached 391
the river mouth but the distribution was influenced by brackish water distribution 392
northerly winds spread the brackish water across the fjord and the Atlantic salmon 393
seemed to follow this Further the results supported the hypothesis that the migration 394
occurred closer to the surface as the salmon approached the river mouth however the 395
findings could not confirm that river entry was facilitated by increased water 396
discharge and ebb tide and occurred mainly during the night The results confirmed 397
the hypothesis that the marine migration speed of returning Atlantic salmon declined 398
towards the river mouth however the hypothesis that marine migration speeds 399
increased with increasing river discharge was not supported A similar behaviour 400
between newly tagged fish and those tagged the year before their homing migration 401
supported the hypothesis that the migration pattern was not largely affected by short-402
term capture handling and tagging effects 403
404
18
HORIZONTAL DISTRIBUTION 405
Atlantic salmon generally followed the coastline during their homing 406
migration which may suggest that the coastline was used as a guide for orientating to 407
the river The complex interface between open ocean and up-river migration pose 408
special challenges and salmon may use elements of many orientation systems (Quinn 409
et al 1989 Pascual and Quinn 1991 Olson and Quinn 1993) It is widely accepted 410
that salmon at least partly rely on olfactory information to orientate to their home 411
river (Brannon 1981 Stabell 1982 Quinn 1990) The fact that most of the returning 412
adults were observed on the eastern side in the outer and central part of the fjord 413
where the lowest salinities were measured may suggest that the fish used this side of 414
the fjord because it provided the best conditions to locate and recognise the river At 415
array 3 in the inner part of the fjord the brackish layer covered the entire array and 416
here the returning adults utilized both sides of the fjord 417
Despite finding no correlation between the current direction measured at 3 m 418
depth and migratory pattern at array 3 there was a significant relationship between 419
wind direction and horizontal distribution of salmon when passing this array This 420
may indicate that the salmon distribution was influenced by wind induced spreading 421
of river water across the array The same pattern was observed during the outward 422
post-smolts migration studied in the same fjord in the same year (Davidsen et al 423
2009) 424
Despite the wind induced spreading of river water across the fjord mean 425
migratory speed was always higher than measured current velocities so it seems that 426
salmon had an active swimming behaviour when passing the array 3 In other 427
studies Atlantic salmon have been found to be influenced by the tidal current by 428
19
generally moving with the tide (eg Aprahamian et al 1998) but also to swim with 429
lower ground speed during ebb tide and higher during flood tides (Smith et al 1981) 430
431
SWIMMING DEPTH 432
As salmon approached the estuary they swam closer to the surface Since the 433
brackish water from the river outlet is in the upper part of the water column one 434
explanation for this behaviour may be that they use the brackish water layer to locate 435
and recognise the river (Quinn 1990) The attraction may be due to both the lower 436
salinity level and the river odour Earlier gillnet studies have shown that returning 437
Atlantic salmon usually remain near the surface (1ndash5 m depth) but occasionally make 438
downwards movements in the water column (Stasko et al 1973) Westerberg (1982) 439
and Doslashving et al (1985) reported that Atlantic salmon with acoustic tags moved up 440
and down in the water column in association with fine-scale hydrographic 441
stratification and they both concluded that salmon searched for vertical gradients of 442
odours from the home river rather than horizontal gradients Another reason to 443
migrate closer to the sea surface when approaching the river is to acclimate to the 444
fresh water Quinn (1990) suggested that by migrating in and out of the brackish 445
water layer at the top of the water column in the estuary salmonids can adjust to the 446
salinity of their environment as they make the transition from salt water to freshwater 447
448
TIMING OF RIVER ENTRY 449
Females entered the river in average six days earlier than males which is 450
consistent with findings in other studies (Dahl et al 2004 Niemelauml et al 2006) Dahl 451
et al (2004) suggested that the earlier river entry of female Atlantic salmon may be 452
due to females being older than males when performing their spawning migration 453
20
Several previous studies indicate that older (larger) fish usually arrive earlier than 454
younger (smaller) individuals (Power 1981 Jonsson et al 1990a) However in the 455
present study there were no differences in size or age between the two sexes 456
Changes in river flow did not influence the timing of river entry Increased 457
water discharge appears to be an important proximate factor stimulating adult Atlantic 458
salmon to enter small rivers from the sea (Jonsson et al 2007) However this stimuli 459
may act in combination with other environmental factors such as water temperature 460
light tides and water chemistry (Jonsson 1991 Potter et al 1992 Smith and Smith 461
1997) The fact that no correlation between river flow tidal cycle and river entry was 462
found in this study may be due to the generally large discharge of the River Alta (75ndash463
130 m3 s-1 during the study) In a large river like this it may not be critical for salmon 464
to enter the river at high river flow in order to safely migrate upstream or have the ebb 465
tide to facilitate the recognition of the outflowing fresh water from the home river 466
This is supported by the fact that day-of-the-year day or night time river flow and 467
tidal cycle at the time of river entry in total explained only 14 of the variation 468
between different sizes of the salmon This suggests that parameters other than those 469
included in the analysis may be important for timing of river entry or that timing of 470
river entry in the River Alta simply depends on the time salmon reach the estuary and 471
river mouth If the latter is the case timing of river entry may depend on factors 472
influencing the migration in the outer fjord or open sea 473
It has been suggested that the correlation between increased discharge and the 474
time of river entry in large rivers is not due to the stimulus for Atlantic salmon to 475
enter the river per se but rather that increased freshwater supply to near coastal areas 476
may aid salmon to recognise and find their natal river increasing the number of fish 477
entering fresh water compared to low flow periods (Thorstad et al 2010) In the 478
21
present study there was no correlation between time of river entry and changes in 479
river flow one two and three days before entry However since salmon were tagged 480
and monitored in the last part of the spawning run there may already have been 481
enough freshwater in the fjord system to guide the salmon The observation that river 482
entry not is correlated with river flow in large rivers is also supported by other studies 483
(Dahl et al 2004 Karppinen et al 2004) 484
Adult salmon entered the river during all phases of the tidal cycle It has been 485
suggested that Atlantic salmon entering the river during strong ebb currents may have 486
been attracted by the outward flow of fresh water (Potter et al 1992) However there 487
is little consensus among studies about the relationship between tidal phase and river 488
entry (Potter 1988 Potter et al 1992 Smith and Smith 1997 Karppinen et al 2004) 489
Given the wide variation in the physical chemical and hydrographic characteristics of 490
estuaries this variation in the migratory responses of Atlantic salmon to the tidal 491
cycle is perhaps not surprising (Smith and Smith 1997) In general different sizes 492
forms and shapes of rivers may result in different relationships between Atlantic 493
salmon behaviour and environmental factors 494
The absence of a clear diel pattern in the timing of river mouth passage 495
differed from that observed in a post-smolt study in the River Alta when more post-496
smolts passed the river mouth at night during migration towards the sea (Davidsen et 497
al 2009) Nocturnal migration is thought to be an adaptive behaviour to reduce 498
predation by visual predators like seals (Solomon 1982) and has been observed in 499
several studies of returning Atlantic salmon (eg Potter 1988 Smith and Smith 1997) 500
Even though the northern River Alta is situated on a latitude with midnight sun light 501
intensities were still lower than 20 000 lx at night in contrast to the 50 000ndash200 000 502
lx measured during day time The fact that no difference in the diel migration pattern 503
22
was observed for adult salmon may be because they do not experience the same 504
predation level as the smaller post-smolts 505
506
MIGRATORY SPEEDS 507
The migratory speed slowed as salmon approached the estuary and salmon 508
had a lower migratory speed in the innermost part of the estuary (zone four) than in 509
the open fjord (zone onendashthree) This change in travel rates may be an indication of a 510
physiological need to adapt to the fresh water in the river time to orientate towards 511
the river mouth and to recognise the home river (Hansen and Quinn 1998) or to wait 512
for optimal conditions for upstream migration (Jonsson et al 1990b) The finding of 513
decreasing travel rates when approaching the estuary confirm results from mark and 514
recapture studies (Hansen et al 1993 Hansen and Quinn 1998) 515
516
CONTROL FISH TAGGED THE PRECEDING YEAR 517
The migration behaviour of the eight returning Atlantic salmon in 2008 518
(lsquocontrolrsquo group tagged the year before) did not differ from the newly tagged fish 519
Similar to the newly tagged fish median migratory speed decreased as they 520
approached the inner part of the fjord and the fish migrated close (4ndash5 m) to the 521
surface The migration behaviour seemed therefore not affected by capture handling 522
and tagging This is in accordance with a laboratory study indicating that swimming 523
performance of Atlantic salmon was not affected by transmitters used in the present 524
study (Thorstad et al 2000) To our knowledge this study is first one using multiyear 525
tags to capture the migration behaviour of Atlantic salmon while Welch et al (2011) 526
have used this method on juvenile Pacific salmon 527
528
23
529
ACKNOWLEDGEMENTS 530
This study was financed by the Norwegian Research Council (project no 531
17601S40) the Norwegian Institute for Nature Research the Directorate for Nature 532
Management and the University of Tromsoslash The Norwegian Water Resources and 533
Energy Directorate provided data on the river flow The crew onboard the Research 534
Vessel ldquoJohan Ruudrdquo the staff at Alta Laksefiskeri Interessentselskap (ALI) the local 535
bag net fishermen Amund Suhr Anette Grimsrud Davidsen Cedar Chittenden and 536
Jenny Jensen are all thanked for their extensive help during the field work and Gunnel 537
Oslashstborg for scale analyses Helge Meissner is thanked for assistance with genotyping 538
and Svein-Erik Fevolden and Anne K Praeligbel for valuable discussions concerning the 539
genetics Timothy Sheehan and two anonymous referees are thanked for their valuable 540
comments on an earlier version of the manuscript The experimental procedures 541
concur with the national ethical requirements and were approved by the Norwegian 542
National Animal Research Authority 543
544
24
545
REFERENCES 546
547
Alabaster JS Gough PJ and Brooker WJ 1991 The environmental requirements 548
of Atlantic salmon Salmo salar L during their passage through the Thames 549
estuary 1982-89 J Fish Biol 38 741-762 550
Aprahamian MW Jones GO and Gough PJ 1998 Movement of adult Atlantic 551
salmon in the Usk estuary Wales J Fish Biol 53 221-225 552
Banks JW 1969 A review of the litterature on the upstream migration of adult 553
salmonids J Fish Biol 1 85-136 554
Bates D and Maechler M (2010) Package ldquolme4rdquo Reference manual for the 555
package Available at httpcranr-projectorgwebpackageslme4lme4pdf 556
(Assessed 22062012) 557
Brannon EL 1981 Orientation mechanisms of homing salmonids In Salmon and 558
trout migratory behaviour symposium Edited by EL Brannon and EO Salo 559
University of Washington Seattle pp 219-227 560
Cooke SJ Iverson SJ Stokesbury MJW Hinch SG Fisk AT Smith P 561
VanderZwaag D Brattey J and Whoriskey F 2011 Ocean Tracking 562
Network Canada A network approach to addressing critical issues in fisheries 563
and resource management with implications for ocean governance Fisheries 564
36 583-592 565
Dahl J Dannewitz J Karlsson L Petersson E Loumlf A and Ragnarsson B 2004 566
The timing of spawning migration implications of environmental variation 567
life history and sex Can J Zool 82 1864-1870 568
25
Davidsen JG Rikardsen AH Halttunen E Thorstad EB Oslashkland F Letcher 569
BH Skarethhamar J and Naeligsje TF 2009 Migratory behaviour and survival 570
rates of wild northern Atlantic salmon (Salmo salar) post-smolts effects of 571
environmental factors J Fish Biol 75 1700-1718 572
Doslashving KB Westergaringrd H and Johnsen PB 1985 Role of olfaction in the 573
behavioural and neuronal responses of Atlantic salmon Salmo salar to 574
hydrographic stratification Can J Fish Aquat Sci 42 1658-1667 575
Fiske P Lund RA and Hansen LP 2005 Identifying fish farm escapees In Stock 576
identification methods Edited by SX Cadrin KD Friedland and JD 577
Waldman Elsevier Academic Press Amsterdam pp 659-680 578
Halttunen E Rikardsen AH Davidsen JG Thorstad EB and Dempson JB 579
2009 Survival migration speed and swimming depth of Atlantic salmon kelts 580
during sea entry and fjord migration In Tagging and tracking of Marine 581
Animals with Electronic Devices Reviews Methods and Technologies in Fish 582
Biology and Fisheries 9 Edited by JL Nielsen H Arrizabalaga N Fragoso 583
A Hobday M Lutcavage and J Sibert Springer Dordrecht pp 35-49 584
Hansen LP Jonsson N and Jonsson B 1993 Oceanic migration in homing 585
Atlantic salmon Anim Behav 45 927-941 586
Hansen LP and Quinn TP 1998 The marine phase of the Atlantic salmon (Salmo 587
salar) life cycle with comparisons to pacific salmon Can J Fish Aquat Sci 588
55 104-118 589
Heggberget TG Oslashkland F and Ugedal O 1993 Distribution and migratory 590
behaviour of adult wild and farmed Atlantic salmon (Salmo salar) during 591
return migration Aquaculture 118 73-83 592
ICES (2011) Report of the Working Group on North Atlantic Salmon (WGNAS) 593
26
ICES 2011ACOM09 286 pp Available at 594
httpwwwicesdkreportsACOM2011WGNASwgnas_2011_finalpdf 595
(Assessed 22062012) 596
Jonsson B Jonsson N and Hansen LP 1990a Does juvenile experience affect 597
migration and spawning of adult Atlantic salmon Behav Ecol Sociobiol 26 598
225-230 599
Jonsson B Jonsson N and Hansen LP 2007 Factors affecting river entry of adult 600
Atlantic salmon in a small river J Fish Biol 71 943-956 601
Jonsson N 1991 Influence of water flow water temperature and light on fish 602
migration in rivers Nord J Freshwat Res 66 20-35 603
Jonsson N Jonsson B and Hansen LP 1990b Partial segregation in the timing of 604
migration of Atlantic salmon of different ages Anim Behav 40 313-321 605
Karppinen P Erkinaro J Niemelauml E Moen K and Oslashkland F 2004 Return 606
migration of one-sea-winter Atlantic salmon in the River Tana J Fish Biol 607
64 1179-1192 608
Lacroix GL and Voegeli FA 2000 Development of automated monitoring 609
systems for ultrasonic transmitters In Fish Telemetry Proceedings of the 3rd 610
Conference on Fish Telemetry in Europe Edited by A Moore and IC 611
Russell CEFAS Lowestoft UK pp 37-50 612
Legendre P and Legendre L 1998 Numerical ecology p 853 Elsevier Science BV 613
Amsterdam 614
Lund RA and Hansen LP 1991 Identification of wild and reared Atlantic salmon 615
Salmo salar L using scale characters Aquacult Fish Manage 22 499-508 616
Niemelauml E Orell P Erkinaro J Dempson J Broslashrs S Svenning M and 617
Hassinen E 2006 Previously spawned Atlantic salmon ascend a large 618
27
subarctic river earlier than their maiden counterparts J Fish Biol 69 1151ndash619
1163 620
Olson AF and Quinn TP 1993 Vertical and horizontal movements of adult 621
chinook salmon Oncorhynchus tshawytscha in the Columbia River estuary 622
Fishery Bulletin of the Fish and Wildlife Service 91 171-178 623
Parrish DL Behnke RJ Gephard SR McCormick SD and Reeves GH 1998 624
Why arenrsquot there more Atlantic salmon (Salmo salar) Can J Fish Aquat 625
Sci 55 281-287 626
Pascual MA and Quinn TP 1991 Evaluation of alternative models of the coastal 627
migration of adult Fraser River sockeye salmon (Oncorhynchus nerka) Can J 628
Fish Aquat Sci 48 799-810 629
Pierce GJ Boyle PR and Thompson PM 1990 Diet selection by seals In 630
Trophic Relationships in the Marine Environment Edited by M Barnes and 631
RN Gibson Aberdeen University Press Aberdeen pp 222-238 632
Potter ECE 1988 Movements of Atlantic salmon Salmo salar L in an estuary in 633
south-west England J Fish Biol 33 153-159 634
Potter ECE Solomon DJ and Buckley AA 1992 Estuarine movements of adult 635
Atlantic salmon (Salmo salar L) in Christchurch Harbour southern England 636
In Wildlife telemetry remote monitoring and tracking of animals Edited by 637
IG Priede and SM Swift Ellis Horwood Limited Chichester England pp 638
400-409 639
Power G 1981 Stock Characteristics and Catches of Atlantic Salmon (Salmo salar) 640
in Quebec and Newfoundland and Labrador in Relation to Environmental 641
Variables Can J Fish Aquat Sci 38 1601-1611 642
28
Quinn TP 1990 Current controversies in the study of salmon homing Ethol Ecol 643
Evol 2(1) 49-63 644
Quinn TP Terahart BA and Groot C 1989 Migratory orientation and vertical 645
movements of homing adult sockeye salmon Oncorhynchus nerka in coastal 646
waters Anim Behav 37 587-599 647
Smith GW 1990 The relationship between river flow and net catches of salmon 648
(Salmo salar L) in and around the mouth of the Aberdeenshire Dee between 649
1973 and 1986 Fish Res 10 73-91 650
Smith GW Hawkins AD Urquhart GG and Shearer WM 1981 Orientation 651
and energetic efficiency in the offshore movements of returning Atlantic 652
salmon Salmo salar L Scott Fish Res Rep 21 1-22 653
Smith IP and Smith GW 1997 Tidal and diel timing of river entry by adult 654
Atlantic salmon returning to the Aberdeenshire Dee Scotland J Fish Biol 50 655
463-474 656
Solomon DJ 1982 Smolt migration in Atlantic salmon (Salmo salar L) and sea 657
trout (Salmo trutta L) In Salmon and trout migratory behavior symposium 658
Edited by EL Brannon and EO Salo University of Washington Seattle pp 659
196-203 660
Stabell OB 1982 Homing of Atlantic salmon in relation to olfaction and genetics In 661
Salmon and trout migratory behaviour symposium Edited by EL Brannon 662
and EO Salo University of Washington Seattle pp 238-246 663
Stasko AB Sutterlin AM Rommel SAj and Elson PF 1973 Migration-664
orientation of Atlantic salmon (Salmo salar L) In International Atlantic 665
Salmon Symposium Special Publication Series Edited by MW Smith and 666
29
WM Carter International Atlantic Salmon Foundation New York pp 119-667
137 668
Svendsen H 1995 Physical oceanography of coupled fjord-coast systems in northern 669
Norway with special focus on frontal dynamics and tides In Ecology of fjords 670
and coastal waters Edited by HR Skjoldal C Hopkins KJ Erikstad and 671
HP Leinaas Elsevier Science Publ B V Amsterdam pp 149-164 672
Thorstad EB Heggberget TG and Oslashkland F 1998 Migratory behaviour of adult 673
wild and escaped farmed Atlantic salmon Salmo salar L before during and 674
after spawning in a Norwegian river Aquacult Res 29 419-428 675
Thorstad EB Whoriskey F Uglem I Moore A Rikardsen AH and Finstad B 676
2012 A critical life stage of the Atlantic salmon Salmo salar behaviour and 677
survival during the smolt and initial post-smolt migration J Fish Biol 81 678
500-542 679
Thorstad EB Whoriskey FG Rikardsen AH and Aarestrup K 2010 Aquatic 680
nomads the life and migrations of the Atlantic salmon In Atlantic Salmon 681
Ecology Edited by Oslash Aas S Einum A Klemetsen and J Skurdal Wiley-682
Blackwell New York pp 1-32 683
Thorstad EB Oslashkland F Aarestrup K and Heggberget TG 2008 Factors 684
affecting the within-river spawning migration of Atlantic salmon with 685
emphasis on human impacts Rev Fish Biol Fish 18 345-371 686
Thorstad EB Oslashkland F and Finstad B 2000 Effects of telemetry transmitters on 687
swimming performance of adult Atlantic salmon J Fish Biol 57 531-535 688
Treacutepanier S Rodriacuteguez MA and Magnan P 1996 Spawning migrations in 689
landlocked Atlantic salmon time series modelling of river discharge and water 690
temperature effects J Fish Biol 48 925-936 691
30
Ugedal O Naeligsje TF Thorstad EB Forseth T Saksgaringrd L and Heggberget 692
TG 2008 Twenty years of hydropower regulation in the River Alta long 693
term changes in abundance of juvenile and adult Atlantic salmon 694
Hydrobiologia 609 9-23 695
Welch DW Melnychuk MC Payne JC Rechisky EL Porter AD Jackson 696
GD Ward BR Vincent SP Wood CC and Semmens J 2011 In situ 697
Measurement of Coastal Ocean Movements and Survival of Juvenile Pacific 698
Salmon Proc Natl Acad Sci USA 108 8708-8713 699
Westerberg H 1982 Ultrasonic tracking of Atlantic salmon (Salmo salar L) ndash II 700
Swimming depth and temperature stratification Rep Inst Fresh Res 701
Drottningholm 60 102-120 702
1
TABLES 1
Table 1 Mean swimming depth registered at the time Atlantic salmon (Salmo salar) passed 2
the array 2ndash5 in the Alta Fjord Mean values are based on individual means Welchrsquos t-test 3
was used to test for significant difference between male and female swimming depth 4
5
ALS
Array
n
Mean
(m)
SD individual
mean (range)
(m)
Deepest
individual
recording
(m)
Mean
depth
females
(m)
Mean
depth
males
(m)
p-value
(between
sexes)
2 23 24 37 (00ndash161) 297 26 18 057
3 24 11 15 (00ndash64) 189 09 14 036
4 18 15 19 (00ndash67) 109 14 17 075
5 21 05 07 (00ndash18) 146 04 09 018
2
Table 2 Comparisons of the number and proportions of homing Atlantic salmon (Salmo 6
salar) entering the river during 1) different stages of the tidal cycle and 2) for different 7
combinations of day and night and different stages of the tidal cycle Chi-square-tests were 8
used to test for differences between different stages of the tidal cycle and between the 9
different combinations of day and night and different stages of the tidal cycle 10
11
Number
(n =56) P-value
High tide 15 27
Ebbing tide 13 23
Low tide 9 16
Flooding tide 19 34 029
High tide day time 7 13
High tide night time 8 14
Ebbing tide day time 7 13
Ebbing tide night time 6 11
Low tide day time 5 9
Low tide night time 4 7
Flooding tide day time 11 20
Flooding tide night time 8 14 071
12
3
Table 3 Results from a redundancy analysis (RDA) exploring whether timing of river entry 13
(day-of-the-year day or night river flow tidal cycle) of Atlantic salmon (Salmo salar) 14
depended on fork length or body mass The proportion of constrained and unconstrained 15
inertia (the sum of the variance from all included parameters) from total inertia was 16
calculated which in RDA gives the proportion of variance 17
18
19
Inertia Proportion
Total 20000 10000
Constrained 02846 01423
Unconstrained 17154 08577
0
N
5
km RiverAlta
Alta Fjord
70deg30deg20deg
65deg
Norway Sweden
Finland
1
2
34
5
Z 1Z 1 Z 2Z 2
Z 3Z 3Z 4Z 47 6
10
11
12
13
14
15
16
40
50
60
70
80
90
100
110
120
130
140
57 127 197 267 28
Tem
pera
ture
(degC
)
Riv
er fl
ow (m
3 s-1
)
Date 2007
0 7 0 7 1 0 0 7 1 3 0 7 1 6 0 7 1 9 0 7 2 2 0 7 2 5 0 7 - 1 0
- 5
0
5
1 0
1 5
2 0
0 7 0 7 1 0 0 7 1 3 0 7 1 6 0 7 1 9 0 7 2 2 0 7 2 5 0 7 - 1 0
- 5
0
5
1 0
1 5
2 0
Cur
rent
vel
ocity
com
pone
nt (c
m s-1
) C
urre
nt v
eloc
ity c
ompo
nent
(cm
s-1
)
Date 2007
12
34
00 05 10 15 20
Fjord zone (year 2007)
Migratory speed (bl sminus1)
AB
C
00 05 10 15 20
Fjord zone (year 2008)
Migratory speed (bl sminus1)
1
FIGURE CAPTIONS 1
2
Figure 1 Map of the lower part of River Alta and the Alta Fjord showing the position 3
of the bag nets ( ) and the release sites ( ) ALS array 1 is indicated with () while 4
ALS arrays 2ndash5 are indicated by grey and black lines Most fish passed these ALSs in the 5
darker parts of the lines The two ALSs in the river mouth (array 6) and the three ALSs 6
(array 7) in the river are given by () The map also shows the position of the two current 7
meters in ALS array 3 ( ) the four zones (Z1ndash4) and the weather station () In the 8
following year (2008) were only array 1 3 5 and 6 present 9
10
11
Figure 2 Daily river flow (- - - - -) and water temperature (___) in the River Alta 12
13
14
Figure 3 Salinity distribution recorded at 0ndash12 m depth across ALS array 2 (a amp c) and ALS 15
array 3 (b amp d) in the Alta Fjord on 6 July (a amp b) and 13 July (c amp d) 2007 16
17
18
Figure 4 Current velocity components at 3 m depth at the north-eastern (upper panel) and 19
south-western (lower panel) side of the Alta Fjord at the ALS array 3 Positive values are 20
towards the fjord head and negative values are towards the fjord mouth indicates time of 21
individual Atlantic salmon (Salmo salar) passage 22
23
2
Figure 5 Migratory speeds of homing Atlantic salmon (Salmo salar) in the Alta Fjord in 2007 24
and 2008 In 2007 the fjord was divided into four zones (see map Fig 1) In 2008 zone A 25
was the area from ALS1ndash3 zone B from ALS3ndash5 and zone C from ALS5ndash6 The box-26
and-whisker plots give the median values (black lines) the interquartile ranges (box 50 of 27
the data falling into this) and the 5th and 95th percentiles (whiskers) 28
29
- cjfas-2012-0352-final1
-
- Homing behaviour of Atlantic salmon (Salmo salar) during final phase of marine migration and river entry
-
- Table 1-3
- Figure 1
- Figure 2
-
- Slide Number 1
-
- Figure 3
-
- Slide Number 1
-
- Figure 4
-
- Slide Number 1
-
- Figure 5
- FIGURE CAPTIONS
-

18
HORIZONTAL DISTRIBUTION 405
Atlantic salmon generally followed the coastline during their homing 406
migration which may suggest that the coastline was used as a guide for orientating to 407
the river The complex interface between open ocean and up-river migration pose 408
special challenges and salmon may use elements of many orientation systems (Quinn 409
et al 1989 Pascual and Quinn 1991 Olson and Quinn 1993) It is widely accepted 410
that salmon at least partly rely on olfactory information to orientate to their home 411
river (Brannon 1981 Stabell 1982 Quinn 1990) The fact that most of the returning 412
adults were observed on the eastern side in the outer and central part of the fjord 413
where the lowest salinities were measured may suggest that the fish used this side of 414
the fjord because it provided the best conditions to locate and recognise the river At 415
array 3 in the inner part of the fjord the brackish layer covered the entire array and 416
here the returning adults utilized both sides of the fjord 417
Despite finding no correlation between the current direction measured at 3 m 418
depth and migratory pattern at array 3 there was a significant relationship between 419
wind direction and horizontal distribution of salmon when passing this array This 420
may indicate that the salmon distribution was influenced by wind induced spreading 421
of river water across the array The same pattern was observed during the outward 422
post-smolts migration studied in the same fjord in the same year (Davidsen et al 423
2009) 424
Despite the wind induced spreading of river water across the fjord mean 425
migratory speed was always higher than measured current velocities so it seems that 426
salmon had an active swimming behaviour when passing the array 3 In other 427
studies Atlantic salmon have been found to be influenced by the tidal current by 428
19
generally moving with the tide (eg Aprahamian et al 1998) but also to swim with 429
lower ground speed during ebb tide and higher during flood tides (Smith et al 1981) 430
431
SWIMMING DEPTH 432
As salmon approached the estuary they swam closer to the surface Since the 433
brackish water from the river outlet is in the upper part of the water column one 434
explanation for this behaviour may be that they use the brackish water layer to locate 435
and recognise the river (Quinn 1990) The attraction may be due to both the lower 436
salinity level and the river odour Earlier gillnet studies have shown that returning 437
Atlantic salmon usually remain near the surface (1ndash5 m depth) but occasionally make 438
downwards movements in the water column (Stasko et al 1973) Westerberg (1982) 439
and Doslashving et al (1985) reported that Atlantic salmon with acoustic tags moved up 440
and down in the water column in association with fine-scale hydrographic 441
stratification and they both concluded that salmon searched for vertical gradients of 442
odours from the home river rather than horizontal gradients Another reason to 443
migrate closer to the sea surface when approaching the river is to acclimate to the 444
fresh water Quinn (1990) suggested that by migrating in and out of the brackish 445
water layer at the top of the water column in the estuary salmonids can adjust to the 446
salinity of their environment as they make the transition from salt water to freshwater 447
448
TIMING OF RIVER ENTRY 449
Females entered the river in average six days earlier than males which is 450
consistent with findings in other studies (Dahl et al 2004 Niemelauml et al 2006) Dahl 451
et al (2004) suggested that the earlier river entry of female Atlantic salmon may be 452
due to females being older than males when performing their spawning migration 453
20
Several previous studies indicate that older (larger) fish usually arrive earlier than 454
younger (smaller) individuals (Power 1981 Jonsson et al 1990a) However in the 455
present study there were no differences in size or age between the two sexes 456
Changes in river flow did not influence the timing of river entry Increased 457
water discharge appears to be an important proximate factor stimulating adult Atlantic 458
salmon to enter small rivers from the sea (Jonsson et al 2007) However this stimuli 459
may act in combination with other environmental factors such as water temperature 460
light tides and water chemistry (Jonsson 1991 Potter et al 1992 Smith and Smith 461
1997) The fact that no correlation between river flow tidal cycle and river entry was 462
found in this study may be due to the generally large discharge of the River Alta (75ndash463
130 m3 s-1 during the study) In a large river like this it may not be critical for salmon 464
to enter the river at high river flow in order to safely migrate upstream or have the ebb 465
tide to facilitate the recognition of the outflowing fresh water from the home river 466
This is supported by the fact that day-of-the-year day or night time river flow and 467
tidal cycle at the time of river entry in total explained only 14 of the variation 468
between different sizes of the salmon This suggests that parameters other than those 469
included in the analysis may be important for timing of river entry or that timing of 470
river entry in the River Alta simply depends on the time salmon reach the estuary and 471
river mouth If the latter is the case timing of river entry may depend on factors 472
influencing the migration in the outer fjord or open sea 473
It has been suggested that the correlation between increased discharge and the 474
time of river entry in large rivers is not due to the stimulus for Atlantic salmon to 475
enter the river per se but rather that increased freshwater supply to near coastal areas 476
may aid salmon to recognise and find their natal river increasing the number of fish 477
entering fresh water compared to low flow periods (Thorstad et al 2010) In the 478
21
present study there was no correlation between time of river entry and changes in 479
river flow one two and three days before entry However since salmon were tagged 480
and monitored in the last part of the spawning run there may already have been 481
enough freshwater in the fjord system to guide the salmon The observation that river 482
entry not is correlated with river flow in large rivers is also supported by other studies 483
(Dahl et al 2004 Karppinen et al 2004) 484
Adult salmon entered the river during all phases of the tidal cycle It has been 485
suggested that Atlantic salmon entering the river during strong ebb currents may have 486
been attracted by the outward flow of fresh water (Potter et al 1992) However there 487
is little consensus among studies about the relationship between tidal phase and river 488
entry (Potter 1988 Potter et al 1992 Smith and Smith 1997 Karppinen et al 2004) 489
Given the wide variation in the physical chemical and hydrographic characteristics of 490
estuaries this variation in the migratory responses of Atlantic salmon to the tidal 491
cycle is perhaps not surprising (Smith and Smith 1997) In general different sizes 492
forms and shapes of rivers may result in different relationships between Atlantic 493
salmon behaviour and environmental factors 494
The absence of a clear diel pattern in the timing of river mouth passage 495
differed from that observed in a post-smolt study in the River Alta when more post-496
smolts passed the river mouth at night during migration towards the sea (Davidsen et 497
al 2009) Nocturnal migration is thought to be an adaptive behaviour to reduce 498
predation by visual predators like seals (Solomon 1982) and has been observed in 499
several studies of returning Atlantic salmon (eg Potter 1988 Smith and Smith 1997) 500
Even though the northern River Alta is situated on a latitude with midnight sun light 501
intensities were still lower than 20 000 lx at night in contrast to the 50 000ndash200 000 502
lx measured during day time The fact that no difference in the diel migration pattern 503
22
was observed for adult salmon may be because they do not experience the same 504
predation level as the smaller post-smolts 505
506
MIGRATORY SPEEDS 507
The migratory speed slowed as salmon approached the estuary and salmon 508
had a lower migratory speed in the innermost part of the estuary (zone four) than in 509
the open fjord (zone onendashthree) This change in travel rates may be an indication of a 510
physiological need to adapt to the fresh water in the river time to orientate towards 511
the river mouth and to recognise the home river (Hansen and Quinn 1998) or to wait 512
for optimal conditions for upstream migration (Jonsson et al 1990b) The finding of 513
decreasing travel rates when approaching the estuary confirm results from mark and 514
recapture studies (Hansen et al 1993 Hansen and Quinn 1998) 515
516
CONTROL FISH TAGGED THE PRECEDING YEAR 517
The migration behaviour of the eight returning Atlantic salmon in 2008 518
(lsquocontrolrsquo group tagged the year before) did not differ from the newly tagged fish 519
Similar to the newly tagged fish median migratory speed decreased as they 520
approached the inner part of the fjord and the fish migrated close (4ndash5 m) to the 521
surface The migration behaviour seemed therefore not affected by capture handling 522
and tagging This is in accordance with a laboratory study indicating that swimming 523
performance of Atlantic salmon was not affected by transmitters used in the present 524
study (Thorstad et al 2000) To our knowledge this study is first one using multiyear 525
tags to capture the migration behaviour of Atlantic salmon while Welch et al (2011) 526
have used this method on juvenile Pacific salmon 527
528
23
529
ACKNOWLEDGEMENTS 530
This study was financed by the Norwegian Research Council (project no 531
17601S40) the Norwegian Institute for Nature Research the Directorate for Nature 532
Management and the University of Tromsoslash The Norwegian Water Resources and 533
Energy Directorate provided data on the river flow The crew onboard the Research 534
Vessel ldquoJohan Ruudrdquo the staff at Alta Laksefiskeri Interessentselskap (ALI) the local 535
bag net fishermen Amund Suhr Anette Grimsrud Davidsen Cedar Chittenden and 536
Jenny Jensen are all thanked for their extensive help during the field work and Gunnel 537
Oslashstborg for scale analyses Helge Meissner is thanked for assistance with genotyping 538
and Svein-Erik Fevolden and Anne K Praeligbel for valuable discussions concerning the 539
genetics Timothy Sheehan and two anonymous referees are thanked for their valuable 540
comments on an earlier version of the manuscript The experimental procedures 541
concur with the national ethical requirements and were approved by the Norwegian 542
National Animal Research Authority 543
544
24
545
REFERENCES 546
547
Alabaster JS Gough PJ and Brooker WJ 1991 The environmental requirements 548
of Atlantic salmon Salmo salar L during their passage through the Thames 549
estuary 1982-89 J Fish Biol 38 741-762 550
Aprahamian MW Jones GO and Gough PJ 1998 Movement of adult Atlantic 551
salmon in the Usk estuary Wales J Fish Biol 53 221-225 552
Banks JW 1969 A review of the litterature on the upstream migration of adult 553
salmonids J Fish Biol 1 85-136 554
Bates D and Maechler M (2010) Package ldquolme4rdquo Reference manual for the 555
package Available at httpcranr-projectorgwebpackageslme4lme4pdf 556
(Assessed 22062012) 557
Brannon EL 1981 Orientation mechanisms of homing salmonids In Salmon and 558
trout migratory behaviour symposium Edited by EL Brannon and EO Salo 559
University of Washington Seattle pp 219-227 560
Cooke SJ Iverson SJ Stokesbury MJW Hinch SG Fisk AT Smith P 561
VanderZwaag D Brattey J and Whoriskey F 2011 Ocean Tracking 562
Network Canada A network approach to addressing critical issues in fisheries 563
and resource management with implications for ocean governance Fisheries 564
36 583-592 565
Dahl J Dannewitz J Karlsson L Petersson E Loumlf A and Ragnarsson B 2004 566
The timing of spawning migration implications of environmental variation 567
life history and sex Can J Zool 82 1864-1870 568
25
Davidsen JG Rikardsen AH Halttunen E Thorstad EB Oslashkland F Letcher 569
BH Skarethhamar J and Naeligsje TF 2009 Migratory behaviour and survival 570
rates of wild northern Atlantic salmon (Salmo salar) post-smolts effects of 571
environmental factors J Fish Biol 75 1700-1718 572
Doslashving KB Westergaringrd H and Johnsen PB 1985 Role of olfaction in the 573
behavioural and neuronal responses of Atlantic salmon Salmo salar to 574
hydrographic stratification Can J Fish Aquat Sci 42 1658-1667 575
Fiske P Lund RA and Hansen LP 2005 Identifying fish farm escapees In Stock 576
identification methods Edited by SX Cadrin KD Friedland and JD 577
Waldman Elsevier Academic Press Amsterdam pp 659-680 578
Halttunen E Rikardsen AH Davidsen JG Thorstad EB and Dempson JB 579
2009 Survival migration speed and swimming depth of Atlantic salmon kelts 580
during sea entry and fjord migration In Tagging and tracking of Marine 581
Animals with Electronic Devices Reviews Methods and Technologies in Fish 582
Biology and Fisheries 9 Edited by JL Nielsen H Arrizabalaga N Fragoso 583
A Hobday M Lutcavage and J Sibert Springer Dordrecht pp 35-49 584
Hansen LP Jonsson N and Jonsson B 1993 Oceanic migration in homing 585
Atlantic salmon Anim Behav 45 927-941 586
Hansen LP and Quinn TP 1998 The marine phase of the Atlantic salmon (Salmo 587
salar) life cycle with comparisons to pacific salmon Can J Fish Aquat Sci 588
55 104-118 589
Heggberget TG Oslashkland F and Ugedal O 1993 Distribution and migratory 590
behaviour of adult wild and farmed Atlantic salmon (Salmo salar) during 591
return migration Aquaculture 118 73-83 592
ICES (2011) Report of the Working Group on North Atlantic Salmon (WGNAS) 593
26
ICES 2011ACOM09 286 pp Available at 594
httpwwwicesdkreportsACOM2011WGNASwgnas_2011_finalpdf 595
(Assessed 22062012) 596
Jonsson B Jonsson N and Hansen LP 1990a Does juvenile experience affect 597
migration and spawning of adult Atlantic salmon Behav Ecol Sociobiol 26 598
225-230 599
Jonsson B Jonsson N and Hansen LP 2007 Factors affecting river entry of adult 600
Atlantic salmon in a small river J Fish Biol 71 943-956 601
Jonsson N 1991 Influence of water flow water temperature and light on fish 602
migration in rivers Nord J Freshwat Res 66 20-35 603
Jonsson N Jonsson B and Hansen LP 1990b Partial segregation in the timing of 604
migration of Atlantic salmon of different ages Anim Behav 40 313-321 605
Karppinen P Erkinaro J Niemelauml E Moen K and Oslashkland F 2004 Return 606
migration of one-sea-winter Atlantic salmon in the River Tana J Fish Biol 607
64 1179-1192 608
Lacroix GL and Voegeli FA 2000 Development of automated monitoring 609
systems for ultrasonic transmitters In Fish Telemetry Proceedings of the 3rd 610
Conference on Fish Telemetry in Europe Edited by A Moore and IC 611
Russell CEFAS Lowestoft UK pp 37-50 612
Legendre P and Legendre L 1998 Numerical ecology p 853 Elsevier Science BV 613
Amsterdam 614
Lund RA and Hansen LP 1991 Identification of wild and reared Atlantic salmon 615
Salmo salar L using scale characters Aquacult Fish Manage 22 499-508 616
Niemelauml E Orell P Erkinaro J Dempson J Broslashrs S Svenning M and 617
Hassinen E 2006 Previously spawned Atlantic salmon ascend a large 618
27
subarctic river earlier than their maiden counterparts J Fish Biol 69 1151ndash619
1163 620
Olson AF and Quinn TP 1993 Vertical and horizontal movements of adult 621
chinook salmon Oncorhynchus tshawytscha in the Columbia River estuary 622
Fishery Bulletin of the Fish and Wildlife Service 91 171-178 623
Parrish DL Behnke RJ Gephard SR McCormick SD and Reeves GH 1998 624
Why arenrsquot there more Atlantic salmon (Salmo salar) Can J Fish Aquat 625
Sci 55 281-287 626
Pascual MA and Quinn TP 1991 Evaluation of alternative models of the coastal 627
migration of adult Fraser River sockeye salmon (Oncorhynchus nerka) Can J 628
Fish Aquat Sci 48 799-810 629
Pierce GJ Boyle PR and Thompson PM 1990 Diet selection by seals In 630
Trophic Relationships in the Marine Environment Edited by M Barnes and 631
RN Gibson Aberdeen University Press Aberdeen pp 222-238 632
Potter ECE 1988 Movements of Atlantic salmon Salmo salar L in an estuary in 633
south-west England J Fish Biol 33 153-159 634
Potter ECE Solomon DJ and Buckley AA 1992 Estuarine movements of adult 635
Atlantic salmon (Salmo salar L) in Christchurch Harbour southern England 636
In Wildlife telemetry remote monitoring and tracking of animals Edited by 637
IG Priede and SM Swift Ellis Horwood Limited Chichester England pp 638
400-409 639
Power G 1981 Stock Characteristics and Catches of Atlantic Salmon (Salmo salar) 640
in Quebec and Newfoundland and Labrador in Relation to Environmental 641
Variables Can J Fish Aquat Sci 38 1601-1611 642
28
Quinn TP 1990 Current controversies in the study of salmon homing Ethol Ecol 643
Evol 2(1) 49-63 644
Quinn TP Terahart BA and Groot C 1989 Migratory orientation and vertical 645
movements of homing adult sockeye salmon Oncorhynchus nerka in coastal 646
waters Anim Behav 37 587-599 647
Smith GW 1990 The relationship between river flow and net catches of salmon 648
(Salmo salar L) in and around the mouth of the Aberdeenshire Dee between 649
1973 and 1986 Fish Res 10 73-91 650
Smith GW Hawkins AD Urquhart GG and Shearer WM 1981 Orientation 651
and energetic efficiency in the offshore movements of returning Atlantic 652
salmon Salmo salar L Scott Fish Res Rep 21 1-22 653
Smith IP and Smith GW 1997 Tidal and diel timing of river entry by adult 654
Atlantic salmon returning to the Aberdeenshire Dee Scotland J Fish Biol 50 655
463-474 656
Solomon DJ 1982 Smolt migration in Atlantic salmon (Salmo salar L) and sea 657
trout (Salmo trutta L) In Salmon and trout migratory behavior symposium 658
Edited by EL Brannon and EO Salo University of Washington Seattle pp 659
196-203 660
Stabell OB 1982 Homing of Atlantic salmon in relation to olfaction and genetics In 661
Salmon and trout migratory behaviour symposium Edited by EL Brannon 662
and EO Salo University of Washington Seattle pp 238-246 663
Stasko AB Sutterlin AM Rommel SAj and Elson PF 1973 Migration-664
orientation of Atlantic salmon (Salmo salar L) In International Atlantic 665
Salmon Symposium Special Publication Series Edited by MW Smith and 666
29
WM Carter International Atlantic Salmon Foundation New York pp 119-667
137 668
Svendsen H 1995 Physical oceanography of coupled fjord-coast systems in northern 669
Norway with special focus on frontal dynamics and tides In Ecology of fjords 670
and coastal waters Edited by HR Skjoldal C Hopkins KJ Erikstad and 671
HP Leinaas Elsevier Science Publ B V Amsterdam pp 149-164 672
Thorstad EB Heggberget TG and Oslashkland F 1998 Migratory behaviour of adult 673
wild and escaped farmed Atlantic salmon Salmo salar L before during and 674
after spawning in a Norwegian river Aquacult Res 29 419-428 675
Thorstad EB Whoriskey F Uglem I Moore A Rikardsen AH and Finstad B 676
2012 A critical life stage of the Atlantic salmon Salmo salar behaviour and 677
survival during the smolt and initial post-smolt migration J Fish Biol 81 678
500-542 679
Thorstad EB Whoriskey FG Rikardsen AH and Aarestrup K 2010 Aquatic 680
nomads the life and migrations of the Atlantic salmon In Atlantic Salmon 681
Ecology Edited by Oslash Aas S Einum A Klemetsen and J Skurdal Wiley-682
Blackwell New York pp 1-32 683
Thorstad EB Oslashkland F Aarestrup K and Heggberget TG 2008 Factors 684
affecting the within-river spawning migration of Atlantic salmon with 685
emphasis on human impacts Rev Fish Biol Fish 18 345-371 686
Thorstad EB Oslashkland F and Finstad B 2000 Effects of telemetry transmitters on 687
swimming performance of adult Atlantic salmon J Fish Biol 57 531-535 688
Treacutepanier S Rodriacuteguez MA and Magnan P 1996 Spawning migrations in 689
landlocked Atlantic salmon time series modelling of river discharge and water 690
temperature effects J Fish Biol 48 925-936 691
30
Ugedal O Naeligsje TF Thorstad EB Forseth T Saksgaringrd L and Heggberget 692
TG 2008 Twenty years of hydropower regulation in the River Alta long 693
term changes in abundance of juvenile and adult Atlantic salmon 694
Hydrobiologia 609 9-23 695
Welch DW Melnychuk MC Payne JC Rechisky EL Porter AD Jackson 696
GD Ward BR Vincent SP Wood CC and Semmens J 2011 In situ 697
Measurement of Coastal Ocean Movements and Survival of Juvenile Pacific 698
Salmon Proc Natl Acad Sci USA 108 8708-8713 699
Westerberg H 1982 Ultrasonic tracking of Atlantic salmon (Salmo salar L) ndash II 700
Swimming depth and temperature stratification Rep Inst Fresh Res 701
Drottningholm 60 102-120 702
1
TABLES 1
Table 1 Mean swimming depth registered at the time Atlantic salmon (Salmo salar) passed 2
the array 2ndash5 in the Alta Fjord Mean values are based on individual means Welchrsquos t-test 3
was used to test for significant difference between male and female swimming depth 4
5
ALS
Array
n
Mean
(m)
SD individual
mean (range)
(m)
Deepest
individual
recording
(m)
Mean
depth
females
(m)
Mean
depth
males
(m)
p-value
(between
sexes)
2 23 24 37 (00ndash161) 297 26 18 057
3 24 11 15 (00ndash64) 189 09 14 036
4 18 15 19 (00ndash67) 109 14 17 075
5 21 05 07 (00ndash18) 146 04 09 018
2
Table 2 Comparisons of the number and proportions of homing Atlantic salmon (Salmo 6
salar) entering the river during 1) different stages of the tidal cycle and 2) for different 7
combinations of day and night and different stages of the tidal cycle Chi-square-tests were 8
used to test for differences between different stages of the tidal cycle and between the 9
different combinations of day and night and different stages of the tidal cycle 10
11
Number
(n =56) P-value
High tide 15 27
Ebbing tide 13 23
Low tide 9 16
Flooding tide 19 34 029
High tide day time 7 13
High tide night time 8 14
Ebbing tide day time 7 13
Ebbing tide night time 6 11
Low tide day time 5 9
Low tide night time 4 7
Flooding tide day time 11 20
Flooding tide night time 8 14 071
12
3
Table 3 Results from a redundancy analysis (RDA) exploring whether timing of river entry 13
(day-of-the-year day or night river flow tidal cycle) of Atlantic salmon (Salmo salar) 14
depended on fork length or body mass The proportion of constrained and unconstrained 15
inertia (the sum of the variance from all included parameters) from total inertia was 16
calculated which in RDA gives the proportion of variance 17
18
19
Inertia Proportion
Total 20000 10000
Constrained 02846 01423
Unconstrained 17154 08577
0
N
5
km RiverAlta
Alta Fjord
70deg30deg20deg
65deg
Norway Sweden
Finland
1
2
34
5
Z 1Z 1 Z 2Z 2
Z 3Z 3Z 4Z 47 6
10
11
12
13
14
15
16
40
50
60
70
80
90
100
110
120
130
140
57 127 197 267 28
Tem
pera
ture
(degC
)
Riv
er fl
ow (m
3 s-1
)
Date 2007
0 7 0 7 1 0 0 7 1 3 0 7 1 6 0 7 1 9 0 7 2 2 0 7 2 5 0 7 - 1 0
- 5
0
5
1 0
1 5
2 0
0 7 0 7 1 0 0 7 1 3 0 7 1 6 0 7 1 9 0 7 2 2 0 7 2 5 0 7 - 1 0
- 5
0
5
1 0
1 5
2 0
Cur
rent
vel
ocity
com
pone
nt (c
m s-1
) C
urre
nt v
eloc
ity c
ompo
nent
(cm
s-1
)
Date 2007
12
34
00 05 10 15 20
Fjord zone (year 2007)
Migratory speed (bl sminus1)
AB
C
00 05 10 15 20
Fjord zone (year 2008)
Migratory speed (bl sminus1)
1
FIGURE CAPTIONS 1
2
Figure 1 Map of the lower part of River Alta and the Alta Fjord showing the position 3
of the bag nets ( ) and the release sites ( ) ALS array 1 is indicated with () while 4
ALS arrays 2ndash5 are indicated by grey and black lines Most fish passed these ALSs in the 5
darker parts of the lines The two ALSs in the river mouth (array 6) and the three ALSs 6
(array 7) in the river are given by () The map also shows the position of the two current 7
meters in ALS array 3 ( ) the four zones (Z1ndash4) and the weather station () In the 8
following year (2008) were only array 1 3 5 and 6 present 9
10
11
Figure 2 Daily river flow (- - - - -) and water temperature (___) in the River Alta 12
13
14
Figure 3 Salinity distribution recorded at 0ndash12 m depth across ALS array 2 (a amp c) and ALS 15
array 3 (b amp d) in the Alta Fjord on 6 July (a amp b) and 13 July (c amp d) 2007 16
17
18
Figure 4 Current velocity components at 3 m depth at the north-eastern (upper panel) and 19
south-western (lower panel) side of the Alta Fjord at the ALS array 3 Positive values are 20
towards the fjord head and negative values are towards the fjord mouth indicates time of 21
individual Atlantic salmon (Salmo salar) passage 22
23
2
Figure 5 Migratory speeds of homing Atlantic salmon (Salmo salar) in the Alta Fjord in 2007 24
and 2008 In 2007 the fjord was divided into four zones (see map Fig 1) In 2008 zone A 25
was the area from ALS1ndash3 zone B from ALS3ndash5 and zone C from ALS5ndash6 The box-26
and-whisker plots give the median values (black lines) the interquartile ranges (box 50 of 27
the data falling into this) and the 5th and 95th percentiles (whiskers) 28
29
- cjfas-2012-0352-final1
-
- Homing behaviour of Atlantic salmon (Salmo salar) during final phase of marine migration and river entry
-
- Table 1-3
- Figure 1
- Figure 2
-
- Slide Number 1
-
- Figure 3
-
- Slide Number 1
-
- Figure 4
-
- Slide Number 1
-
- Figure 5
- FIGURE CAPTIONS
-

19
generally moving with the tide (eg Aprahamian et al 1998) but also to swim with 429
lower ground speed during ebb tide and higher during flood tides (Smith et al 1981) 430
431
SWIMMING DEPTH 432
As salmon approached the estuary they swam closer to the surface Since the 433
brackish water from the river outlet is in the upper part of the water column one 434
explanation for this behaviour may be that they use the brackish water layer to locate 435
and recognise the river (Quinn 1990) The attraction may be due to both the lower 436
salinity level and the river odour Earlier gillnet studies have shown that returning 437
Atlantic salmon usually remain near the surface (1ndash5 m depth) but occasionally make 438
downwards movements in the water column (Stasko et al 1973) Westerberg (1982) 439
and Doslashving et al (1985) reported that Atlantic salmon with acoustic tags moved up 440
and down in the water column in association with fine-scale hydrographic 441
stratification and they both concluded that salmon searched for vertical gradients of 442
odours from the home river rather than horizontal gradients Another reason to 443
migrate closer to the sea surface when approaching the river is to acclimate to the 444
fresh water Quinn (1990) suggested that by migrating in and out of the brackish 445
water layer at the top of the water column in the estuary salmonids can adjust to the 446
salinity of their environment as they make the transition from salt water to freshwater 447
448
TIMING OF RIVER ENTRY 449
Females entered the river in average six days earlier than males which is 450
consistent with findings in other studies (Dahl et al 2004 Niemelauml et al 2006) Dahl 451
et al (2004) suggested that the earlier river entry of female Atlantic salmon may be 452
due to females being older than males when performing their spawning migration 453
20
Several previous studies indicate that older (larger) fish usually arrive earlier than 454
younger (smaller) individuals (Power 1981 Jonsson et al 1990a) However in the 455
present study there were no differences in size or age between the two sexes 456
Changes in river flow did not influence the timing of river entry Increased 457
water discharge appears to be an important proximate factor stimulating adult Atlantic 458
salmon to enter small rivers from the sea (Jonsson et al 2007) However this stimuli 459
may act in combination with other environmental factors such as water temperature 460
light tides and water chemistry (Jonsson 1991 Potter et al 1992 Smith and Smith 461
1997) The fact that no correlation between river flow tidal cycle and river entry was 462
found in this study may be due to the generally large discharge of the River Alta (75ndash463
130 m3 s-1 during the study) In a large river like this it may not be critical for salmon 464
to enter the river at high river flow in order to safely migrate upstream or have the ebb 465
tide to facilitate the recognition of the outflowing fresh water from the home river 466
This is supported by the fact that day-of-the-year day or night time river flow and 467
tidal cycle at the time of river entry in total explained only 14 of the variation 468
between different sizes of the salmon This suggests that parameters other than those 469
included in the analysis may be important for timing of river entry or that timing of 470
river entry in the River Alta simply depends on the time salmon reach the estuary and 471
river mouth If the latter is the case timing of river entry may depend on factors 472
influencing the migration in the outer fjord or open sea 473
It has been suggested that the correlation between increased discharge and the 474
time of river entry in large rivers is not due to the stimulus for Atlantic salmon to 475
enter the river per se but rather that increased freshwater supply to near coastal areas 476
may aid salmon to recognise and find their natal river increasing the number of fish 477
entering fresh water compared to low flow periods (Thorstad et al 2010) In the 478
21
present study there was no correlation between time of river entry and changes in 479
river flow one two and three days before entry However since salmon were tagged 480
and monitored in the last part of the spawning run there may already have been 481
enough freshwater in the fjord system to guide the salmon The observation that river 482
entry not is correlated with river flow in large rivers is also supported by other studies 483
(Dahl et al 2004 Karppinen et al 2004) 484
Adult salmon entered the river during all phases of the tidal cycle It has been 485
suggested that Atlantic salmon entering the river during strong ebb currents may have 486
been attracted by the outward flow of fresh water (Potter et al 1992) However there 487
is little consensus among studies about the relationship between tidal phase and river 488
entry (Potter 1988 Potter et al 1992 Smith and Smith 1997 Karppinen et al 2004) 489
Given the wide variation in the physical chemical and hydrographic characteristics of 490
estuaries this variation in the migratory responses of Atlantic salmon to the tidal 491
cycle is perhaps not surprising (Smith and Smith 1997) In general different sizes 492
forms and shapes of rivers may result in different relationships between Atlantic 493
salmon behaviour and environmental factors 494
The absence of a clear diel pattern in the timing of river mouth passage 495
differed from that observed in a post-smolt study in the River Alta when more post-496
smolts passed the river mouth at night during migration towards the sea (Davidsen et 497
al 2009) Nocturnal migration is thought to be an adaptive behaviour to reduce 498
predation by visual predators like seals (Solomon 1982) and has been observed in 499
several studies of returning Atlantic salmon (eg Potter 1988 Smith and Smith 1997) 500
Even though the northern River Alta is situated on a latitude with midnight sun light 501
intensities were still lower than 20 000 lx at night in contrast to the 50 000ndash200 000 502
lx measured during day time The fact that no difference in the diel migration pattern 503
22
was observed for adult salmon may be because they do not experience the same 504
predation level as the smaller post-smolts 505
506
MIGRATORY SPEEDS 507
The migratory speed slowed as salmon approached the estuary and salmon 508
had a lower migratory speed in the innermost part of the estuary (zone four) than in 509
the open fjord (zone onendashthree) This change in travel rates may be an indication of a 510
physiological need to adapt to the fresh water in the river time to orientate towards 511
the river mouth and to recognise the home river (Hansen and Quinn 1998) or to wait 512
for optimal conditions for upstream migration (Jonsson et al 1990b) The finding of 513
decreasing travel rates when approaching the estuary confirm results from mark and 514
recapture studies (Hansen et al 1993 Hansen and Quinn 1998) 515
516
CONTROL FISH TAGGED THE PRECEDING YEAR 517
The migration behaviour of the eight returning Atlantic salmon in 2008 518
(lsquocontrolrsquo group tagged the year before) did not differ from the newly tagged fish 519
Similar to the newly tagged fish median migratory speed decreased as they 520
approached the inner part of the fjord and the fish migrated close (4ndash5 m) to the 521
surface The migration behaviour seemed therefore not affected by capture handling 522
and tagging This is in accordance with a laboratory study indicating that swimming 523
performance of Atlantic salmon was not affected by transmitters used in the present 524
study (Thorstad et al 2000) To our knowledge this study is first one using multiyear 525
tags to capture the migration behaviour of Atlantic salmon while Welch et al (2011) 526
have used this method on juvenile Pacific salmon 527
528
23
529
ACKNOWLEDGEMENTS 530
This study was financed by the Norwegian Research Council (project no 531
17601S40) the Norwegian Institute for Nature Research the Directorate for Nature 532
Management and the University of Tromsoslash The Norwegian Water Resources and 533
Energy Directorate provided data on the river flow The crew onboard the Research 534
Vessel ldquoJohan Ruudrdquo the staff at Alta Laksefiskeri Interessentselskap (ALI) the local 535
bag net fishermen Amund Suhr Anette Grimsrud Davidsen Cedar Chittenden and 536
Jenny Jensen are all thanked for their extensive help during the field work and Gunnel 537
Oslashstborg for scale analyses Helge Meissner is thanked for assistance with genotyping 538
and Svein-Erik Fevolden and Anne K Praeligbel for valuable discussions concerning the 539
genetics Timothy Sheehan and two anonymous referees are thanked for their valuable 540
comments on an earlier version of the manuscript The experimental procedures 541
concur with the national ethical requirements and were approved by the Norwegian 542
National Animal Research Authority 543
544
24
545
REFERENCES 546
547
Alabaster JS Gough PJ and Brooker WJ 1991 The environmental requirements 548
of Atlantic salmon Salmo salar L during their passage through the Thames 549
estuary 1982-89 J Fish Biol 38 741-762 550
Aprahamian MW Jones GO and Gough PJ 1998 Movement of adult Atlantic 551
salmon in the Usk estuary Wales J Fish Biol 53 221-225 552
Banks JW 1969 A review of the litterature on the upstream migration of adult 553
salmonids J Fish Biol 1 85-136 554
Bates D and Maechler M (2010) Package ldquolme4rdquo Reference manual for the 555
package Available at httpcranr-projectorgwebpackageslme4lme4pdf 556
(Assessed 22062012) 557
Brannon EL 1981 Orientation mechanisms of homing salmonids In Salmon and 558
trout migratory behaviour symposium Edited by EL Brannon and EO Salo 559
University of Washington Seattle pp 219-227 560
Cooke SJ Iverson SJ Stokesbury MJW Hinch SG Fisk AT Smith P 561
VanderZwaag D Brattey J and Whoriskey F 2011 Ocean Tracking 562
Network Canada A network approach to addressing critical issues in fisheries 563
and resource management with implications for ocean governance Fisheries 564
36 583-592 565
Dahl J Dannewitz J Karlsson L Petersson E Loumlf A and Ragnarsson B 2004 566
The timing of spawning migration implications of environmental variation 567
life history and sex Can J Zool 82 1864-1870 568
25
Davidsen JG Rikardsen AH Halttunen E Thorstad EB Oslashkland F Letcher 569
BH Skarethhamar J and Naeligsje TF 2009 Migratory behaviour and survival 570
rates of wild northern Atlantic salmon (Salmo salar) post-smolts effects of 571
environmental factors J Fish Biol 75 1700-1718 572
Doslashving KB Westergaringrd H and Johnsen PB 1985 Role of olfaction in the 573
behavioural and neuronal responses of Atlantic salmon Salmo salar to 574
hydrographic stratification Can J Fish Aquat Sci 42 1658-1667 575
Fiske P Lund RA and Hansen LP 2005 Identifying fish farm escapees In Stock 576
identification methods Edited by SX Cadrin KD Friedland and JD 577
Waldman Elsevier Academic Press Amsterdam pp 659-680 578
Halttunen E Rikardsen AH Davidsen JG Thorstad EB and Dempson JB 579
2009 Survival migration speed and swimming depth of Atlantic salmon kelts 580
during sea entry and fjord migration In Tagging and tracking of Marine 581
Animals with Electronic Devices Reviews Methods and Technologies in Fish 582
Biology and Fisheries 9 Edited by JL Nielsen H Arrizabalaga N Fragoso 583
A Hobday M Lutcavage and J Sibert Springer Dordrecht pp 35-49 584
Hansen LP Jonsson N and Jonsson B 1993 Oceanic migration in homing 585
Atlantic salmon Anim Behav 45 927-941 586
Hansen LP and Quinn TP 1998 The marine phase of the Atlantic salmon (Salmo 587
salar) life cycle with comparisons to pacific salmon Can J Fish Aquat Sci 588
55 104-118 589
Heggberget TG Oslashkland F and Ugedal O 1993 Distribution and migratory 590
behaviour of adult wild and farmed Atlantic salmon (Salmo salar) during 591
return migration Aquaculture 118 73-83 592
ICES (2011) Report of the Working Group on North Atlantic Salmon (WGNAS) 593
26
ICES 2011ACOM09 286 pp Available at 594
httpwwwicesdkreportsACOM2011WGNASwgnas_2011_finalpdf 595
(Assessed 22062012) 596
Jonsson B Jonsson N and Hansen LP 1990a Does juvenile experience affect 597
migration and spawning of adult Atlantic salmon Behav Ecol Sociobiol 26 598
225-230 599
Jonsson B Jonsson N and Hansen LP 2007 Factors affecting river entry of adult 600
Atlantic salmon in a small river J Fish Biol 71 943-956 601
Jonsson N 1991 Influence of water flow water temperature and light on fish 602
migration in rivers Nord J Freshwat Res 66 20-35 603
Jonsson N Jonsson B and Hansen LP 1990b Partial segregation in the timing of 604
migration of Atlantic salmon of different ages Anim Behav 40 313-321 605
Karppinen P Erkinaro J Niemelauml E Moen K and Oslashkland F 2004 Return 606
migration of one-sea-winter Atlantic salmon in the River Tana J Fish Biol 607
64 1179-1192 608
Lacroix GL and Voegeli FA 2000 Development of automated monitoring 609
systems for ultrasonic transmitters In Fish Telemetry Proceedings of the 3rd 610
Conference on Fish Telemetry in Europe Edited by A Moore and IC 611
Russell CEFAS Lowestoft UK pp 37-50 612
Legendre P and Legendre L 1998 Numerical ecology p 853 Elsevier Science BV 613
Amsterdam 614
Lund RA and Hansen LP 1991 Identification of wild and reared Atlantic salmon 615
Salmo salar L using scale characters Aquacult Fish Manage 22 499-508 616
Niemelauml E Orell P Erkinaro J Dempson J Broslashrs S Svenning M and 617
Hassinen E 2006 Previously spawned Atlantic salmon ascend a large 618
27
subarctic river earlier than their maiden counterparts J Fish Biol 69 1151ndash619
1163 620
Olson AF and Quinn TP 1993 Vertical and horizontal movements of adult 621
chinook salmon Oncorhynchus tshawytscha in the Columbia River estuary 622
Fishery Bulletin of the Fish and Wildlife Service 91 171-178 623
Parrish DL Behnke RJ Gephard SR McCormick SD and Reeves GH 1998 624
Why arenrsquot there more Atlantic salmon (Salmo salar) Can J Fish Aquat 625
Sci 55 281-287 626
Pascual MA and Quinn TP 1991 Evaluation of alternative models of the coastal 627
migration of adult Fraser River sockeye salmon (Oncorhynchus nerka) Can J 628
Fish Aquat Sci 48 799-810 629
Pierce GJ Boyle PR and Thompson PM 1990 Diet selection by seals In 630
Trophic Relationships in the Marine Environment Edited by M Barnes and 631
RN Gibson Aberdeen University Press Aberdeen pp 222-238 632
Potter ECE 1988 Movements of Atlantic salmon Salmo salar L in an estuary in 633
south-west England J Fish Biol 33 153-159 634
Potter ECE Solomon DJ and Buckley AA 1992 Estuarine movements of adult 635
Atlantic salmon (Salmo salar L) in Christchurch Harbour southern England 636
In Wildlife telemetry remote monitoring and tracking of animals Edited by 637
IG Priede and SM Swift Ellis Horwood Limited Chichester England pp 638
400-409 639
Power G 1981 Stock Characteristics and Catches of Atlantic Salmon (Salmo salar) 640
in Quebec and Newfoundland and Labrador in Relation to Environmental 641
Variables Can J Fish Aquat Sci 38 1601-1611 642
28
Quinn TP 1990 Current controversies in the study of salmon homing Ethol Ecol 643
Evol 2(1) 49-63 644
Quinn TP Terahart BA and Groot C 1989 Migratory orientation and vertical 645
movements of homing adult sockeye salmon Oncorhynchus nerka in coastal 646
waters Anim Behav 37 587-599 647
Smith GW 1990 The relationship between river flow and net catches of salmon 648
(Salmo salar L) in and around the mouth of the Aberdeenshire Dee between 649
1973 and 1986 Fish Res 10 73-91 650
Smith GW Hawkins AD Urquhart GG and Shearer WM 1981 Orientation 651
and energetic efficiency in the offshore movements of returning Atlantic 652
salmon Salmo salar L Scott Fish Res Rep 21 1-22 653
Smith IP and Smith GW 1997 Tidal and diel timing of river entry by adult 654
Atlantic salmon returning to the Aberdeenshire Dee Scotland J Fish Biol 50 655
463-474 656
Solomon DJ 1982 Smolt migration in Atlantic salmon (Salmo salar L) and sea 657
trout (Salmo trutta L) In Salmon and trout migratory behavior symposium 658
Edited by EL Brannon and EO Salo University of Washington Seattle pp 659
196-203 660
Stabell OB 1982 Homing of Atlantic salmon in relation to olfaction and genetics In 661
Salmon and trout migratory behaviour symposium Edited by EL Brannon 662
and EO Salo University of Washington Seattle pp 238-246 663
Stasko AB Sutterlin AM Rommel SAj and Elson PF 1973 Migration-664
orientation of Atlantic salmon (Salmo salar L) In International Atlantic 665
Salmon Symposium Special Publication Series Edited by MW Smith and 666
29
WM Carter International Atlantic Salmon Foundation New York pp 119-667
137 668
Svendsen H 1995 Physical oceanography of coupled fjord-coast systems in northern 669
Norway with special focus on frontal dynamics and tides In Ecology of fjords 670
and coastal waters Edited by HR Skjoldal C Hopkins KJ Erikstad and 671
HP Leinaas Elsevier Science Publ B V Amsterdam pp 149-164 672
Thorstad EB Heggberget TG and Oslashkland F 1998 Migratory behaviour of adult 673
wild and escaped farmed Atlantic salmon Salmo salar L before during and 674
after spawning in a Norwegian river Aquacult Res 29 419-428 675
Thorstad EB Whoriskey F Uglem I Moore A Rikardsen AH and Finstad B 676
2012 A critical life stage of the Atlantic salmon Salmo salar behaviour and 677
survival during the smolt and initial post-smolt migration J Fish Biol 81 678
500-542 679
Thorstad EB Whoriskey FG Rikardsen AH and Aarestrup K 2010 Aquatic 680
nomads the life and migrations of the Atlantic salmon In Atlantic Salmon 681
Ecology Edited by Oslash Aas S Einum A Klemetsen and J Skurdal Wiley-682
Blackwell New York pp 1-32 683
Thorstad EB Oslashkland F Aarestrup K and Heggberget TG 2008 Factors 684
affecting the within-river spawning migration of Atlantic salmon with 685
emphasis on human impacts Rev Fish Biol Fish 18 345-371 686
Thorstad EB Oslashkland F and Finstad B 2000 Effects of telemetry transmitters on 687
swimming performance of adult Atlantic salmon J Fish Biol 57 531-535 688
Treacutepanier S Rodriacuteguez MA and Magnan P 1996 Spawning migrations in 689
landlocked Atlantic salmon time series modelling of river discharge and water 690
temperature effects J Fish Biol 48 925-936 691
30
Ugedal O Naeligsje TF Thorstad EB Forseth T Saksgaringrd L and Heggberget 692
TG 2008 Twenty years of hydropower regulation in the River Alta long 693
term changes in abundance of juvenile and adult Atlantic salmon 694
Hydrobiologia 609 9-23 695
Welch DW Melnychuk MC Payne JC Rechisky EL Porter AD Jackson 696
GD Ward BR Vincent SP Wood CC and Semmens J 2011 In situ 697
Measurement of Coastal Ocean Movements and Survival of Juvenile Pacific 698
Salmon Proc Natl Acad Sci USA 108 8708-8713 699
Westerberg H 1982 Ultrasonic tracking of Atlantic salmon (Salmo salar L) ndash II 700
Swimming depth and temperature stratification Rep Inst Fresh Res 701
Drottningholm 60 102-120 702
1
TABLES 1
Table 1 Mean swimming depth registered at the time Atlantic salmon (Salmo salar) passed 2
the array 2ndash5 in the Alta Fjord Mean values are based on individual means Welchrsquos t-test 3
was used to test for significant difference between male and female swimming depth 4
5
ALS
Array
n
Mean
(m)
SD individual
mean (range)
(m)
Deepest
individual
recording
(m)
Mean
depth
females
(m)
Mean
depth
males
(m)
p-value
(between
sexes)
2 23 24 37 (00ndash161) 297 26 18 057
3 24 11 15 (00ndash64) 189 09 14 036
4 18 15 19 (00ndash67) 109 14 17 075
5 21 05 07 (00ndash18) 146 04 09 018
2
Table 2 Comparisons of the number and proportions of homing Atlantic salmon (Salmo 6
salar) entering the river during 1) different stages of the tidal cycle and 2) for different 7
combinations of day and night and different stages of the tidal cycle Chi-square-tests were 8
used to test for differences between different stages of the tidal cycle and between the 9
different combinations of day and night and different stages of the tidal cycle 10
11
Number
(n =56) P-value
High tide 15 27
Ebbing tide 13 23
Low tide 9 16
Flooding tide 19 34 029
High tide day time 7 13
High tide night time 8 14
Ebbing tide day time 7 13
Ebbing tide night time 6 11
Low tide day time 5 9
Low tide night time 4 7
Flooding tide day time 11 20
Flooding tide night time 8 14 071
12
3
Table 3 Results from a redundancy analysis (RDA) exploring whether timing of river entry 13
(day-of-the-year day or night river flow tidal cycle) of Atlantic salmon (Salmo salar) 14
depended on fork length or body mass The proportion of constrained and unconstrained 15
inertia (the sum of the variance from all included parameters) from total inertia was 16
calculated which in RDA gives the proportion of variance 17
18
19
Inertia Proportion
Total 20000 10000
Constrained 02846 01423
Unconstrained 17154 08577
0
N
5
km RiverAlta
Alta Fjord
70deg30deg20deg
65deg
Norway Sweden
Finland
1
2
34
5
Z 1Z 1 Z 2Z 2
Z 3Z 3Z 4Z 47 6
10
11
12
13
14
15
16
40
50
60
70
80
90
100
110
120
130
140
57 127 197 267 28
Tem
pera
ture
(degC
)
Riv
er fl
ow (m
3 s-1
)
Date 2007
0 7 0 7 1 0 0 7 1 3 0 7 1 6 0 7 1 9 0 7 2 2 0 7 2 5 0 7 - 1 0
- 5
0
5
1 0
1 5
2 0
0 7 0 7 1 0 0 7 1 3 0 7 1 6 0 7 1 9 0 7 2 2 0 7 2 5 0 7 - 1 0
- 5
0
5
1 0
1 5
2 0
Cur
rent
vel
ocity
com
pone
nt (c
m s-1
) C
urre
nt v
eloc
ity c
ompo
nent
(cm
s-1
)
Date 2007
12
34
00 05 10 15 20
Fjord zone (year 2007)
Migratory speed (bl sminus1)
AB
C
00 05 10 15 20
Fjord zone (year 2008)
Migratory speed (bl sminus1)
1
FIGURE CAPTIONS 1
2
Figure 1 Map of the lower part of River Alta and the Alta Fjord showing the position 3
of the bag nets ( ) and the release sites ( ) ALS array 1 is indicated with () while 4
ALS arrays 2ndash5 are indicated by grey and black lines Most fish passed these ALSs in the 5
darker parts of the lines The two ALSs in the river mouth (array 6) and the three ALSs 6
(array 7) in the river are given by () The map also shows the position of the two current 7
meters in ALS array 3 ( ) the four zones (Z1ndash4) and the weather station () In the 8
following year (2008) were only array 1 3 5 and 6 present 9
10
11
Figure 2 Daily river flow (- - - - -) and water temperature (___) in the River Alta 12
13
14
Figure 3 Salinity distribution recorded at 0ndash12 m depth across ALS array 2 (a amp c) and ALS 15
array 3 (b amp d) in the Alta Fjord on 6 July (a amp b) and 13 July (c amp d) 2007 16
17
18
Figure 4 Current velocity components at 3 m depth at the north-eastern (upper panel) and 19
south-western (lower panel) side of the Alta Fjord at the ALS array 3 Positive values are 20
towards the fjord head and negative values are towards the fjord mouth indicates time of 21
individual Atlantic salmon (Salmo salar) passage 22
23
2
Figure 5 Migratory speeds of homing Atlantic salmon (Salmo salar) in the Alta Fjord in 2007 24
and 2008 In 2007 the fjord was divided into four zones (see map Fig 1) In 2008 zone A 25
was the area from ALS1ndash3 zone B from ALS3ndash5 and zone C from ALS5ndash6 The box-26
and-whisker plots give the median values (black lines) the interquartile ranges (box 50 of 27
the data falling into this) and the 5th and 95th percentiles (whiskers) 28
29
- cjfas-2012-0352-final1
-
- Homing behaviour of Atlantic salmon (Salmo salar) during final phase of marine migration and river entry
-
- Table 1-3
- Figure 1
- Figure 2
-
- Slide Number 1
-
- Figure 3
-
- Slide Number 1
-
- Figure 4
-
- Slide Number 1
-
- Figure 5
- FIGURE CAPTIONS
-

23
529
ACKNOWLEDGEMENTS 530
This study was financed by the Norwegian Research Council (project no 531
17601S40) the Norwegian Institute for Nature Research the Directorate for Nature 532
Management and the University of Tromsoslash The Norwegian Water Resources and 533
Energy Directorate provided data on the river flow The crew onboard the Research 534
Vessel ldquoJohan Ruudrdquo the staff at Alta Laksefiskeri Interessentselskap (ALI) the local 535
bag net fishermen Amund Suhr Anette Grimsrud Davidsen Cedar Chittenden and 536
Jenny Jensen are all thanked for their extensive help during the field work and Gunnel 537
Oslashstborg for scale analyses Helge Meissner is thanked for assistance with genotyping 538
and Svein-Erik Fevolden and Anne K Praeligbel for valuable discussions concerning the 539
genetics Timothy Sheehan and two anonymous referees are thanked for their valuable 540
comments on an earlier version of the manuscript The experimental procedures 541
concur with the national ethical requirements and were approved by the Norwegian 542
National Animal Research Authority 543
544
24
545
REFERENCES 546
547
Alabaster JS Gough PJ and Brooker WJ 1991 The environmental requirements 548
of Atlantic salmon Salmo salar L during their passage through the Thames 549
estuary 1982-89 J Fish Biol 38 741-762 550
Aprahamian MW Jones GO and Gough PJ 1998 Movement of adult Atlantic 551
salmon in the Usk estuary Wales J Fish Biol 53 221-225 552
Banks JW 1969 A review of the litterature on the upstream migration of adult 553
salmonids J Fish Biol 1 85-136 554
Bates D and Maechler M (2010) Package ldquolme4rdquo Reference manual for the 555
package Available at httpcranr-projectorgwebpackageslme4lme4pdf 556
(Assessed 22062012) 557
Brannon EL 1981 Orientation mechanisms of homing salmonids In Salmon and 558
trout migratory behaviour symposium Edited by EL Brannon and EO Salo 559
University of Washington Seattle pp 219-227 560
Cooke SJ Iverson SJ Stokesbury MJW Hinch SG Fisk AT Smith P 561
VanderZwaag D Brattey J and Whoriskey F 2011 Ocean Tracking 562
Network Canada A network approach to addressing critical issues in fisheries 563
and resource management with implications for ocean governance Fisheries 564
36 583-592 565
Dahl J Dannewitz J Karlsson L Petersson E Loumlf A and Ragnarsson B 2004 566
The timing of spawning migration implications of environmental variation 567
life history and sex Can J Zool 82 1864-1870 568
25
Davidsen JG Rikardsen AH Halttunen E Thorstad EB Oslashkland F Letcher 569
BH Skarethhamar J and Naeligsje TF 2009 Migratory behaviour and survival 570
rates of wild northern Atlantic salmon (Salmo salar) post-smolts effects of 571
environmental factors J Fish Biol 75 1700-1718 572
Doslashving KB Westergaringrd H and Johnsen PB 1985 Role of olfaction in the 573
behavioural and neuronal responses of Atlantic salmon Salmo salar to 574
hydrographic stratification Can J Fish Aquat Sci 42 1658-1667 575
Fiske P Lund RA and Hansen LP 2005 Identifying fish farm escapees In Stock 576
identification methods Edited by SX Cadrin KD Friedland and JD 577
Waldman Elsevier Academic Press Amsterdam pp 659-680 578
Halttunen E Rikardsen AH Davidsen JG Thorstad EB and Dempson JB 579
2009 Survival migration speed and swimming depth of Atlantic salmon kelts 580
during sea entry and fjord migration In Tagging and tracking of Marine 581
Animals with Electronic Devices Reviews Methods and Technologies in Fish 582
Biology and Fisheries 9 Edited by JL Nielsen H Arrizabalaga N Fragoso 583
A Hobday M Lutcavage and J Sibert Springer Dordrecht pp 35-49 584
Hansen LP Jonsson N and Jonsson B 1993 Oceanic migration in homing 585
Atlantic salmon Anim Behav 45 927-941 586
Hansen LP and Quinn TP 1998 The marine phase of the Atlantic salmon (Salmo 587
salar) life cycle with comparisons to pacific salmon Can J Fish Aquat Sci 588
55 104-118 589
Heggberget TG Oslashkland F and Ugedal O 1993 Distribution and migratory 590
behaviour of adult wild and farmed Atlantic salmon (Salmo salar) during 591
return migration Aquaculture 118 73-83 592
ICES (2011) Report of the Working Group on North Atlantic Salmon (WGNAS) 593
26
ICES 2011ACOM09 286 pp Available at 594
httpwwwicesdkreportsACOM2011WGNASwgnas_2011_finalpdf 595
(Assessed 22062012) 596
Jonsson B Jonsson N and Hansen LP 1990a Does juvenile experience affect 597
migration and spawning of adult Atlantic salmon Behav Ecol Sociobiol 26 598
225-230 599
Jonsson B Jonsson N and Hansen LP 2007 Factors affecting river entry of adult 600
Atlantic salmon in a small river J Fish Biol 71 943-956 601
Jonsson N 1991 Influence of water flow water temperature and light on fish 602
migration in rivers Nord J Freshwat Res 66 20-35 603
Jonsson N Jonsson B and Hansen LP 1990b Partial segregation in the timing of 604
migration of Atlantic salmon of different ages Anim Behav 40 313-321 605
Karppinen P Erkinaro J Niemelauml E Moen K and Oslashkland F 2004 Return 606
migration of one-sea-winter Atlantic salmon in the River Tana J Fish Biol 607
64 1179-1192 608
Lacroix GL and Voegeli FA 2000 Development of automated monitoring 609
systems for ultrasonic transmitters In Fish Telemetry Proceedings of the 3rd 610
Conference on Fish Telemetry in Europe Edited by A Moore and IC 611
Russell CEFAS Lowestoft UK pp 37-50 612
Legendre P and Legendre L 1998 Numerical ecology p 853 Elsevier Science BV 613
Amsterdam 614
Lund RA and Hansen LP 1991 Identification of wild and reared Atlantic salmon 615
Salmo salar L using scale characters Aquacult Fish Manage 22 499-508 616
Niemelauml E Orell P Erkinaro J Dempson J Broslashrs S Svenning M and 617
Hassinen E 2006 Previously spawned Atlantic salmon ascend a large 618
27
subarctic river earlier than their maiden counterparts J Fish Biol 69 1151ndash619
1163 620
Olson AF and Quinn TP 1993 Vertical and horizontal movements of adult 621
chinook salmon Oncorhynchus tshawytscha in the Columbia River estuary 622
Fishery Bulletin of the Fish and Wildlife Service 91 171-178 623
Parrish DL Behnke RJ Gephard SR McCormick SD and Reeves GH 1998 624
Why arenrsquot there more Atlantic salmon (Salmo salar) Can J Fish Aquat 625
Sci 55 281-287 626
Pascual MA and Quinn TP 1991 Evaluation of alternative models of the coastal 627
migration of adult Fraser River sockeye salmon (Oncorhynchus nerka) Can J 628
Fish Aquat Sci 48 799-810 629
Pierce GJ Boyle PR and Thompson PM 1990 Diet selection by seals In 630
Trophic Relationships in the Marine Environment Edited by M Barnes and 631
RN Gibson Aberdeen University Press Aberdeen pp 222-238 632
Potter ECE 1988 Movements of Atlantic salmon Salmo salar L in an estuary in 633
south-west England J Fish Biol 33 153-159 634
Potter ECE Solomon DJ and Buckley AA 1992 Estuarine movements of adult 635
Atlantic salmon (Salmo salar L) in Christchurch Harbour southern England 636
In Wildlife telemetry remote monitoring and tracking of animals Edited by 637
IG Priede and SM Swift Ellis Horwood Limited Chichester England pp 638
400-409 639
Power G 1981 Stock Characteristics and Catches of Atlantic Salmon (Salmo salar) 640
in Quebec and Newfoundland and Labrador in Relation to Environmental 641
Variables Can J Fish Aquat Sci 38 1601-1611 642
28
Quinn TP 1990 Current controversies in the study of salmon homing Ethol Ecol 643
Evol 2(1) 49-63 644
Quinn TP Terahart BA and Groot C 1989 Migratory orientation and vertical 645
movements of homing adult sockeye salmon Oncorhynchus nerka in coastal 646
waters Anim Behav 37 587-599 647
Smith GW 1990 The relationship between river flow and net catches of salmon 648
(Salmo salar L) in and around the mouth of the Aberdeenshire Dee between 649
1973 and 1986 Fish Res 10 73-91 650
Smith GW Hawkins AD Urquhart GG and Shearer WM 1981 Orientation 651
and energetic efficiency in the offshore movements of returning Atlantic 652
salmon Salmo salar L Scott Fish Res Rep 21 1-22 653
Smith IP and Smith GW 1997 Tidal and diel timing of river entry by adult 654
Atlantic salmon returning to the Aberdeenshire Dee Scotland J Fish Biol 50 655
463-474 656
Solomon DJ 1982 Smolt migration in Atlantic salmon (Salmo salar L) and sea 657
trout (Salmo trutta L) In Salmon and trout migratory behavior symposium 658
Edited by EL Brannon and EO Salo University of Washington Seattle pp 659
196-203 660
Stabell OB 1982 Homing of Atlantic salmon in relation to olfaction and genetics In 661
Salmon and trout migratory behaviour symposium Edited by EL Brannon 662
and EO Salo University of Washington Seattle pp 238-246 663
Stasko AB Sutterlin AM Rommel SAj and Elson PF 1973 Migration-664
orientation of Atlantic salmon (Salmo salar L) In International Atlantic 665
Salmon Symposium Special Publication Series Edited by MW Smith and 666
29
WM Carter International Atlantic Salmon Foundation New York pp 119-667
137 668
Svendsen H 1995 Physical oceanography of coupled fjord-coast systems in northern 669
Norway with special focus on frontal dynamics and tides In Ecology of fjords 670
and coastal waters Edited by HR Skjoldal C Hopkins KJ Erikstad and 671
HP Leinaas Elsevier Science Publ B V Amsterdam pp 149-164 672
Thorstad EB Heggberget TG and Oslashkland F 1998 Migratory behaviour of adult 673
wild and escaped farmed Atlantic salmon Salmo salar L before during and 674
after spawning in a Norwegian river Aquacult Res 29 419-428 675
Thorstad EB Whoriskey F Uglem I Moore A Rikardsen AH and Finstad B 676
2012 A critical life stage of the Atlantic salmon Salmo salar behaviour and 677
survival during the smolt and initial post-smolt migration J Fish Biol 81 678
500-542 679
Thorstad EB Whoriskey FG Rikardsen AH and Aarestrup K 2010 Aquatic 680
nomads the life and migrations of the Atlantic salmon In Atlantic Salmon 681
Ecology Edited by Oslash Aas S Einum A Klemetsen and J Skurdal Wiley-682
Blackwell New York pp 1-32 683
Thorstad EB Oslashkland F Aarestrup K and Heggberget TG 2008 Factors 684
affecting the within-river spawning migration of Atlantic salmon with 685
emphasis on human impacts Rev Fish Biol Fish 18 345-371 686
Thorstad EB Oslashkland F and Finstad B 2000 Effects of telemetry transmitters on 687
swimming performance of adult Atlantic salmon J Fish Biol 57 531-535 688
Treacutepanier S Rodriacuteguez MA and Magnan P 1996 Spawning migrations in 689
landlocked Atlantic salmon time series modelling of river discharge and water 690
temperature effects J Fish Biol 48 925-936 691
30
Ugedal O Naeligsje TF Thorstad EB Forseth T Saksgaringrd L and Heggberget 692
TG 2008 Twenty years of hydropower regulation in the River Alta long 693
term changes in abundance of juvenile and adult Atlantic salmon 694
Hydrobiologia 609 9-23 695
Welch DW Melnychuk MC Payne JC Rechisky EL Porter AD Jackson 696
GD Ward BR Vincent SP Wood CC and Semmens J 2011 In situ 697
Measurement of Coastal Ocean Movements and Survival of Juvenile Pacific 698
Salmon Proc Natl Acad Sci USA 108 8708-8713 699
Westerberg H 1982 Ultrasonic tracking of Atlantic salmon (Salmo salar L) ndash II 700
Swimming depth and temperature stratification Rep Inst Fresh Res 701
Drottningholm 60 102-120 702
1
TABLES 1
Table 1 Mean swimming depth registered at the time Atlantic salmon (Salmo salar) passed 2
the array 2ndash5 in the Alta Fjord Mean values are based on individual means Welchrsquos t-test 3
was used to test for significant difference between male and female swimming depth 4
5
ALS
Array
n
Mean
(m)
SD individual
mean (range)
(m)
Deepest
individual
recording
(m)
Mean
depth
females
(m)
Mean
depth
males
(m)
p-value
(between
sexes)
2 23 24 37 (00ndash161) 297 26 18 057
3 24 11 15 (00ndash64) 189 09 14 036
4 18 15 19 (00ndash67) 109 14 17 075
5 21 05 07 (00ndash18) 146 04 09 018
2
Table 2 Comparisons of the number and proportions of homing Atlantic salmon (Salmo 6
salar) entering the river during 1) different stages of the tidal cycle and 2) for different 7
combinations of day and night and different stages of the tidal cycle Chi-square-tests were 8
used to test for differences between different stages of the tidal cycle and between the 9
different combinations of day and night and different stages of the tidal cycle 10
11
Number
(n =56) P-value
High tide 15 27
Ebbing tide 13 23
Low tide 9 16
Flooding tide 19 34 029
High tide day time 7 13
High tide night time 8 14
Ebbing tide day time 7 13
Ebbing tide night time 6 11
Low tide day time 5 9
Low tide night time 4 7
Flooding tide day time 11 20
Flooding tide night time 8 14 071
12
3
Table 3 Results from a redundancy analysis (RDA) exploring whether timing of river entry 13
(day-of-the-year day or night river flow tidal cycle) of Atlantic salmon (Salmo salar) 14
depended on fork length or body mass The proportion of constrained and unconstrained 15
inertia (the sum of the variance from all included parameters) from total inertia was 16
calculated which in RDA gives the proportion of variance 17
18
19
Inertia Proportion
Total 20000 10000
Constrained 02846 01423
Unconstrained 17154 08577
0
N
5
km RiverAlta
Alta Fjord
70deg30deg20deg
65deg
Norway Sweden
Finland
1
2
34
5
Z 1Z 1 Z 2Z 2
Z 3Z 3Z 4Z 47 6
10
11
12
13
14
15
16
40
50
60
70
80
90
100
110
120
130
140
57 127 197 267 28
Tem
pera
ture
(degC
)
Riv
er fl
ow (m
3 s-1
)
Date 2007
0 7 0 7 1 0 0 7 1 3 0 7 1 6 0 7 1 9 0 7 2 2 0 7 2 5 0 7 - 1 0
- 5
0
5
1 0
1 5
2 0
0 7 0 7 1 0 0 7 1 3 0 7 1 6 0 7 1 9 0 7 2 2 0 7 2 5 0 7 - 1 0
- 5
0
5
1 0
1 5
2 0
Cur
rent
vel
ocity
com
pone
nt (c
m s-1
) C
urre
nt v
eloc
ity c
ompo
nent
(cm
s-1
)
Date 2007
12
34
00 05 10 15 20
Fjord zone (year 2007)
Migratory speed (bl sminus1)
AB
C
00 05 10 15 20
Fjord zone (year 2008)
Migratory speed (bl sminus1)
1
FIGURE CAPTIONS 1
2
Figure 1 Map of the lower part of River Alta and the Alta Fjord showing the position 3
of the bag nets ( ) and the release sites ( ) ALS array 1 is indicated with () while 4
ALS arrays 2ndash5 are indicated by grey and black lines Most fish passed these ALSs in the 5
darker parts of the lines The two ALSs in the river mouth (array 6) and the three ALSs 6
(array 7) in the river are given by () The map also shows the position of the two current 7
meters in ALS array 3 ( ) the four zones (Z1ndash4) and the weather station () In the 8
following year (2008) were only array 1 3 5 and 6 present 9
10
11
Figure 2 Daily river flow (- - - - -) and water temperature (___) in the River Alta 12
13
14
Figure 3 Salinity distribution recorded at 0ndash12 m depth across ALS array 2 (a amp c) and ALS 15
array 3 (b amp d) in the Alta Fjord on 6 July (a amp b) and 13 July (c amp d) 2007 16
17
18
Figure 4 Current velocity components at 3 m depth at the north-eastern (upper panel) and 19
south-western (lower panel) side of the Alta Fjord at the ALS array 3 Positive values are 20
towards the fjord head and negative values are towards the fjord mouth indicates time of 21
individual Atlantic salmon (Salmo salar) passage 22
23
2
Figure 5 Migratory speeds of homing Atlantic salmon (Salmo salar) in the Alta Fjord in 2007 24
and 2008 In 2007 the fjord was divided into four zones (see map Fig 1) In 2008 zone A 25
was the area from ALS1ndash3 zone B from ALS3ndash5 and zone C from ALS5ndash6 The box-26
and-whisker plots give the median values (black lines) the interquartile ranges (box 50 of 27
the data falling into this) and the 5th and 95th percentiles (whiskers) 28
29
- cjfas-2012-0352-final1
-
- Homing behaviour of Atlantic salmon (Salmo salar) during final phase of marine migration and river entry
-
- Table 1-3
- Figure 1
- Figure 2
-
- Slide Number 1
-
- Figure 3
-
- Slide Number 1
-
- Figure 4
-
- Slide Number 1
-
- Figure 5
- FIGURE CAPTIONS
-
29
WM Carter International Atlantic Salmon Foundation New York pp 119-667
137 668
Svendsen H 1995 Physical oceanography of coupled fjord-coast systems in northern 669
Norway with special focus on frontal dynamics and tides In Ecology of fjords 670
and coastal waters Edited by HR Skjoldal C Hopkins KJ Erikstad and 671
HP Leinaas Elsevier Science Publ B V Amsterdam pp 149-164 672
Thorstad EB Heggberget TG and Oslashkland F 1998 Migratory behaviour of adult 673
wild and escaped farmed Atlantic salmon Salmo salar L before during and 674
after spawning in a Norwegian river Aquacult Res 29 419-428 675
Thorstad EB Whoriskey F Uglem I Moore A Rikardsen AH and Finstad B 676
2012 A critical life stage of the Atlantic salmon Salmo salar behaviour and 677
survival during the smolt and initial post-smolt migration J Fish Biol 81 678
500-542 679
Thorstad EB Whoriskey FG Rikardsen AH and Aarestrup K 2010 Aquatic 680
nomads the life and migrations of the Atlantic salmon In Atlantic Salmon 681
Ecology Edited by Oslash Aas S Einum A Klemetsen and J Skurdal Wiley-682
Blackwell New York pp 1-32 683
Thorstad EB Oslashkland F Aarestrup K and Heggberget TG 2008 Factors 684
affecting the within-river spawning migration of Atlantic salmon with 685
emphasis on human impacts Rev Fish Biol Fish 18 345-371 686
Thorstad EB Oslashkland F and Finstad B 2000 Effects of telemetry transmitters on 687
swimming performance of adult Atlantic salmon J Fish Biol 57 531-535 688
Treacutepanier S Rodriacuteguez MA and Magnan P 1996 Spawning migrations in 689
landlocked Atlantic salmon time series modelling of river discharge and water 690
temperature effects J Fish Biol 48 925-936 691
30
Ugedal O Naeligsje TF Thorstad EB Forseth T Saksgaringrd L and Heggberget 692
TG 2008 Twenty years of hydropower regulation in the River Alta long 693
term changes in abundance of juvenile and adult Atlantic salmon 694
Hydrobiologia 609 9-23 695
Welch DW Melnychuk MC Payne JC Rechisky EL Porter AD Jackson 696
GD Ward BR Vincent SP Wood CC and Semmens J 2011 In situ 697
Measurement of Coastal Ocean Movements and Survival of Juvenile Pacific 698
Salmon Proc Natl Acad Sci USA 108 8708-8713 699
Westerberg H 1982 Ultrasonic tracking of Atlantic salmon (Salmo salar L) ndash II 700
Swimming depth and temperature stratification Rep Inst Fresh Res 701
Drottningholm 60 102-120 702
1
TABLES 1
Table 1 Mean swimming depth registered at the time Atlantic salmon (Salmo salar) passed 2
the array 2ndash5 in the Alta Fjord Mean values are based on individual means Welchrsquos t-test 3
was used to test for significant difference between male and female swimming depth 4
5
ALS
Array
n
Mean
(m)
SD individual
mean (range)
(m)
Deepest
individual
recording
(m)
Mean
depth
females
(m)
Mean
depth
males
(m)
p-value
(between
sexes)
2 23 24 37 (00ndash161) 297 26 18 057
3 24 11 15 (00ndash64) 189 09 14 036
4 18 15 19 (00ndash67) 109 14 17 075
5 21 05 07 (00ndash18) 146 04 09 018
2
Table 2 Comparisons of the number and proportions of homing Atlantic salmon (Salmo 6
salar) entering the river during 1) different stages of the tidal cycle and 2) for different 7
combinations of day and night and different stages of the tidal cycle Chi-square-tests were 8
used to test for differences between different stages of the tidal cycle and between the 9
different combinations of day and night and different stages of the tidal cycle 10
11
Number
(n =56) P-value
High tide 15 27
Ebbing tide 13 23
Low tide 9 16
Flooding tide 19 34 029
High tide day time 7 13
High tide night time 8 14
Ebbing tide day time 7 13
Ebbing tide night time 6 11
Low tide day time 5 9
Low tide night time 4 7
Flooding tide day time 11 20
Flooding tide night time 8 14 071
12
3
Table 3 Results from a redundancy analysis (RDA) exploring whether timing of river entry 13
(day-of-the-year day or night river flow tidal cycle) of Atlantic salmon (Salmo salar) 14
depended on fork length or body mass The proportion of constrained and unconstrained 15
inertia (the sum of the variance from all included parameters) from total inertia was 16
calculated which in RDA gives the proportion of variance 17
18
19
Inertia Proportion
Total 20000 10000
Constrained 02846 01423
Unconstrained 17154 08577
0
N
5
km RiverAlta
Alta Fjord
70deg30deg20deg
65deg
Norway Sweden
Finland
1
2
34
5
Z 1Z 1 Z 2Z 2
Z 3Z 3Z 4Z 47 6
10
11
12
13
14
15
16
40
50
60
70
80
90
100
110
120
130
140
57 127 197 267 28
Tem
pera
ture
(degC
)
Riv
er fl
ow (m
3 s-1
)
Date 2007
0 7 0 7 1 0 0 7 1 3 0 7 1 6 0 7 1 9 0 7 2 2 0 7 2 5 0 7 - 1 0
- 5
0
5
1 0
1 5
2 0
0 7 0 7 1 0 0 7 1 3 0 7 1 6 0 7 1 9 0 7 2 2 0 7 2 5 0 7 - 1 0
- 5
0
5
1 0
1 5
2 0
Cur
rent
vel
ocity
com
pone
nt (c
m s-1
) C
urre
nt v
eloc
ity c
ompo
nent
(cm
s-1
)
Date 2007
12
34
00 05 10 15 20
Fjord zone (year 2007)
Migratory speed (bl sminus1)
AB
C
00 05 10 15 20
Fjord zone (year 2008)
Migratory speed (bl sminus1)
1
FIGURE CAPTIONS 1
2
Figure 1 Map of the lower part of River Alta and the Alta Fjord showing the position 3
of the bag nets ( ) and the release sites ( ) ALS array 1 is indicated with () while 4
ALS arrays 2ndash5 are indicated by grey and black lines Most fish passed these ALSs in the 5
darker parts of the lines The two ALSs in the river mouth (array 6) and the three ALSs 6
(array 7) in the river are given by () The map also shows the position of the two current 7
meters in ALS array 3 ( ) the four zones (Z1ndash4) and the weather station () In the 8
following year (2008) were only array 1 3 5 and 6 present 9
10
11
Figure 2 Daily river flow (- - - - -) and water temperature (___) in the River Alta 12
13
14
Figure 3 Salinity distribution recorded at 0ndash12 m depth across ALS array 2 (a amp c) and ALS 15
array 3 (b amp d) in the Alta Fjord on 6 July (a amp b) and 13 July (c amp d) 2007 16
17
18
Figure 4 Current velocity components at 3 m depth at the north-eastern (upper panel) and 19
south-western (lower panel) side of the Alta Fjord at the ALS array 3 Positive values are 20
towards the fjord head and negative values are towards the fjord mouth indicates time of 21
individual Atlantic salmon (Salmo salar) passage 22
23
2
Figure 5 Migratory speeds of homing Atlantic salmon (Salmo salar) in the Alta Fjord in 2007 24
and 2008 In 2007 the fjord was divided into four zones (see map Fig 1) In 2008 zone A 25
was the area from ALS1ndash3 zone B from ALS3ndash5 and zone C from ALS5ndash6 The box-26
and-whisker plots give the median values (black lines) the interquartile ranges (box 50 of 27
the data falling into this) and the 5th and 95th percentiles (whiskers) 28
29
- cjfas-2012-0352-final1
-
- Homing behaviour of Atlantic salmon (Salmo salar) during final phase of marine migration and river entry
-
- Table 1-3
- Figure 1
- Figure 2
-
- Slide Number 1
-
- Figure 3
-
- Slide Number 1
-
- Figure 4
-
- Slide Number 1
-
- Figure 5
- FIGURE CAPTIONS
-
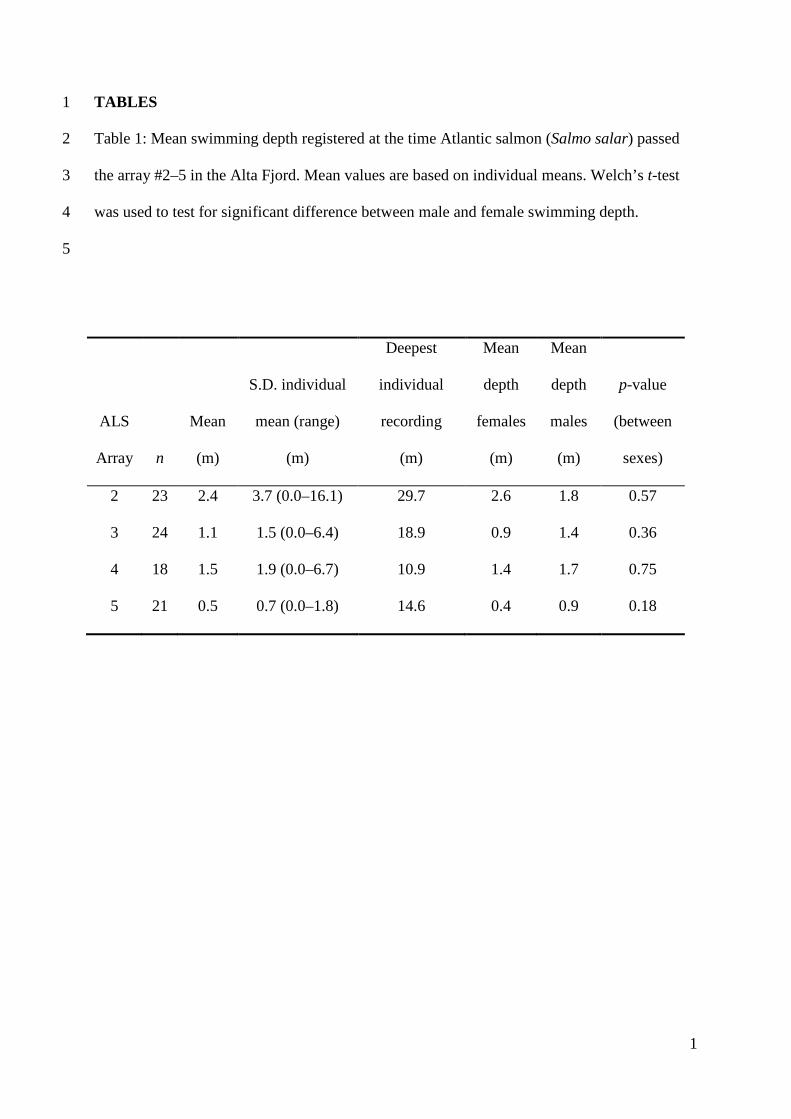
1
TABLES 1
Table 1 Mean swimming depth registered at the time Atlantic salmon (Salmo salar) passed 2
the array 2ndash5 in the Alta Fjord Mean values are based on individual means Welchrsquos t-test 3
was used to test for significant difference between male and female swimming depth 4
5
ALS
Array
n
Mean
(m)
SD individual
mean (range)
(m)
Deepest
individual
recording
(m)
Mean
depth
females
(m)
Mean
depth
males
(m)
p-value
(between
sexes)
2 23 24 37 (00ndash161) 297 26 18 057
3 24 11 15 (00ndash64) 189 09 14 036
4 18 15 19 (00ndash67) 109 14 17 075
5 21 05 07 (00ndash18) 146 04 09 018
2
Table 2 Comparisons of the number and proportions of homing Atlantic salmon (Salmo 6
salar) entering the river during 1) different stages of the tidal cycle and 2) for different 7
combinations of day and night and different stages of the tidal cycle Chi-square-tests were 8
used to test for differences between different stages of the tidal cycle and between the 9
different combinations of day and night and different stages of the tidal cycle 10
11
Number
(n =56) P-value
High tide 15 27
Ebbing tide 13 23
Low tide 9 16
Flooding tide 19 34 029
High tide day time 7 13
High tide night time 8 14
Ebbing tide day time 7 13
Ebbing tide night time 6 11
Low tide day time 5 9
Low tide night time 4 7
Flooding tide day time 11 20
Flooding tide night time 8 14 071
12
3
Table 3 Results from a redundancy analysis (RDA) exploring whether timing of river entry 13
(day-of-the-year day or night river flow tidal cycle) of Atlantic salmon (Salmo salar) 14
depended on fork length or body mass The proportion of constrained and unconstrained 15
inertia (the sum of the variance from all included parameters) from total inertia was 16
calculated which in RDA gives the proportion of variance 17
18
19
Inertia Proportion
Total 20000 10000
Constrained 02846 01423
Unconstrained 17154 08577
0
N
5
km RiverAlta
Alta Fjord
70deg30deg20deg
65deg
Norway Sweden
Finland
1
2
34
5
Z 1Z 1 Z 2Z 2
Z 3Z 3Z 4Z 47 6
10
11
12
13
14
15
16
40
50
60
70
80
90
100
110
120
130
140
57 127 197 267 28
Tem
pera
ture
(degC
)
Riv
er fl
ow (m
3 s-1
)
Date 2007
0 7 0 7 1 0 0 7 1 3 0 7 1 6 0 7 1 9 0 7 2 2 0 7 2 5 0 7 - 1 0
- 5
0
5
1 0
1 5
2 0
0 7 0 7 1 0 0 7 1 3 0 7 1 6 0 7 1 9 0 7 2 2 0 7 2 5 0 7 - 1 0
- 5
0
5
1 0
1 5
2 0
Cur
rent
vel
ocity
com
pone
nt (c
m s-1
) C
urre
nt v
eloc
ity c
ompo
nent
(cm
s-1
)
Date 2007
12
34
00 05 10 15 20
Fjord zone (year 2007)
Migratory speed (bl sminus1)
AB
C
00 05 10 15 20
Fjord zone (year 2008)
Migratory speed (bl sminus1)
1
FIGURE CAPTIONS 1
2
Figure 1 Map of the lower part of River Alta and the Alta Fjord showing the position 3
of the bag nets ( ) and the release sites ( ) ALS array 1 is indicated with () while 4
ALS arrays 2ndash5 are indicated by grey and black lines Most fish passed these ALSs in the 5
darker parts of the lines The two ALSs in the river mouth (array 6) and the three ALSs 6
(array 7) in the river are given by () The map also shows the position of the two current 7
meters in ALS array 3 ( ) the four zones (Z1ndash4) and the weather station () In the 8
following year (2008) were only array 1 3 5 and 6 present 9
10
11
Figure 2 Daily river flow (- - - - -) and water temperature (___) in the River Alta 12
13
14
Figure 3 Salinity distribution recorded at 0ndash12 m depth across ALS array 2 (a amp c) and ALS 15
array 3 (b amp d) in the Alta Fjord on 6 July (a amp b) and 13 July (c amp d) 2007 16
17
18
Figure 4 Current velocity components at 3 m depth at the north-eastern (upper panel) and 19
south-western (lower panel) side of the Alta Fjord at the ALS array 3 Positive values are 20
towards the fjord head and negative values are towards the fjord mouth indicates time of 21
individual Atlantic salmon (Salmo salar) passage 22
23
2
Figure 5 Migratory speeds of homing Atlantic salmon (Salmo salar) in the Alta Fjord in 2007 24
and 2008 In 2007 the fjord was divided into four zones (see map Fig 1) In 2008 zone A 25
was the area from ALS1ndash3 zone B from ALS3ndash5 and zone C from ALS5ndash6 The box-26
and-whisker plots give the median values (black lines) the interquartile ranges (box 50 of 27
the data falling into this) and the 5th and 95th percentiles (whiskers) 28
29
- cjfas-2012-0352-final1
-
- Homing behaviour of Atlantic salmon (Salmo salar) during final phase of marine migration and river entry
-
- Table 1-3
- Figure 1
- Figure 2
-
- Slide Number 1
-
- Figure 3
-
- Slide Number 1
-
- Figure 4
-
- Slide Number 1
-
- Figure 5
- FIGURE CAPTIONS
-
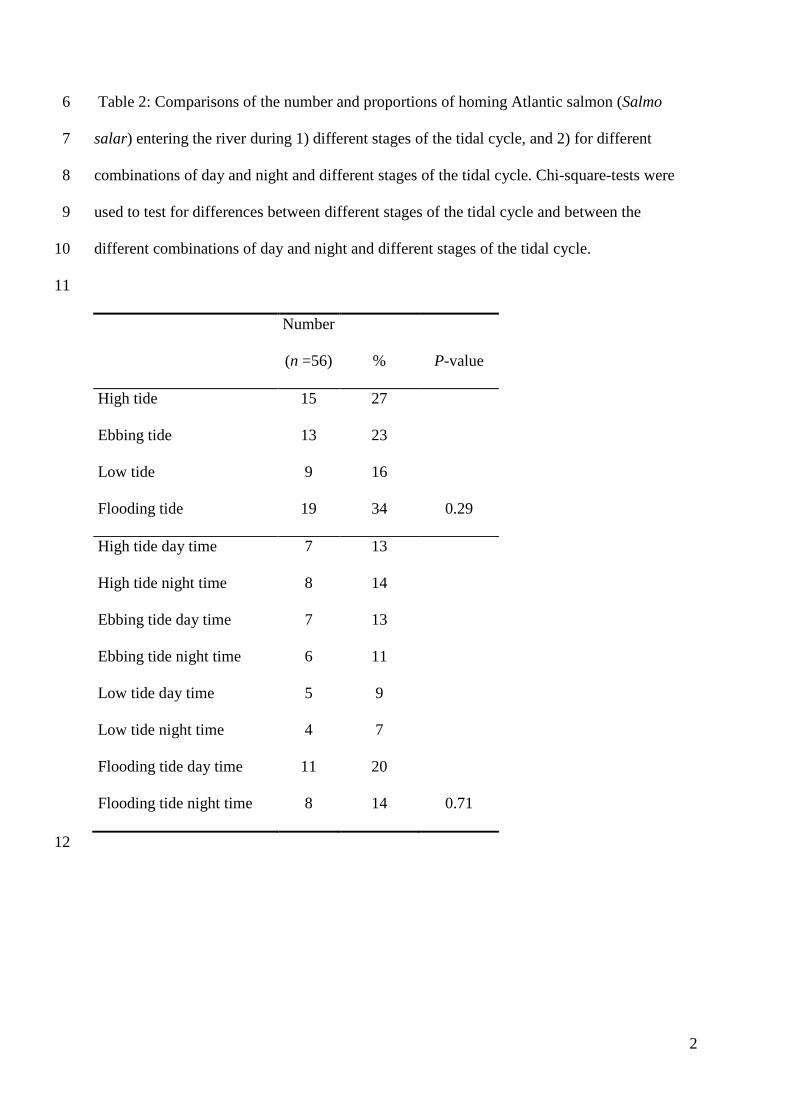
2
Table 2 Comparisons of the number and proportions of homing Atlantic salmon (Salmo 6
salar) entering the river during 1) different stages of the tidal cycle and 2) for different 7
combinations of day and night and different stages of the tidal cycle Chi-square-tests were 8
used to test for differences between different stages of the tidal cycle and between the 9
different combinations of day and night and different stages of the tidal cycle 10
11
Number
(n =56) P-value
High tide 15 27
Ebbing tide 13 23
Low tide 9 16
Flooding tide 19 34 029
High tide day time 7 13
High tide night time 8 14
Ebbing tide day time 7 13
Ebbing tide night time 6 11
Low tide day time 5 9
Low tide night time 4 7
Flooding tide day time 11 20
Flooding tide night time 8 14 071
12
3
Table 3 Results from a redundancy analysis (RDA) exploring whether timing of river entry 13
(day-of-the-year day or night river flow tidal cycle) of Atlantic salmon (Salmo salar) 14
depended on fork length or body mass The proportion of constrained and unconstrained 15
inertia (the sum of the variance from all included parameters) from total inertia was 16
calculated which in RDA gives the proportion of variance 17
18
19
Inertia Proportion
Total 20000 10000
Constrained 02846 01423
Unconstrained 17154 08577
0
N
5
km RiverAlta
Alta Fjord
70deg30deg20deg
65deg
Norway Sweden
Finland
1
2
34
5
Z 1Z 1 Z 2Z 2
Z 3Z 3Z 4Z 47 6
10
11
12
13
14
15
16
40
50
60
70
80
90
100
110
120
130
140
57 127 197 267 28
Tem
pera
ture
(degC
)
Riv
er fl
ow (m
3 s-1
)
Date 2007
0 7 0 7 1 0 0 7 1 3 0 7 1 6 0 7 1 9 0 7 2 2 0 7 2 5 0 7 - 1 0
- 5
0
5
1 0
1 5
2 0
0 7 0 7 1 0 0 7 1 3 0 7 1 6 0 7 1 9 0 7 2 2 0 7 2 5 0 7 - 1 0
- 5
0
5
1 0
1 5
2 0
Cur
rent
vel
ocity
com
pone
nt (c
m s-1
) C
urre
nt v
eloc
ity c
ompo
nent
(cm
s-1
)
Date 2007
12
34
00 05 10 15 20
Fjord zone (year 2007)
Migratory speed (bl sminus1)
AB
C
00 05 10 15 20
Fjord zone (year 2008)
Migratory speed (bl sminus1)
1
FIGURE CAPTIONS 1
2
Figure 1 Map of the lower part of River Alta and the Alta Fjord showing the position 3
of the bag nets ( ) and the release sites ( ) ALS array 1 is indicated with () while 4
ALS arrays 2ndash5 are indicated by grey and black lines Most fish passed these ALSs in the 5
darker parts of the lines The two ALSs in the river mouth (array 6) and the three ALSs 6
(array 7) in the river are given by () The map also shows the position of the two current 7
meters in ALS array 3 ( ) the four zones (Z1ndash4) and the weather station () In the 8
following year (2008) were only array 1 3 5 and 6 present 9
10
11
Figure 2 Daily river flow (- - - - -) and water temperature (___) in the River Alta 12
13
14
Figure 3 Salinity distribution recorded at 0ndash12 m depth across ALS array 2 (a amp c) and ALS 15
array 3 (b amp d) in the Alta Fjord on 6 July (a amp b) and 13 July (c amp d) 2007 16
17
18
Figure 4 Current velocity components at 3 m depth at the north-eastern (upper panel) and 19
south-western (lower panel) side of the Alta Fjord at the ALS array 3 Positive values are 20
towards the fjord head and negative values are towards the fjord mouth indicates time of 21
individual Atlantic salmon (Salmo salar) passage 22
23
2
Figure 5 Migratory speeds of homing Atlantic salmon (Salmo salar) in the Alta Fjord in 2007 24
and 2008 In 2007 the fjord was divided into four zones (see map Fig 1) In 2008 zone A 25
was the area from ALS1ndash3 zone B from ALS3ndash5 and zone C from ALS5ndash6 The box-26
and-whisker plots give the median values (black lines) the interquartile ranges (box 50 of 27
the data falling into this) and the 5th and 95th percentiles (whiskers) 28
29
- cjfas-2012-0352-final1
-
- Homing behaviour of Atlantic salmon (Salmo salar) during final phase of marine migration and river entry
-
- Table 1-3
- Figure 1
- Figure 2
-
- Slide Number 1
-
- Figure 3
-
- Slide Number 1
-
- Figure 4
-
- Slide Number 1
-
- Figure 5
- FIGURE CAPTIONS
-
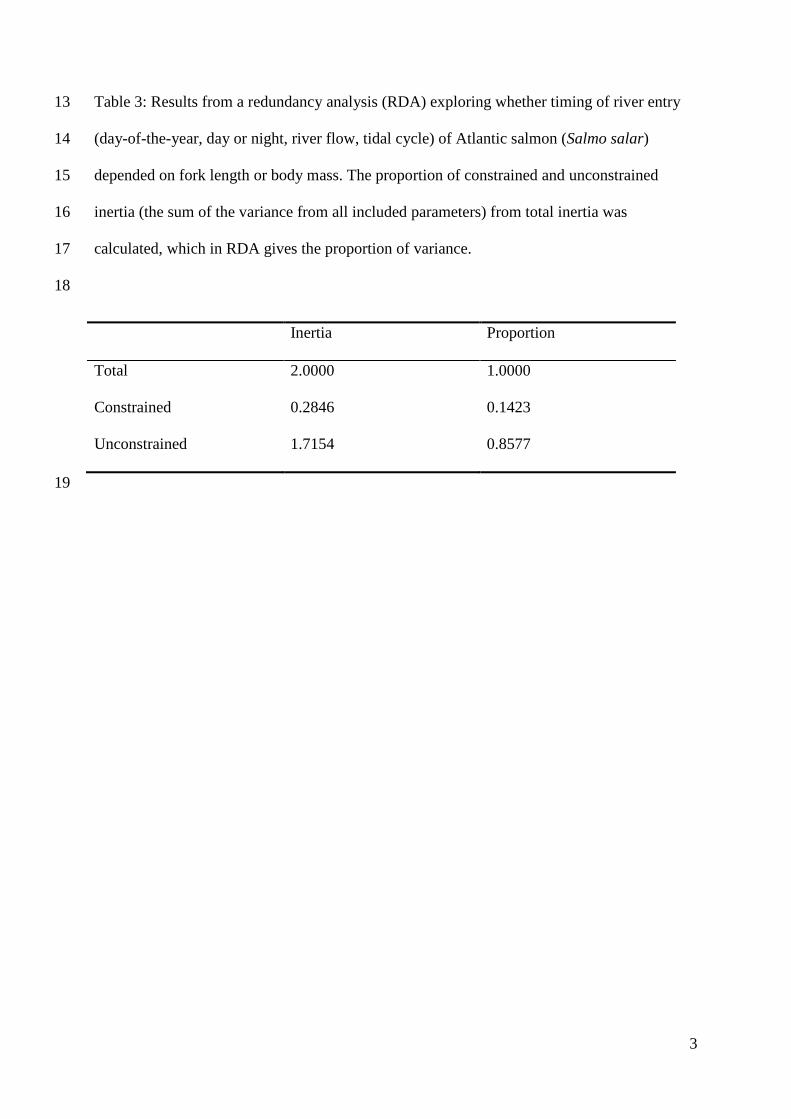

0
N
5
km RiverAlta
Alta Fjord
70deg30deg20deg
65deg
Norway Sweden
Finland
1
2
34
5
Z 1Z 1 Z 2Z 2
Z 3Z 3Z 4Z 47 6
10
11
12
13
14
15
16
40
50
60
70
80
90
100
110
120
130
140
57 127 197 267 28
Tem
pera
ture
(degC
)
Riv
er fl
ow (m
3 s-1
)
Date 2007
0 7 0 7 1 0 0 7 1 3 0 7 1 6 0 7 1 9 0 7 2 2 0 7 2 5 0 7 - 1 0
- 5
0
5
1 0
1 5
2 0
0 7 0 7 1 0 0 7 1 3 0 7 1 6 0 7 1 9 0 7 2 2 0 7 2 5 0 7 - 1 0
- 5
0
5
1 0
1 5
2 0
Cur
rent
vel
ocity
com
pone
nt (c
m s-1
) C
urre
nt v
eloc
ity c
ompo
nent
(cm
s-1
)
Date 2007
12
34
00 05 10 15 20
Fjord zone (year 2007)
Migratory speed (bl sminus1)
AB
C
00 05 10 15 20
Fjord zone (year 2008)
Migratory speed (bl sminus1)
1
FIGURE CAPTIONS 1
2
Figure 1 Map of the lower part of River Alta and the Alta Fjord showing the position 3
of the bag nets ( ) and the release sites ( ) ALS array 1 is indicated with () while 4
ALS arrays 2ndash5 are indicated by grey and black lines Most fish passed these ALSs in the 5
darker parts of the lines The two ALSs in the river mouth (array 6) and the three ALSs 6
(array 7) in the river are given by () The map also shows the position of the two current 7
meters in ALS array 3 ( ) the four zones (Z1ndash4) and the weather station () In the 8
following year (2008) were only array 1 3 5 and 6 present 9
10
11
Figure 2 Daily river flow (- - - - -) and water temperature (___) in the River Alta 12
13
14
Figure 3 Salinity distribution recorded at 0ndash12 m depth across ALS array 2 (a amp c) and ALS 15
array 3 (b amp d) in the Alta Fjord on 6 July (a amp b) and 13 July (c amp d) 2007 16
17
18
Figure 4 Current velocity components at 3 m depth at the north-eastern (upper panel) and 19
south-western (lower panel) side of the Alta Fjord at the ALS array 3 Positive values are 20
towards the fjord head and negative values are towards the fjord mouth indicates time of 21
individual Atlantic salmon (Salmo salar) passage 22
23
2
Figure 5 Migratory speeds of homing Atlantic salmon (Salmo salar) in the Alta Fjord in 2007 24
and 2008 In 2007 the fjord was divided into four zones (see map Fig 1) In 2008 zone A 25
was the area from ALS1ndash3 zone B from ALS3ndash5 and zone C from ALS5ndash6 The box-26
and-whisker plots give the median values (black lines) the interquartile ranges (box 50 of 27
the data falling into this) and the 5th and 95th percentiles (whiskers) 28
29
- cjfas-2012-0352-final1
-
- Homing behaviour of Atlantic salmon (Salmo salar) during final phase of marine migration and river entry
-
- Table 1-3
- Figure 1
- Figure 2
-
- Slide Number 1
-
- Figure 3
-
- Slide Number 1
-
- Figure 4
-
- Slide Number 1
-
- Figure 5
- FIGURE CAPTIONS
-
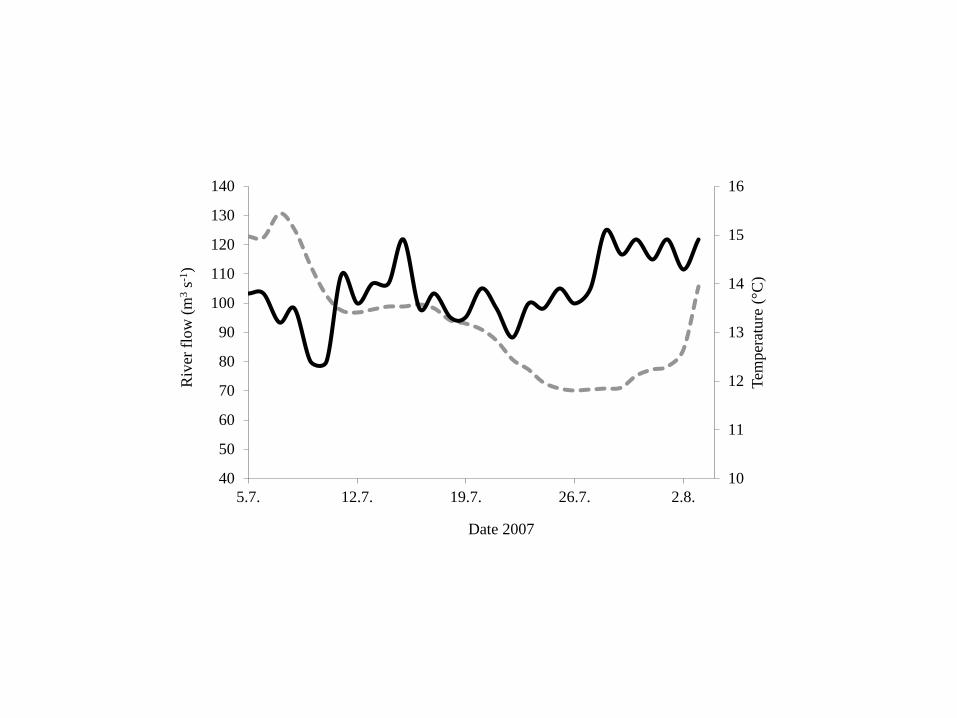
10
11
12
13
14
15
16
40
50
60
70
80
90
100
110
120
130
140
57 127 197 267 28
Tem
pera
ture
(degC
)
Riv
er fl
ow (m
3 s-1
)
Date 2007
0 7 0 7 1 0 0 7 1 3 0 7 1 6 0 7 1 9 0 7 2 2 0 7 2 5 0 7 - 1 0
- 5
0
5
1 0
1 5
2 0
0 7 0 7 1 0 0 7 1 3 0 7 1 6 0 7 1 9 0 7 2 2 0 7 2 5 0 7 - 1 0
- 5
0
5
1 0
1 5
2 0
Cur
rent
vel
ocity
com
pone
nt (c
m s-1
) C
urre
nt v
eloc
ity c
ompo
nent
(cm
s-1
)
Date 2007
12
34
00 05 10 15 20
Fjord zone (year 2007)
Migratory speed (bl sminus1)
AB
C
00 05 10 15 20
Fjord zone (year 2008)
Migratory speed (bl sminus1)
1
FIGURE CAPTIONS 1
2
Figure 1 Map of the lower part of River Alta and the Alta Fjord showing the position 3
of the bag nets ( ) and the release sites ( ) ALS array 1 is indicated with () while 4
ALS arrays 2ndash5 are indicated by grey and black lines Most fish passed these ALSs in the 5
darker parts of the lines The two ALSs in the river mouth (array 6) and the three ALSs 6
(array 7) in the river are given by () The map also shows the position of the two current 7
meters in ALS array 3 ( ) the four zones (Z1ndash4) and the weather station () In the 8
following year (2008) were only array 1 3 5 and 6 present 9
10
11
Figure 2 Daily river flow (- - - - -) and water temperature (___) in the River Alta 12
13
14
Figure 3 Salinity distribution recorded at 0ndash12 m depth across ALS array 2 (a amp c) and ALS 15
array 3 (b amp d) in the Alta Fjord on 6 July (a amp b) and 13 July (c amp d) 2007 16
17
18
Figure 4 Current velocity components at 3 m depth at the north-eastern (upper panel) and 19
south-western (lower panel) side of the Alta Fjord at the ALS array 3 Positive values are 20
towards the fjord head and negative values are towards the fjord mouth indicates time of 21
individual Atlantic salmon (Salmo salar) passage 22
23
2
Figure 5 Migratory speeds of homing Atlantic salmon (Salmo salar) in the Alta Fjord in 2007 24
and 2008 In 2007 the fjord was divided into four zones (see map Fig 1) In 2008 zone A 25
was the area from ALS1ndash3 zone B from ALS3ndash5 and zone C from ALS5ndash6 The box-26
and-whisker plots give the median values (black lines) the interquartile ranges (box 50 of 27
the data falling into this) and the 5th and 95th percentiles (whiskers) 28
29
- cjfas-2012-0352-final1
-
- Homing behaviour of Atlantic salmon (Salmo salar) during final phase of marine migration and river entry
-
- Table 1-3
- Figure 1
- Figure 2
-
- Slide Number 1
-
- Figure 3
-
- Slide Number 1
-
- Figure 4
-
- Slide Number 1
-
- Figure 5
- FIGURE CAPTIONS
-

0 7 0 7 1 0 0 7 1 3 0 7 1 6 0 7 1 9 0 7 2 2 0 7 2 5 0 7 - 1 0
- 5
0
5
1 0
1 5
2 0
0 7 0 7 1 0 0 7 1 3 0 7 1 6 0 7 1 9 0 7 2 2 0 7 2 5 0 7 - 1 0
- 5
0
5
1 0
1 5
2 0
Cur
rent
vel
ocity
com
pone
nt (c
m s-1
) C
urre
nt v
eloc
ity c
ompo
nent
(cm
s-1
)
Date 2007
12
34
00 05 10 15 20
Fjord zone (year 2007)
Migratory speed (bl sminus1)
AB
C
00 05 10 15 20
Fjord zone (year 2008)
Migratory speed (bl sminus1)
1
FIGURE CAPTIONS 1
2
Figure 1 Map of the lower part of River Alta and the Alta Fjord showing the position 3
of the bag nets ( ) and the release sites ( ) ALS array 1 is indicated with () while 4
ALS arrays 2ndash5 are indicated by grey and black lines Most fish passed these ALSs in the 5
darker parts of the lines The two ALSs in the river mouth (array 6) and the three ALSs 6
(array 7) in the river are given by () The map also shows the position of the two current 7
meters in ALS array 3 ( ) the four zones (Z1ndash4) and the weather station () In the 8
following year (2008) were only array 1 3 5 and 6 present 9
10
11
Figure 2 Daily river flow (- - - - -) and water temperature (___) in the River Alta 12
13
14
Figure 3 Salinity distribution recorded at 0ndash12 m depth across ALS array 2 (a amp c) and ALS 15
array 3 (b amp d) in the Alta Fjord on 6 July (a amp b) and 13 July (c amp d) 2007 16
17
18
Figure 4 Current velocity components at 3 m depth at the north-eastern (upper panel) and 19
south-western (lower panel) side of the Alta Fjord at the ALS array 3 Positive values are 20
towards the fjord head and negative values are towards the fjord mouth indicates time of 21
individual Atlantic salmon (Salmo salar) passage 22
23
2
Figure 5 Migratory speeds of homing Atlantic salmon (Salmo salar) in the Alta Fjord in 2007 24
and 2008 In 2007 the fjord was divided into four zones (see map Fig 1) In 2008 zone A 25
was the area from ALS1ndash3 zone B from ALS3ndash5 and zone C from ALS5ndash6 The box-26
and-whisker plots give the median values (black lines) the interquartile ranges (box 50 of 27
the data falling into this) and the 5th and 95th percentiles (whiskers) 28
29
- cjfas-2012-0352-final1
-
- Homing behaviour of Atlantic salmon (Salmo salar) during final phase of marine migration and river entry
-
- Table 1-3
- Figure 1
- Figure 2
-
- Slide Number 1
-
- Figure 3
-
- Slide Number 1
-
- Figure 4
-
- Slide Number 1
-
- Figure 5
- FIGURE CAPTIONS
-
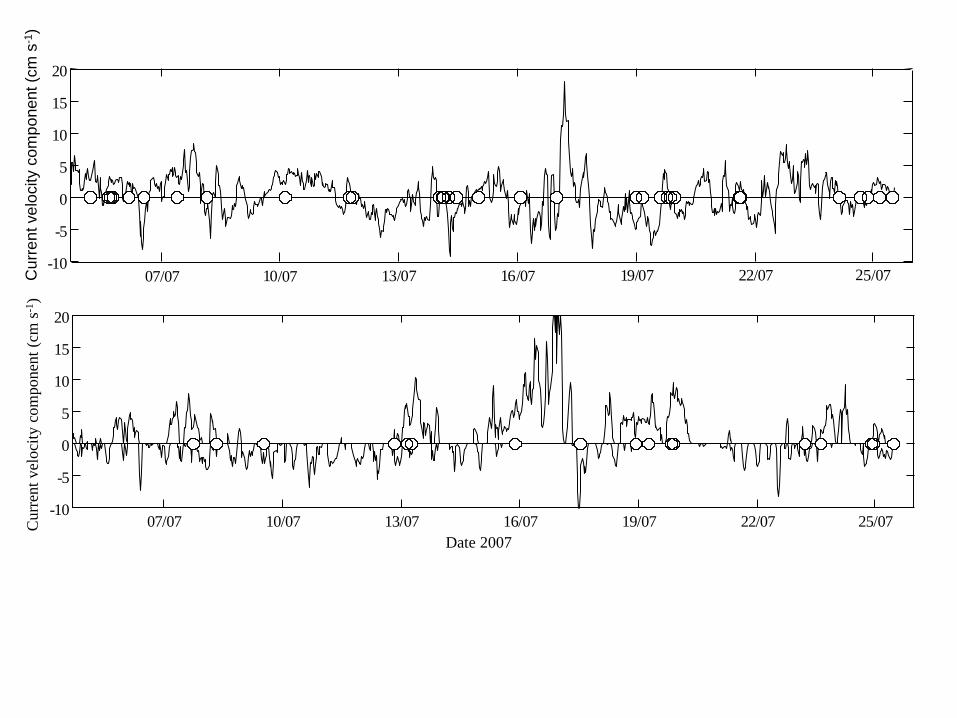
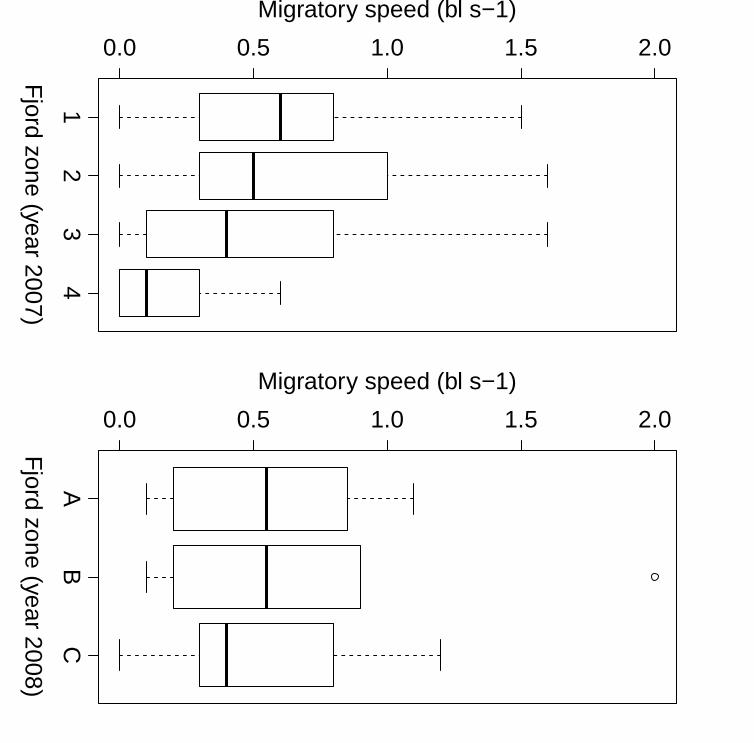