1 i247: information visualization and presentation marti hearst april 7, 2008
Post on 21-Dec-2015
216 views
TRANSCRIPT

1
i247: Information Visualization and PresentationMarti Hearst
April 7, 2008

2
Search and Text Visualization
• Nominal data is hard to visualize• Goals of search vs. text analysis
– What works well for each?

3
When people are searching …

4
Search + Viz Meta-Analysis
• Chen & Yu 2000– Individual cognitive differences among participants
had the largest effect, especially on accuracy, and to some degree on efficiency,
– Holding cognitive abilities constant, participants performed better with simpler visual-spatial interfaces than with complex ones, and
– The combined effect of visualization in the studies was not statistically significant.

5
Query Term Visualization
• Fancy Boolean viz’s are better than boolean command lines but still not used
• Term suggestions arranged as a cloud can be liked, but unlikely to be better than a simple list of term suggestions

6

7

8

9
Search Results Visualization
• Show location of term hits within retrieved documents
• TileBars was first• There have been many variations since

10
TileBars: Viewing Retrieval Results
Goal: minimize time/effort for deciding which documents to examine in detail
Idea: show the roles of the query terms in the retrieved documents, making use of document structure

11
TileBars (Hearst ’94)

12
Exploiting Visual Properties
– Variation in gray scale saturation imposes a universal, perceptual order (Bertin et al. ‘83)
– Varying shades of gray show varying quantities better than color (Tufte ‘83)
– Differences in shading should align with the values being presented (Kosslyn et al. ‘83)

13
Other Variations• HotMaps, Hoeber & Yang, Pie Charts, Anderson et al.

14
A Comparative Study• Reiterer et al., SIGIR 2000• Well-done study
– They weren’t the creators of the viz’s tested– 40 participants, varied tasks
• Compared:– Plain html web page– Sortable search results (in a table view)– Tilebars-like view– Bar charts view– Scatterplot view
• Results:– People weren’t any better with viz’s than with standard
web view. Significantly worse with bar charts– Subjective results: Sortable Table, then Tilebars, then
simple web-based view– People hated bar charts and scatter plots

15

16

17

18

19
Cluster-based Grouping
Document Self-similarity(Polythetic)

20
Scatter/Gather Clustering
• Developed at PARC in the late 80’s/early 90’s• Top-down approach
– Start with k seeds (documents) to represent k clusters– Each document assigned to the cluster with the most
similar seeds• To choose the seeds:
– Cluster in a bottom-up manner– Hierarchical agglomerative clustering
• Can recluster a cluster to produce a hierarchy of clusters
Pedersen, Cutting, Karger, Tukey, Scatter/Gather: A Cluster-based Approach to Browsing Large Document Collections, SIGIR 1992

21first page
The Scatter/Gather Interface

22first page
Two Queries: Two Clusterings
AUTO, CAR, ELECTRIC AUTO, CAR, SAFETY
The main differences are the clusters that are central to the query
8 control drive accident …
25 battery california technology …
48 import j. rate honda toyota …
16 export international unit japan
3 service employee automatic …
6 control inventory integrate …
10 investigation washington …
12 study fuel death bag air …
61 sale domestic truck import …
11 japan export defect unite …

23
Scatter/Gather Evaluations
• Can be slower to find answers than linear search!
• Difficult to understand the clusters.• There is no consistence in results.• However, the clusters do group relevant
documents together.• Participants noted that useful for eliminating
irrelevant groups.

24first page

25first page

26
Visualizing Clustering Results
• Use clustering to map the entire huge multidimensional document space into a huge number of small clusters.
• User dimension reduction and then project these onto a 2D/3D graphical representation

27
Clustering Visualizations
image from Wise et al 95

28
Clustering Visualizations
(image from Wise et al 95)

29

30

31
Koh
on
en F
eatu
re M
aps
(Lin
92
, C
hen e
t al. 9
7)

32
Are visual clusters useful?
• Four Clustering Visualization Usability Studies• Conclusions:
– Huge 2D maps may be inappropriate focus for information retrieval
• cannot see what the documents are about• space is difficult to browse for IR purposes• (tough to visualize abstract concepts)
– Perhaps more suited for pattern discovery and gist-like overviews.

33
Clustering for Search Study 1
• This study compared– a system with 2D graphical clusters– a system with 3D graphical clusters– a system that shows textual clusters
• Novice users• Only textual clusters were helpful (and
they were difficult to use well)
Kleiboemer, Lazear, and Pedersen. Tailoring a retrieval system for naive users. SDAIR’96

34
Clustering Study 2: Kohonen Feature Maps, Chen et al.
• Comparison: Kohonen Map and Yahoo• Task:
– “Window shop” for interesting home page– Repeat with other interface
• Results:– Starting with map could repeat in Yahoo (8/11)– Starting with Yahoo unable to repeat in map (2/14)
Chen, Houston, Sewell, Schatz, Internet Browsing and Searching: User Evaluations of Category Map and Concept Space Techniques. JASIS 49(7): 582-603 (1998)

35
Koh
on
en F
eatu
re M
aps
(Lin
92
, C
hen e
t al. 9
7)

36
Study 2 (cont.), Chen et al.
• Participants liked:– Correspondence of region size to # documents– Overview (but also wanted zoom)– Ease of jumping from one topic to another – Multiple routes to topics– Use of category and subcategory labels
Chen, Houston, Sewell, Schatz, Internet Browsing and Searching: User Evaluations of Category Map and Concept Space Techniques. JASIS 49(7): 582-603 (1998)

37
Study 2 (cont.), Chen et al.
• Participants wanted:– hierarchical organization– other ordering of concepts (alphabetical)– integration of browsing and search– correspondence of color to meaning – more meaningful labels– labels at same level of abstraction– fit more labels in the given space– combined keyword and category search– multiple category assignment (sports+entertain)
• (These can all be addressed with faceted categories)
Chen, Houston, Sewell, Schatz, Internet Browsing and Searching: User Evaluations of Category Map and Concept Space Techniques. JASIS 49(7): 582-603 (1998)

38
Clustering Study 3: Sebrechts et al.
Each rectangle is a cluster. Larger clusters closer to the “pole”. Similar clusters near one another. Opening a cluster causes a projection that shows the titles.

39
Study 3, Sebrechts et al.
This study compared:
– 3D graphical clusters– 2D graphical clusters– textual clusters
• 15 participants, between-subject design• Tasks
– Locate a particular document– Locate and mark a particular document– Locate a previously marked document– Locate all clusters that discuss some topic– List more frequently represented topics
Visualization of search results: a comparative evaluation of text, 2D, and 3D interfaces Sebrechts, Cugini, Laskowski, Vasilakis and Miller, SIGIR ‘99.

40
Study 3, Sebrechts et al.
• Results (time to locate targets)– Text clusters fastest– 2D next– 3D last– With practice (6 sessions) 2D neared text results; 3D still slower– Computer experts were just as fast with 3D
• Certain tasks equally fast with 2D & text– Find particular cluster– Find an already-marked document
• But anything involving text (e.g., find title) much faster with text.– Spatial location rotated, so users lost context
• Helpful viz features– Color coding (helped text too)– Relative vertical locations

41
Clustering Study 4• Compared several
factors
• Findings:– Topic effects dominate
(this is a common finding)
– Strong difference in results based on spatial ability
– No difference between librarians and other people
– No evidence of usefulness for the cluster visualization
Aspect windows, 3-D visualizations, and indirect comparisons of information retrieval systems, Swan, &Allan, SIGIR 1998.

42
Summary:Visualizing for Search Using Clusters
• Huge 2D maps may be inappropriate focus for information retrieval – cannot see what the documents are about– space is difficult to browse for IR purposes– (tough to visualize abstract concepts)
• Perhaps more suited for pattern discovery and gist-like overviews.

43
Clustering Algorithm Problems
• Doesn’t work well if data is too homogenous or too heterogeneous
• Often is difficult to interpret quickly– Automatically generated labels are unintuitive and
occur at different levels of description
• Often the top-level can be ok, but the subsequent levels are very poor
• Need a better way to handle items that fall into more than one cluster

44
Term-based Grouping
Single Term from Document Characterizes the Group
(Monothetic)

45
Findex, Kaki & Aula
• Two innovations:– Used very simple method to create the
groupings, so that it is not opaque to users• Based on frequent keywords• Doc is in category if it contains the keyword• Allows docs to appear in multiple categories
– Did a naturalistic, longitudinal study of use• Analyzed the results in interesting ways
Kaki and Aula: “Findex: Search Result Categories Help Users when Document Ranking Fails”, CHI ‘05

46

47
Study Design
• 16 academics– 8F, 8M– No CS– Frequent searchers
• 2 months of use• Special Log
– 3099 queries issued– 3232 results accessed
• Two questionnaires (at start and end)• Google as search engine; rank order retained

48
After 1 Week After 2 Months

49
Kaki & Aula Key Findings (all significant)
• Category use takes almost 2 times longer than linear– First doc selected in 24.4 sec vs 13.7 sec
• No difference in average number of docs opened per search (1.05 vs. 1.04)
• However, when categories used, users select >1 doc in 28.6% of the queries (vs 13.6%)
• Num of searches without 0 result selections is lower when the categories are used
• Median position of selected doc when:– Using categories: 22 (sd=38)– Just ranking: 2 (sd=8.6)

50
Kaki & Aula Key Findings
• Category Selections– 1915 categories selections in 817 searches– Used in 26.4% of the searches– During the last 4 weeks of use, the proportion of searches
using categories stayed above the average (27-39%)– When categories used, selected 2.3 cats on average– Labels of selected cats used 1.9 words on average
(average in general was 1.4 words)– Out of 15 cats (default):
• First quartile at 2nd cat• Median at 5th
• Third quartile at 9th

51
Kaki & Aula Survey Results
• Subjective opinions improved over time• Realization that categories useful only some of the time• Freeform responses indicate that categories useful
when queries vague, broad or ambiguous• Second survey indicated that people felt that their
search habits began to change– Consider query formulation less than before (27%)– Use less precise search terms (45%)– Use less time to evaluate results (36%)– Use categories for evaluating results (82%)

52
Conclusions from Kaki Study
• Simplicity of category assignment made groupings understandable – (my view, not stated by them)
• Keyword-based Categories: – Are beneficial when result ranking fails– Find results lower in the ranking – Reduce empty results– May make it easier to access multiple results– Availability changed user querying behavior

53
Category-based Grouping
General CategoriesDomain-Specific Categories
54
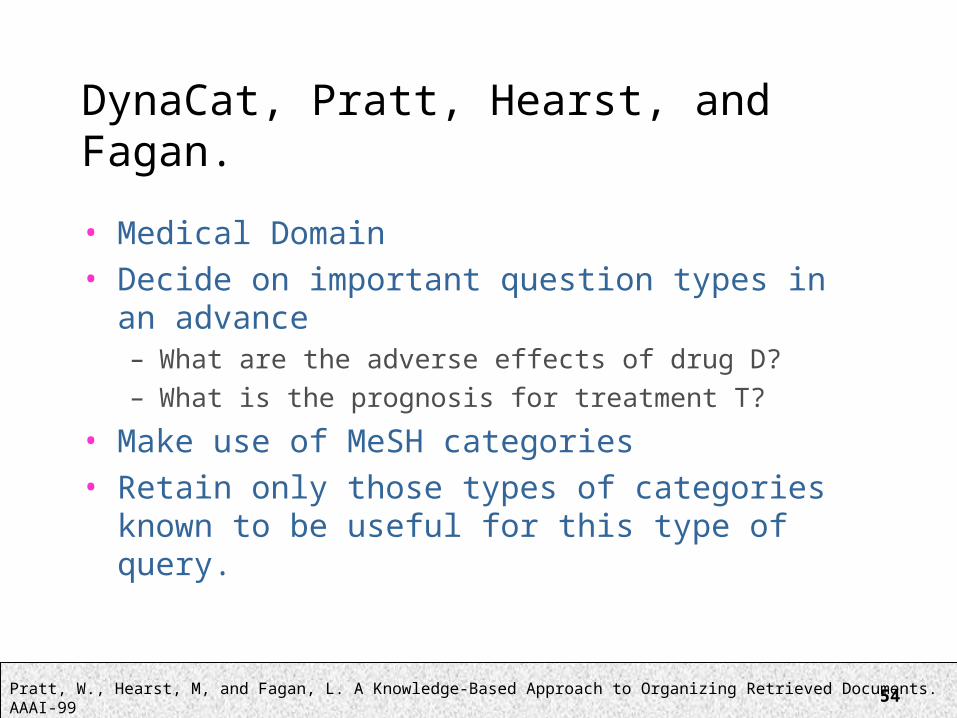
DynaCat, Pratt, Hearst, and Fagan.
• Medical Domain• Decide on important question types in an
advance– What are the adverse effects of drug D?– What is the prognosis for treatment T?
• Make use of MeSH categories• Retain only those types of categories known to
be useful for this type of query.
Pratt, W., Hearst, M, and Fagan, L. A Knowledge-Based Approach to Organizing Retrieved Documents. AAAI-99

55
DynaCat, Pratt, Hearst, & Fagan
Pratt, W., Hearst, M, and Fagan, L. A Knowledge-Based Approach to Organizing Retrieved Documents. AAAI-99

56
DynaCat Study, Pratt, Hearst & Fagan
• Design– Three queries– 24 cancer patients– Compared three interfaces
• ranked list, clusters, categories
• Results– Participants strongly preferred categories– Participants found more answers using categories– Participants took same amount of time with all three
interfaces
Pratt, W., Hearst, M, and Fagan, L. A Knowledge-Based Approach to Organizing Retrieved Documents. AAAI-99

57
DynaCat study, Pratt et al.

58
Faceted Category Navigation
Multiple Categories per Document

60
How to Structure Information for Search and Browsing?
• Hierarchy is too rigid
• Full knowledge representation is too complex
• Hierarchical faceted metadata:– A useful middle ground

61
• Inflexible– Force the user to start with a particular category– What if I don’t know the animal’s diet, but the
interface makes me start with that category?
• Wasteful– Have to repeat combinations of categories– Makes for extra clicking and extra coding
• Difficult to modify– To add a new category type, must duplicate it
everywhere or change things everywhere
The Problem with Hierarchy

62
The Idea of Facets
• Facets are a way of labeling data– A kind of Metadata (data about data)– Can be thought of as properties of items
• Facets vs. Categories– Items are placed INTO a category system– Multiple facet labels are ASSIGNED TO items

63
The Idea of Facets• Create INDEPENDENT categories (facets)
– Each facet has labels (sometimes arranged in a hierarchy)
• Assign labels from the facets to every item– Example: recipe collection
Course
Main Course
CookingMethod
Stir-fry
Cuisine
Thai
Ingredient
Bell Pepper
Curry
Chicken

65
Using Facets
• Now there are multiple ways to get to each item
Preparation Method Fry Saute Boil Bake Broil Freeze
Desserts Cakes Cookies Dairy Ice Cream Sherbet Flan
Fruits Cherries Berries Blueberries Strawberries Bananas Pineapple
Fruit > PineappleDessert > Cake
Preparation > Bake
Dessert > Dairy > SherbetFruit > Berries > Strawberries
Preparation > Freeze

66

67
Flamenco Usability Studies
• Usability studies done on 3 collections:– Recipes: 13,000 items– Architecture Images: 40,000 items– Fine Arts Images: 35,000 items
• Conclusions:– Users like and are successful with the
dynamic faceted hierarchical metadata, especially for browsing tasks
– Very positive results, in contrast with studies on earlier iterations.
Yee, K-P., Swearingen, K., Li, K., and Hearst, M., Faceted Metadata for Image Search and Browsing, in CHI 2003.

68
Flamenco Study Post-Interface Assessments
All significant at p<.05 except “simple” and “overwhelming”
Yee, K-P., Swearingen, K., Li, K., and Hearst, M., Faceted Metadata for Image Search and Browsing, in CHI 2003.
69
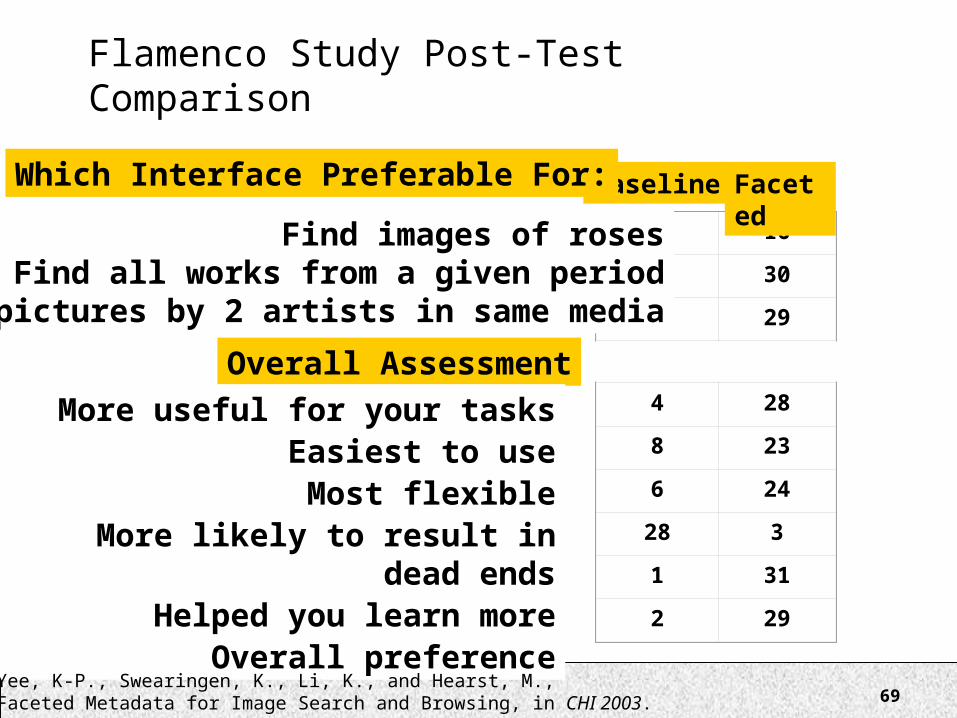
Flamenco Study Post-Test Comparison
15 16
2 30
1 29
4 28
8 23
6 24
28 3
1 31
2 29
FacetedBaseline
Overall Assessment
More useful for your tasksEasiest to useMost flexible
More likely to result in dead endsHelped you learn more
Overall preference
Find images of rosesFind all works from a given period
Find pictures by 2 artists in same media
Which Interface Preferable For:
Yee, K-P., Swearingen, K., Li, K., and Hearst, M., Faceted Metadata for Image Search and Browsing, in CHI 2003.

70
The Advantages of Facets
• Lets the user decide how to start, and how to explore and group.
• After refinement, categories that are not relevant to the current results disappear.
• Seamlessly integrates keyword search with the organizational structure.
• Very easy to expand out (loosen constraints)• Very easy to build up complex queries.
Hearst, M., Elliott, A., English, J., Sinha, R., Swearingen, K., and Yee, P., Finding the Flow in Web Site Search, Communications of the ACM, 45 (9), September 2002, pp.42-49

71
Advantages of Facets
• Can’t end up with empty results sets– (except with keyword search)
• Helps avoid feelings of being lost.• Easier to explore the collection.
– Helps users infer what kinds of things are in the collection.– Evokes a feeling of “browsing the shelves”
• Is preferred over standard search for collection browsing in usability studies.– (Interface must be designed properly)
Hearst, M., Elliott, A., English, J., Sinha, R., Swearingen, K., and Yee, P., Finding the Flow in Web Site Search, Communications of the ACM, 45 (9), September 2002, pp.42-49

72
Advantages of Facets
• Seamless to add new facets and subcategories• Seamless to add new items.• Helps with “categorization wars”
– Don’t have to agree exactly where to place something
• Interaction can be implemented using a standard relational database.
• May be easier for automatic categorization
Hearst, M., Elliott, A., English, J., Sinha, R., Swearingen, K., and Yee, P., Finding the Flow in Web Site Search, Communications of the ACM, 45 (9), September 2002, pp.42-49

73
Creative Facet Visualization• Aduna Autofocus

74
Creative Facet Visualization
• We Feel Fine

75
Creative Facet Visualization
• Fathumb mobile search interface• http://research.microsoft.com/vibe/projects/FaThumb.aspx

76
Creative Facet Visualization• Hutchinson et al.

77
Summary: Grouping Search ResultsGrouping search results seems beneficial in two circumstances:
1. General web search, using transparent labeling (monothetic terms) or category labels rather than cluster centroids.Effects: • Works primarily on ambiguous queries,
– (so used a fraction of the time)• Promotes relevant results up from below the first page of
hits– So important to group the related items together
visually• Users tend to select more documents than with linear
search• May work even better with meta-search• Positive subjective responses (small studies)• Visualization does not work.

78
Summary: Grouping Search Results
Grouping search results seems beneficial in two circumstances:
2. Collection navigation with faceted categories• Multiple angles better than single categories• “searchers” turn into “browsers”• Becoming commonplace in e-commerce,
digital libraries, and other kinds of collections• Extends naturally to tags.• Positive subjective responses

79
Summary: Viz and Search
• What works:– Careful attention to details of layout, font, color
contrast, etc, to reduce clutter– Excellent relevance– Color highlighting/boldface for query term matches– Interfaces with sorting of attributes
• What is liked:– Some visualizations of term hit patterns, as in
TileBars– Sometimes thumbnails of search results