1. intergenerational change in quebec’s english-speaking communities 2 the italian, filipino,...
TRANSCRIPT

1
Row Labels
Total - Detailed mother tongue emt_adj fmt_adj omt_adj born
Tota l - Age groups 42.6% 69.0% 38.6% 50.0% Under 5 years 9% 35% 6% 13% 2006 2010 5 to 9 years 18% 68% 9% 33% 2001 2005 10 to 14 years 31% 81% 22% 53% 1996 2000 15 to 19 years 52% 82% 46% 69% 1991 1995 20 to 24 years 60% 79% 57% 67% 1986 1990 25 to 29 years 60% 79% 58% 62% 1981 1985 30 to 34 years 58% 78% 55% 60% 1976 1980 35 to 39 years 55% 77% 53% 57% 1971 1975 40 to 44 years 52% 76% 49% 56% 1966 1970 45 to 49 years 47% 73% 43% 55% 1961 1965 50 to 54 years 43% 70% 39% 53% 1956 1960 55 to 59 years 40% 68% 37% 48% 1951 1955 60 to 64 years 40% 65% 37% 46% 1946 1950 65 to 69 years 37% 60% 35% 40% 1941 1945 70 to 74 years 33% 54% 31% 34% 1936 1940 75 years and over 28% 43% 26% 26% before 1935
Intergenerational Change in Quebec’s English-speaking Communities
2
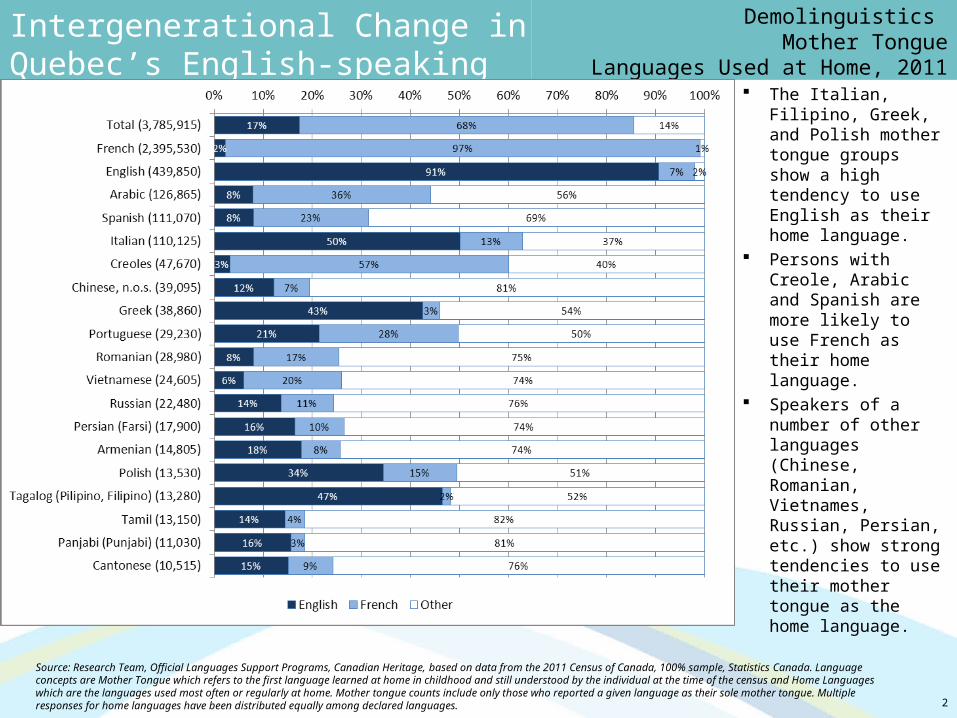
The Italian, Filipino, Greek, and Polish mother tongue groups show a high tendency to use English as their home language.
Persons with Creole, Arabic and Spanish are more likely to use French as their home language.
Speakers of a number of other languages (Chinese, Romanian, Vietnames, Russian, Persian, etc.) show strong tendencies to use their mother tongue as the home language.
Demolinguistics Mother Tongue
Languages Used at Home, 2011
Source: Research Team, Official Languages Support Programs, Canadian Heritage, based on data from the 2011 Census of Canada, 100% sample, Statistics Canada. Language concepts are Mother Tongue which refers to the first language learned at home in childhood and still understood by the individual at the time of the census and Home Languages which are the languages used most often or regularly at home. Mother tongue counts include only those who reported a given language as their sole mother tongue. Multiple responses for home languages have been distributed equally among declared languages.
Research TeamOfficial Language Support Programs Branch
Department of Canadian HeritageJanuary 24, 2013, Montreal, QC
Intergenerational Change and
Quebec’s English-speaking Communities

Intergenerational Change in Quebec’s English-speaking Communities
4
Contents
Labour Force Activity (by Language and Generation)•Unemployment levels•Unemployment by region•Out of the Labour ForceIncome (by Language and Generation)•Low income level (less than $20k)•High income level ($50k and over)
Place-based Analysis of Key Socio-economic Characteristics•Indices of Poverty and Socio-economic status

Labour Force Activity
5

Intergenerational Change in Quebec’s English-speaking Communities
6
Values Pop 15+ 15-24 25-44 45-64 65+
OL minori ty - population 15+ 835,065 134,400 313,505 254,675 132,483
OL minori ty - Unemployed 47,650 11,473 22,745 12,573 855
OL minori ty - Unemployed (%) 8.8% 8.5% 7.3% 4.9% 0.6%
OL majori ty - Unemployed (%) 6.6% 7.5% 5.2% 3.9% 0.5%
Minori ty-majori ty index (MMI) 1.33 1.14 1.39 1.27 1.20
Relative geographic index (RGI to a l l OL minori ty) 1.13 0.96 1.16 1.11 1.18
Relative geographic index (RGI to a l l of Canada) 2.02 1.02 1.44 1.37 1.22
Temporal index (2001 to 2006) 1.53 -- -- -- --
Population 15+, Quebec, 2006
Labour Force ActivityUnemployment Rate

Intergenerational Change in Quebec’s English-speaking Communities
7
Among Anglophones over the age of 15 in Quebec, 8.8% were unemployed in 2006.
This level is much higher than that of the Francophone population in Quebec (mmi=1.33) and is higher than the levels reported by other Official-Language Minority Communities across the country (rgi-all olmc=1.13).
For the younger half of the working age population (those aged 25-44), we find that the level is much higher than that of the Francophone population in this age group (mmi=1.39).
For the older half of the working age population (those aged 45-64), the level is much higher than that of the Francophones in this age group (mmi=1.27).
Labour Force ActivityUnemployment Rate

Intergenerational Change in Quebec’s English-speaking Communities
8
Labour Force ActivityOut of the Labour Force Rate
Values Pop 15+ 15-24 25-44 45-64 65+
OL minori ty - population 15+ 835,065 134,400 313,505 254,675 132,483
OL minori ty - Not in the Labour Force 296,003 57,590 54,335 67,543 116,538
OL minori ty - Not in the Labour Force (%) 35.4% 42.8% 17.3% 26.5% 88.0%
OL majori ty - Not in the Labour Force (%) 34.7% 35.5% 12.2% 29.3% 92.5%
Minori ty-majori ty index (MMI) 1.02 1.21 1.42 0.91 0.95
Relative geographic index (RGI to a l l OL minori ty) 1.00 1.13 1.17 0.95 0.98
Relative geographic index (RGI to a l l of Canada) 1.07 1.24 1.26 1.02 0.99
Tempora l index (2001 to 2006) 0.95 -- -- -- --
Population 15+, Quebec, 2006
Intergenerational Change in Quebec’s English-speaking Communities
9
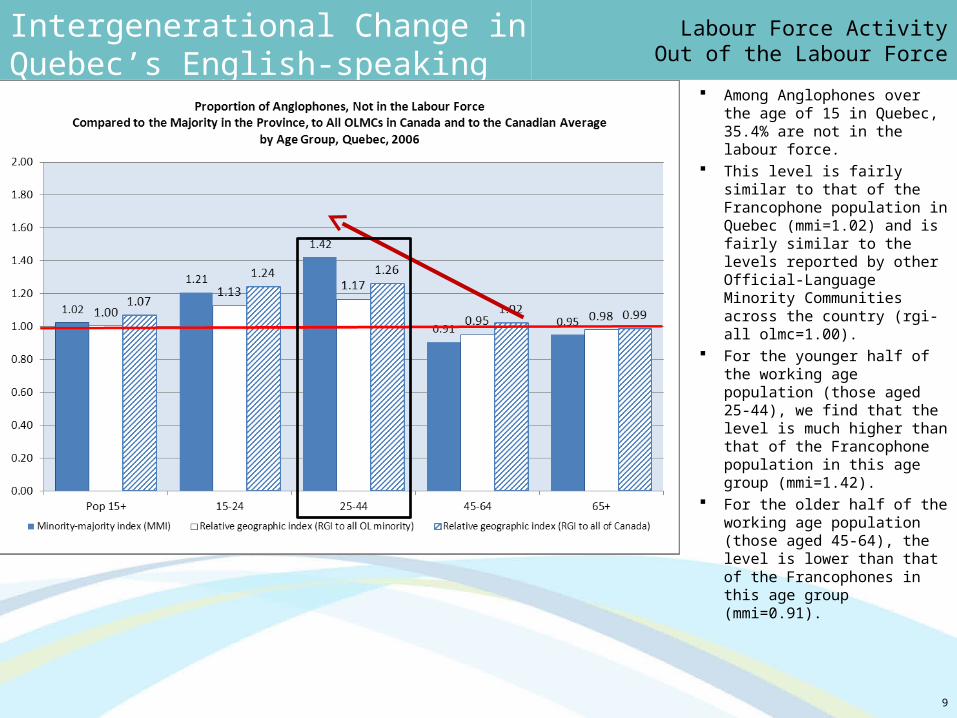
Among Anglophones over the age of 15 in Quebec, 35.4% are not in the labour force.
This level is fairly similar to that of the Francophone population in Quebec (mmi=1.02) and is fairly similar to the levels reported by other Official-Language Minority Communities across the country (rgi-all olmc=1.00).
For the younger half of the working age population (those aged 25-44), we find that the level is much higher than that of the Francophone population in this age group (mmi=1.42).
For the older half of the working age population (those aged 45-64), the level is lower than that of the Francophones in this age group (mmi=0.91).
Labour Force ActivityOut of the Labour Force
Intergenerational Change in Quebec’s English-speaking Communities
10
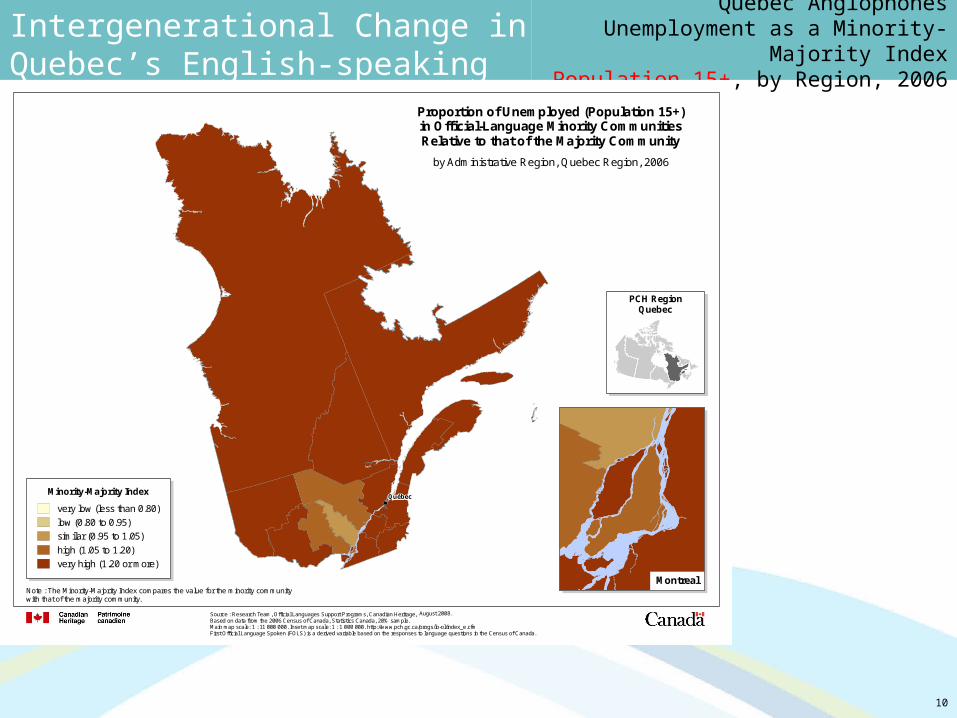
Quebec AnglophonesUnemployment as a Minority-Majority Index
Population 15+, by Region, 2006
Québec
Source : Research Team, Official Languages Support Programs, Canadian Heritage,Based on data from the 2006 Census of Canada, Statistics Canada, 20% sample.Main map scale: 1 : 11 000 000. Inset map scale: 1 : 1 000 000. http://www.pch.gc.ca/progs/lo-ol/index_e.cfmFirst Official Language Spoken (FOLS) is a derived variable based on the responses to language questions in the Census of Canada.
Minority-Majority Index
very low (less than 0.80)
low (0.80 to 0.95)
similar (0.95 to 1.05)
high (1.05 to 1.20)
very high (1.20 or more)
Proportion of Unemployed (Population 15+)in Official-Language Minority CommunitiesRelative to that of the Majority Community
by Administrative Region, Quebec Region, 2006
Note : The Minority-Majority Index compares the value for the minority community with that of the majority community.
Montreal
PCH RegionQuebec
August 2008.

Intergenerational Change in Quebec’s English-speaking Communities
11
Quebec AnglophonesUnemployment as a Minority-Majority Index
65+ Age Group, by Region, 2006
Québec
Source : Research Team, Official Languages Support Programs, Canadian Heritage,Based on data from the 2006 Census of Canada, Statistics Canada, 20% sample.Main map scale: 1 : 11 000 000. Inset map scale: 1 : 1 000 000. http://www.pch.gc.ca/progs/lo-ol/index_e.cfmFirst Official Language Spoken (FOLS) is a derived variable based on the responses to language questions in the Census of Canada.
Minority-Majority Index
very low (less than 0.80)
low (0.80 to 0.95)
similar (0.95 to 1.05)
high (1.05 to 1.20)
very high (1.20 or more)
Proportion of Unemployed (65+)in Official-Language Minority CommunitiesRelative to that of the Majority Community
by Administrative Region, Quebec Region, 2006
Note : The Minority-Majority Index compares the value for the minority community with that of the majority community.
Montreal
PCH RegionQuebec
August 2008.

Intergenerational Change in Quebec’s English-speaking Communities
12
Quebec AnglophonesUnemployment as a Minority-Majority Index
45-64 Age Group, by Region, 2006
Québec
Source : Research Team, Official Languages Support Programs, Canadian Heritage,Based on data from the 2006 Census of Canada, Statistics Canada, 20% sample.Main map scale: 1 : 11 000 000. Inset map scale: 1 : 1 000 000. http://www.pch.gc.ca/progs/lo-ol/index_e.cfmFirst Official Language Spoken (FOLS) is a derived variable based on the responses to language questions in the Census of Canada.
Minority-Majority Index
very low (less than 0.80)
low (0.80 to 0.95)
similar (0.95 to 1.05)
high (1.05 to 1.20)
very high (1.20 or more)
Proportion of Unemployed (45-64)in Official-Language Minority CommunitiesRelative to that of the Majority Community
by Administrative Region, Quebec Region, 2006
Note : The Minority-Majority Index compares the value for the minority community with that of the majority community.
Montreal
PCH RegionQuebec
August 2008.

Intergenerational Change in Quebec’s English-speaking Communities
13
Quebec AnglophonesUnemployment as a Minority-Majority Index
25-44 Age Group, by Region, 2006
Québec
Source : Research Team, Official Languages Support Programs, Canadian Heritage,Based on data from the 2006 Census of Canada, Statistics Canada, 20% sample.Main map scale: 1 : 11 000 000. Inset map scale: 1 : 1 000 000. http://www.pch.gc.ca/progs/lo-ol/index_e.cfmFirst Official Language Spoken (FOLS) is a derived variable based on the responses to language questions in the Census of Canada.
Minority-Majority Index
very low (less than 0.80)
low (0.80 to 0.95)
similar (0.95 to 1.05)
high (1.05 to 1.20)
very high (1.20 or more)
Proportion of Unemployed (25-44)in Official-Language Minority CommunitiesRelative to that of the Majority Community
by Administrative Region, Quebec Region, 2006
Note : The Minority-Majority Index compares the value for the minority community with that of the majority community.
Montreal
PCH RegionQuebec
August 2008.

Intergenerational Change in Quebec’s English-speaking Communities
14
Quebec AnglophonesUnemployment as a Minority-Majority Index
15-24 Age Group, by Region, 2006
Québec
Source : Research Team, Official Languages Support Programs, Canadian Heritage,Based on data from the 2006 Census of Canada, Statistics Canada, 20% sample.Main map scale: 1 : 11 000 000. Inset map scale: 1 : 1 000 000. http://www.pch.gc.ca/progs/lo-ol/index_e.cfmFirst Official Language Spoken (FOLS) is a derived variable based on the responses to language questions in the Census of Canada.
Minority-Majority Index
very low (less than 0.80)
low (0.80 to 0.95)
similar (0.95 to 1.05)
high (1.05 to 1.20)
very high (1.20 or more)
Proportion of Unemployed (15-24)in Official-Language Minority CommunitiesRelative to that of the Majority Community
by Administrative Region, Quebec Region, 2006
Note : The Minority-Majority Index compares the value for the minority community with that of the majority community.
Montreal
PCH RegionQuebec
August 2008.

Intergenerational Change in Quebec’s English-speaking Communities
15
Quebec AnglophonesUnemployment as a Minority-Majority Index
Population 15+, by Census Division, 2006
Québec
Source : Research Team, Official Languages Support Programs, Canadian Heritage,Based on data from the 2006 Census of Canada, Statistics Canada, 20% sample.Main map scale: 1 : 11 000 000. Inset map scale: 1 : 1 000 000. http://www.pch.gc.ca/progs/lo-ol/index_e.cfmFirst Official Language Spoken (FOLS) is a derived variable based on the responses to language questions in the Census of Canada.
Minority-Majority Index
very low (less than 0.80)
low (0.80 to 0.95)
similar (0.95 to 1.05)
high (1.05 to 1.20)
very high (1.20 or more)
Proportion of Unemployed (Popualtion 15+)in Official-Language Minority CommunitiesRelative to that of the Majority Community
by Census Division, Quebec Region, 2006
Note : The Minority-Majority Index compares the value for the minority community with that of the majority community.
Montreal
PCH RegionQuebec
August 2008.
Income and Poverty
16
Intergenerational Change in Quebec’s English-speaking Communities
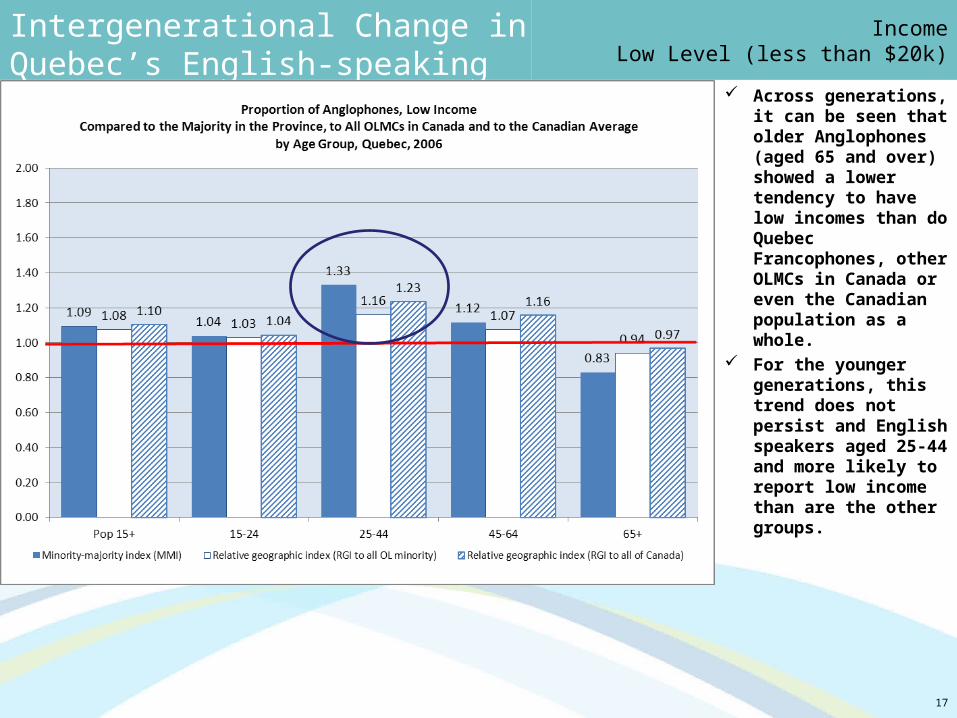
Across generations, it can be seen that older Anglophones (aged 65 and over) showed a lower tendency to have low incomes than do Quebec Francophones, other OLMCs in Canada or even the Canadian population as a whole.
For the younger generations, this trend does not persist and English speakers aged 25-44 and more likely to report low income than are the other groups.
17
IncomeLow Level (less than $20k)

Intergenerational Change in Quebec’s English-speaking Communities
18
Tendency to have low income (less than $20k) for 25-44 cohort compared to majority in the region
and to the provincial Anglophone cohort, 2006
Intergenerational Change in Quebec’s English-speaking Communities
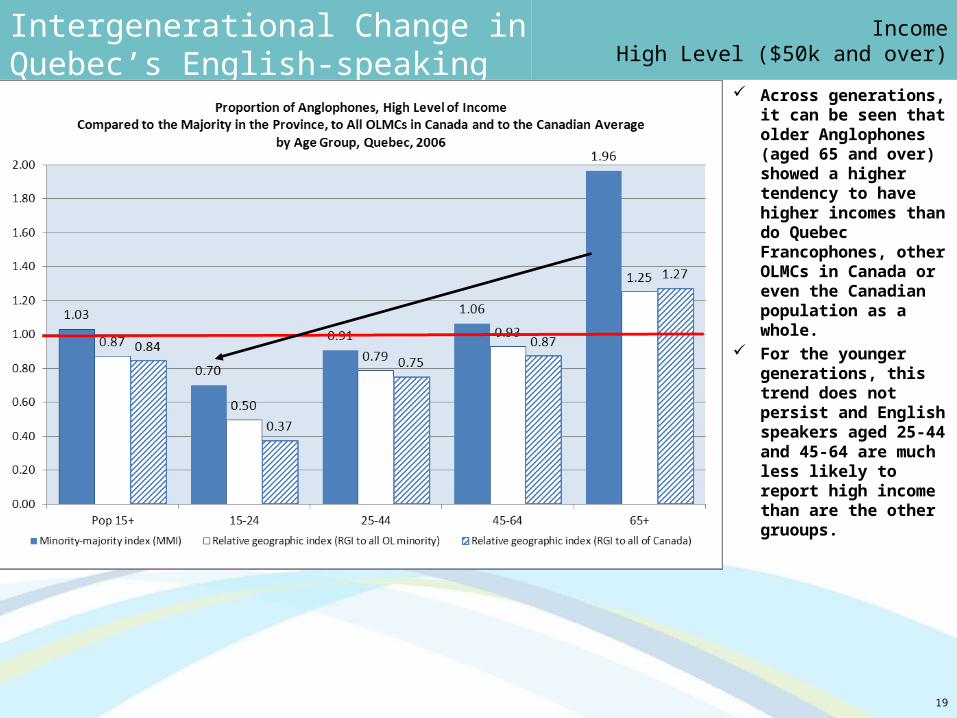
Across generations, it can be seen that older Anglophones (aged 65 and over) showed a higher tendency to have higher incomes than do Quebec Francophones, other OLMCs in Canada or even the Canadian population as a whole.
For the younger generations, this trend does not persist and English speakers aged 25-44 and 45-64 are much less likely to report high income than are the other gruoups.
19
IncomeHigh Level ($50k and over)

Indices of Poverty and Socioeconomic StatusProvince of Quebec and Montreal CMA
20

Intergenerational Change in Quebec’s English-speaking Communities
21
Socio-Economic EnvironmentEnglish Language Public System, 2010
Source: Research Team, Official Languages Support Programs, Canadian Heritage, based on data from the 2011 Census of Canada, 100% sample, Statistics Canada and MÉLS schools database.

Intergenerational Change in Quebec’s English-speaking Communities
22
Socio-economic Environment of English-Language Schools in the CMA of Montreal
Source: Research Team, Official Languages Support Programs, Canadian Heritage, based on data from the 2011 Census of Canada, 100% sample, Statistics Canada and MÉLS schools database.

Intergenerational Change in Quebec’s English-speaking Communities
23
Incidence of Poverty in the Catchment Areas of English-Language Schools, Quebec
Source: Research Team, Official Languages Support Programs, Canadian Heritage, based on data from the 2011 Census of Canada, 100% sample, Statistics Canada and MÉLS schools database.

Intergenerational Change in Quebec’s English-speaking Communities
24
Incidence of Poverty in the Catchment Areas of English-Language Schools, Montreal CMA
Source: Research Team, Official Languages Support Programs, Canadian Heritage, based on data from the 2011 Census of Canada, 100% sample, Statistics Canada and MÉLS schools database.
Intergenerational Change in Quebec’s English-speaking Communities
William Floch ([email protected])Martin Durand ([email protected])Elias Abou-Rjeili ([email protected])Research TeamOfficial Languages Support ProgramsCanadian Heritage15-7, EddyGatineau (Quebec) K1A 0M5
Contact