1 interpretation of pips feedback in the classroom setting [email protected]
TRANSCRIPT


2
PIPS On-entry Baseline

3
Personal, Social and Emotional Development

4
Raw Scores

5
Scores Table
fi rst name last name maths reading phonics total maths reading phonics total
Kyle Example 13 7 0 20 40 31 Under 40 32
Amy Example 10 17 1 28 36 41 Under 40 36
Tina Example 11 16 3 30 37 40 Under 40 37
Stacey Example 16 10 5 31 43 34 43 37
Joe Example 13 16 3 32 40 40 Under 40 38
Ryan Example 15 15 10 40 42 39 53 42
Joshua Example 14 24 2 40 41 49 Under 40 42
Wayne Example 17 22 2 41 44 47 Under 40 43
Brandon Example 24 16 2 42 50 40 Under 40 43
Sean Example 22 14 9 45 48 38 51 44
Kate Example 14 27 5 46 41 52 43 45
Katie Example 20 23 4 47 46 48 41 45
Lewis Example 16 25 6 47 43 50 45 45
Corban Example 22 21 6 49 48 46 45 46
Thomas Example 26 26 1 53 52 51 Under 40 48
Elizabeth Example 28 21 7 56 54 46 47 49
Sophie Example 21 30 6 57 47 54 45 49
Tiegan Example 26 28 5 59 52 52 43 50
Joseph Example 25 33 7 65 51 56 47 53
Liam Example 29 25 12 66 55 50 56 53
Jordan Example 26 32 13 71 52 55 58 55
Chloe Example 33 29 10 72 60 53 53 55
Cory Example 33 31 8 72 60 55 49 55
standardised scoresraw scores

6
Start of Reception – Box and Whisker
Standardised Scores25 30 35 40 45 50 55 60 65 70 75
Who
le g
roup
Who
le g
roup
Mat
hsR
eadi
ng

7
0 50 100 150 200
Cory Example
Chloe Example
Jordan Example
Joseph Example
Liam Example
Tiegan Example
Thomas Example
Sophie Example
Elizabeth Example
Katie Example
Corban Example
Lewis Example
Kate Example
Wayne Example
Joshua Example
Brandon Example
Sean Example
Ryan Example
Joe Example
Tina Example
Amy Example
Stacey Example
Kyle Example
standardised scores
phonicsreadingmaths
8
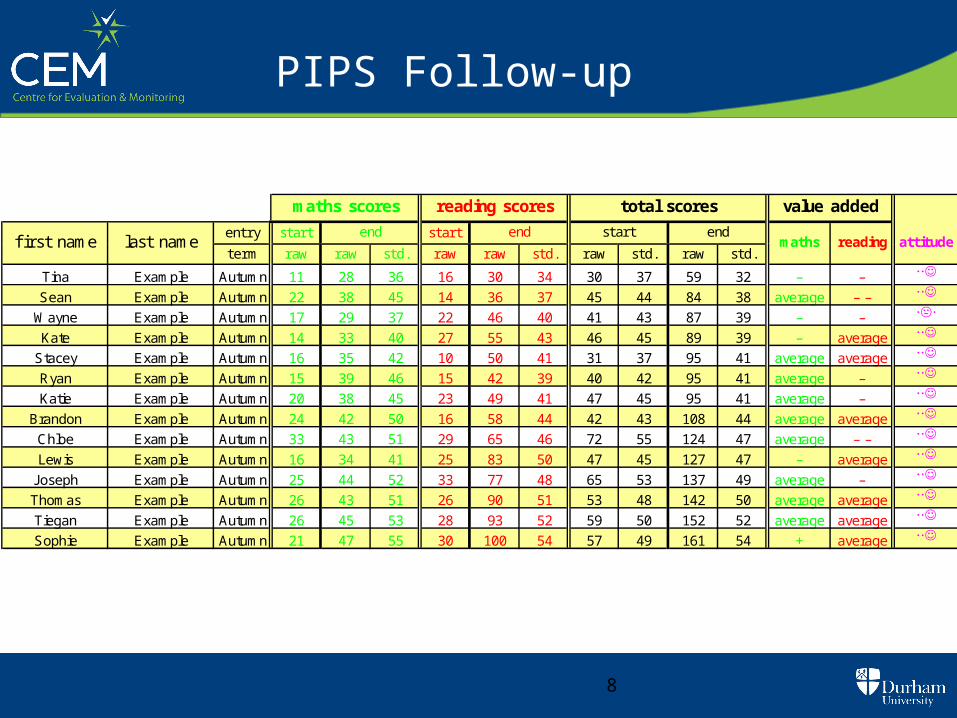
PIPS Follow-up
entry start start
term raw raw std. raw raw std. raw std. raw std.
Tina Example Autumn 11 28 36 16 30 34 30 37 59 32 – –
Sean Example Autumn 22 38 45 14 36 37 45 44 84 38 average – –
Wayne Example Autumn 17 29 37 22 46 40 41 43 87 39 – –
Kate Example Autumn 14 33 40 27 55 43 46 45 89 39 – average
Stacey Example Autumn 16 35 42 10 50 41 31 37 95 41 average average
Ryan Example Autumn 15 39 46 15 42 39 40 42 95 41 average –
Katie Example Autumn 20 38 45 23 49 41 47 45 95 41 average –
Brandon Example Autumn 24 42 50 16 58 44 42 43 108 44 average average
Chloe Example Autumn 33 43 51 29 65 46 72 55 124 47 average – –
Lewis Example Autumn 16 34 41 25 83 50 47 45 127 47 – average
Joseph Example Autumn 25 44 52 33 77 48 65 53 137 49 average –
Thomas Example Autumn 26 43 51 26 90 51 53 48 142 50 average average
Tiegan Example Autumn 26 45 53 28 93 52 59 50 152 52 average average
Sophie Example Autumn 21 47 55 30 100 54 57 49 161 54 + average
maths reading attitudefi rst name last nameendstartendend
total scores value addedreading scoresmaths scores

9
0
10
20
30
40
50
60
Ra
w S
core
s (
Sta
rt)
Local average National average
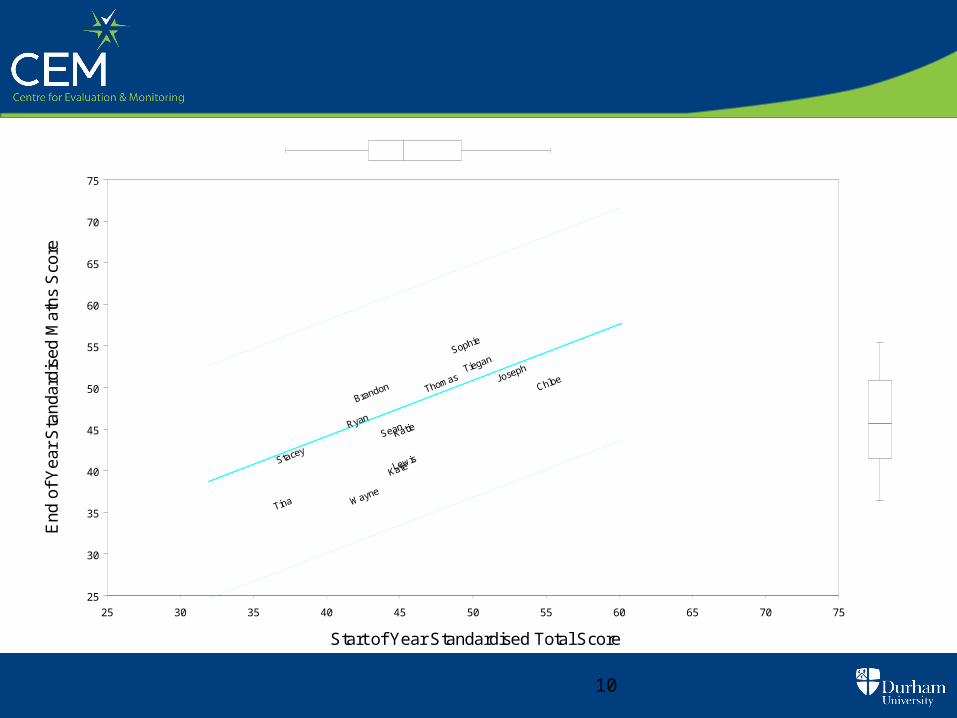
10
Start of Year Standardised Total Score
End
of
Yea
r S
tand
ardi
sed
Mat
hs S
core
Sean
Sophie
Thomas
Brandon
Lewis
KatieRyan
Wayne
Kate
JosephTiegan
Tina
Chloe
Stacey
25
30
35
40
45
50
55
60
65
70
75
25 30 35 40 45 50 55 60 65 70 75

11
PIPS Y1 - 6 Predictors
picture non verbal
class name vocabulary ability context prior maths readingEXAMPLE Susan 72 42 60 * 41 33EXAMPLE Luke 38 61 49 43 43 32EXAMPLE John 47 45 46 * 35 42EXAMPLE Andrew 50 57 52 46 44 37EXAMPLE Sarah 49 42 46 47 51 34EXAMPLE Helen 46 45 45 42 45 44EXAMPLE Vicky 45 44 45 45 51 43EXAMPLE Harry 56 34 47 45 48 46EXAMPLE Kate 52 44 48 42 52 43EXAMPLE Christine 55 49 51 50 47 50EXAMPLE Stephen 56 49 53 * 45 52EXAMPLE Karen 53 61 56 46 52 48EXAMPLE Roger 50 33 42 35 56 45EXAMPLE Scott 53 60 56 45 56 49EXAMPLE Daniel 58 52 54 52 61 48EXAMPLE Michael 55 60 57 53 61 50EXAMPLE Christopher * * * 55 61 53EXAMPLE Faye 59 67 62 63 53 62EXAMPLE Chloe 50 71 57 * 58 58EXAMPLE Callum 55 67 60 53 55 65EXAMPLE Andrew 56 69 61 59 56 64EXAMPLE Brian 61 47 54 52 67 53EXAMPLE Nicole 58 63 57 * 63 63EXAMPLE David 61 70 64 59 65 62EXAMPLE Amanda 75 70 71 71 61 66
Attainment
12
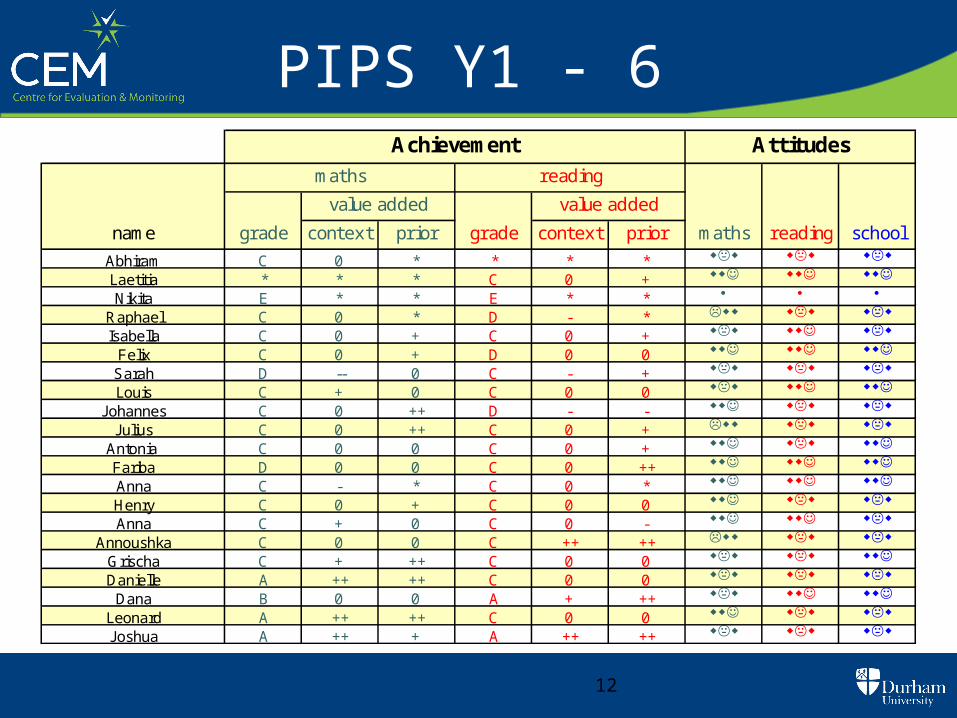
PIPS Y1 - 6Attitudes
name grade context prior grade context prior maths reading school
Abhiram C 0 * * * * ww ww wwLaetitia * * * C 0 + ww ww wwNikita E * * E * *
Raphael C 0 * D - * Lww ww wwIsabella C 0 + C 0 + ww ww ww
Felix C 0 + D 0 0 ww ww wwSarah D -- 0 C - + ww ww wwLouis C + 0 C 0 0 ww ww ww
Johannes C 0 ++ D - - ww ww wwJulius C 0 ++ C 0 + Lww ww ww
Antonia C 0 0 C 0 + ww ww wwFariba D 0 0 C 0 ++ ww ww wwAnna C - * C 0 * ww ww wwHenry C 0 + C 0 0 ww ww wwAnna C + 0 C 0 - ww ww ww
Annoushka C 0 0 C ++ ++ Lww ww wwGrischa C + ++ C 0 0 ww ww wwDanielle A ++ ++ C 0 0 ww ww ww
Dana B 0 0 A + ++ ww ww wwLeonard A ++ ++ C 0 0 ww ww wwJoshua A ++ + A ++ ++ ww ww ww
Achievement
value added
maths reading
value added

13
PIPS Y1 - 6Predictors
picture non verbal
name vocabulary ability context prior maths reading
Abhiram 45 44 44 * 44 *Laetitia 46 56 52 48 * 53Nikita * * * * 34 32
Raphael 40 48 45 * 45 41Isabella 37 47 43 37 44 44
Felix 49 30 37 43 46 43Sarah 49 67 62 42 42 48Louis 35 40 33 44 47 46
Johannes 44 48 46 46 53 40Julius 38 53 46 40 48 46
Antonia 37 49 44 44 47 47Fariba 39 45 43 43 43 52Anna 48 53 51 * 44 55Henry 46 46 46 47 53 48Anna 42 56 49 54 56 47
Annoushka 50 36 39 49 47 56Grischa 40 53 47 49 56 49Danielle 34 56 46 49 68 51
Dana 59 57 60 58 57 65Leonard 47 66 61 57 69 53Joshua 57 59 60 63 68 71
Attainment

14
PIPS Y1 - 6
Maths Level Reading Level Writing Level< 1 2C 2B 2A 3 4 > < 1 2C 2B 2A 3 4 > < 1 2C 2B 2A 3 4 >
Filter Average 8 18 29 22 24 0 18 16 23 19 24 0 13 32 31 16 8 0Abhiram 11 32 38 15 4 0 30 27 27 12 5 0 20 48 26 4 0 0Laetitia 1 8 28 34 29 0 3 8 24 30 36 0 2 22 43 26 7 0Nikita 61 30 9 1 0 0 86 11 3 0 0 0 85 13 2 0 0 0
Raphael 11 32 38 15 4 0 36 27 25 9 3 0 25 49 23 3 0 0Isabella 11 32 38 15 4 0 30 27 27 12 5 0 20 48 26 4 0 0
Felix 14 35 36 12 3 0 36 27 25 9 3 0 25 49 23 3 0 0Sarah 3 15 37 29 16 0 10 17 31 24 18 0 9 40 38 11 1 0Louis 14 35 36 12 3 0 30 27 27 12 5 0 17 47 30 6 0 0
Johannes 4 18 38 27 13 0 36 27 25 9 3 0 20 48 26 4 0 0Julius 5 22 39 24 10 0 21 24 31 17 9 0 14 45 33 7 1 0
Antonia 7 25 40 21 8 0 17 22 31 19 11 0 11 43 36 9 1 0Fariba 9 29 39 18 6 0 10 17 31 24 18 0 7 37 40 14 2 0Anna 4 18 38 27 13 0 3 8 24 30 36 0 3 26 43 23 5 0Henry 2 12 34 31 20 0 10 17 31 24 18 0 7 37 40 14 2 0Anna 1 8 28 34 29 0 10 17 31 24 18 0 5 33 42 17 3 0
Annoushka 5 22 39 24 10 0 4 10 26 29 31 0 3 26 43 23 5 0Grischa 1 8 28 34 29 0 8 14 30 26 22 0 4 29 43 20 4 0Danielle 0 1 9 28 63 0 3 8 24 30 36 0 1 16 40 32 11 0Dana 0 1 7 25 67 0 0 0 5 19 76 0 0 3 19 41 37 0
Leonard 0 0 3 19 77 0 0 2 12 27 59 0 0 8 32 39 20 0Joshua 0 0 2 14 84 0 0 0 1 11 88 0 0 0 5 28 67 0
Keystage One Chances (%)

15
Prior and Context Value-Added
Context
Uses the context section as a measure of developed ability from which attainment is predicted.
Prior
Uses the score from a previous PIPS assessment to predict attainment. This assesses progress over time.
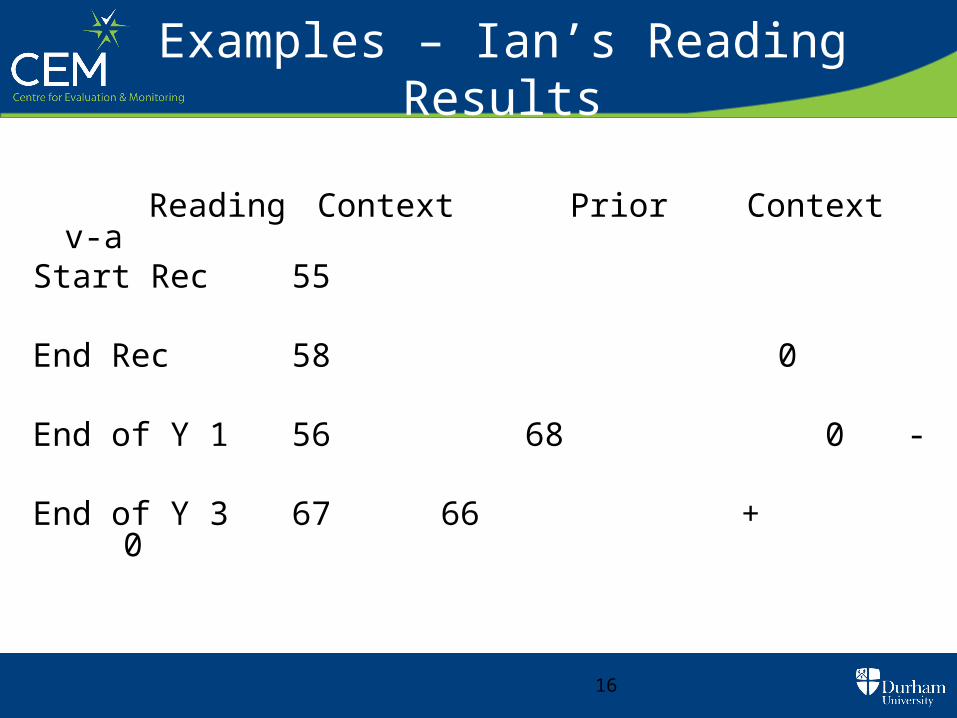
16
Examples – Ian’s Reading Results
Reading Context Prior Context v-a
Start Rec 55
End Rec 58 0
End of Y 1 56 68 0 -
End of Y 3 67 66 + 0

17
Examples – Katy’s Maths Results
Maths Context Prior Context v-a
Start Rec 35
End Rec 45 +
End of Y 1 58 48 + +
End of Y 3 57 47 0 +

18
Examples – Florence’s Reading Results
Read Context Prior Context v-a
Start Rec 51
End Rec 35 - -
Year 2 30 52 - - -

19
PIPS Y1 - 6
Context
Mat
hs
JoshuaLeonard
Dana
Danielle
Grischa
Annoushka
Anna
Henry
Anna
Fariba
Antonia Julius
Johannes
Louis
Sarah
Felix
IsabellaRaphael
Abhiram
25
30
35
40
45
50
55
60
65
70
75
25 30 35 40 45 50 55 60 65 70 75

20
PIPS Y1 - 6
Prior
Mat
hs
JoshuaLeonard
Dana
Danielle
Grischa
Annoushka
Anna
Henry
Fariba
AntoniaJulius
Johannes
Louis
Sarah
Felix
Isabella
25
30
35
40
45
50
55
60
65
70
75
25 30 35 40 45 50 55 60 65 70 75

21
Group Grids
LouisGrischa
Henry
JoshuaLeonard
Dana
>>>Danielle>>>
Annoushka
Anna
Fariba
Antonia Julius
Johannes
<<<Sarah<<<
Felix
Isabella
-15
-5
5
15
-15 -5 5 15
Prior Value-added
Co
nc
urr
en
t V
alu
e-a
dd
ed
Doing better than expected, however they are no longer as far ahead as they used to be
Doing better than expected and this may have been a consistent characteristic over time
Probably on track before, they have made excellent progress and have now moved
further ahead
Doing as well as expected. However, they have moved from a position where they were
ahead of similar children
On track and is probably a consistent characteristic over time
Probably underachieving before, however they have made excellent progress and are now on
track.
Probably on track before but has fallen behind and is now underachieving
Underachieving and this may have been a consistent characteristic over time
Probably underachieving before. They have made good progress but they still have some
catching up to do