1. introduction 2. available systems - chemické · pdf fileduced manual preparation....
TRANSCRIPT

Chem. Listy 103, s1−s148 (2009) PMA 2009 & 20th SRC 2009 Contributed Lectures
s82
CL-19 THERMAL DESORPTION � PROGRESSIVE WAY OF ANALYTICAL CHEMISTRY ON PLASTICS AND RUBBERS FRANKY PUYPE and JIŘÍ SAMSONEK Institute for Testing and Certification � Zlín, Třida T. Bati 299,CZ-764 21 Zlín-Louky [email protected] 1. Introduction
Thermal desorption (TD) is the last decade a sampling technology in evolution. The main applications are supporting the automotive and building material industry as well the environmental sector.
This evolution goes simultaneously with the complaints about odors and emissions of volatile organic compounds from plastic/rubber material causing a major problem for indoor air quality. This paper describes briefly the analytical approach of analyzing a broad range of plastic/rubber materi-als with thermal desorption gas chromatography coupled with mass spectrometry (TD-GC-MS).
Thermal desorption is defined as a sampling technology that utilizes heat to increase the volatility of analytes such that they can be removed (separated) from the solid matrix (plastics, wood, textile, extracts, foam, hair, gel, paint, etc.). Thermal desorption allows analysis of almost all sorts of ma-terials including insoluble materials and complex materials at trace levels without any pretreatment of samples.
TD-GC-MS is used since short time in many applica-tions due to the many advantages compared to conventional solvent-based sample preparation methods like solvent extrac-tion, solvent exchange and steam distillation. Advantages of thermal desorption are mainly: − 1000 fold improvement of the sensitivity because there
is no solvent needed which is diluting the interested analyte. A good sensitivity is needed when looking for ultra-trace compounds
− Automation: vapours or test materials are collected/weighted into sample tubes or cups and directly intro-duced on the thermal desorber unit.
− There is no additional sample preparation required. This is saving time and costs. Conventional analytical meth-ods like gas chromatography, thin layer chromatography (TLC) and liquid chromatography (HPLC) require a time consuming liquid extraction.
− Nearly no sample contamination is possible due to re-duced manual preparation.
− There is selective focus on compounds of interests with-out interferences like water.
− There is no contamination from solvent peaks. The chro-matographical data is coming from the sample itself.
− The adsorbent tubes are reusable, the solvent consump-tion is lead to a minimum. It eliminates the envirionmen-tal health and safety issues. There are 2 basic possibilities for sampling. The first
possibility is the easiest. The sample is direct desorbed as it
was placed into a sample tube or cup used for TD-GC-MS. The second possibility is the purge and trapping of air or va-pours from a solid sample on sorbent tubes followed by TD-GC-MS.
This purge and trapping process is mostly done by off-line process (emission chamber technique and on-site air qual-ity measurement). The on-line trapping process is practically done by refocusing thermal desorption instruments (chapter 2.2). The sorbent has to be chosen according to the analyte which is required. There are on the market lots of sorbent materials available that for each application there exists a sorbent however nowadays there are more universal trap-ping materials used like carbon absorbent material (carbotrap) and polymeric adsorbents (TENAX TA). They can according to the application be used as mixed combinations (TENAX GR). All of them have a low affinity for water and methanol.
The thermal desorption range varies from very volatiles (Bp 0 °C) till the �heavies� from the semi-volatile class (Bp 400 °C, MW approx. 1000 g mol−1). The use of temperatures higher than 400 °C will lead to a C-C bound cleavage. This is not favored due to the pyrolysis process of the analyte and the polymer matrix as well. 2. Available systems
Below are given the commercial systems available for thermal desorption at this moment. They are devided accord-ing the injection technique however all are based on the same processes: desorbing, separating and detecting. 2.1. Direct thermal desorption
The easiest commercial thermal desorption systems are direct thermal desorption systems. The sample is transported to a furnace and at certain temperature heated. The evolved gasses are going immediately to the beginning of the analyti-cal column and the analysis starts. Direct thermal desorption is mainly used for fast screening or quantitative analysis of high mol weight compounds (up till 1000 g mol−1). The main application with direct thermal desorption are the identifica-tion of antioxidants/brominated flame retardants in plastic materials and accelerators/stabilisers in rubbers. Fig. 1 shows a schematic presentation of direct thermal desorption system.
There are a number of considerations to be made for this analysis. Firstly the sample needs to be very small (max. 10 mg) and therefore the sample should be sufficiently homo-geneous. The sample needs to have a relatively high surface area. This surface area is needed to have an optimum diffu-sion process from inside the polymer/rubber to the gas stream.
Fig. 1. Schematic presentation of direct thermal desorption sys-tem
SAMPLE
Sample tube heated
Thermal desorption
GCMS

Chem. Listy 103, s1−s148 (2009) PMA 2009 & 20th SRC 2009 Contributed Lectures
s83
2.2. Refocusing thermal desorption (cold trap)
A more complex thermal desorption system is refo-cussing thermal desorption. The sample is transported into a furnace and the evolved gasses are refocussed on a cooled adsorption tube with TENAX TA. Refocusing is a collection technique. A volume of several liters of gas is pulled over an adsorption tube. Permanent gasses pass the tube while mole-cules with higher molecular weight remains on the absorbent in the sample tube. Refocusing is done by cooling. The injec-tion exists of fast heating of this TENAX TA trap and evapo-rating the analytes towards the analytical column.
Refocusing thermal desoption has the advantage that the analytical peaks are far sharper and the sensitivity is bigger. The TENAX TA trapping material has a high capacity and it is possible to refocus the analytes for a longer time. This longer trapping time is required for quantitative analysis.
The thermal desorption unit used for this paper was a TD-20 system (Shimadzu) with Peltier cooling/programable tempearture vaporising injector. The advantage of the TD-20 systems is that they have a reverse sample path. The sample leaves the TENAX TA tube in opposite direction than it was trapped (Fig. 2).
2.3. Emission chamber-TD-GC-MS
The test chamber method followed by thermal desorp-tion is an analysis which is associated with the �sick building syndrome� for building materials but can also applied for testing of car materials and air quality measurements. Sick building syndrome (SBS) is a combination of ailments associ-ated with an individual's place of work (office building) or residence. A 1984 World Health Organization report into the syndrome suggested up to 30 % of new and remodelled build-ings worldwide may be linked to symptoms of SBS. Most of the sick building syndrome is related to poor indoor air qual-ity.
The principle of the emission chamber can be explained that the sample is staying at certain conditions (temperature and humidity) in an emission chamber. The most influencing factor is the air exchange rate. It is possible to regulate the flow and change the air by continue stream. The air can flow over an adsorbent tube filled with an appropriate trapping material (Fig. 3). The emissions can be measured by perform-
ing refocusing TD-GC-MS analysis of the adsorbent tube. The main application with this chamber is the ISO 16000 emission chamber test for building material. However the automotive industry needs a similar testing for characterizing air quality in car interiors.
The emission chamber can predict long term emissions for real areas like car interior or rooms. The mass spectrome-try detection can not only detect the real emissions and odor but also give understanding of the reaction mechanism be-tween emissions. It is known that carpets and water based adhesives might cause a reaction between the hydrolysed phenoxypropanol and the inorganic bromine from the latex textile covering. This is resulting in formation of smelling bromophenols. 2.4. Evolved-Gas-Analysis (EGA)
Evolved gas analysis is a thermal analysis which deter-minates evolved products at certain temperature. The polymer sample is placed in a desorption unit and the evolved gasses are immediately detected by GC-MS. This analysis doesn`t need chromatographical separation due to the quick gas flow in the system. The analysis result is a graph with in abscissa the desorption temperatures and in ordinate the identified volatile and its intensity. Evolved gas analysis is comparable with thermal gravimetrical analysis but has the advantage to give the exact compound identification due to the mass spec-trometrical detection (Fig. 4).
This method is mostly used to optimize the production process temperatures. Sometimes during polymer preparing processes some unexpected thermal reactions might occur or component loss. A sim ulation of the production process can learn a lot about the behavior of the blended compounds. This is applicable for rubber blends as well for polyolefin/condensed polymers.
Fig. 2. Schematic presentation of a refocusing thermal desorption system
SAMPLE
Sample tube heated
Thermal desorption
Cold Trap (refocussation)
0000000000000000000000000000
GCMS
Trapping material GCMS
SAMPLEPurge gas in
Inert sample
chamber
Fig. 3. Schematic presentation of a test chamber system
SAMPLE
Sample tube heated
Evolved gas tubeMS
Fig. 4. Schematic presentation of a the EGA analysis

Chem. Listy 103, s1−s148 (2009) PMA 2009 & 20th SRC 2009 Contributed Lectures
s84
3. Potential applications for automotive industry
3.1. Additives from plastic material and rubber
The trend observed in plastic technology is that the addi-tives are far higher mol weight molecules. This is needed to get them more stable and slow down the migration in the plastic material. To get an identification report of the addi-tives classical liquid extraction might be applied. The quick thermal desorption is again a great alternative. This method can be used to check the raw materials or defects from the supplier. The automotive business requires certain quick ana-lytical methods like this.
In Fig. 5 is seen that all the additives are separated from the matrix peaks. The polycarbonate was stabilized against oxidation by irgafos 168 and irganox 1076. While the sample also was stabilized against UV by tinuvin 350 and uvinul 3027.
3.2. Volatile organic compounds (VOC/SVOC)
VDA is the German Quality Management System (QMS) for the automobile industry (Verband der Automobilindustrie). Their VDA 278 norm describes the emission from plastic materials intended to use in automotive industry. This analysis exists into two parts: − The first part describes the volatile organic compound
analysis (VOC) with thermal desorption at 90 ºC for 30 minutes. The peaks are calibrated with and compared to a toluene standard.
− The second part describes the semi-volatile organic com-pound analysis (FOG) with thermal desorption at 120 ºC for 60 minutes. The peaks are calibrated with and com-pared to a hexadecane standard. The example in Fig. 6 shows a chromatogram overlay of
VOC analysis. 3 polyethylene samples were measured and were taken from different batches. This method proved that the lowest 2 chromatograms (sample 1 and 2) have a VOC value of 360 µg g−1 toluene equivalent. The sample 3 (highest chromatogram) gives the highest VOC emission of 500 µg g−1
toluene equivalent. The VOC analysis shows that the material is based on the same due to the presence of similar matrix releated emissions. The used additives are different. Sample 1 and 2 contains butylated hydroxyl toluene (BHT) at reten-tion time 13,2 min while sample 3 contains dibenzylamine derivates at retention time 16 minutes.
This VDA 278 analysis gives information about the additives and their emission value. The power of this method is that the emission of a single compound can be calculated and the formulation can be adjusted by reverse engineering. 3.3. Defect analysis
Thermal desorption is a perfect tool for the explanation of many defects on surfaces and raw materials for automotive industry. Defects can either be surface defects like blooming, cracking, discoloring or smelling but also physical defects like cracking, weakening, etc.
The rubber production process is one by complex han-dlings after each other like mixing, extrusion, calandering, vulcanization but also storage. This happens all under certain conditions like temperature and mixing speed but also by adding a complex mixture of chemicals. Not only the rubber industry but the automotive polymer industry in common is more and more faced by short delivery times and high produc-tion speed. This all can lead to defects in production and stor-age due to the lack of good storage conditions. Rubber for instance is still vulcanising during storage. As the rubber product arrives to the customer it sometimes happens that the defect is noticed after selling the final product.
The chromatogram below in Fig. 7 shows a defect from a polypropylene production plant. The lower chromatogram gives the reference sample which has no defect at all. The paint was adhesive to the polypropylene profile. The upper chromatogram shows the defect sample where the paint could not stay on the polypropylene profile. A simple screening by direct thermal desorption proved the presence of wax in the defect sample.
2.5 5.0 7.5 10.0 12.5 15.0 17.5 20.0 22.5 25.0 27.5 30.0
0.5
1.0
1.5
2.0
2.5
3.0
3.5
4.0
4.5
5.0
5.5
6.0
6.5
7.0
7.5
8.0
(x100,000)
Fig. 5. Additive screening by TD-GC-MS of polycarbonate based coating
2.5 5.0 7.5 10.0 12.5 15.0 17.5 20.0 22.5 25.0
-0.1
0.0
0.1
0.2
0.3
0.4
0.5
0.6
0.7
0.8
0.9
1.0
1.1
1.2
(x10,000,000)
Fig. 6. VOC analysis of 3 polyethylene samples by refocusing GC-MS
Irga
nox
Irga
fos 1
68
Irga
fos 1
68
Tinu
vin
350
+ U
vinu
l 302
7 BH
Dibenzylamine derivates only in
sample 3
Sample 3
BHT only in
sample 1 and 2
Sam
-pl
e 3
Sample 1/2

Chem. Listy 103, s1−s148 (2009) PMA 2009 & 20th SRC 2009 Contributed Lectures
s85
3.4. Liquid injections/extracts/washes
To omit the large volume injections in liquid chromatog-raphy large volume injections can also be done easily by ther-mal desorption. An amount of 100 µl can be added to a tenax tube if the solvent is methanol. Other solvents can be used if the analyte is much heavier than the solvent. The solvent can evaporate and the analyte remains in the sample cup or tube. This residue can be oil or a thin film which is excellent for using thermal desorption.
Applications are mainly surface related problems of car parts like dashboards, rubber, leather, tires, driving wheel, carpets, paint, adhesives, etc.
Blooming is a recently more and more appearing defect which implements the migration of additives, accelerators towards the surface or a synthetic polymer. The surface gets affected by a flower field shaped structure and even a snow white layer can be seen if the sample is blooming for long time.
This blooming process is depending on the polarity of the analyte, its volatility, concentration, migration time and storage conditions. The following example is the analysis of a blooming door panel. The white smear on the surface is making a flowerfield structure on the surface of the sample (Fig. 8).
Thermal desorption after surface washing proved that the bloom was caused by the toxic hexabromocyclododecane (Fig. 9). This is a commonly used flame retardant for automo-tive applications. On the surface of the blooming panel was seen such a high concentration of hexabromocyclododecane that there was surely a mistake in the production line of the manufacturer.
4. Conclusion
The new trends in modern analytical chemistry are based on quickness, trueness and quality. The automotive/rubber sector requires the same assessments and both sections are fully cooperating with labs nearby. To fulfill the needs of the industry thermal desorption can save lots of time and money compared to the classical wet chemistry or instrumen-tal chemistry.
Its applications range from quality control to defect analysis. The importance of this technique is still not well understood by customers from analytical laboratories. How-ever the huge number applications with this technique are proving their need. REFERENCES 1. Burt T.: Indoor and Built Environment, Vol. 5, No. 1, 44-
59 (1996) DOI: 10.1177/1420326X9600500107 2. Hinshaw. John V.: LCGC 18, 940 (2008). 3. Baier HU: Shimadzu news 2 (2007). 4. Markes international limited, Thermal desorption and air
monitoring products, 2006. 5. Supelco, air monitoring � a complete line of products for
air monitoring, 2008.
Fig. 7. Determination of differences between polypropylene sam-ples can lead to a solution for defects in the production
Fig. 8. Detailed picture of a blooming defect on a car door panel
21.0 22.0 23.0 24.0 25.0 26.0
0.00
0.25
0.50
0.75
1.00
1.25
1.50
(x100,000)
Fig. 9. Chromatogram after TD-GC-MS of a surface wash for blooming analysis
5.0 10.0 15.0 20.0 25.0 30.0 35.0
0.0
0.5
1.0
1.5
2.0
2.5
3.0
3.5(x100,000)
matrix peaks
wax distribution
Br
Br
Br
Br
Br
Br

Chem. Listy 103, s1−s148 (2009) PMA 2009 & 20th SRC 2009 Contributed Lectures
s86
CL-20 EMISSION BEHAVIOUR OF NON-METALLIC PARTS, INTENDED INTO A CAR INTERIOR JIRI SAMSONEK and FRANKY PUYPE Institute for testing and certification, a.s. Tř. T. Bati 299, 764 72 Zlín, Czech Republic [email protected] Introduction
Almost all car manufacturers take care about environ-ment inside the car having regards the passenger�s health, comfort or protection. Modern car interiors are loaded by many non-metallic components (plastics, rubbers, textiles, varnishes, lubricants or adhesives) so the study of their influ-ence on the car environment is vital. The approach of each car manufacturer varies, but generally they are based on similar principles. Material is tested under the conditions that simu-late real conditions in a car environment.
Testing is based on establishing of the balance between solid phase (tested sample) and vapour phase (ambient air or generally gaseous phase). Then the vapour phase (or sub-stances, that are emitted to the gaseous phase) are subjected to the analysis. Standards are aimed on testing of odour, total organic compounds, selective organic substance emission and transport behaviour of certain substances.
Examples1 of volatile organic substance (VOCs) and semi-volatile organic substances (SVOCs) are: VOCs � alkans, alkens, aromatic hydrocarbons, carbonyl compounds, alcohols, esters, ethers, aldehydes, halogenated hydrocarbons, terpenes, nitrogen and sulphur compounds SVOCs � high boiling point substances such as paraffins, glycols, higher fatty acid and their esters, phenols, phthalates, adipates (generally plasticisers), organophosphorous sub-stances, organobromine substances (flame retardants), or-ganosilicon substances (silicon oil), amines (catalysts from PU foams) etc. Emission kinetics
The process of vaporisation of volatile or semi-volatile organic substance (low molecular substances) from solid ma-terial (plastic, rubber, textile) can be described from thermo-dynamical point of view by many equations. The basic is vapour pressure equilibrium. All liquids and solids have a tendency to evaporate to a gaseous form, and all gases have a tendency to condense back into their original form (either liquid or solid). The equilibrium is dependent on the tempera-ture, molecular weight, interaction between substance and the solid matrix and interactions between each volatile substance.
Presence of volatile and semivolatile compounds in the car environment can be described by following balance dia-gram:
The main process that occurs is vaporisation and subse-
quent condensation. The imisions from outside are source of different substances (like exhaust fumes, dust etc.). They have no relation to the emission behaviour of car material. Compar-ing to the concentration levels of organic pollutants inside the car it can be named as a �diluting or clean� air. Over a long period of non-usage of a car the vaporisation and condensa-tion reach equilibrium so the air is saturated by volatile and semi-volatile substances. All the process depends on a tem-perature, the higher the quicker the equilibrium is reached and higher is the final concentration level of each substance. Pas-sengers are exposed to this equilibrium emission concentra-tion immediately after they sit into the car. As they run a car and the air exchange dilutes the ambient environment the concentration of chemicals start to decrease. The opposite process can be increasing the emission flow by heating of interior caused by car-heating system. Transport of the pollut-ant inside the car is complex process. Evaporation and con-densation can occur on different surfaces so one material can emit semi-volatile substance and on another material the con-densation can occur. A typical phenomenon is fogging of phthalic acid esters. This plasticisers can be emitted to the car environment mainly when it is heated and then strong conden-sation on the cold front glass result in light scattering thin film on the inside of the windshield1,2 fogging.
Typical tests of emission behaviour There are several very often used tests for evaluation of
emission behaviour of non-metallic materials in far interiours. Some of them are non-selective, describing complex behav-iour of sample, others are selective, focusing on certain sub-stance.
Emissions of total organic carbon
This test evaluates total amount of organic substances
emitted under certain temperature and time (typically 120 °C, 5 hours) from the material. The quantification is done by re-calculation of all quantifiable substances expressed as an ace-tone organic carbon. This test can characterise samples capa-bility to emit mainly volatile substances that remains in the sample like residual solvents, monomers, dimmers, volatile and semivolatile additives etc. Semivolatile substances con-
assimilation by passengers
inhalation
immisions from outside environment (negligible)
substance concentration in car environment
ventilation - elimination of substance from car
evaporisation condensation
substance in solid phase
Fig. 1. Emission diagram

Chem. Listy 103, s1−s148 (2009) PMA 2009 & 20th SRC 2009 Contributed Lectures
s87
tribute to the total emission lower than those of lower boiling point. Excessive results of total organic carbon can be caused by many factors, like high residual monomer content, high dosing of volatile or semi-volatile additives, like plasticisers, lubricants, stabilisers, or residual solvents in the surface treat-ments. Total organic carbon emissions (TVOC) arising from polymer additives are difficult to omit as even after leaving the part to linger after manufacturing for a longer time almost the same vapour phase equilibrium during the test is reached again. Excessive organic carbon emissions caused by residual high volatile substances like varnish solvents, monomers etc. have a tendency to decrease easily (approximately 20 % per week, with the stabilisation after 6 month1) so the total TVOC in the time fall depends mainly on the ratio between high volatile and semivolatile substances in the sample. Higher emission of organic substance does not necessary lead to the worse odour of the material as many of the organics are not sensorial important than others.
Special care is placed on the emission of formaldehyde. Although its emission is included into a total organic carbon these substance is controlled separately5 due to its enormous influence on the human health. Formaldehyde is classified as a positional carcinogenic substance class 2A.
Fogging behaviour
Mainly presence of semi-volatile substances in the non-
metallic car interior parts can lead to the phenomena, named �fogging�. Substances with higher boiling point that have vapour pressure which enable them to vaporise during heating can condensate on colder parts of car interiors (windshield). Typical substance that can concern in fogging are phthalic acid esters (phthalates), commonly used as a plasticiser. Also flame retardants of plastics and rubbers can increase the fog-ging1 as they show similar behaviour as phthalates because molecular weight and the boiling point of both groups of chemicals are comparable. Fogging-supporting chemicals are generally those that have similar physical/chemical properties like plasticisers or flame retardants. They can be residual catalysts3, by-products of polymerisation, carriers of colour batches, oils, waxes etc.
Lingering of sample in the storage before testing or as-sembling cannot decrease significantly fogging characteris-
tics. High loading of car parts by fogging-supporting chemi-cals supports the fogging effect for a long period of time re-gardless the number of heating/cooling cycles. To avoid fog-ging of non-metallic parts the manufacturer has to change the composition of the whole materials.
Special tests are concerning to the direct measurement of light beam reflection6. The sample is heated on 100 °C and above it the glass plate, cooled on 20 °C is kept. Then the light beam reflection is measured and compared the clean glass surface reflection.
Odour
Sensorial perception of car interior air is heavily influ-
ence by non-metallic parts properties. Regardless the other parameters human smell can detect certain substances on the levels difficult to quantify by common analytical techniques. Samples are tested under defined conditions and raised odour evaluated by group of trained evaluators by use of rating scale. Some car manufacturers have set more detailed stan-dards for describing of the smell7. Main substances that can influence the final smell are amine or sulphur-based organics, aldehydes, ketons, organic acids, esters, phenolic substances, products of microbiological proceses etc.
The whole car testing
Another approach can be also applied to the evaluation
of emission behaviour. While above mentioned tests are de-scribing each material the summary test of final car can be also applied. Either sensorial tests or analysis of ambient car can be performed or testing of ambient air quality by adsorb-ing of the air on the sorbents (charcoal tubes, TENAX® sor-bents). with this type of analysis we can better understand the real behaviour of VOCs in the real car interior an. Also analy-sis of fogging film on the windows can give information about real transport of SVOCs in the car interior. REFERENCES 1. Henneuse C., Catherine Henneuse-Boxus, Pacary T.:
Emissions from Plastics, Rapra Technology Limited, 2003.
2. Loock F., Lampe T., Bahadir M.: Fresenius� J. Anal. Chem. 347, (1993).
3. Standard PV 3015, DIN 75201-B. 4. Bradford L., Pinzoni E. and Wuestenenk J.: Proceedings
of the Polyurethane Foam Association, October 17 & 18, 1996.
5. Standard PV 3900. 6. Standard DIN 75201. 7. Standard TSM0505G.
Total organic carbon emissions, ug/g
lingering time, days
emissions caused by semi-volatile additives
emissions caused by volatile additives
Fig. 2. Decreasing of TVOC on the lingering time

Chem. Listy 103, s1−s148 (2009) PMA 2009 & 20th SRC 2009 Contributed Lectures
s88
CL-21 PLASTICS PARTS DESIGN SUPPORTED BY REVERSE ENGINEERING AND RAPID PROTOTYPING MICHAL STANEK, MIROSLAV MANAS, DAVID MANAS, and STEPAN SANDA Tomas Bata University in Zlin, Faculty of Technology, De-partment of Production Engineering, TGM 275, 762 72 Zlin, Czech Republic, [email protected] Abstract
Rapid prototyping technologies for easy production of prototype, parts and tools are new methods which are devel-oping unbelievably quickly. The main objective of this article is to give the basic introduction to this problem. 1. Introduction
Successful product development means developing
a product of high quality, at lowest cost, in the shortest time, in at a reasonable price1. The development of the part and its introduction to market is time consumption process. But �time is money� and therefore could be said that money saving is greatest when time to market is minimalized utmost.
On principle, the conventional model making processes based on two-dimensional (2D) drawings. The rapid prototyp-ing process is based on complete 3D models. The 3D geomet-ric information from the CAD is split into layer information and the layers are gradually build directly with the aid of the computer. The advantage of the rapid prototyping technolo-gies is the part building possibility using 3D CAD data only.
All process by which 3D models and components are produced additively, that is, by fitting or mounting volume elements together (voxels or layers) are called generative production process. Rapid prototyping describes the technol-ogy of generative production processes. The application of rapid prototyping technology lays in solid imagining and functional prototyping. Prototypes are made from plastics (mainly ABS, PVC or special resins, metals or other materials that simulate one or more mechanical or technological func-tionalities of the final serial component.
Often use word Rapid tooling describes a principles and technologies for tools and molds preparation. This prototypes
are used for production of prototypes and preseries products. The rapid tooling uses the same processes as those used in rapid prototyping. Rapid manufacturing represent such a rapid prototyping applications that produce products with serial character. For these purposes can be used most of rapid proto-typing methods. But the mechanical and other properties of materials used for the rapid prototyping do not reach mostly the characteristics of the serial products.
2. Principles of Rapid prototyping Rapid prototyping belong to the additive production
processes. In contrast to abrasive processes such a milling, drilling, grinding eroding etc. in which the form is shaped by material removing, in rapid prototyping the part is formed by joining volume elements. Most of used rapid prototyping processes work with layers where single layers are produced and joined to a final geometry. On principle, rapid prototyp-ing processes are two and half D processes, that is tacked up 2D contours with constant thickness. But for layer creation 3D model is necessary. Rapid prototyping as the generative manufacturing processes are divided among two fundamental process steps: − generation of the mathematical layer information, − generation of the physical layer model. The principle is given in the Fig. 2.
Industrially are used many types of rapid prototyping systems working on different physical principles: − solidification of liquid materials (polymerization proc-
ess), − generation from the solid phase:
- cutting from foils or paper (LOM), - binder of powder or granules, - powder sintering,
− generation form the pasty phase.
Fig. 1. Percentage use of rapid prototyping worldwide Fig. 2. Rapid prototyping principle

Chem. Listy 103, s1−s148 (2009) PMA 2009 & 20th SRC 2009 Contributed Lectures
s89
Solidification of liquid materials (Photopolymerization) represents stereolithography. Stereolythography use a viscous monomer. Exposed to ultraviolet radiation or laser beam set off a spontaneous polymerization and the liquid monomer changes to solid polymer (Fig. 3).
Laser sintering (LS) is most important principle from the group of RP technologies which use the product generation from the solid phase.LS works with the powder (polymers, metals,tec) which is sintered by he laser beam and form a layer usually in the thickness of the powder particles size (Fig. 4).
Laminated Object Manufacturing is the most simple method producing 3D models Models are produced from 2D countered layers cutted out from the foils or paper by the help of knife or laser beam and than to assembled them into 3D models (Fig. 5).
Extrusion process is based on molted polymer which is
extruded from nozzle system (extrusion die) and deposited geometrically defined onto a structure. As building materials are used different types of polymers (Fig. 6).
3D printing is very often used rapid prototyping method.The principle is very similar to 2D printing proces sof inkjet pointer.The injected materiál is a polymer which after cooling form the required layer or binder which bonds
Fig. 3. Principle of Stereolythography
Fig. 4. Principle of Laser Synthering
Fig. 5. Principle of Laminated Object Manufacturing
Fig. 6. Principle of Fused Deposition Modeling

Chem. Listy 103, s1−s148 (2009) PMA 2009 & 20th SRC 2009 Contributed Lectures
s90
a powder particles.As in case of the inject printer, also 3D printer makes print the multicolor parts possible (Fig. 8).
3. Reverse engineering Reverse Engineering allows stacking already existing
product. For this reason the entire surface needs to be able measured and recorded and returned to the CAD system.
The measurement produces an enormous number of data that are also known as clouds of points. Reverse engineering enables these clouds of points to be defined as surface ele-ments, thereby facilitate their further processing in the CAD system.
Fig. 8. Principle of 3D printing
Fig. 7. Examples of parts from FDM
Fig. 9. Examples of printed parts Fig. 11. Reverse engineering system with the laser scanner Copy Mate
Fig. 10. Principle of Reverse Engineering
Chem. Listy 103, s1−s148 (2009) PMA 2009 & 20th SRC 2009 Contributed Lectures
s91
4. Conclusion Rapid prototyping and reverse engineering are very
useful tools which can accelerate the way of product from the idea to market. Generative principle of rapid prototyping methods enables to produce parts of any geometry. These processes are practically unlimited in their ability to form complex shapes, they can produce both positives (parts) and negatives (dies and molds).
This article is financially supported by the Czech Ministry of Education, Youth and Sports in the R&D project under the title �Modelling and Control of Processing Procedures of Natural and Synthetic Polymers�, No. MSM 7088352102.
REFERENCES 1. Objet Geometries. Polyjet Technology developed by
Objet Geometries [online]. c2008 [cit. 2008-12-12]. Dos-tupný z WWW: http://www.objet.com/Products /Po ly Je tTechnology Animat ionMovie / t ab id /83 /Default.aspx
2. Wikipedia contributors. Rapid prototyping : Wikipedia, The free encyklopedia [online]. 3 December 2008 [cit. 2008-12-12]. Dostupný z WWW: < http://en.wikipedia.org/wiki/Rapid_prototyping>
3. http://www.emag.cz 4. Percentage use of rapid prototyping worldwide as of
year 2000. Data based on: D. T. Pham, S. S. Dimov, Rapid manufacturing, p. 6. Springer-Verlag, 2001.
CL-22 INFLUENCE OF SURFACE ROUGHNESS ON FLUIDITY OF THERMOPLASTICS MATERIALS MICHAL STANEK, MIROSLAV MANAS, DAVID MANAS, and STEPAN SANDA Tomas Bata University in Zlin, Faculty of Technology, De-partment of Production Engineering, TGM 275, 762 72 Zlin, Czech Republic [email protected] Introduction
Polymer injection molding is the most used technology
of polymer processing nowadays. It enables the manufacture of final products, which do not require any further operations. The tools used for their production � the injection molds � are very complicated machines that are made using several tech-nologies. Working of shaping cavities is the major problem involving not only the cavity of the mold itself, giving the shape and dimensions of the future product, but also the run-ners leading the polymer melt to the separate cavities. The runners may be very complex and in most cases takes up to 40 % volume of the product itself (shape cavity). In practice, high quality of runner surface is still very often required. Hence surface polishing for perfect conditions for melt flow is demanded. The stated finishing operations are very time and money consuming leading to high costs of the tool produc-tion. This work gives the results of studying the influence of the quality of flow pathway surface and influences of other technological parameters on the polymer melt flow.
Results of the experiments carried out with selected types of thermoplastics proved a minimal influence of surface roughness of the flow channels on the polymer melt flow. This considers excluding (if the conditions allow it) the very complex and expensive finishing operations from the techno-logical process as the influence of the surface roughness on the flow characteristics does not seem to play as important role as was previously thought.
Regressive models created on the basis of experiment results enable to predict the flow behaviour of the polymers quite precisely with regard to the surface quality and the pa-rameters of the process injection molding itself. Application of the measurement results may have significant influence on the production of shaping parts of the injection molds espe-cially in changing the so far used processes and substituting them by less costly production processes which might in-crease the competitiveness of the tool producers and shorten the time between product plan and its implementation.
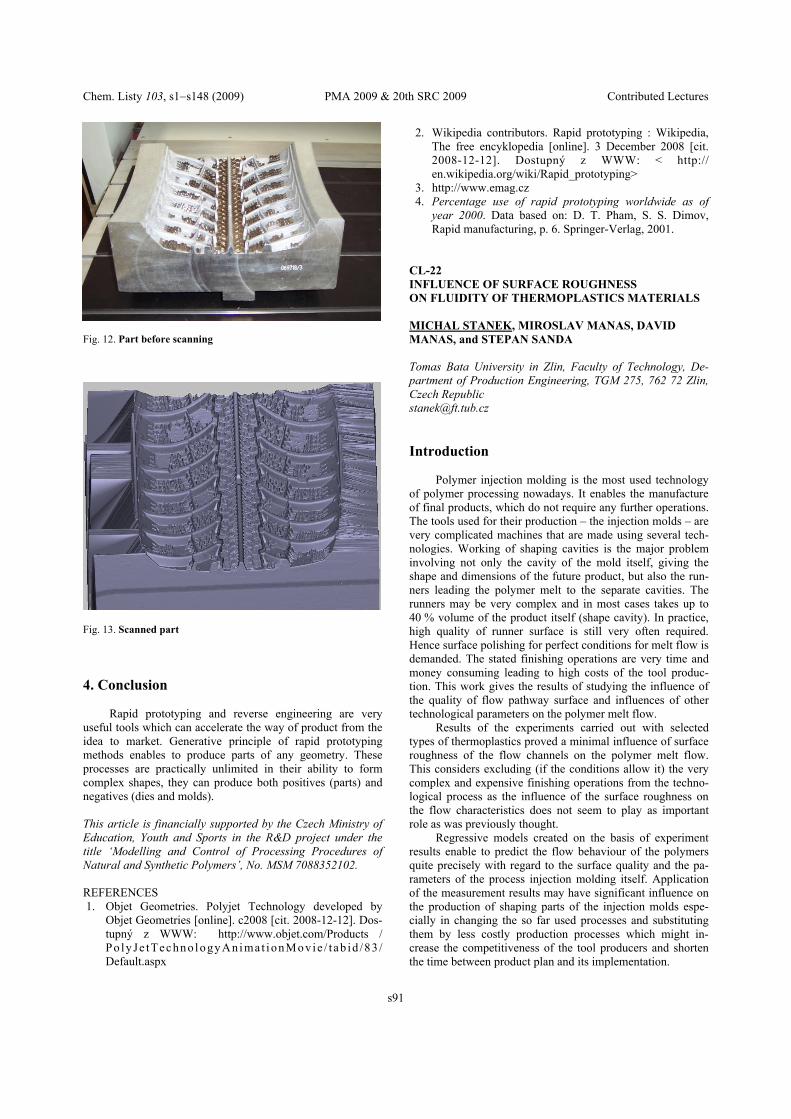
Fig. 12. Part before scanning
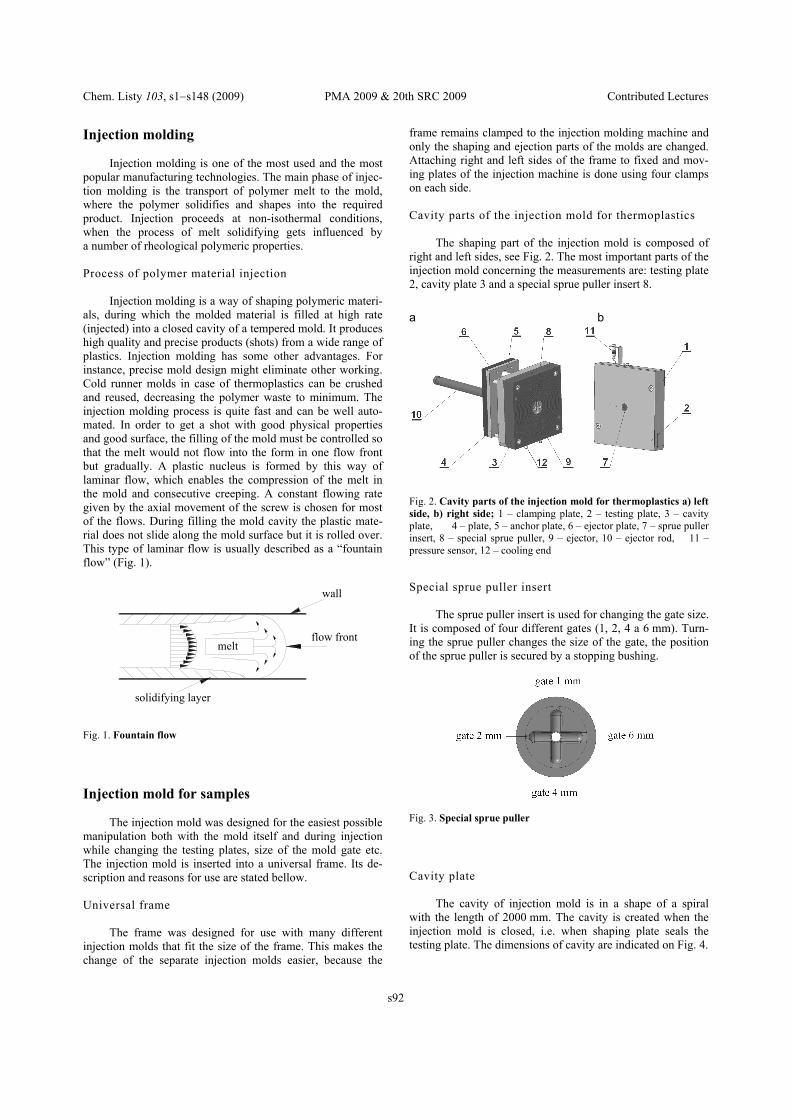
Fig. 13. Scanned part
Chem. Listy 103, s1−s148 (2009) PMA 2009 & 20th SRC 2009 Contributed Lectures
s92
Injection molding Injection molding is one of the most used and the most
popular manufacturing technologies. The main phase of injec-tion molding is the transport of polymer melt to the mold, where the polymer solidifies and shapes into the required product. Injection proceeds at non-isothermal conditions, when the process of melt solidifying gets influenced by a number of rheological polymeric properties.
Process of polymer material injection
Injection molding is a way of shaping polymeric materi-
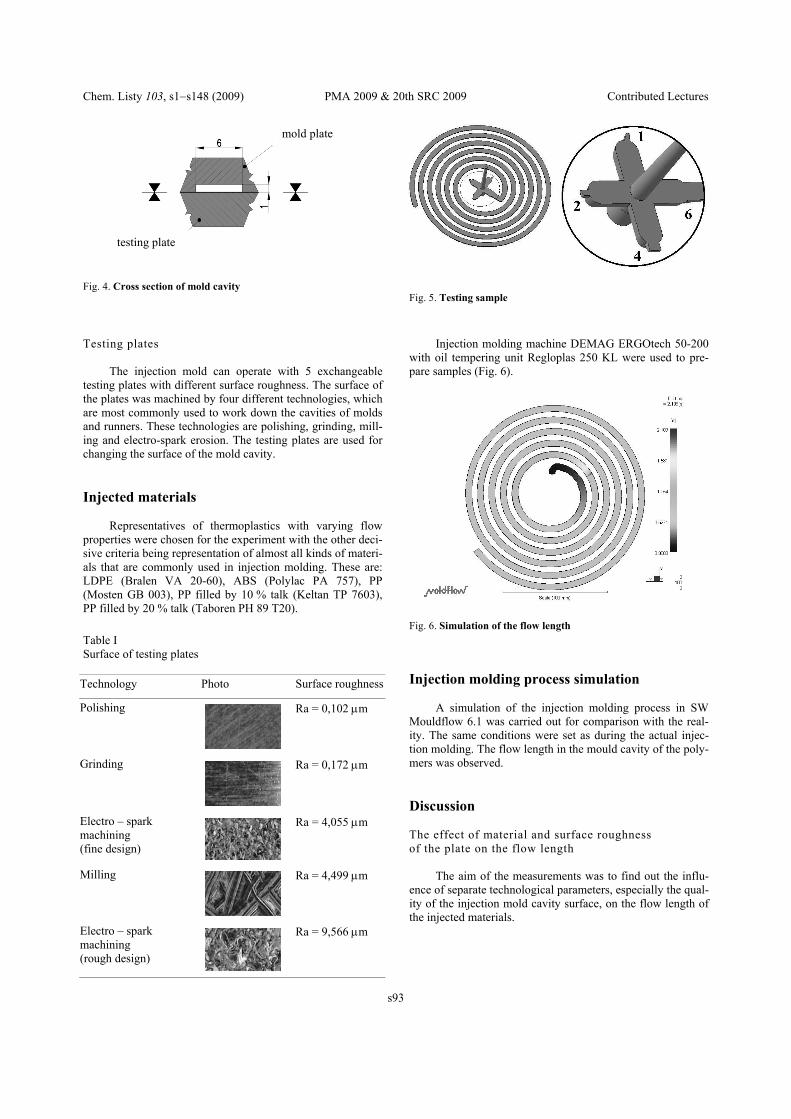
als, during which the molded material is filled at high rate (injected) into a closed cavity of a tempered mold. It produces high quality and precise products (shots) from a wide range of plastics. Injection molding has some other advantages. For instance, precise mold design might eliminate other working. Cold runner molds in case of thermoplastics can be crushed and reused, decreasing the polymer waste to minimum. The injection molding process is quite fast and can be well auto-mated. In order to get a shot with good physical properties and good surface, the filling of the mold must be controlled so that the melt would not flow into the form in one flow front but gradually. A plastic nucleus is formed by this way of laminar flow, which enables the compression of the melt in the mold and consecutive creeping. A constant flowing rate given by the axial movement of the screw is chosen for most of the flows. During filling the mold cavity the plastic mate-rial does not slide along the mold surface but it is rolled over. This type of laminar flow is usually described as a �fountain flow� (Fig. 1).
Injection mold for samples
The injection mold was designed for the easiest possible
manipulation both with the mold itself and during injection while changing the testing plates, size of the mold gate etc. The injection mold is inserted into a universal frame. Its de-scription and reasons for use are stated bellow.
Universal frame
The frame was designed for use with many different
injection molds that fit the size of the frame. This makes the change of the separate injection molds easier, because the
frame remains clamped to the injection molding machine and only the shaping and ejection parts of the molds are changed. Attaching right and left sides of the frame to fixed and mov-ing plates of the injection machine is done using four clamps on each side. Cavity parts of the injection mold for thermoplastics
The shaping part of the injection mold is composed of
right and left sides, see Fig. 2. The most important parts of the injection mold concerning the measurements are: testing plate 2, cavity plate 3 and a special sprue puller insert 8.
Special sprue puller insert
The sprue puller insert is used for changing the gate size.
It is composed of four different gates (1, 2, 4 a 6 mm). Turn-ing the sprue puller changes the size of the gate, the position of the sprue puller is secured by a stopping bushing.
Cavity plate
The cavity of injection mold is in a shape of a spiral
with the length of 2000 mm. The cavity is created when the injection mold is closed, i.e. when shaping plate seals the testing plate. The dimensions of cavity are indicated on Fig. 4.
meltflow front
solidifying layer
wall
Fig. 1. Fountain flow
Fig. 2. Cavity parts of the injection mold for thermoplastics a) left side, b) right side; 1 � clamping plate, 2 � testing plate, 3 � cavity plate, 4 � plate, 5 � anchor plate, 6 � ejector plate, 7 � sprue puller insert, 8 � special sprue puller, 9 � ejector, 10 � ejector rod, 11 � pressure sensor, 12 � cooling end
a b
Fig. 3. Special sprue puller
Chem. Listy 103, s1−s148 (2009) PMA 2009 & 20th SRC 2009 Contributed Lectures
s93
Testing plates The injection mold can operate with 5 exchangeable
testing plates with different surface roughness. The surface of the plates was machined by four different technologies, which are most commonly used to work down the cavities of molds and runners. These technologies are polishing, grinding, mill-ing and electro-spark erosion. The testing plates are used for changing the surface of the mold cavity.
Injected materials Representatives of thermoplastics with varying flow
properties were chosen for the experiment with the other deci-sive criteria being representation of almost all kinds of materi-als that are commonly used in injection molding. These are: LDPE (Bralen VA 20-60), ABS (Polylac PA 757), PP (Mosten GB 003), PP filled by 10 % talk (Keltan TP 7603), PP filled by 20 % talk (Taboren PH 89 T20).
Injection molding machine DEMAG ERGOtech 50-200 with oil tempering unit Regloplas 250 KL were used to pre-pare samples (Fig. 6).
Injection molding process simulation A simulation of the injection molding process in SW
Mouldflow 6.1 was carried out for comparison with the real-ity. The same conditions were set as during the actual injec-tion molding. The flow length in the mould cavity of the poly-mers was observed.
Discussion
The effect of material and surface roughness of the plate on the flow length
The aim of the measurements was to find out the influ-
ence of separate technological parameters, especially the qual-ity of the injection mold cavity surface, on the flow length of the injected materials.
testing plate
mold plate
Fig. 4. Cross section of mold cavity
Technology Photo Surface roughness
Polishing
Ra = 0,102 µm
Grinding
Ra = 0,172 µm
Electro � spark machining (fine design)
Ra = 4,055 µm
Milling
Ra = 4,499 µm
Electro � spark machining (rough design)
Ra = 9,566 µm
Table I Surface of testing plates
Fig. 6. Simulation of the flow length
Fig. 5. Testing sample

Chem. Listy 103, s1−s148 (2009) PMA 2009 & 20th SRC 2009 Contributed Lectures
s94
The observed influences on filling the injection mold cavity (the flow length respectively) in the thermoplastics were injection pressure, injection rate, size of the gate and the surface roughness of the testing plates.
Statistical evaluation of the measured data
The final statistical evaluation of the measured data was
done by SW STATISTICA 7. The aim of the statistical evaluation was to determine the influence of separate parame-ters on filling the mold cavity by material. Due to the influ-ence of more factors (some independent variables) on the change of the observed feature (dependent variables), multiple
regression was chosen for the description. The result of the regressive analysis is the regressive model used to predict the value of dependent variable at a given value of independent variable. The dependent variable is the flow length. We ob-serve the influence of five independent variables (injection pressure, injection rate, size of the gate, surface roughness of the testing plates and Melt Flow Index of the materials) on the flow length. To find out the impact of the factors on flow length, the dispersion analysis was carried out. The resulting
30 60
90
Polylac PA 757 Mosten GB 003
Bralen VA 20-60 Taboren PH 89 T20
Keltan TP 7603
0
50
100
150
200
250
flow
leng
th [
mm
]
injection rate [mm s−1]
Fig. 7. Dependence of the flow length on the injected material and injection rate; plate with fine design, injection rate 30 mm s−1, size of gate 2 mm
polished plate grinded
plate fine design milled
plate rough design
Polylac PA 757 Mosten GB 003
Bralen VA 20-60 Taboren PH 89 T20
Keltan TP 7603
0
50
100
150
200
250
300
flow length
Fig. 8. Dependence of the flow length on the injected material; injection rate 60 mm s−1, injection pressure 8 MPa, size of gate 6 mm
4 6
8
Polylac PA 757
Mosten GB 003 Bralen VA 20-60
Taboren PH 89 T20 Keltan TP 7603
0
50
100
150
200
250
flow
leng
th
injection pressure [MPa]
Fig. 9. Dependence of the flow length on the injected material and injection pressure; plate with rough design, injection pressure 6 MPa, size of gate 2 mm
2 4
6 Polylac PA 757
Mosten GB 003
Bralen VA 20-60 Taboren PH 89 T20
Keltan TP 7603
0 20 40 60 80 100
120 140
160
180
flow
legt
h [m
m]
gate size [mm]
Fig. 10. Dependence of the flow length on the injected material and gate size; polished plate, injection rate 90 mm s−1, injection pressure 4 MPa
Chem. Listy 103, s1−s148 (2009) PMA 2009 & 20th SRC 2009 Contributed Lectures
s95
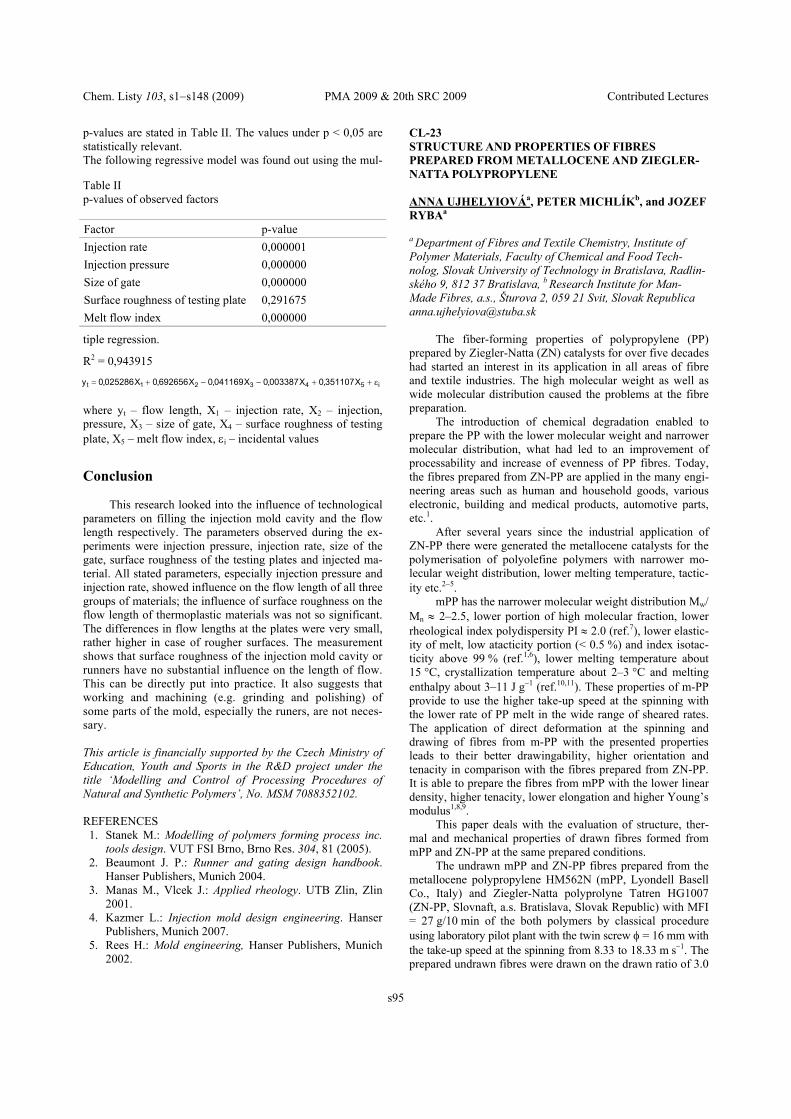
p-values are stated in Table II. The values under p < 0,05 are statistically relevant. The following regressive model was found out using the mul-
tiple regression.
R2 = 0,943915
where yt � flow length, X1 � injection rate, X2 � injection, pressure, X3 � size of gate, X4 � surface roughness of testing plate, X5 � melt flow index, εi � incidental values
Conclusion
This research looked into the influence of technological parameters on filling the injection mold cavity and the flow length respectively. The parameters observed during the ex-periments were injection pressure, injection rate, size of the gate, surface roughness of the testing plates and injected ma-terial. All stated parameters, especially injection pressure and injection rate, showed influence on the flow length of all three groups of materials; the influence of surface roughness on the flow length of thermoplastic materials was not so significant. The differences in flow lengths at the plates were very small, rather higher in case of rougher surfaces. The measurement shows that surface roughness of the injection mold cavity or runners have no substantial influence on the length of flow. This can be directly put into practice. It also suggests that working and machining (e.g. grinding and polishing) of some parts of the mold, especially the runers, are not neces-sary.
This article is financially supported by the Czech Ministry of Education, Youth and Sports in the R&D project under the title �Modelling and Control of Processing Procedures of Natural and Synthetic Polymers�, No. MSM 7088352102.
REFERENCES 1. Stanek M.: Modelling of polymers forming process inc.
tools design. VUT FSI Brno, Brno Res. 304, 81 (2005). 2. Beaumont J. P.: Runner and gating design handbook.
Hanser Publishers, Munich 2004. 3. Manas M., Vlcek J.: Applied rheology. UTB Zlin, Zlin
2001. 4. Kazmer L.: Injection mold design engineering. Hanser
Publishers, Munich 2007. 5. Rees H.: Mold engineering, Hanser Publishers, Munich
2002.
CL-23 STRUCTURE AND PROPERTIES OF FIBRES PREPARED FROM METALLOCENE AND ZIEGLER-NATTA POLYPROPYLENE ANNA UJHELYIOVÁa, PETER MICHLÍKb, and JOZEF RYBAa a Department of Fibres and Textile Chemistry, Institute of Polymer Materials, Faculty of Chemical and Food Tech-nolog, Slovak University of Technology in Bratislava, Radlin-ského 9, 812 37 Bratislava, b Research Institute for Man-Made Fibres, a.s., �turova 2, 059 21 Svit, Slovak Republica [email protected]
The fiber-forming properties of polypropylene (PP) prepared by Ziegler-Natta (ZN) catalysts for over five decades had started an interest in its application in all areas of fibre and textile industries. The high molecular weight as well as wide molecular distribution caused the problems at the fibre preparation.
The introduction of chemical degradation enabled to prepare the PP with the lower molecular weight and narrower molecular distribution, what had led to an improvement of processability and increase of evenness of PP fibres. Today, the fibres prepared from ZN-PP are applied in the many engi-neering areas such as human and household goods, various electronic, building and medical products, automotive parts, etc.1.
After several years since the industrial application of ZN-PP there were generated the metallocene catalysts for the polymerisation of polyolefine polymers with narrower mo-lecular weight distribution, lower melting temperature, tactic-ity etc.2−5.
mPP has the narrower molecular weight distribution Mw/Mn ≈ 2�2.5, lower portion of high molecular fraction, lower rheological index polydispersity PI ≈ 2.0 (ref.7), lower elastic-ity of melt, low atacticity portion (< 0.5 %) and index isotac-ticity above 99 % (ref.1,6), lower melting temperature about 15 °C, crystallization temperature about 2�3 °C and melting enthalpy about 3�11 J g−1 (ref.10,11). These properties of m-PP provide to use the higher take-up speed at the spinning with the lower rate of PP melt in the wide range of sheared rates. The application of direct deformation at the spinning and drawing of fibres from m-PP with the presented properties leads to their better drawingability, higher orientation and tenacity in comparison with the fibres prepared from ZN-PP. It is able to prepare the fibres from mPP with the lower linear density, higher tenacity, lower elongation and higher Young�s modulus1,8,9.
This paper deals with the evaluation of structure, ther-mal and mechanical properties of drawn fibres formed from mPP and ZN-PP at the same prepared conditions.
The undrawn mPP and ZN-PP fibres prepared from the metallocene polypropylene HM562N (mPP, Lyondell Basell Co., Italy) and Ziegler-Natta polyprolyne Tatren HG1007 (ZN-PP, Slovnaft, a.s. Bratislava, Slovak Republic) with MFI = 27 g/10 min of the both polymers by classical procedure using laboratory pilot plant with the twin screw φ = 16 mm with the take-up speed at the spinning from 8.33 to 18.33 m s−1. The prepared undrawn fibres were drawn on the drawn ratio of 3.0
Table II p-values of observed factors
Factor p-value Injection rate 0,000001 Injection pressure 0,000000 Size of gate 0,000000 Surface roughness of testing plate 0,291675 Melt flow index 0,000000
i54321t X351107,0X003387,0X041169,0X692656,0X025286,0y ε++−−+=

Chem. Listy 103, s1−s148 (2009) PMA 2009 & 20th SRC 2009 Contributed Lectures
s96
with the final linear density from 4.7 to 2.3 dtex. Melting (∆Hm) enthalpies of mPP and ZN-PP fibres
were measured using DSC 7 Perkin Elmer and evaluated from thermograms of 1st heating. All measurements were curried out under nitrogen.
The birefringence represents the anisotropy of oriented polymer system and expresses the full orientation of macro-molecular chains in fibres. The full orientation of m-PP and ZN-PP fibres was estimated on the basis of measurements of birefringence using polarization microscope DNP 714BI.
The average orientation of macromolecular chains in the surface layers of fibre has been estimated on the basis the different speed sound between particles of variously oriented systems. The supermolecular structure of drawn mPP and ZN-PP fibres was determined on the basic of the measurement of sound speed in fibres using equipment of PND 129-126-06. The Instron equipment was used for evaluation of the mechanical properties (tenacity and elongation at break, Young�s modulus) of the mPP and ZN-PP fibres.
The mainly aim of this work is the comparison of the supermolecular structure and properties of fibres prepared from mPP and ZN-PP at the same spinning and drawing con-ditions. There were observed the effects the take-up of spin-ning on parameters of the supermolecular structure, thermal and mechanical properties of these fibres.
The melting enthalpies were estimated for the drawn mPP and ZNPP fibres from the endotherms measured at the 1st heating (Fig. 1). The conditions used at the spinning and drawing of fibres from polymers induce the form of their supermolecular structure which is different than the supermo-lecular structure of un-oriented polymers. The melting tem-peratures of fibres from both m-PP and ZN-PP are different and the melting temperatures of mPP fibres are lower about 8−10° than the ZN-PP fibres. The melting enthalpies of drawn ZN-PP fibres are higher than the drawn mPP fibres in the full observed area of take-up spinning (Fig. 1). The mPP has the lower ability of crystallization, which go out from their molecular structure11.
The direct deformation of undrawn fibres in process of their preparation on the drawn ratio = 3.0, excepted the fibres from mPP at the take-up spinning used of 15.83 and 18.83 m s−1, where the drawn ratios were of 2.7 and 2.5 increases the ori-entation of their macromolecular chains. It is represented by the growing of average orientation estimated on basis of the
measured birefringence (Fig. 2). The birefringence of fibres from mPP as well as ZN-PP increases with the growing of take-up speeds at the spinning at the same drawn ratio, but the increase of berifringence of mPP is lower than the increase of fibre birefringe from ZN-PP. But, the absolutely values of birefringence of m-PP fibres are higher than the values of ZN-PP fibres. The both dependencies have the direct proportional in the observed areas of take-up speeds at the spinning with-out achievement of equilibrium state.
The similar dependence was obtained at the evaluation of average orientation estimated on the basis of measurements of sound speed of drawn m-PP and ZN-PP fibres (Fig. 3).
The better ability of deformation can support also the improvement of mechanical properties, mainly higher tenacity at break and Young�s modulus and lower elongation at the break.
The previous positive results of structured parameters of mPP as well as ZN-PP fibres confirm the results obtained at the evaluation of the mechanical properties (tenacity at the break) (Fig. 4). The higher take-up speeds used at the spin-ning at the same drawn ratio of mPP and ZN-PP fibres induce proportionally the higher tenacity. But the tenacity of m-PP fibres is higher than the ZN-PP one (Fig. 4) and the increase of tenacity and Young�s modulus is more rapid and elonga-tion is slower than the increase of ZN-PP fibres. It is in the accordance with the formed supermolecular structure of drawn mPP.
70
80
90
100
5 10 15 20V0, m.s-1
∆H m
, J.g
-1
mPPZN-PP
Fig. 1. The dependencies of melting enthalpy obtained from 1st heating of drawn mPP and ZN-PP fibres on take-up speed used
27
29
31
33
35
5 10 15 20
∆n
x 10
3
mPPZN-PP
V0, m.s-1
Fig. 2. The dependencies of birefringence on the take-up speed of drawn mPP and ZN-PP fibres
Fig. 3. The dependencies of sound speed on the take-up speed of drawn mPP and ZN-PP fibres
2,5
2,8
3,1
3,4
3,7
5 10 15 20V0, m.s-1
c, k
m.s
-1
mPPZN-PP

Chem. Listy 103, s1−s148 (2009) PMA 2009 & 20th SRC 2009 Contributed Lectures
s97
Conclussion − The melting enthalpies of mPP fibres are lower than the
ZN-PP fibres prepared at the same spinning and drawing conditions.
− The lower level structural arrangement of undrawn mPP fibres ensures their better deformation at the same defor-mation (the same drawn ratio) with the improvement of structured parameters (the better orientation of macro-molecular chains estimated on the basis of measure-ments of berifringence) of drawn mPP fibres.
− The better orientation of mPP fibres induces the im-proved mechanical properties in comparison with ZNPP fibres.
This work was supported by the Slovak Research and Devel-opment Agency under the contract No. APVV-0226-06. REFERENCES 1. Folvarcikova K. et al: Book of Proceedings of the Inter-
national conference �Polymer Materials�, 29.-30. Octo-ber 2003, Bratislava.
2. Arranz-Andres J. et al: Eur. Polymer J. 43, 2357 (2007). 3. Bubeck R. A.: Mater. Sci. Eng., R 39, 1 (2002). 4. Gomez-Elvira J. M. et al: Polym. Degrad. Stab. 85, 873
(2004) 5. Choon K. Chai et al: Polymer 44, 773 (2003) 6. Schmenk B. et al: Chem. Fibers Int. 50, 233 (2000) 7. Herben P., Lonardo A.: Chem. Fibers Int. 52, 318 (2002) 8. Kamath M. G., Dahiya A., Hegde R. R.: Development of
metallocene based polypropylene. Available from http://www.engr.utk.edu/mse/pages/Texti les/Olef in%20fibers.htm
9. Jambrich M. et al: Book of Proceedings of the conference STRUTEX, TU v Liberci, December 1999, Liberec, pp. 33-38.
10. Bond E. B., Spruiell J. E.: Published online 9. October 2001, DOI 10.1002/app.2181, pp. 3223-3247.
11. Elvira M., Tiemblo P., Gomez-Elvira J. M.: Polym. De-grad. Stab. 83, 509 (2004).
CL-24 CRYSTAL STRUCTURE OF A 4,4'-BIPHENYLENE BASED POLYKETONE WITHOUT ETHER LINKAGES ZULKIFLI AHMADa and HOWARD M.COLQUHOUNb a School of Material and Mineral Resources, Universiti Sains Malaysia, Transkrian, 14300, Pulau Pinang Malaysia, b The University of Reading, Whiteknight, Reading, Berkshire, RG6 6AH, UK [email protected] Abstract
A wholly aromatic ketone polymer and its crystalline
structure of the polymer was elucidated using powder XRD and electron diffraction method and interfaced with molecular mechanic force-field computational modeling. It was found that the polymer adopted an orthorhombic system in Pbcn having 2 chains per unit cell of dimensions a = 7.55, b = 6.28 and c = 17.88 Å. The biaryl unit of the aromatic ring is copla-nar with the ketone bridge torsin angle of ca. 30o. Reitveld refinement of final structure yield an agreement factor (Rwp) of 9.16 %. The simulated electron diffraction of the proposed structure corresponded well with that of the experimental.
Introduction
Aromatic polyketone is a high performance polymer
widely used in automotive industry due to their ability to withstand high pressures, chemical resistant and high tem-peratures. This is due mostly to their highly crystalline nature. Several efforts were geared in elucidating and understanding the polymer crystal system. However, it is this very nature which hinder the production of high molecular weight polyke-tone which is indispensable for a good x-ray diffraction data. Numerous structural studies have been reported for aromatic polyketone series, mostly containing ether bond1−10. They display a consistent basic crystal structure with minor dimen-sional changes1−5. by adopting a space group of Pbcn with two chain orthorhombic cell. It has also been shown that the ether and ketone groups are crystallographically equivalent. Similarly, the substitution of biphenylene unit at each alter-nate phenyl position found in a homologous PEEK result in a crystal structure closely related to that of parent PEK and PEEK8. Interestingly, the simulated biphenylene unit dis-played co-palnarity despite this being an unfavorable confor-mation in gas phase9,10. To the best of authors knowledge, no structural study has previously been reported for wholly aro-matic polyketones without ether linkages.
In the present work, poly(4,4'-biphenyleneketone), a biphenylene polyketone without ether linkages, were syn-thesized. It crystal structure was elucidated using XRD pow-der data followed by computer modeling and simulation of its crystal structure whose structural parameters were based on synthesized six-ring all-ketone analogous oligomer, 4,4'-bis(4"-biphenylcarbonyl)biphenyl and other analogous oligomers previously studied.
2,0
3,5
5,0
6,5
8,0
5 10 15 20V0, m.s-1
Tena
city
, cN.
dtex
-1
mPPZN-PP
Fig. 4. The dependencies of tenacity on the take-up speed of drawn mPP and ZN-PP fibres

Chem. Listy 103, s1−s148 (2009) PMA 2009 & 20th SRC 2009 Contributed Lectures
s98
Experimental Section A six rings aromatic polyektone 4,4'-bis(4"-
biphenylcarbonyl)biphenyl was firstly synthesized based on the reaction scheme 1 as shown below.
Scheme 1.
The polyketone, poly(4,4'-biphenyleneketone) was then
synthesized based on the reaction scheme 2 as shown below
Scheme 2.
Crystallographic and modeling method X-ray powder difraction data were collected on a Bruker
D5000 X-Ray powder diffractometer (The University of Reading). Computational modeling was performed using software package Cerius2 (v.3.5). The model-building and energy-minimisation was derived from molecular mechanics Dreiding 2.21 Force-field. Rietveld refinement was performed in Rietveld Refinement module of Material Studio (v.2.0).
Result and discussion FTIR, H-NMR, C-NMR, DSC, elemental analysis and
GCMS analysis confirm the right six ring oligomer as synthe-sized. It shows a melting point of 355 °CC (DSC) and a molar mass of 514.19 (MS-CI). The polyketone polymer was suc-cessfully synthesized by polycondensation of a ketal-protected monomer to give an amorphous polyketal, followed by hydrolysis to reform the ketone function (Scheme 2). FTIR spectrum corresponded well with the anticipated structure of the polymer. It is insoluble in most solvents which precluded NMR analysis. It showed a glass transition temperature of 322 °C and crystal melting range of 440−480 °C, the first ever reported thermal properties for this polymer. No other thermal transitions occurred up to 500 °C.
Modelling was initially performed by constructing a repeat unit of the polymer whose structural parameters were derived from the analogous six rings oligomers as well other related structures from past works11,12,13. This structure was energy minimized using Dreiding Force Field resulting an almost linear zig-zag chain conformation. An arbitrary unit cell of dimension 20.0 × 20.0 × 18.0 Å was created compris-ing of 2 minimised chains structurse, one along the centre of the unit cell and the other passing through the origin with both parallel to c�axis. Successive optimization of the system was performed so as to give a simulated x-ray diffraction pattern comparable with the experimental. This operation finally led to a final structure with two diagonally-related chains, gener-ated by b-glide symmetry, one passing along the c-axis and
+ Cl COClAlCl3
TCB, 110 oC
O
Cl
Bond Distance(Å) Bond Angle(o) Bond Angle(o)
O-C9 1.240 C3-C8-C7 118.5 C7-C6-C5-C4 1.4
C1-C2 1.394 C1-C2-C3 120.6 C3-C4-C5-C6 -178.0
C6-C9 1.470 C3-C4-C5 118.0 C1-C2-C3-C4 0.1
C2-C3 1.492 O-C9-C10 119.6 C5-C6-C9-C10 -29.7
C6-C9-C10 120.0
Fig. 1. Crystal structure of poly(4,4'-biphenyleneketone) in various; projections:(a) bc plane, (b) ac plane, (c) ab plane
Table I Selected bond, angles and torsion angles for 1,4-polybiphenyleneketone

Chem. Listy 103, s1−s148 (2009) PMA 2009 & 20th SRC 2009 Contributed Lectures
s99
the other, parallel to this, at the centre of the unit cell, with the carbonyl groups in register between the chains. The unit cell was orthorhombic in space group Pbcn with dimensions a = 7.56, b = 6.384 and c = 18.000 Å Rietveld Refinement was performed on the minimized crystal system which finally led to a Rwp value of 0.092.. Selected chain conformation was given in Table I and the crystal structures viewed from vari-ous projection were shown in Fig. 1. Rietveld refinement plot was shown in Fig. 2. The aromatic rings in the biaryl unit are co-planar, with the C�C bond connecting the two rings set at 1.48 Å, whilst the C-Ocarbonyl distance is 1.23 Å. The space group of the polyketone found here is similar to the analogous polymer, poly(4,4'-biphenylene ether)14 substantiating further the proposal that aromatic carbonyl and ether groups are crys-tallographically interchangeable.
Conclusion An aromatic polyletone without ether linkage was suc-
cessfully synthesized and its crystal structure elucidated. The polymer adopt space group of Pbcn with unit cell dimension a
= 7.56, b = 6.384 and c = 18.000 Å. The biphenylene unit adopted a coplanar conformation with the carbonyl linkage torsional angle of ca. 37°. This work substantiate further that ether and carbonyl linkages are crystallogaphically equiva-lent.
The first author would like to acknowledge the sponsorship from Public Service Department and Universiti Sains Malay-sia for the support of this study.
REFERENCES 1. Blundell D. J., Newton A. B.: Polymer 32, 308 (1991). 2. Rong-Ming Ho, Stephen Z. D. Cheng, Howard P. Fisher,
Ronald K. Eby, Benjamin S. Hsiao, Kenncorwin H. Gardner: Macromolecules 27, 5787 (1994).
3. Waddon A. J., Keller A., Blundell D. J.: Polymer 33, 27 (1992).
4. Dawson P. C., Blundell D. J.: Polymer 21, 577 (1980). 5. Fratini A. V., Cross E. M., Whitaker R. B., Adams W.
W.: Polymer 27, 861 (1986). 6. Blundell D. J., Liggat J. J., Flory A.: Polymer 33, 2475
(1992). 7. Baxter I., Colquhoun H. M., Kohnke F. H., Lewis D. F.,
Williams D. J.: Polymer 40, 607 (1990). 8. Blundell D. J., Bayon V.: Polymer 34, 1354 (1993). 9. Rabias I., Langlois C., Provata A. B., Howlin J.,
Theodoru D. N.: Polymer 43, 185 (2002). 10. Aldred P. L., Colquhoun H. M., Williams D. J., Blundell
D. J.: Macromolecules 35, 9420 (2002). 11. Kendrick J .J.: J. Chem. Soc. Faraday Trans. 86, 3995
(1990). 12. William D. J., Colquhoun H. M., O�Mahoney C. A.: J.
Chem. Soc. Commun. 1994, 1643. 13. Colquhoun H. M., William D. J.: Macromolecules 29,
3311 (1996). 14. Simcock M. N.: Final Year Project B.Sc (Hons) Thesis,
University of Salford 1998.
Fig. 2. Rietveld Refinement plot for poly(4,4'-biphenyleneketone)