1 introduction - erasmus university thesis repository · web viewas a result, actuarial- and...
TRANSCRIPT

Erasmus University Rotterdam
Erasmus School of Economics
Economics & Business
Master Accounting and Finance
The Economic Consequences of New Pension
Accounting Standards on Pension Arrangements
A comparison between the Netherlands and UK
Master Thesis
Student:
Murat Aslan
Supervisor
Mr. Drs. C.D. Knoops
Co-reader
Prof. Dr. M.A. van Hoepen
Rotterdam, October 2009
Acknowledgments: First of all I would like to express my greatest thanks to my supervisor Mr. Drs. C.D. Knoops, who has guided and encouraged me throughout this thesis process and who has spent a lot of time and effort to keep me on the right way. And I would like to thank my teammate Wai-On Man, together we have written the preliminary paper on this topic. Finally, I would like to thank my family and friends for their support.

Abstract
The introduction of new accounting standards can have economic consequences for the pension arrangements between employer and employee. Prior studies evidenced the shift of the investment risk from employees to employers through redefinition of pension contracts from Defined Benefit schemes to Defined Contribution schemes in countries like the US, UK, Australia, Canada, and the Netherlands. However, this shift shows different trends in some countries. In a DC scheme the employer contributes a
fixed amount to the pension scheme. When the employee retires, the employee will receive an
amount that is based on the paid contribution and the investment returns. The employer has no
further obligation to contribute to the pension scheme in times of shortages. In a Defined
Benefit scheme the employer must make additional contributions to the scheme in times of
shortages, because the employer promises the pensions for retires in this contract. The UK is known by a strong shift to Defined Contribution schemes, while Dutch pension schemes preserve their Defined Benefit characters. This master thesis investigates whether the introduction of new pension accounting standards IAS 19 and FRS 17 are associated with the choice of the employers in the UK and Netherlands, to redefine the pension arrangements with the employees, and whether the pension rearrangements in both countries are explained by the same company specific characteristics. This study is based on the Dutch and UK’s institutional context, respectively investigated for the years 2003 to 2008 and 2000 to 2005. The UK is used as comparison for the Netherlands to explain the probable influence of institutional settings on pension scheme changes. This study shows that differences between the Netherlands and UK in Pension culture, Governance structure of pension schemes, Influence of Politics, and National regulatory systems are determinants for the different trends in the shift to Defined Contribution schemes. The company specific characteristic Funding Ratio shows different trends between shifted and non-shifted companies in both countries. The Funding Ratio for shifted companies seems lower than the Funding Ratio for non-shifted companies. Companies which are not able to cover the funding shortages in the pension scheme are the first to shift. This study shows also a difference in the company specific characteristic Pension Size ratio between shifted and non-
2
shifted Dutch companies. Companies which are smaller in size in comparison to their pension scheme size are apparent shifters to Defined Contribution schemes.
ABSTRACT.................................................................................................................................................2
1 INTRODUCTION....................................................................................................................................5
1.1 INTRODUCTION-STATE OF AFFAIRS....................................................................................................51.2 PREVIEW OF THE THEORETICAL FRAMEWORK...................................................................................51.3 DESCRIPTION OF THE PROBLEM SETTING............................................................................................81.4 DELINEATION AND RESEARCH QUESTION.........................................................................................101.5 STRUCTURE.......................................................................................................................................13
2 ECONOMIC CONSEQUENCES: IMPACTS OF CHANGING ACCOUNTING STANDARDS14
2.1 INTRODUCTION.................................................................................................................................142.2 ECONOMIC CONSEQUENCES: DEVELOPMENT AND IMPORTANCE IN STANDARD SETTING.................152.3 ANALYZING ECONOMIC CONSEQUENCES: A MATTER OF PERSPECTIVE............................................17
2.3.1 Positive accounting approach..................................................................................................172.3.2 Behavioural accounting approach...........................................................................................182.3.3 Market-based accounting approach.........................................................................................18
2.4 ECONOMIC CONSEQUENCES: LOBBYING BEHAVIOUR.......................................................................202.4.1 Why Lobby?..............................................................................................................................202.4.2 Characteristics of lobbyists......................................................................................................212.4.3 Lobbying and Institutional Settings..........................................................................................22
2.5 CONCLUSION AND SUMMARY...........................................................................................................23
3 LITERATURE REVIEW: ECONOMIC CONSEQUENCES AND PENSION ACCOUNTING.24
3.1 INTRODUCTION.................................................................................................................................243.2 MOTIVES FOR THE SHIFT..................................................................................................................24
3.2.1 Macro-economic Explanations................................................................................................253.2.1.1 The New Economic Theory...............................................................................................................253.2.1.2 The Risk Averse Employers Theory..................................................................................................253.2.1.3 The Excessive Regulation Theory.....................................................................................................263.2.1.4 The Rational Worker Theory.............................................................................................................26
3.2.2 Micro-economic Explanations.................................................................................................263.2.2.1 The Integration Theory......................................................................................................................263.2.2.2 The Separation Theory......................................................................................................................273.2.2.3 The Insurance Theory........................................................................................................................27
3.3 INTEGRATION OF PERSPECTIVES.......................................................................................................283.4 LITERATURE REVIEW........................................................................................................................283.4 CONCLUSION.....................................................................................................................................32
4 INSTITUTIONAL SETTINGS............................................................................................................33
4.1 INTRODUCTION.................................................................................................................................334.2 THE DUTCH PENSION CULTURE........................................................................................................34
4.2.1 Pension plan evolution: DB- and DC-contracts, 1998 to 2006..............................................344.2.2 Pension accounting: IAS 19 ‘Employee Benefits’ versus RJ 271............................................364.2.3 Fair Value Accounting.............................................................................................................374.2.4 Criticism on the changing pension regulations........................................................................374.2.5 Recent developments of pension accounting in the Netherlands.............................................39
4.3 THE ENGLISH PENSION CULTURE AND DEVELOPMENTS UP TO 2001................................................41
3
4.3.1 Pension plan evolution: DB- and DC-contracts.....................................................................414.3.2 The introduction of FRS 17......................................................................................................424.3.3 Criticism on the introduction of FRS 17..................................................................................43
4.4 THE DIFFERENCES IN INSTITUTIONAL SETTINGS BETWEEN THE NETHERLANDS AND UK................444.4.1 The introduction of FRS 17 in UK and IAS 19 in the Netherlands..........................................444.4.2 Differences in National regulations between the UK and Netherlands...................................454.4.3 The governance of occupational pension schemes: A comparison between the Netherlands and UK..............................................................................................................................................464.4.4 Collective risk sharing.............................................................................................................474.4.5 Influence of politics..................................................................................................................47
4.5 CONCLUSION.....................................................................................................................................48
5 METHODOLOGY................................................................................................................................50
5.1 INTRODUCTION.................................................................................................................................505.2 RESEARCH DEVELOPMENT...............................................................................................................505.3 SAMPLE SELECTION..........................................................................................................................52
5.3.1 Group 1 and 2; Dutch sample..................................................................................................525.3.2 Group 3 and 4; UK sample......................................................................................................52
5.4 PERIOD OF INVESTIGATION...............................................................................................................535.5 DATA ANALYSIS...............................................................................................................................53
5.5.1 Funding ratio......................................................................................................................545.5.2 Funding Ratio Volatility.....................................................................................................545.5.3 Cash flow from investments................................................................................................555.5.4 Maturity ratio......................................................................................................................565.5.5 Pension Size ratio...............................................................................................................56
5.6 DATA COLLECTION...........................................................................................................................575.7 RESEARCH METHODOLOGY DUTCH SAMPLE: EXPLORATIVE RESEARCH........................................575.8 RESEARCH METHODOLOGY UK SAMPLE: ANALYSIS OF VARIANCES (ANOVA)...........................58
5.8.1 One-Way ANOVA and Hypotheses..........................................................................................585.8.2 Assumptions One-Way ANOVA................................................................................................595.8.3 Non-Parametric Method: Kruskal-Wallis ANOVA test...........................................................60
5.9 IMPROVEMENT ON PRIOR STUDIES....................................................................................................605.10 LIMITATIONS...................................................................................................................................61
6 RESULTS OF THE RESEARCH........................................................................................................62
6.1 INTRODUCTION.................................................................................................................................626.2 RESULTS EXPLORATIVE RESEARCH: DUTCH SAMPLE......................................................................62
6.2.1 Funding Ratio and Funding Ratio Volatility............................................................................636.2.2 Pension Size..............................................................................................................................646.2.3 Maturity Ratio..........................................................................................................................666.2.4 Cash Flow Ratio.......................................................................................................................666.2.5 Conclusion Results Dutch Sample............................................................................................66
6.3 RESULTS ANOVA TEST: UK SAMPLE.............................................................................................676.3.1 Test Assumptions ANOVA: Funding Ratio (volatility), Pension Size, and Cash Flow Ratio. .67
6.3.1.1 Homogeneity of Variances................................................................................................................686.3.1.2 Normal Distribution...........................................................................................................................68
6.3.2 Results One-Way ANOVA........................................................................................................696.3.3 Results Kruskal-Wallis one-way analysis of variance test.......................................................70
6.3.3.1 Kruskal Wallis ANOVA: Funding Ratio volatility...........................................................................716.3.3.2 Kruskal Wallis ANOVA: Pension Size.............................................................................................716.3.3.3 Kruskal Wallis ANOVA: Cash Flow Ratio.......................................................................................71
6.3.4 Conclusion Results UK Sample................................................................................................716.4 COMPARISON DUTCH SAMPLE AND UK SAMPLE.............................................................................72
7 INSTITUTIONAL SETTINGS EXPLAINING THE RESULTS.....................................................75
7.1 INTRODUCTION.................................................................................................................................757.2 PENSION ACCOUNTING REQUIREMENTS...........................................................................................767.3 NATIONAL REGULATORY RULES......................................................................................................767.4 GOVERNANCE STRUCTURE OF OCCUPATIONAL PENSION SCHEMES...............................................777.5 PENSION CULTURE: INFLUENCE OF POLITICS AND SOCIAL SOLIDARITY.........................................77
4
7.6 COMPARISON: EXPECTATIONS AND PRIOR STUDIES........................................................................78
8 CONCLUSION......................................................................................................................................81
REFERENCES...........................................................................................................................................85APPENDIX I SUMMARY LITERATURE REVIEW...................................................................................89APPENDIX II DUTCH SAMPLE.........................................................................................................91APPENDIX III UK SAMPLE...............................................................................................................93APPENDIX IV RATIO’S DUTCH SAMPLE...........................................................................................98APPENDIX V STATISTICS FUNDING RATIO....................................................................................100APPENDIX VI STATISTICS FUNDING RATIO VOLATILITY...............................................................101APPENDIX VII STATISTICS PENSION SIZE AND CASH FLOW RATIO................................................102APPENDIX VIII DESCRIPTIVE STATISTICS....................................................................................103Appendix IX Comparison Dutch and UK sample: Mann-Whithney U test..................................104
5

1 Introduction
1.1 Introduction-State of Affairs
All around the world we can observe a lot of changes in the pension systems. Changes
in demography, economic circumstances, regulations, and also accounting standards have
economic impacts on the structure of pension schemes. Nowadays, in the Netherlands there is a
shift observable in the occupational pension schemes from Defined Benefit (DB) schemes to
Defined Contribution (DC) schemes or Collective Defined Contribution (CDC) schemes.
1.2 Preview of the Theoretical framework
Dutch pension schemes have generally preserved their character in recent years. But,
according to Ponds and Van Riel (2006) there is a switch observable from final-pay schemes to
average-wage schemes since the beginning of this millennium. Besides, Swinkels (2006) notes
that Dutch companies recently have changed their pension schemes from traditional DB
schemes to DC or CDC schemes. The occupational pension schemes in the Netherlands are
mainly organized as DB schemes. The benefit entitlement for a DB participant is determined by
the years of service linked to a reference wage, which can be final-pay or average-wage. A DB
scheme is a contract where the employer periodically pays a premium to the pension scheme.
When the employee retires, the employee will receive an amount based on salary and years of
service. This amount will be received monthly during the rest of the retiree’s life. The employer
is obliged to fulfil the pension liabilities. In times of shortages the employer must make
additional contributions to the scheme. So, in a DB scheme the employer bears the pension
investment risk and the employee bears no risk. Up to the beginning of this millennium these
DB schemes were structured as final-pay schemes. In a final-pay scheme the employees are
promised a retirement income based on a percentage of the last earned annual salary for the rest
of their life after retirement. This amount depends on the period the employees have spent
working for the employer, and how much the employees were earning at the time they retired.
Another form of a DB contract is the average-wage scheme. The pension rights in an average-wage scheme are based on a percentage of the salary earned in each year of the working life of employees. In section 4.1.2 these different forms of DB contracts are analyzed more detailed. These average-wage contracts can be seen as a hybrid DB-DC scheme which keeps a midway position among a traditional final-pay DB scheme and DC scheme. The average-wage scheme is partly DC by nature, because the yearly
6

indexation is related to the financial position of the scheme and therefore is linked to the investment returns.
In a DC scheme the employer contributes a fixed amount to the pension scheme. When
the employee retires, the employee will receive an amount that is based on the paid contribution
and the investment returns. The employer has no further obligation to contribute to the pension
scheme in times of shortages. In this system the employees are bearing the risk.
A CDC scheme is a hybrid system that is comparable to a DC scheme for the employer
and a DB scheme for the employee. In this system the pension payments are conditional and
related to the investment performance of the scheme. The employer pays a fixed contribution
for a period that is arranged in the pension contract. So in times of shortages, the contributions
can be changed in the next period. This implies that in a CDC scheme the risk is shared among
current scheme participants and retirees. This pension scheme seems an average-wage scheme,
but technically it is a DC scheme because the risk for the employer is minimized in the pension
contract.
For accounting purposes these pension schemes have different treatments. Therefore
companies have to classify their pension schemes as DB or DC. For DC schemes, the
employers have to pay a fixed contribution and they do not face any other liability.
International Accounting Standard 19 ‘Employee Benefits’ (IAS 19), set by the International
Accounting Standards Board (IASB) requires for DC schemes to account for these contribution
as the pension expenses. IAS 19.25-27 states that in case of DC schemes, the entity’s legal or
constructive obligation is restricted to the fixed amount that it agrees to pay in the scheme. As a
result, actuarial- and investment risks are carried by the employee. A DB scheme is according
to IAS 19 a post-employment scheme other than a DC scheme. IAS 19.54 requires for DB
schemes to recognize the present value of the defined benefit obligation in the balance sheet, as
adjusted for unrecognized actuarial gains and losses and unrecognized past service cost, and
reduced by the fair value of scheme assets at the balance sheet date. All schemes that have a
constructive obligation on the part of the employer to meet pension promises should be
classified as DB, according to IAS 19.7.
Since January 2005 all listed companies in the European Union must prepare their
annual accounts in conformance with the International Financial Reporting Standards (IFRS).
For the pension accounting, the introduction of IFRS means that all listed Dutch companies
have to apply IAS 19 ‘Employee Benefits’ in their financial report. Before 2005, the listed
Dutch companies were allowed to use the Dutch accounting guideline RJ 271. Although RJ 271
was based on the principles of IAS 19, RJ 271 had more broad judgments to determine whether
a scheme is DB or DC. An exception by RJ 271 is the way how Dutch multi-employer schemes
are treated. These multi-employer pension schemes, also known as the industry-wide pension
7

schemes, are used for employers and employees in a specific industry. RJ 271.309(310) allows
Dutch companies to treat their multi-employer DB schemes as DC schemes for accounting
purposes. This is based on the fact that the pension funds in the Netherlands are autonomous
entities with their own board of directors. The companies and pension funds are separated and
the responsibilities are settled by the pension supervisor. The employer is obliged to contribute
in the pension scheme. This is the only responsibility of the employer to the pension scheme.
The sponsoring company (employer) bears no DB liability if that fact is specifically stipulated
in its financial agreement with the pension fund. This means that the individual companies are
not responsible to cover funding shortages. The influence of employers in the Anglo-Saxon
pension scheme is bigger, where this separation does not exist between company and pension
scheme. So, they kept responsible for correcting situations of under-funding (Ponds and Van
Riel, 2007). The special treatment for multi-employer schemes by RJ 271 leads to a situation
where companies treat pension schemes, which are supposed to be DB schemes according to
IAS 19, as DC schemes for accounting purposes.
According to IAS 19.29, the classification of a multi-employer scheme as a DB scheme
or a DC scheme depends on whether the employer has a constructive obligation. IAS 19.29
requires for multi-employer schemes that have the characteristics of DB schemes to account for
the proportionate part of the assets and liabilities in the scheme. This holds under the condition
when adequate information on the pension scheme’s assets and liabilities is available to the
individual employer. This situation creates some possibilities for Dutch companies to treat their
DB schemes as DC schemes, with the argument that it is not possible to obtain the information
from the industry-wide pension fund, where the assets are invested in. This situation could also
be an option for managers to bring their DB pension scheme assets under a industry-wide
pension fund, to escape the accounting requirements for DB schemes.
A significant debate ensued in the Netherlands on the classification of compulsory
multi-employer pension schemes. The outcome of the proportionate share of assets and
liabilities should not be the right reflection of the real liability of the individual participating
employer. Employers have also argued that it is questionable to classify these multi-employer
schemes as DB schemes. The governance of these types should be taken into account (EFRAG,
2008). These industry-wide pension schemes were accounted for as DC schemes under the
previous GAAP. However, under the IAS 19.25-27 these multi-employer schemes are not
allowed to be treated as a DC scheme. The exception for these multi-employer schemes might
be a temporary phenomenon resulting from a strong lobby of pressure groups like the NIVRA 1
and VNO-NCW2 (Swinkels, 2006). These organizations have requested the Dutch Accounting
Standards Board (DASB) to raise this issue with the EU Roundtable for the purpose of
1 Royal Dutch Institute of Chartered Accountants2 Confederation of Netherlands Industry and Employers
8
determining whether this issue should be put before the International Financial Reporting
Interpretations Committee (IFRIC) for resolution.3 Recently, Minister Donner of the Ministry
of Social Affairs and Employment requested the IASB to revise the accounting standards for
the Netherlands.4
Although the Netherlands does not get a special treatment for their pension schemes,
the Netherlands still seems to find another way to turn away from the new regulation. CDC
schemes are established, which has the properties of both DB and DC. The DC elements consist
of a fixed contribution by the employer for the next 5 to 10 years, which is stated in the
financing agreement between the company and the pension fund. The DB element is the fact
that the amount of contributions that the pension scheme receives is divided over the
participants according to a salary and employment formula. This means that the annual accrual
pension rights are based on an average-wage scheme as if it were DB. If the scheme qualifies as
a CDC scheme, the pension scheme will get the same accounting treatment as a DC scheme;
this means that a CDC scheme does not have to be shown in the accounting statements as a DB
scheme.
1.3 Description of the problem setting
Despite this exception, how multi-employers schemes are treated, the Dutch guideline
RJ 271 is in general comparable to IAS 19 in classifying pension arrangements. This
comparability also implies for other financial accounting standards, such as the accounting
guideline of the United States, the Financial Accounting Standards (FAS) 87 'Employers'
Accounting for Pensions' (FASB 1985), and the accounting guideline of United Kingdom, the
Financial Reporting Standards (FRS) 17 ‘Retirement Benefits’ (2003).
Definitely, it is to be considered that accounting standards are changing with an
obvious trend to harmonize international accounting practices on a ‘value based’ model (Dixon
and Monk 2008). Furthermore, the Financial Accounting Standards Board of the US and the
IASB nowadays working together to harmonize accounting standards even more.
However, this model is seen as an improvement on previous financial disclosure
regimes, it brings significant implications for the management of the company. IAS 19.54
requires for DB schemes to recognize the present value of expected future payments, which is
required to settle the obligation resulting from employee service in the current and past periods,
on the balance sheet of the company. This can bring volatility into the balance sheet of a
company with a DB scheme, because it is hard to match the assets and liabilities of a pension
scheme. It is (very) difficult to prepare an asset portfolio (coverage of the pension promises)
3 Issue paper; Application of IAS 19 to the classification of compulsory industry wide multi-employer pension scheme in the Netherlands, Brussels, 19 October 2007 4 Press release: ministry of social affairs and employment
9
that matches the long term liabilities. The liabilities are implicated promises to different
generations that are participating in a pension scheme. Since the liabilities are based on market
prices, they become more volatile. This volatility brings the solvency position of a company in
danger. So, the DB pension seems not consistent with the long term survival of the company
(Dixon and Monk 2008). Managers of companies have to choose either less risk taking (DB
scheme) or a higher solvency reserve position (DC scheme) (Ponds and Van Riel 2007). The major impact of IAS 19 is the requirement to show DB schemes
on the balance sheet of the sponsor company. On the other hand, the requirement for a DC scheme is only to count the contributions as pension expenses. This is because the employer only pays a fixed contribution in the DC scheme, and does not face any other liability, while DB schemes guarantee the benefits and thus also have to count the funding shortages. So, managers may be considering a shift to DC schemes to avoid the stricter accounting
requirements for DB schemes.
There is a lot of evidence for the shift from DB to DC schemes in the US and UK. In the US for instance, according to data from the US Department of Labour Statistics, the number of DB schemes has decreased from about 80% in 1985 to 36% in 2000. Also the percentage of participants in DB scheme decreased from 38% to 21%.5
In the UK this trend is also observable. The Association of Consulting Actuary’s (ACA) reports in the Pension Fund Survey (2005) that 52% of companies with DB schemes closed these schemes to new entrants since the year 2001.6
Prior studies investigated some feasible perpetrators of the shift from DB to DC schemes in these countries. Ostaszewski (2001) outlined reasons for the shift with different theories under which he gives ample attention to the ‘Excessive Regulation Theory’. This theory tells that stricter legal, funding, and solvency requirements were imposed after the introduction of the Employee Retirement and Income Security Act (ERISA) in 1974. And hereafter also the introduction of new accounting standards by the FASB (FAS 87) in 1985 may have contributed to the reducing attractiveness of DB schemes.
Klumpes et al. (2003) investigated the possible impact of accounting rule changes on pension scheme terminations in the UK. They mention that
5 Dikerson, B. R., Employee participation in defined benefit and defined contribution plans 1985-2000, Bureau of Labour statistics, 2003 6 UK Pension Trends Survey Report 2, Trends in: Scheme provision, contributions and scheme deficits
10

the new accounting rules (FRS 17), which require recognizing DB schemes on the balance sheets of the companies, have probably contributed to the movement from DB to DC schemes. The employer has incentives to avoid the stricter accounting requirements for DB schemes.
Brown and Liu (2001) investigated this phenomenon in Canada. However, their findings are not in line with the findings in other studies (Ostaszewski 2001 and Klumpes et al. 2003). They argue that the decline in DB schemes in Canada is not as huge as in the US. In Canada a shift is observable to ‘cash balance schemes’ which are comparable with CDC schemes. Brown and Liu (2001) also compared the US and Canada and argue that in the first place pension regulation plays a crucial role in pension scheme reform. The difference in pension regulation between Canada and US influenced employers in considering their pension arrangements.
In another research based on the US, Beaudoin et al. (2007) investigated three motivations underlying companies decisions to terminate their defined benefit (DB) schemes in the US. They study whether DB scheme termination decisions are motivated by financial accounting considerations, cash flow related incentives, and improving a firm’s competitive position. This study is based on a sample of S&P 500 companies with DB schemes. The test period is from 2001 to 2006. Using logistic regression models, they make a comparison between 55 “termination” companies and 276 companies that did not decide to terminate their DB schemes. Their findings indicate that DB scheme contribution volatility and improving the firm’s competitive position do not impact the termination decision process as significantly as management might suggest. Instead, their results imply that the effect of proposed pension accounting changes plays a primary role in the decision to terminate DB schemes.
The introduction of IFRS might also have ‘economic consequences’ for the pension contracts in the Netherlands. This master thesis investigates whether the introduction of IFRS in the Netherlands has influenced the pension contracts between employee and employer in a similar way as in the US and the UK (shift from DB to DC). This is worth to investigate because the Dutch pension governance structure is different from that of US’ and UK’s pension governance structures.
11

The Dutch pension system is known by a set of three relationships. The relation between employers and employees, between employers and pension executors, and between the employees and pension executors. The pension executor is responsible for the pension obligation to the employees. The only responsibility of the employer is the part of the contribution he must pay to that pension scheme. There are also strong preferences within the Dutch society (political and societal) for collective risk sharing, and a high level of public confidence as a core for this. These aspects might also influence the direction of the shift. Swinkels (2006) notes that contrary to the US or UK, Dutch companies seem to choose DB average-wage schemes instead of individual DC schemes.
1.4 Delineation and research question
The introduction of IFRS can have economic consequences for the pension contracts between employer and employee. This master thesis investigates whether the introduction of IFRS is associated with the choice of the employer to redefine the pension arrangements with the employees. This study is done within the Dutch institutional context. The reason for this is to involve the Dutch pension culture which the Netherlands distinguishes from other countries like the US and UK. Therefore it is necessary to compare the Dutch institutional setting with US’- and UK’s institutional settings. In this study the UK is used as comparison for the Netherlands to explain the probable influence of institutional settings on pension scheme changes.The expectation is that there might be a shift from DB schemes to DC or CDC schemes in both countries. But, this shift must be explained by company-specific characteristics and the institutional environment the companies are operating in.
To investigate this expectation, the following research question is formulated:
Are the pension rearrangements in the Netherlands explained by the same company-specific
characteristics, which also explain the shifts from DB to DC schemes in the UK?
12
In the Netherlands pension rearrangements (shifts from DB to DC and CDC) might be
associated with the introduction of IAS 19; in the UK the shifts from DB to DC might be
associated with the introduction of FRS 17. In this master thesis I try to discover trends in
pension rearrangements in both countries and I try to investigate whether these trends can be
associated with the introduction of the new pension standards.
For the investigation of this research question different companies will be analyzed which have changed their pension schemes into DC or CDC in the Netherlands and the UK. This study will be based on the period 2003 to 2008 for Dutch companies and 2000 to 2006 for UK companies.This investigation will be done in two parts, where the first part is an explorative research,
which compares the company-specific characteristics of Dutch companies which have shifted
away from DB schemes to DC or CDC schemes, with the company-specific characteristics of
non-shifting Dutch companies. The following research question is stated for the first part of the
study:
Are the shifts from DB schemes to DC or CDC schemes in the Netherlands explained by
company-specific characteristics?
The second part of the study is also an empirical research that compares the company-specific
characteristics of English companies, which have shifted away from DB schemes to DC or
CDC schemes, with the company specific characteristics of non-shifting English companies.
For the second part of this investigation the following research question is stated:
Are the shifts from DB schemes to DC or CDC schemes in the UK explained by company-
specific characteristics?
The sample for this study is divided in four groups, where Group 1 and 2 are consisting
of the companies that are based in the Netherlands. The first group consists of companies that
did not shift away from a DB scheme. Group 2 consists of companies that have shifted away
from a DB scheme to another scheme. The third group consists of companies that are based in
the UK, and did not change their pension schemes. And finally, group four consists of
companies that are also based in the UK, and have shifted away from a DB scheme to DC or
CDC schemes. The data will be collected from annual reports of these companies and the
annual reports of the pension fund associated to these specific companies. Also the databases
Thomson One Banker, DataStream, and Worldscope are used to collect data for the
computation of company specific characteristics.
13
The goal is to find any trend in pension rearrangements and associated company-specific characteristics of shifting companies in the Netherlands and the UK. This study will be limited to companies with occupational pension schemes. Another limitation is that these companies are required to be indexed on the Dutch AEX for Dutch companies and FTSE
for English companies. The Dutch study is an explorative research, and will only be based on companies that are included in the research sample.
Political economies differ in various institutional ways. These institutional settings can
have influences on the movements towards a DC or CDC scheme. Therefore, this study will
additionally analyze the Dutch and the UK’s pension system and the pension evolution. The
Dutch and the UK’s institutional settings will be compared to get more insight in the probable
differences in the pension rearrangements in both countries.
The following research question is formulated to investigate the pension rearrangements from
an institutional view:
Which institutional aspects are associated with the shift towards a DC or CDC scheme?
With the introduction of IAS 19 in the Netherlands a debate ensued on the
classification of compulsory multi-employer pension schemes. The NIVRA and VNO-NCW
lobbied against the new requirements. Recently, Minister Donner of the Ministry of Social
Affairs and Employment requested the IASB to revise the accounting standards for the
Netherlands. This lobby was unique, because other countries where standards (FRS 17 in UK)
were adapted similar to IAS 19 reacted not with a high scaled lobby as in the Netherlands. The
Dutch regulatory environment around pension accounting differs from other countries. In the
context of this research, there is also need for an analysis of the UK’s institutional environment
to make a comparison between the Dutch and English institutional environment. This
investigation will add value to this research when analyzing the economic consequences of the
introduction of IAS 19 and FRS 17. These economic consequences, if they exist, might be
associated with the ongoing lobby in the Netherlands. Besides, this lobby should be on his turn
associated with the institutional environment of the Netherlands.
1.5 Structure
Chapter 2 discusses what economic consequences are from the perspectives of several
authors, the rise of the economic consequences in the standard setting process, and the
influence of economic consequences in the standard setting process. Different research
14
approaches are considered to explain what kind of impacts the standard setting process could
have on the behaviour of the market and its participants. Chapter 3 is a literature review and
analyzes several studies based on different countries. The economic consequences of the
introduction of new accounting standards are considered. These studies are approaching the
economic consequences of accounting standards from different accounting theories. Chapter 4
describes the pension system and the evolution of the pension system in the Netherlands and
the UK. This analysis is based on the pension structure and the movements in the pension
system. Subsequently, the introduction of new accounting standards and legislation, and those
potential economic consequences on the pension structures of both countries are analyzed. This
chapter compares the differences in institutional settings of both countries. Chapter 5 describes
the methodology of this study. Chapter 6 presents and analyses the results of my empirical
investigation. In chapter 7 the findings of the empirical research are analyzed using the
institutional settings of the Netherlands and UK as background. Chapter 8 follows with a
summary and conclusions.
15

2 Economic consequences: Impacts of changing accounting
standards
2.1 Introduction
Changing pension contracts in the Netherlands, from DB to another pension scheme,
are supposed to be economic consequences of the introduction of IFRS. Economic
consequences are impacts of changing accounting standards. Several economists (Zeff, 1979;
Rappaport, 1977; Wyatt, 1986; Blake, 1992) have mentioned that the implementations of new
accounting standards are not only influencing the accounting numbers in the annual accounts.
The standard-setting process and its outcome can have an impact on the behaviour of different
market participants for example managers, preparers, auditors, and users of accounting
information. Accounting standards are the results from a difficult interaction between several
interested groups. The standard setting process is a complicated political procedure. Watts and
Zimmerman (1979) are arguing that the government regulations are creating incentives for
individuals to lobby on planned accounting procedures. Therefore, some individuals and groups
take steps in this process to ensure the standard setter is aware of their perspective. Different
parties lobby to influence the outcome in a way which they prefer. So, before a new accounting
standard becomes effective, a whole political process is experienced. In this process several
interested parties are involved like standard setters, users and preparers of financial reports,
academics, and auditors. When setting a standard these economic consequences are taken into
consideration.
It is possible to analyze economic consequences from a positive accounting-,
behavioural-, and a market-based approach. These approaches analyze different aspects of the
economic consequences due to changing standards. The positive accounting approach analyzes
the economic decisions behaviour of managers. This perspective tries to answer why a manager
make certain accounting choices. This is explained by firm-specific characteristics. Part of the
economic consequences literature tries to explain the lobbying behaviour of companies by
investigating firm-specific characteristics. The positive accounting research is further described
in section 2.3.1.
The behavioural accounting view approaches the economic consequences as effects on
judgements and decisions made by individuals or groups. This approach gives an answer on
how managers, users, and investors respond to the changing accounting standards. Section 2.3.2
describes the behavioural accounting view.
Research based on measuring information content (event study) or measuring value
relevance (association study) are examples of market based research. The market-based
16
accounting approach studies the relation between accounting numbers and the capital market.
Lev and Ohlson (1982) are explaining the market based accounting research as the research into
the association between publicly disclosed accounting information and the consequences of the
use of this information by the shareholders; as such consequences are reflected in
characteristics of common stock traded in major markets.
Knoops and Korthals (1996) state the main research question in market-based
accounting research as: What is the information content of accounting information? The
information content is measured by the influence on security prices, testing the markets ability
to "see through" the differences in earnings that are due to differences between accounting
methods. It is based on some form of efficient market hypothesis (Knoops and Korthals, 1996).7
This chapter describes the role of economic consequences and lobbying behaviour in
the standard setting process. The second section explains what economic consequences are with
an eye on the rise and development in the standard setting process. The third section describes
different research perspectives which can be used to investigate economic consequences of
accounting standards. And finally to make this chapter complete, Section 2.4 will explain the
relation between lobbying behaviour and economic consequences in the standard setting
process.
2.2 Economic consequences: Development and importance in standard setting
Several authors have defined the “economic consequences” from their point of view.
Zeff (1978) notes, that the accounting profession became aware in the 1960s of the growing
influence of “outside forces” in the standard setting process. Individuals and groups entered the
accounting discussion. These groups participated significantly in the standard setting process.
Also arguments were invoked by these groups which were new in the accounting discussion.
These arguments were mentioned as “economic consequences”.
Rappaport (1977) saw a growing recognition that the setting of financial accounting
standards needs a broader view rather than simply a technical accounting perspective. He notes
that the broader perspective comes from a growing recognition that the legislation of
accounting standards involves a potential redistribution of wealth. Rappaport divides the
“economic consequences” into three categories. He notes that financial accounting standards
are affecting the behaviour in the economy. This behaviour affects the wealth distribution in
three ways: By their effect on the behaviour of intended recipients of corporate reports
(shareholders and other investors). Secondly, accounting requirements may affect the behaviour
of external stakeholders, others than shareholders and investors, who are also interested in the
7 Paper presented at the 19th Annual Congress of the European Accounting Association, Bergen, Norway, May 1996: Philosophical preconditions of market-based accounting research.
17
numbers of the accounting reports. For example competitors, labour unions, suppliers,
government, etcetera. They can use this as basis for own decision making behaviour, and
change their behaviour in business according to the financial reports. And finally, Rappaport
names the effect on the behaviour of the reporting company. Changing accounting requirements
measurements or standards will influence the behaviour of the managers. The manager can
choose for an alternative decision to face the required accounting numbers.
Wyatt (1986) states that accounting standards setters have became aware of, and have
given consideration to the economic and social consequences of a standard to be adopted.
Historically accounting standards were based on technical accounting considerations rather than
on the economic and social consequences. The concerns are then more related to the reactions
by the financial community than on the economic and social consequences.
Another approach comes from Blake (1992). Blake categorizes the economic
consequences into three groups. He argues that economic consequences can be divided into
impacts that arise from decision making by users of accounts and those that arise from the
mechanistic application of regulation or contracts. This approach on economic consequences by
Blake (1992) gives an overall summary of the different categories mentioned in the literature
about the different forms of economic consequences. Blake (1992) divides these “economic
consequences” in the following categories:
Compliance/ analysis costs; any change in accounting requirements increases or
reduces costs of compliance for companies. Increasing disclosure may have increasing
or reducing cost effects, in a way that obtaining the information from other sources has
a reducing effect, while this increasing disclosure will increase the cost of processing
the accounts.
Mechanistic consequences; consequences that arise because the figures reported in the
accounts trigger off a mechanism that affects the economic position of the reporting
entity. This category can also be divided into a regulatory and a contractual
mechanism.
1. Regulatory; this mechanism is devised and imposed by some regulatory body. This
may for example a tax assessment by the government on reported numbers.
2. Contractual; the form of the mechanism is defined in a contract between the
company and some other party. A change in accounting requirements can affect the
contractual agreements between the company and its contractual partner. Here, we
can think about the introduction of fair value accounting and solvency requirements
may affect the contracts between employers and pensioners. For example a switch
from DB plans to DC plans.
18

Judgemental consequences; this refers to economic consequences that arise because of
decisions taken by readers of accounts. Blake categorizes this into micro- and macro
levels.
1. Micro level; users of accounts can change their behaviours towards the company.
2. Macro level; the figures reported in the published accounts may produce economic
consequences because a range of users are influenced in a way that affects the
political, economic, and social climate.
2.3 Analyzing economic consequences: a matter of perspective
Different theories are developed to investigate these economic consequences. A
positive accounting view approaches the economic consequences as the impact of changing
accounting standards on economic decision making behaviour of different market participants.
When we take the economic consequences concept broader, also capital market aspects and
behavioural aspects can be investigated. There are several theoretical approaches to in the
accounting study.
2.3.1 Positive accounting approach The positive accounting approach attempts to explain behavioural relationships in
accounting. It tries to answer why managers chose particular accounting alternatives. As can be
seen from figure 1, when de standard setter issues an exposure draft, management of firms are
lobbying to influence the decision process. A positive accounting study for example
investigates the firm specific characteristics of firms that are lobbying against an introduction
of a new accounting standard. When looking further in the standard setting process (see figure
1), there can be seen that the accounting change has several impacts. An accounting change
may influence the contracts of different market participants. Examples are changing contracts
of pension arrangements and the management compensation contracts. A research based on the
firm specific characteristic of shifting firms from DB pension plan to DC pension plan is an
example of a positive accounting research. Swinkels (2006) has investigated Dutch public listed
companies with the results that a few companies have changed their pension plans, and the
managers of these companies have mentioned the IFRS as the reason for redefining their
pension contracts. The second part of his study is an empirical study based on 24
companies of the major Dutch stock market index, to discover whether there is a trend
or whether company specific characteristic can be associated with switching pension
schemes.
Another example of a positive accounting research is based on the introduction of SFAS 13,
where Imhoff and Thomas (1988) have investigated the financial statement effects of lease
capitalization. This study shows a significant association between the introduction of SFAS 13
19
and the decline in financial lease contracts. Besides, it was observable that many firms
renegotiated their lease contracts from financial lease to operational lease contracts.
2.3.2 Behavioural accounting approach The behavioural accounting research is based on the concept of how users of
accounting information make decisions and what information they need (Wolk et al., 2004).
Behavioural research pays attention to the psychological aspects of decision making. In the
context of economic consequences this research theory can be used to investigate the reactions
of market participants following a change in accounting standard. From figure 1 can be seen
that the behavioural accounting research can be based on judgements and decisions by
individuals according to changing accounting standards. An example is a survey based study on
the perception of managers, users, and auditors, before or after a change in accounting
requirements or an issue of exposure draft. An example of such a study is done by Beattie et al.
(2006). This behavioural accounting research is based on a discussion paper of the G4+1 which
proposes that all leases should be recognized on the balance sheet. Beattie et al. (2006) have
used a questionnaire survey of 132 U.K. users and preparers, to investigate the perceptions of
these respondents. The results indicate that users and preparers are accepting that the old lease
accounting standards have deficiencies, but they do not agree on the way forward and believe
that the proposal would lead to significant economic consequences like lease terms becoming
shorter to minimize balance-sheet obligations.
2.3.3 Market-based accounting approach As described in the introduction section of this chapter the research based
on measuring information content (event study) or measuring value relevance (association
study) are examples of market based research. As can be seen from figure 1 there can be made
a distinction between two forms of research within the market based accounting research.
Baruch and James (1982) are explaining the market based accounting research as the
research into the association between publicly disclosed accounting information and the
consequences of the use of this information by the equity investors; as such consequences are
reflected in characteristics of common stock traded in major markets. An association study
investigates the association between accounting information and market variables like firms’
rate of return and share price (Brown and Howieso, 1998).
Knoops and Korthals (1996) state the main research question in market-based accounting
research as: What is the information content of accounting information? The information
content is measured by the influence on security prices, testing the markets ability to "see
through" the differences in earnings that are due to differences between accounting methods. It
is based on some form of efficient market hypothesis (Knoops and Korthals, 1996).
20

An example of a market based accounting research, is a research done by Aboody et al. (2004)
to the association between share price and stock-based compensation expense that is disclosed
but not recognized under SFAS No. 123, after controlling for net income, equity book value,
and expected earnings growth. Their instrumental variables approach controls for the
mechanical relation between share price and option values. Aboody et al. (2004) find that
investors view SFAS No. 123 expense as an expense of the firm, and as sufficiently reliable to
be reflected in their valuation assessments. Findings based on annual returns indicate SFAS No.
123 expense reflects on a timely basis changes in investor-perceived costs associated with
stock-based compensation. Another example is the study done by Dechow et al. (1996),
regarding the approaches in evaluating the nature and extent of the predicted economic
consequences of accounting for employee stock options in the United States.
Figure 1: Research approaches: Positive accounting-, Behavioural accounting-, and Market Based accounting
research
Source: Knoops 2008
21
2.4 Economic consequences : Lobbying behaviour
Setting of Financial accounting standards is a political activity. Financial accounting
standards are regulations, which are restricting the possibilities of accounting methods for the
management of financial institutions. This means that financial accounting standards are
obliging companies to report financial information in a structure for which companies not have
chosen. Sutton (1984) argues that a party, whether manager, investor or auditor, who is affected
by such a regulation, will try to influence the standard setter to write the regulations to his
benefit. To find any balance between these different interested parties, the standard setter must
be aware of the probable consequences of a standard. Therefore, some individuals and groups
take steps in this process to ensure the standard setter is aware of their perspective. Different
parties lobby to influence the outcome in a way which they prefer. Therefore, because of the
inherent character of accounting standards, their making is the product of a political, rather than
a technical or economic process. The actions the interested parties are taking to influence the
standard setter, are called lobbying activities. These lobbying activities can be varying from
written submissions to the rule-makers to pressure brought to bear on elected representatives or
government agencies (Sutton, 1984). So, this political lobbying process offers potential
participants opportunities and means by which they can pressure the final form of the standard.
Consequently, lobbying decisions would involve a set of interrelated aspects. These
include: whether to lobby or not; which method(s) of lobbying to use (e.g., submission of
comment letters or meetings with the standard setter); when to lobby (e.g., during the drafting
stage of a discussion paper or after its exposure for public comment); and what arguments to
use to support a position (e.g., theoretical or economic consequence arguments) (Georgiou,
2004). According to Sutton (1984), the prior question which must be answered to understand
the lobbying behaviour is why parties decide to lobby.
2.4.1 Why Lobby?
Lobbying behaviour is, according to the rational choice theory, determined by self-
interest and the concept of choice. The choice of an interested party to lobby is considered to be
a function of lobbying costs and benefits accrued from successful lobbying (Georgiou, 2004).
Another theoretical view (political economy of accounting) suggests that standard setting
arrangements are reflections of the power relations in society, designed to defend and maintain
the interests of a few dominant groups (Sikka, 2001).
To understand this lobbying behaviour Sutton (1984) refers to the political science single-
period voting model of Downs (1957). Sutton (1984) suggests that lobbying and voting have
much in common. Lobbying and voting can be seen as an investment good. Individuals invest
in an activity, because they expect a future benefit. So, a rational individual will only allocate
22

resources to lobbying if the expected benefits of the activity exceed the costs. The individual
will also take the likelihood into account that his decision to lobby will affect the outcome of
the standard setting process. So, an individual will only lobby if the product of the probability
that his lobby would effect the standard setter and the expected standard differential will
exceeds the cost of the lobby (Sutton,1984).
2.4.2 Characteristics of lobbyists
The characteristics of lobbying parties can be generalized into four types. It is important to
know for which individual it is worthwhile to lobby. The analysis of the characteristics of
lobbyist done by Sutton (1984) shows the following generalization:
1. Producers of financial statements are more likely to lobby than consumers of such
statements;
2. Large producers are more likely to lobby than small producers;
3. Undiversified producers are more likely to lobby than diversified producers.
The benefits of lobbying against or in favour of an accounting standard, is for financial
statement preparers more than for users of financial statements. One of the reasons for this is
that the preparer of a financial statement is wealthier than the consumers of his product. The
lobbying activity is too costly for the individual user. This also holds for the fact that large
producers have more incentives to lobby as they are richer than smaller producers and therefore
their expected benefits from lobbying are generally large enough to balance the costs. This is in
line with the rational choice theory which states that an individual will lobby if the benefits are
exceeding the costs of the lobby. In case of large users like pension funds there exists a
difference between preparer and user in the degree of portfolio diversification. This means that
the income of producers of financial statements depends on few resources. On the other hand,
the income for large users depends on many sources because of portfolio diversification. So,
with a proposed standard the economic impact for less diversified producer might be more. On
the other hand, less diversified producers are more likely to lobby than diversified producers
and raising (lowering) the cost of non-compliance will increase (reduce) the level of producer
lobbying (Jorissen et al., 2007). Thus, lobbying activities will be more among producers on
whom the effects of a proposal/standard (industry-specific standard) are more heavily. But it is
important to know in the context of this research that this generalization holds, irrespective of
the institutional environment where the standard is being set. The level of lobbying will be
different across regulatory environments.
23

2.4.3 Lobbying and Institutional Settings
Lobbying behaviour is an important activity in the standard setting process used by
constituent parties to influence the process of accounting standard setting. Most of the studies
about lobbying behaviour are based on a single country approach. This means that these single
country approaches are trying to find the drivers of lobbying behaviour by focussing on
lobbying activities related to one standard at a time in a single country (Jorissen et al., 2007).
According to Jorissen et al. (2007) it is reasonable that the economic consequences of a
standard will differ among countries. On his turn the lobby in these countries on a specific
standard would not be the same.
The ongoing process to harmonize accounting standards globally leads to revisions and
changes of current accounting systems and standards. With the introduction of IFRS all listed
companies in the EU are required to prepare their financial reports following the rules of IFRS.
The national standard setters are adapting the requirements of IFRS in their national accounting
system. However, this harmonization process is not passing easily every time. There are some
difficulties with these international standards, which do not take institutional settings of
countries into account.
With the introduction of IAS 19 in the Netherlands there ensued a debate about the
classification of DB plans. This lobby was unique because constituencies in other countries,
where standards (FRS 17 in UK) were adapted similar to IAS 19, reacted not with a high scaled
lobby as in the Netherlands. The Dutch regulatory environment around pension accounting
differs from other countries. The economic consequences of IAS 19, if they exist, might be
associated to the ongoing lobby in the Netherlands. Besides, this lobby should be on his turn
associated with the institutional environment of the Netherlands. This together means that the
cost of applying IAS 19 in the Netherlands is much more costly for Dutch companies than
adapting FRS 17 in the UK for English companies. So, the economic consequences of the
introduction of IAS 19 in the Netherlands might be different from that of the UK.
24
2.5 Conclusion and Summary
Economic consequences are impacts of changing accounting standards. Several
economists have mentioned that economic consequences are beyond the reflections of the
decision made by managers. Accounting standards and accounting reports have impacts on the
real decision made by managers and others. During the years, the accounting profession
became aware of these impacts. Standard setting was not only based on technical accounting
considerations any more. This process was receiving a more broad view than only a technical
accounting perspective. Groups and individuals entered the accounting discussion to lobby
against or in favour of the accounting standards to be adopted. Different parties lobby to
influence the outcome in a way which they prefer. So, before a new accounting standard
becomes effective, a whole political process is experienced. In this process several interested
parties are involved like standard setters, users and preparers of financial reports, academics,
and auditors.
The economic consequences can be analyzed from different approaches. These
approaches are analyzing different aspects of the economic consequences due to changing
standards. The positive accounting approach is in this concept based on the impact on economic
decisions behaviour by managers. This perspective tries to answer why a manager makes a
certain decision (section 2.3.1). The economic consequences can also be analyzed from a
behavioural accounting view. The behavioural accounting view approaches the economic
consequences as effects on judgements and decisions made by individuals or groups of
investors. This approach gives an answer on how managers, users, and investors are responding
to the changing accounting standards (section 2.3.2). Research based on measuring information
content (event study) or measuring value relevance (association study) are examples of market
based research (section 2.3.3).
25

3 Literature Review: Economic Consequences and Pension
Accounting
3.1 Introduction
International accounting standard setters are facing difficult economic constructions in
the accounting standard setting process, because of the complex and globalizing economic
environment where the constituencies are operating in. To face the current and future market
circumstances, international standard setters are attempting to introduce internationally
accepted accounting standards. The FASB and the IASB are working together to harmonize
accounting standards globally. The year 2005 represented the first year of adopting IFRS in the
EU. Since the year 2005, all listed companies are required to prepare their financial statements
following the IFRS. The adoption of the IFRS meant for many companies a change in the way
these companies account for pension schemes, mainly DB schemes. IAS 19 ‘Employee Benefit’
is, as product of the harmonization process, based on other financial accounting standards, such
as the accounting standard of the United States, the Financial Accounting Standards (FAS) 87
'Employers' Accounting for Pensions' introduced by the FASB in 1985 and SFAS 158 as
amendment on SFAS 87 introduced in 2006, and the accounting standard of the United
Kingdom, the Financial Reporting Standards (FRS) 17 ‘Retirement Benefits’ introduced in
2001. Changing pension accounting regulations have motivated several authors and parties to
investigate the impacts on pension schemes. This chapter overviews several empirical studies,
based on the introduction of IAS 19, FRS 17 and FAS 87 and their probable economic
consequences.
3.2 Motives for the shift
This section describes prior studies based on the shift away from DB schemes to DC or
CDC schemes. To offer more insight in the possible reasons of the shift the macro-economic
factors described by Otaszewski (2001) and Brown and Liu (2003) and micro-economic factors
used by Klumpes et al. (2001) and Swinkels (2006) are discussed in this chapter. When
comparing these different studies it is remarkable that the shift away from DB schemes can be
analyzed from different levels. However, these theories should not be seen as separate
perspectives. It will add value to thesis when considering these theories as complements. The
macro-economic environment can be seen as the institutional environment where individuals
(employers, employees, etc.) are operating in. The decisions taken by these individuals are
influenced by the macro-economic forces (culture, regulations, economic situation, etc.). So,
when investigating economic consequences of an accounting standard based on a specific
26
sample it is important to analyze the institutional setting of this sample first (macro-level).
When doing so, it will be more understandable why an activity occurs on micro-level. This will
help to explain differences in responses (economic consequences) by parties that are exposed to
the same action (introduction of accounting standards).
3.2.1 Macro-economic Explanations
There are several studies that investigated the reasons of shifts from DB
pension schemes to other pension schemes. Ostaszewski (2001) provides four theories as
possible reasons for the decline in DB pension plans in the US. These are the New Economic
Theory, the Excessive Regulation Theory, the Risk Avers Employers Theory, and the Rational
Worker Theory. These theories are useful in understanding the probable reasons for the shift
from DB schemes to DC schemes.
3.2.1.1 The New Economic Theory The New Economic Theory argues that the workforce nowadays becomes more
mobile. So, employers are switching more rapidly from company and are not retiring in the
company where they began to work. This change may influence the perspective of today’s
employers to provide more flexible pension benefit schemes to meet the employee’s needs who
wants the transportability of their assets. The employees also desire to control their own assets,
so they need direct ownership of their assets. Besides, developments in culture, education and
technology have caused that the employees are becoming more independent and self-directed.
This development is observable in the increasing numbers of self-employed people and the
diluting relation between employers and employees. Together, employers and employees are
expressing more focus on their self-interest. Contrasting DB schemes, DC schemes offer
diverse and partial measures of asset accumulation and more flexibility in asset allocation. DC
schemes are also more portable than DB schemes. This situation makes DC schemes more
desirable above DB schemes.
3.2.1.2 The Risk Averse Employers Theory The Risk Averse Employers Theory suggests that employers are choosing for
DC schemes above DB schemes to have control over the pension costs. The Risk Averse
Employers Theory, is based on the fact that companies have to be more competitive in a global
market. This means that companies are becoming more aware of their costs and that the
management of companies are behaving more risk-averse. With the increasing volatility in the
financial markets it is hard to forecast the funding costs of pension benefits.
27
3.2.1.3 The Excessive Regulation Theory The Excessive Regulation Theory, described by Ostaszewski (2001) suggests
that the government intervention has reduced the attractiveness of DB plans. Governments have
approved regulations in order to attempt and guarantee that contributions made to pension
schemes by employees are protected. To protect the employees there was need for stricter legal,
funding and solvency laws as well as regulations about what kind of assets can be included in a
pension scheme. These regulations are made more complicated by tax laws regarding
deductibility of employers contributions in pension schemes. The higher regulatory
requirements lead to higher legal expenses.
3.2.1.4 The Rational Worker Theory The fourth theory, the Rational Worker Theory, used by Ostaszweski (2001) to
investigate the decline in DB schemes suggests that the shift in the way relative returns to
macro-economic factors like capital and labour are allocated in the national economy have
caused the shift to DC schemes. This theory is based on the rational choice theory. When
considering, both DB scheme participation and DC scheme participation as a security, DC is a
perfect conduit of underlying asset performance, while DB participation is a derivative security
creating wage dependant cash flows out of the underlying assets mix (Ostaszweski, 2001 p. 57).
So, according to the rational choice theory in a world with both a weak wage growth and a
prosperous capital market, rational economic decision makers would choose for DC schemes
instead of DB schemes.
3.2.2 Micro-economic Explanations
Klumpes et al. (2003) have tested different hypotheses to explain the UK firms’ DB
pension schemes termination decisions. The test period is from 1994 to 2001, and they mention
this period as an extended time period when defined benefit pension funding was subject to
considerable regulatory uncertainty, political investigation and controversial changes in
accounting for pensions. They use different theories addressed by the pension literature whether
the pension scheme is a part of the sponsoring company (Integration theory) or it is separated
from the sponsoring company (Separation theory).
3.2.2.1 The Integration Theory
The integration theory states that the assets of the pension scheme are
inseparable from the assets of the firm, which is sponsoring the defined benefit scheme. This
theory is consistent with the corporate finance perspective, which implies that the firm
effectively owes the pension plan. According to this integrated balance sheet approach, the
firm’s pension benefit obligations are money-fixed liabilities of shareholders. FRS 17 appears
to adopt the integration theory by requiring UK firms to recognize any pension scheme surplus
28

or deficit on their balance sheet (Klumpes et al. 2003). When assuming that a sponsor company
has the possibility of rearranging pension related debts, than it can be predicted that the
termination decisions by UK companies are basically explained by the need to curtail unfunded
obligations in order to improve the financial health of the company (Klumpes et al. 2003). So,
the shift away from DB schemes may be explained by firm-specific characteristics.
3.2.2.2 The Separation Theory
The separation theory argues that the assets of the pension scheme are separated from the assets
of the sponsoring company. The rationale for the separation theory is derived from the labour
economics literature, which implies that sponsor companies have implicit long term contracts
with their employees (Klumpes, 2001). This theory assumes that workers have partly funded
their own pensions through acceptance of lower current wage in exchange for future pension
benefits. This implies that employer companies and sponsored pension funds are separate
entities, consistent with the fact that sponsoring firms and pension funds are legally required to
be managed separately. So, the assets surpluses and deficits are belonging to the employees
(Klumpes et al., 2007). Therefore, the company is assumed to provide an under-funded pension
scheme. The reason for this is that the sponsor company cannot use the assets placed in a
pension scheme for other purposes (Klumpes et al. 2003). So, the switch away from DB
schemes may be explained by the pension scheme-specific characteristics.
3.2.2.3 The Insurance Theory
An alternative on the integration theory is the insurance theory. The insurance theory shares the
view that pension scheme assets and liabilities lie completely with the sponsoring company, but
additionally pretends that employees may share the ownership of any pension scheme deficit or
surplus with the shareholders of the sponsoring company in the form of respectively put or call
options. Consequently, companies switch decisions represent their exercise of a ‘default’ option
(Klumpes et al., 2003). Klumpes et al. (2003) refers to Bodie (1990a) who views pensions
offered under DB schemes as an insurance company subsidiary. The pensions offered under
these schemes are thus viewed as participating annuities that offer a guaranteed minimum
nominal benefit determined by the scheme’s benefit formula. This guaranteed benefit is
permanently augmented from time to time, at the discretion of management, depending on the
financial condition of the plan sponsor, the increase in the living cost of retirees, and the
performance of the plan assets (Klumpes et al. 2003). Therefore, even after controlling for
financial characteristics of the company as identified by the integration theory, sponsor
companies have the option to default on the part of the pension liabilities which is not covered
by the pension fund’s collateral (Klumpes et al., 2003). So, the switch decisions, based on the
29

insurance theory, are associated with the tendency to default on their pension liabilities by
pension scheme sponsors.
3.3 Integration of perspectives
After reviewing different theories based on the shift away from DB schemes to DC or
CDC schemes in different countries there is established a widespread theoretical background
for the reasons why companies can choose to shift away from DB schemes.
The New Economic Theory, the Excessive Regulation Theory, the Risk Avers
Employers Theory, and the Rational Worker Theory described by Otaszewski (2001) are useful
macro-economic theories in understanding the probable reasons for the shift from DB schemes
to DC or CDC schemes. These theories will be used in this research. The integration,
separation, and insurance theories used by Klumpes et al. (2003) for their investigation on the
DB scheme terminations in UK are essential micro-economic perspectives in the context of this
thesis, because these hypotheses are offering more insight in pension scheme terminations at
company level. The next section follows with a literature review of different studies based on
the shift away from DB schemes to DC or CDC schemes.
3.4 Literature Review
There are several studies that investigated the reasons of shifts from DB pension
schemes to other pension schemes. Ostaszewski (2001) provides four theories as possible
reasons for the decline in DB pension plans in the US. These theories are described in section
3.2.2. Ostaszewski (2001) investigates the correlation of returns to labour (in the form of
wages) versus the participation rate in DB plans. He tests the causal relationship between the
falling relative importance of wages in national income and the falling relative importance of
DB schemes in pensions. Ostaszewski (2001) argues that the shift to a DC scheme is a
movement to a superior security when considering that a DC scheme faces higher returns with
the same or lower risk as the DB scheme. He finds a significant correlation between the shift
away from DB pension schemes and shift away from compensation labour in the form of
wages. Ostaszewski (2001) argues that as the emerging forms of compensation do not lend
themselves easily to be the basis for deriving the benefit in a DB scheme; it would seem likely
that different forms of pensions serve the workers who obtain their compensation in a different
form. He concludes finally that the most important reason for the shift from DB schemes to DC
schemes is caused by the macroeconomic reward systems in the use of DB versus DC schemes.
Another research, as reaction on Ostaszewski (2001), based on the decline in
DB schemes is done by Brown and Liu (2001) based on Canadian data. They used the Rational
Worker Theory described by Ostaszewski (2001). The causal relationship between the shift
away from DB pension schemes and shift away from compensation labour in the form of wages
30
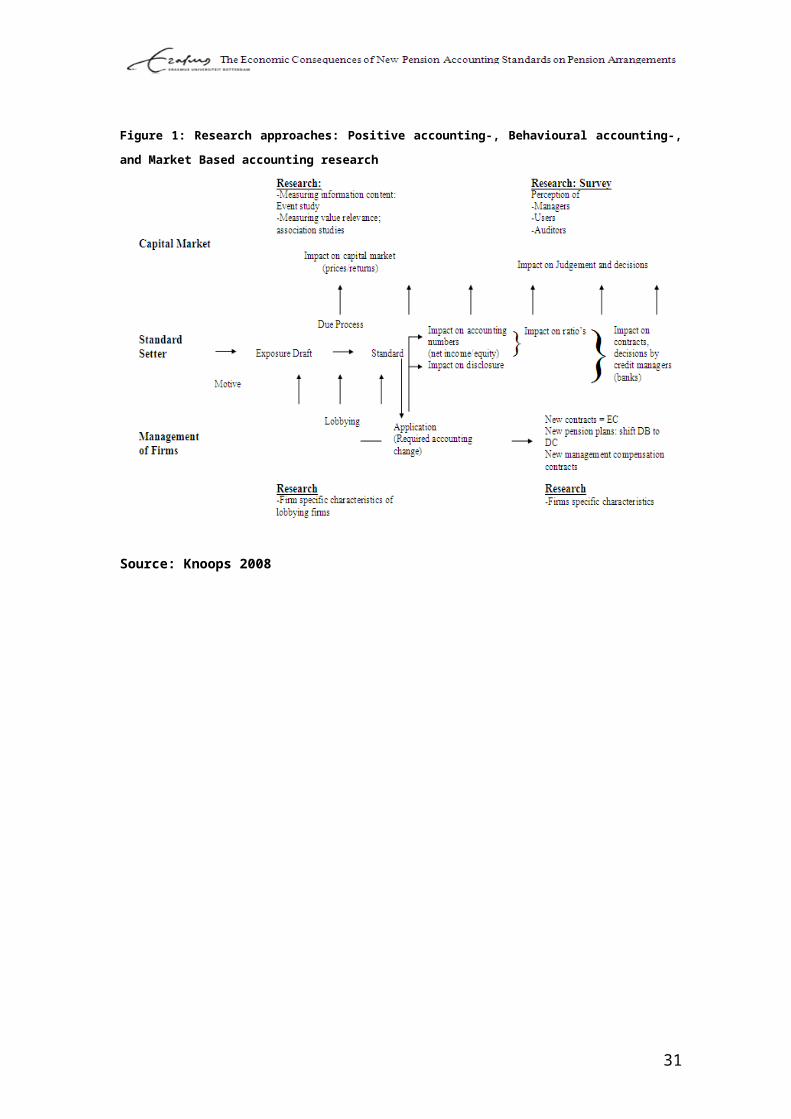
found by Ostaszewski (2001) does not appear for Canada. Instead, Brown and Liu (2001) are
arguing that pension and tax legislation, with the goal to protect the economic security of
beneficiaries, encouraging retirement savings, and safeguarding against discrimination plays an
important role in the shift from DB schemes to DC schemes. They argue that the differences in
pension legislation and tax laws between Canada and US have influenced employers in
considering pension costs and risks. Brown and Liu (2001) mention also the differences in
union participations, the investment climate, and the mentality and character of Canada versus
US as the reason for the more rapid decrease of DB schemes in US than in Canada.
Klumpes et al. (2003) have tested different hypothesis to explain the UK firms’ DB
pension schemes termination decisions. The test period is from 1994 to 2001, and they mention
this period as an extended time period when defined benefit pension funding was subject to
considerable regulatory uncertainty, political investigation and controversial changes in
accounting for pensions. They used the integration, separation and insurance theories described
in section 3.2.2. These theories are referring to alternative theoretical perspectives that bear
important implications on pension accounting theory introduced by Klumpes (2001). These
hypotheses are offering different explanations about the economic incentives according to
pension plan rearrangement decisions and their relation with prior accounting policy choices.
Besides, in their research Klumpes et al. (2003) investigate whether there is a relationship
between UK companies’ shift decision and their prior managerial discretion to switch towards a
market based actuarial valuation method. They argue that companies that change their actuarial
method are likely to be able to afford the balance sheet volatility by the adoption of market-
based accounting methods. These market-based accounting methods are actuarial methods for
the computation of asset value and the future value of liabilities using market rates. Therefore,
they predict companies that switched towards market-based accounting regime in the past are
less likely to switch away from DB schemes than companies that not changed their actuarial
methods. Klumpes et al. (2003) based their research on a sample of 80 UK sponsoring
companies. This sample is divided into 40 companies which shifted away from DB schemes
and 40 companies which did not shift away from DB schemes. To test the implications of the
integration, separation and insurance hypotheses they employed three company-specific
characteristics: stock funding ratio, leverage and discount rate. And two pension fund-specific
characteristics: flow funding ratio, and fund maturity. And at last, they construct a variable to
proxy for companies’ option to default on its pension liabilities to test the insurance hypothesis.
They suggest that companies switch away from DB schemes because of the need to curtail
unfunded pension liabilities and to exploit option value via default their pension promises to
workers. In addition, they find evidence that a company’s switch decision is conditional upon
company’s prior voluntary accounting choice, i.e. the actuarial valuation method switch
(Klumpes et al., 2003).
31
Another important point of interest in the study of Klumpes et al. (2003) is the
control that they use for other explanations for clarifying managerial motives to shift away from
DB schemes. Based on the research of Tepper and Affleck (1974), Klumpes et al. (2003) expect
a negative association between pension scheme termination decisions and companies’
investment opportunities, implied by a significant pension deficits, rather than surpluses. This is
because Tepper and Affleck are assuming that firms with restricted financial resources might
not want to fully fund their assets.8 Therefore, Klumpes et al. (2003) want to control shifting
firms for new investments. The control variable has a negative sign especially for firms that not
did switch their actuarial valuation methods. Klumpes et al. (2003) explain that their control
variable might have served as a proxy for financial distress, which puts the company’s future
interest and principal payment at risk. This means that motives of shifting companies would be
more consistent with the separation hypothesis, which implies that the shift away from DB
schemes represents transferring the pension risk from employers to employees.
Swinkels (2006) investigated whether the introduction of IFRS has influences on the
choice of the pension schemes. First, Swinkels (2006) investigated several Dutch companies
that have been in the news because of changing pension contracts. The main findings in this
research, is that many companies have changed or announced to change their pension scheme
because of the introduction of IFRS. The second part of his study is an empirical study based on
24 companies. These companies are listed on the major Dutch stock market index. The
intention is to explore whether there is a trend or company-characteristic within companies that
switch from DB pension schemes to DC pension schemes. As company characteristics, first of
all, Swinkels (2006) paid attention to companies that have shifted the investment risk from
employer to employee. Changing pension schemes from final pay scheme to average pay
scheme is an evidence of shifting investment risks. Second characteristic is the funding ratio.
Swinkels (2006) observes whether companies meet the minimum requirement and states that
corporate liquidity risks are higher closer to the minimum solvency requirement. The third
characteristic is the maturity ratio, which is the number of current active employees
contributing to the pension scheme divided by the total scheme members. A high maturity ratio
means that contribution rates have to increase. The final characteristic is the pension size,
which is the total assets divided by the market value of equities of the company. Companies
having a large pension size, means that they have a large pension fund compared to their own
market value. For these companies a change in funding level of the pension scheme would have
a big impact on the company’s equity, this leads to consideration of reducing pension scheme
risks. A remarkable finding of Swinkels (2006) is that Dutch companies listed in a U.S. or U.K.
stock exchange seem to change their pension plans quicker than Dutch companies that are not
8 Firms with superfluous pension assets represent financial stagnation, and withdrawal of these superfluous assets are viewed as liquidation of the stagnation.
32

listed in foreign countries. One reason could be that foreign standards required the company to
estimate the consequences of DB scheme accounting and the impacts on their earnings. Foreign
listed companies were required to follow the accounting guidelines of the FRS 17 in UK and
SFAS 87 in the US for pension accounting already, therefore are these foreign listed companies
more aware of the possible impacts on accounting figures, and make the process of changing
pension plans quicker.
Beaudoin et al. (2007) investigate three motivations underlying companies’ decisions
to terminate their defined benefit (DB) schemes in the US. They study whether DB scheme
termination decisions are motivated by financial accounting considerations, cash flow related
incentives, and improving a firm’s competitive position. This study is based on a sample from
S&P 500 companies with DB schemes. The test period is from 2001 to 2006. Using logistic
regression models, they make a comparison between 55 “termination” companies and 276
companies that did not decide to terminate their DB schemes. Their findings indicate that DB
scheme contribution volatility and improving the firm’s competitive position do not impact the
termination decision process as significantly as management might suggest. Instead, their
results imply that the effect of proposed pension accounting changes plays a primary role in the
decision to terminate DB schemes. In this research Beaudoin et al. (2007) have tested 6
hypotheses. They expected that the anticipation of the balance sheet impact associated with the
introduction of SFAS 158 has driven many companies to switch from DB pension schemes to
DC pension schemes. SFAS 158 requires companies to recognize the overfunded or
underfunded status of a pension scheme as an asset or liability in its financial statement.
Therefore, Beaudoin et al. (2007), conjecture that firms with relatively weaker funded pension
position and higher net periodic costs are more likely to switch away from DB schemes. They
also expect that other pension regulations have impact on the decision to switch away from DB
pension schemes. The Pension Protection Act of 2006 (PPA) highlights the funded status of
pension schemes by defining schemes less than 70 percent funded as at risk. It also gives
companies seven years to fully fund their pension schemes and obliges accelerated
contributions from those companies whose schemes are seriously underfunded. In addition, the
PPA requires companies with underfunded schemes to notify their employees participating in
the DB scheme. A substantial part of the PPA is applied to ensuring that assets are available to
pay required pension obligations. To enhance these requirements there is need for higher cash
flows from investments. So, Beaudoin et al. (2007) expect that companies with lower cash
flows from operations are more likely to shift away from DB schemes. They also test the
funding volatility. Funding ratio volatility means that the value of the plan assets and the value
of the liabilities are fluctuating strongly. These fluctuations will have an effect on the balance
sheet and earnings statement of the company. A manager prefers fixed cost in favour of
variable cost to avoid fluctuations in the balance sheet and earnings statement. Therefore,
33
Beaudion et al. (2007) expect that companies with less stable annual plan contributions are
more likely to shift away from DB schemes.
Another motive for the shift they have tested in their research is the competitive position of a
company. When a company is concerned about its competitive position, than the financial
health of this company against its peers is in question (Beaudoin et al., 2007). They mention
that prior studies indicate that financial weaker companies are more likely to shift away from
DB schemes. Consequently, Beaudion et al. (2007) have tested the Return on Assets (ROA)
variable as benchmark for the financial health of a company. They expected that companies
with a low ROA are more likely to shift away from DB schemes.
In this research Beaudoin et al. (2007) have compared the above mentioned company-specific
characteristics of shifting firms with non-shifting firms by using multiple regression analysis.
They found significant differences between shifting companies and non-shifting companies for
the ratios associated with pension regulations changes.
3.4 Conclusion
As described in chapter 2, economic consequences can be analyzed from different
theoretical perspectives like the behavioural accounting-, market-based accounting-, and the
positive accounting theory. These theories are analyzing the impacts of accounting standards
from different views. Besides, as discussed in chapter 2, these economic consequences can
differ among countries, or even among industries and at lower level among companies.
In chapter 3 different studies are described which are analyzing the shift away from DB
schemes to DC or CDC schemes in different institutional settings. It is remarkable that this shift
is not the same in each country. In the US and UK it is observable that there is a significant
shift to DC schemes. On the other hand, it is observable that the shift to DC schemes in Canada
and the Netherlands are not so huge as in the US and UK. Furthermore, chapter 3 describes
different theoretical views to understand the reasons of the shift away from DB to DC or CDC
schemes. There is used a top down approach, from macro-economic factors to micro-economic
factors, to give an overall view of different levels which can explain the shift away from DB
schemes. However, in the context of this thesis there is need for a more broad view. As a result,
chapter 4 analyzes the institutional settings of UK and the Netherlands based on pension
accounting. In the appendix I the literature review is summarized.
34
4 Institutional Settings
4.1 Introduction
The “crisis” (low returns, stock market decline) in the years 2000 has influenced the
pension funds in the Netherlands and other western countries badly. However, according to
Ponds and Van Riel (2007) the response to this crisis was not the same in each country. In the
United Kingdom and the United States it was observable that a shift was accelerated from DB
to DC schemes. The Netherlands reacted with a switch from final-DB to average-DB. This
structure can be seen as a hybrid DB-DC scheme. Hybrid DB-DC schemes were able to
minimize the risk of under-funding. This trend observed by Ponds and van Riel (2007) is
supported by the literature review done in the previous chapter. However, when analyzing this
trend through the excessive regulation theory mentioned by Ostaszewski (2001), it might be
probable that the introduction of FRS 17 (introduced in 2001) in the UK, has triggered the
switch from DB schemes to DC schemes in this country. So, the differences between the
Netherlands and UK might be explained by the introduction of FRS 17 in the UK in times when
there was a stock market fall. Nowadays, it is also observable that the shift from DB to DC
system is increasing in the Netherlands (Swinkels, 2006). One of the reasons for this shift is
mentioned as accounting changes; the introduction of IFRS. Since January 2005 all listed
companies in the European Union must prepare their annual accounts in conformance with
IFRS. But, the funding requirements which are introduced in 2007 by the Dutch regulatory
authorities can also have economic consequences for pension schemes. As discussed before in
chapter 3, listed companies in the European Union are required to prepare their financial
statements following IFRS. The adoption of IFRS meant for many companies a change in the
way these companies account for pension schemes, mainly DB schemes. IAS 19 ‘Employee
Benefit’ is, as product of the harmonization process, based on other financial accounting
standards, such as the accounting standard of the United Kingdom, the Financial Reporting
Standards (FRS) 17 ‘Retirement Benefits’ introduced in 2001.
Changing pension accounting regulations have motivated several authors and parties to
investigate the impacts on pension schemes. In chapter 3 different research papers are analyzed
which have investigated the economic consequences of the introduction of new pension
accounting standards in the UK, US, the Netherlands and Canada. When comparing the
findings of these studies, there can be seen that the shift to DC schemes is not the same in each
country. According to Klumpes et al. (2003), Ostaszewski (2001) and Beaudoin et al. (2007)
there is a strong shift to DC schemes in the UK and US. In the Netherlands and Canada,
according to Swinkels (2006) and Brown and Liu (2001) this shift is not as strong as in the UK
and US. This chapter describes the pension system in the Netherlands and UK, and analyses the
35
pension accounting developments together with the developments of the pension schemes. The
analysis is based on the situations before and after the introduction of IFRS in 2005 for the
Netherlands and before and after the introduction of FRS 17 for the UK.
4.2 The Dutch pension culture
The pension system in the Netherlands is based on the multi-pillars system. The first
pillar is the statutory old age pension scheme. This scheme provides all residents of the
Netherlands at the age of 65 a pension benefit, which in principle is 70% of the net minimum
wage. The pension benefit is financed by the pay-as-you-go (PAYG) system, where the
working population of today contributes the pension payments of the pensioners of today. The
second pillar is the occupational pension schemes, which are represented by pension funds.
Contrary to other countries, the Netherlands has independent pension funds, which means that
the pension funds have independent legal bodies and governing board, and are independent
from the company. The participation in a funded pension scheme is compulsory for most of the
employees and is a complementary scheme to the first pillar. The third pillar is on individual
basis, whereas the employees can build additional benefits by investing in insurance companies,
for example life insurance.
In this section I will focus on the second pillar. These pension schemes can be divided
into two main types: the DB and DC plans. As mentioned in section 4.1 in a DB plan, the final
pay is defined and the risk of under-funding pension benefit is to the employer, while in a DC
plan, the contribution is defined and the risk of under-funding is for the employee. The
Netherlands can be characterized as a ‘DB country’.
4.2.1 Pension plan evolution: DB- and DC-contracts, 1998 to 2006
From table 1 can be seen that in the beginning of this century there was a shift from final wage system to average wage system. According to Ponds and Van Riel (2007) this was caused by the stock market crash. Pension funds became under-funded, because of the bad performance of the investments. This means that the employer was bearing more risk. The balance sheet of a pension fund, in simple form, consists of the assets on the left-hand side, and the liabilities on the right-hand side. The liabilities are the promised pension payments to its participants. The assets are the investments financed using the pension premiums of the participants (employee) and sponsors (employer). The assets must match the liabilities. When assets are performing badly, liabilities became bigger than assets. So, the companies become unable to fulfil the promised pension payments to its retirees.
36

The final-wage pension plans were structured in the post-war period. In this system pensioners were promised to earn 70% of their gross wage based on their last earned income. This maximum could be reached after 40 years pension premium payments, with an accumulation of 1.75% per year (Ponds and Van Riel 2007).
The pension rights in an average-wage plan were based on a percentage of the salary earned in each year of their working life. The pension rights in this system are also inflation and wage-growth linked. So pensioners get inflation compensation on their pension rights. The pension rights are also accumulating with a rate of 2% or higher, to a maximum of 80% (same as 70% based on final-wage) of the average wage. After retirement pension payments are conditional inflation- and wage indexed depended on the performance of the pension fund. These reforms decreased the risk of under-funding for Dutch pension funds, because liabilities in this system are depending on the performance of the pension fund. The Dutch DB plans survived the bad economic circumstances with a shift from final-wage DB plans to average-wage DB plans (Ponds and Van Riel 2007).However, table 1 shows that after the year 2005, DC plans have been increasing in the Netherlands. This situation is illustrated in Figure 2. This increase goes together with a decrease in DB plans. One of the reasons for this shift may be the introduction of IFRS in the year 2005. Table 1: Development of occupational pension schemes from 1998 to 2006 in the Netherlands
Source: Ponds and Van Riel (2006)
Figure 2: Occupational pension coverage in the Netherlands 2002–2007 (Participants in millions).
37

Source: Dixon and Monk (2009)
4.2.2 Pension accounting: IAS 19 ‘Employee Benefits’ versus RJ 271
In 2005 IFRS is introduced in the Netherlands, for the pension accounting, this introduction means that all listed Dutch companies have to apply IAS 19 ‘Employee Benefits’ in their financial report. The major impact of this accounting standard is the requirement to show DB plans on their balance sheet, while DC plans only require counting the contributions as pension expenses. This is because DC plans only pay a fixed contribution and do not face any other liability, while DB schemes guarantee the benefits and thus also have to count the funding shortages. Before 2005, the listed Dutch companies were allowed to use the Dutch accounting guideline RJ 271. Although RJ 271 was based on the incentives of IAS 19, RJ 271 had more broad judgments to determine whether a plan is DB or DC. In 2003, RJ 271 stated that when the sponsoring company only bears DB liability if the fact is specifically stipulated in its financial agreement with the pension foundation. Contrary to IAS 19, which stated that all plans that have a constructive obligation on the part of the plan sponsor to meet pension promises, should be classified as DB. A significant debate ensued in the
Netherlands on the classification of compulsory multi-employer pension schemes. The outcome
of the proportionate share of assets and liabilities ought not to be the right reflection of the real
liability of the individual participating employer. Employers have also argued that it is
questionable to classify these multi-employer schemes as DB schemes. The governance of
these types should be taken into account (EFRAG, 2008). These industry-wide pension
schemes were accounted for as DC schemes under the previous GAAP. However, under the
IAS 19.25-27 these multi-employer schemes are not allowed to be treated as a DC scheme. The
exception for these multi-employer schemes might be a temporary phenomenon resulting from
38
a strong lobby of pressure groups like the NIVRA9 and VNO-NCW10 (Swinkels, 2006). These
organizations have requested the Dutch Accounting Standards Board (DASB) to raise this issue
with the EU Roundtable for the purpose of determining whether this issue should be put before
the International Financial Reporting Interpretations Committee (IFRIC) for resolution.11
Recently, Minister Donner of the Ministry of Social Affairs and Employment requested the
IASB to revise the accounting standards for the Netherlands.12
The Dutch pension funds are sovereign financial institutions governed by a board where both employers and unions are represented. The influence of employers in the Anglo-Saxon pension funds is bigger. So, they are kept responsible for correcting situations of under-funding. This situation was a reason for discussion about the application of IFRS in the Dutch pension structure.
4.2.3 Fair Value Accounting
The IASB moved towards the market-based valuation of pension liabilities in order to increase the understandability, relevance, reliability and comparability of company accounts. Under the new legislation, the fair value approach played a prominent role in the Netherlands. Companies are required to report assets and liabilities on fair value basis. Pension fund in the Netherlands are obligated to keep their pension promises fully funded. In the past, the liabilities related to the expected future pension benefits were calculated on the basis of a fixed actuarial interest rate of at most 4%. This 4% is a conservative estimation of the long run return on asset portfolio. This actuarial approach meant to create stability in contribution rate and the funding ratio over the period. Vlaar (2005) mentioned three arguments why this method had a bad name. First he mentioned the link of the discount rate with the expected returns: pension funds that are under-funded could reduce their liabilities by taking more risk in the asset portfolio, thereby increasing the discount rate. The second argument was that it is impossible to determine an objective measure for expected long run returns. The last argument was that the long run emphasis of the method assumes continuity. This assumption is not always appropriate, especially for company pension funds.9 Royal Dutch Institute of Chartered Accountants10 Confederation of Netherlands Industry and Employers11 Issue paper; Application of IAS 19 to the classification of compulsory industry wide multi-employer pension scheme in the Netherlands, Brussels, 19 October 2007 12 Press release: ministry of social affairs and employment
39

In January 2007, the Financial Assessment Framework (“Financieel Toetsing Kader” – FTK) introduced the new regulatory framework in the Netherlands. This regulation requires that liabilities should be calculated by market rate instead of the fixed actuarial interest rate. The main goal is to make an objective analysis of the solvency position of the pension fund and the implied risks of the pension benefits. Because the fixed interest rate had been replaced by the actual yield curve of interest rates of the market, the liabilities have become more volatile. This has forced the pension fund to redefine their risk management. Explicit risk exposure reveals the high volatility in the solvency position, the reported probability of under-funding will increase (compared to the actuarial approach). Fair value accounting will lead to higher funding costs of pensions. Pension funds have to choose either less risk taking or a higher solvency reserve position (Ponds and Van Riel 2007).
4.2.4 Criticism on the changing pension regulations
Countries often change their national accounting standard to move toward the convergence of international accounting standard. Also in the Netherlands, accounting standard setters try to change the Dutch accounting standard for pension accounting RJ 271. For pension accounting, this led to an exposure draft in RJ 271. However, some parties think that the new regulations could not be applicable for the Dutch pension funds, this have led to some debate in the Netherlands. In a letter, from the VNO-NCW-commission pension policy13 to the RJ, are mentioned arguments why they think these new regulations were not applicable for the Netherlands. There was also an international lobby against the IASB and EFRAG. In both situations nationally and internationally, the following arguments were given against the introduction of IAS 19 in the Netherlands:
One of the first mentioned arguments was that the Dutch pension governance structure was different from the Anglo-Saxon pension governance structure. The Dutch pension funds are autonomous financial institutions governed by a board where both employers and unions are represented. In the Netherlands the companies and pension funds are separated and the responsibilities are settled by the pension supervisor. 13 VNO-NCW is one of the biggest company-organization, which nationally and internationally looks after the interests of Dutch companies.
40
The employer is obliged to contribute in the pension fund. This is the only responsibility of the employer to the pension fund. The influence of employers in the Anglo-Saxon pension funds is bigger, where this separation does not exist between company and pension fund. So, they are kept responsible for correcting situations of under-funding.
The Dutch pension system is known by a set of three relationships. The relation between employer and employee, employer and pension executor, and employee and pension executor. The pension executor is responsible for the pension obligation to the employee. The only responsibility of the employer is the part of the contribution he must pay to that pension fund.
Another discussion point arises from the fact that in the Dutch pension system the pension liabilities are long-term obligations. The reason for this is that in the Dutch system a pension is promised for the rest of the life of the retiree and not a capital on retirement date. The new rules are obliging to value the expected pension promises based on market ratios. There is no market for these long-term obligations in the Netherlands. So, it’s is doubtful whether these valuation method is right.
Another point of criticism is that the liabilities valued at ‘fair value’ method are too high. This system could not be applied with the conditional indexation system, which was applied in the Netherlands. This system is based on the economic situation of the pension fund. This means that wages are indexed when it is possible. The requirements in IFRS are making indexation unconditional. This is very expensive and the risk of underfunding increases.
There was also a problem with handling the surplus and the deficit. This standard does not give a faithful representation of reality. This regulation leads companies to show a surplus from the pension schemes on their balance sheet. This is not right since the company cannot (fully) claim that surplus. The pension fund must take all interested parties into consideration. Taking the deficit on the balance sheet of the company also gives an unfair representation. The employer is only obliged to pay his part of the contribution to the pension fund. When there are not enough sources to finance the liabilities, the pension fund can choose for not giving indexation or can decrease the pension payments. The pension funds are not only
41
dependent on the premiums paid by the participants and sponsor companies. So, it is not right that the company must show the deficit on the balance sheet.
The costs of applying this system for small companies also increase unproportionally. This regulation could have undesirable indirect effects. In some countries like the United Kingdom employers were shifting to other pension schemes. There was a shift observable from DB plans to DC plans. This was caused by the growing risk for the employer with the introduction of FRS 17. So, with the shift to DC plans, employers are shifting the risk to the employees. This regulation may also cause a shift from DB-plans to DC-plans in the Netherlands, where the employees are bearing all the risks. The new regulations could have ‘economic consequences’ for the pension contracts.
4.2.5 Recent developments of pension accounting in the Netherlands
On different fronts the pension accounting standards are revised internationally. The RJ
proposed recently to adjust the Dutch pension accounting standard, RJ 271. At the same time,
the IASB proposed to revise the IAS 19 ‘Employee Benefit’. In context of this thesis, the most
important revision of IAS 19 is the redefinition of the Defined Contribution concept. The
discussion paper published by the IASB on 4th of April 2008 contains the subject Contribution
based promises.14 IAS 19 defines promises as either DB or DC. Still, there are promises that
appear to have features of both DB and DC promises. For these hybride schemes the particular
accounting method gives results that do not appear to be a fair presentation of the liabilities. To
deal with these problems, the IASB proposes the conception of a new category of ‘Contribution
Based Promises’. Promises based on actual or notional contributions plus an asset-based return
are Contribution Based promises. This category includes the active DC schemes and some
promises currently classified as DB schemes. The impact of this redefinition is that some
promises usually classified as DB schemes, will now be classified as DC schemes. One
example of such a scheme is the Cash Balance Scheme15, which is also known as a hybride
scheme, because they combine aspects of DC and DB schemes.
This can mean for Dutch average-salary pension schemes, currently treated as DB schemes, to
treat as DC schemes. Another proposal of the IASB presented in the discussion paper is to
recognize all actuarial gains and losses immediately, rather than on deferred basis. On the same
14 Discussion Paper: Preliminary views on amendments to IAS 19 Employee Benefits, Issue 4 July 200815 A cash balance scheme is a pension scheme in which risk is shared between the sponsoring employee and the member. Typically, members may receive fixed amounts for each year of service, calculated as a percentage of their pensionable salary. At retirement, they must convert the total cash fund to an annuity. In other words, the employee must bear the mortality risk (Source: PLC Pensions).
42

manner, the past service cost should be recognized immediately in the period of the scheme
amendment. The impact of this revision is that the widely used ‘corridor mechanism’ will be
removed. This will bring more volatility in the balance sheet of companies.
The RJ has published recently an exposure draft for the revision of the Dutch pension
accounting standard ‘RJ-Uiting 2009-2: ontwerp Richtlijn 271.3 Personeelsbeloningen-
Pensioenen’. This ‘RJ-Uiting’ contains a new standard which is based primary on the
construction of the Dutch pension system and how this pension system functions in practice.
The most important characteristic of this standard is that it obliges employers to place the
unconditional pension liabilities to employees, into a pension scheme executed through a third
party. For this purpose, there is made a strict distinction between the responsibilities and
liabilities of employers, pension executors, and pension participants. Referring to lobbying
activities, the RJ has concluded that for the Netherlands a ‘liabilities approach’ is a better
option than the ‘risk approach’ which was derived from IAS 19. IAS 19 makes a strict
distinction between DC and DB schemes based on the ‘risk approach’. According to the RJ,
this distinction is not applicable for the Dutch pension system. In the Netherlands there exists a
risk sharing system among different stakeholders. This situation makes it impossible to assign
the risk to different parties. The RJ aims to introduce this standard in 2009, after reviewing the
received commentary on this exposure draft. When this standard becomes effective the
employers are only required to recognize the pension premiums paid to the pension executor on
the gains and loss account. The qualification of pension schemes as DC or DB is out of
importance. The further promises, resulting from pension arrangements, to the pension executor
and employers are required to be shown on the balance sheet as provisions.
When considering both the IAS 19 and RJ 271 developments nowadays, it is
remarkable that these pension accounting standards are floating away from international
convergence. This means that pension accounting for Dutch listed and non-listed companies
becomes quiet different, because listed companies are required to comply with IAS 19 and non-
listed Dutch companies may comply with Dutch Gaap.
43
4.3 The English pension culture and developments up to 2001
The UK’s pension system consists of a multi-pillar system as we know in the
Netherlands. The first pillar is known as the public pension. This category consists of the basic
pension, which is available to every person, and the State Earnings Related Pension Scheme
(SERPS), which covers employed persons. Both schemes are operated on a pay-as-you go basis
(Kumatsubara, 2000). The second pillar consist of the occupational pensions offered by private
and public sector employers to employees, this type consists of DB, DC and hybrid schemes
(Kumatsubara, 2000). The third pillar consists of the personal pensions. This category of
pension is offered to self-employed persons and persons who do not participate in an
occupational pension (Kumatsubara, 2000).
In context of this thesis I will go further with the occupational pensions and the
developments within this category. The occupational pension category in the UK consists of
DB schemes which are linked to length of service and income (for example, each year of
service is equivalent to 1/60 of the final income). To guarantee benefits, the plan assumes
investment and other operating risks. In the DC schemes employees contribute a fixed share of
their income to the scheme, and receive pension benefits based on what the scheme has earned
at the time of retirement. Therefore, participants assume investment risks when they are in the
scheme. Hybrid-schemes combine characteristics of the DB and DC schemes. For example, in
some schemes, benefits are based on the higher of final salary or accumulated contributions,
while others provide benefits for both final salary and accumulated contributions
(Kumatsubara, 2000). In the United Kingdom, SSAP 24, "Accounting for Pension Costs," was
issued May 1988, amended in 1992 (ASB 1988) and replaced by FRS 17 "Retirement
Benefits," issued in November 2000 (ASB 2000) (Gordon, 2003). Before the introduction of
FRS 17, measured in the year 1997, the proportion of DB schemes was 80% of the total offered
schemes. The share of DC schemes was 14% followed through the hybrid schemes with 6%.
But after the year 2000 the popularity of these DB schemes decreased dramatically. The Association of Consulting Actuary’s (ACA) reports in the Pension Fund Survey (2005) that 52% of companies with DB schemes closed these schemes to new entrants since the year 2001.16
4.3.1 Pension plan evolution: DB- and DC-contracts
Until the year 1988 UK companies were free in accounting for DB schemes. There was
no real distinction between DB and DC schemes. Both schemes were accounted for mainly on a
16 UK Pension Trends Survey Report 2, Trends in: Scheme provision, contributions and scheme deficits
44
pay as you go (PAYG)17 contribution basis.18 With the introduction of Statement of Standard
Accounting Practice 24 (SSAP 24) by the Accounting Standards Committee (ASC) this
changed (Kiosse and Peasnell, 2009).
SSAP 24 deals with the accounting and disclosure of pension costs and commitments
in the financial statement of companies that have pension agreements for the provisions of
retirement benefits for their employees.19 This standard requires employers to recognise the
future costs of providing pensions over the period that they derive benefits from the services of
employees’. So, every year there should be recognized a regular costs for the pension.
Variations from these regular costs should be allocated over the remaining period that the
employees are expected to provide services to the employer. But, SSAP 24 permitted UK
companies sponsoring DB schemes substantial flexibility in the choice of actuarial
valuation methods, valuation frequency (minimum of once every three years), and
pension discount rate used to compute the liabilities. According to Klumpes and
Whittington (2003), the primary objective of pension cost calculation was to construct longer
term actuarial estimates of the pension costs. The DB scheme liabilities were estimated based
on mortality and investment- and work force profile assumptions (Klumpes et al. 2003).
Klumpes and Whittington (2003) argue that the actuarial valuation methods used, can affect the
magnitude and pattern of emergence of the employers’ contractual obligations to meet DB
pensions of its participating employees. They go further with the fact that SSAP 24 just was
viewing the pensions as operating expenses. So, the costs are projected over the pensioners’
year of service using actuarial valuation methods that are available. After this, the matching
concept is applied to match the assets and liabilities. Besides, the recognition of surpluses and
deficits were taken up gradually. Accordingly, prepayments and provisions occurred that were
difficult to understand for users of financial statements. For example, under SSAP 24 it was
possible to show deficits for pensions, when there was a surplus on the scheme. The focus of
SSAP 24 was on showing the funding information of the pension schemes as notes to the
balance sheets (Klumpes et al. 2003).
4.3.2 The introduction of FRS 17
On 30 November 2001 the ASB issued FRS17 ‘Retirement Benefits’ to replace
SSAP24. FRS 17 firstly had to be adopted for periods ending after June 2003. In the year 2002,
the ASB expanded the transitional period of FRS 17 to fiscal years starting on or after January
1st, 2005, which goes together with the adoption of IFRS in Europe. FRS17 introduced 17 PAYG schemes are unfunded pension schemes. The sponsor accepts the liability to provide retirement benefits to participants, but does not set aside provisions to meet future obligations. The PAYG structure is based on a philosophy of “intergenerational solidarity” where today’s workers support older workers.18 This means that before 1988 there were no strict accounting requirements for DB and DC schemes as we know nowadays. DB and DC schemes were treated as public pension schemes for accounting purposes.19 ASB: Accounting for pension costs
45

essential changes in accounting for DB pension schemes. FRS 17 required companies to
recognize pension scheme assets and liabilities in their financial statements, measured annually
using market-values. Besides, FRS 17 required the immediate write-off of pension gains and
losses and allowed the recognition of surpluses.
SSAP24 assumed pensions as long term commitments. So, companies were supposed
to recognize the costs of providing pension benefits on a regular and balanced basis over the
time during the employer gained benefit from the employee’s services. SSAP24 was
consequently determined by the need to generate a steady pension expense during several years.
The off-market actuarial methods were doing well in realizing this.
FRS17 is established from the assumption that the assets and liabilities of a pension
scheme are basically assets and liabilities of the sponsor company. Therefore, these assets and
liabilities should be recognized at fair value on the company balance sheet. This UK GAAP
prescribed the methods which were allowed to value pension scheme assets and liabilities. This
means that the actuaries were required to measure the value of pension scheme liabilities using
prescribed assumptions. Subsequently, FRS 17 required adjusting these promises using market
discount rates. The surpluses and deficits were valued once a year using market ratios for its
asset and the AA corporate bond rate to discount pension obligations.
4.3.3 Criticism on the introduction of FRS 17
The expectations of the effect of the introduction of FRS 17, when it was proposed by
the ASB are described by Kiosse and Peasnell (2009). They have carried out the relevant
aspects of responses received by the ASB to the issued proposals (exposure draft FRED 20) on
pension accounting. The letters received by the ASB as response to the proposed replacement
of SSAP 24 through FRS 17 reflect the far-reaching nature of the expected effects of the
accounting change. Kiosse and Peasnell (2009) mentioned that many respondents feared that
the proposals should lead to the termination of DB plans. This worry was broadly shared across
groups including specialists in the pension’s field like; Institute and Faculty of Acuaries,
National Association of Pension Funds, Pension Management Institute and various actuarial
consulting firms. Also accountants from the Institute of Chartered Accountants of Scotland and
Midlands Group of Finance Directors were worried about the probable demise of DB pensions.
The main reason mentioned was that FRS 17 would increase the volatility of pension costs by
requiring the immediate recognition of pension costs in the profit and loss statement. FRS 17
would also lead to large fluctuations on the balance sheet because the requirement to show the
pension surpluses and deficits on the balance sheet of the sponsoring company. Respondents
speculated in their writing that employers possibly would alter their pension asset strategies to
offset the increased balance sheet volatility. Another argument was that the immediate
recognition of pension cost might jeopardize the practice of enhancing scheme benefits (Kiosse
46
and Peasnell, 2009). Another point of criticism was that FRS 17 would have effects on
corporate behavior. The volatility that FRS 17 would bring into financial statements would
have negative effects on share prices. The underlying assumption for this argument is that the
market was not already taking companies pension exposures in consideration. Other
respondents were concerned that the changes might restrict companies’ actions. This should
lead the employers to abandon their DB schemes. The inclusion of pension deficits on the
balance sheet would lead to the limitation of the capacity to pay dividends. Kiosse and Peasnell
(2009) are arguing that when the payments of dividends are limited, the best option is than to
modify the provisions of the company law governing distributions.
4.4 The differences in institutional settings between the Netherlands and UK
When considering the literature review in chapter 3, it is conspicuous that there is a shift away from final salary DB pension schemes in both United Kingdom and Netherlands. But, the pension replacements in these countries seem to be different. As can be seen from figure 3; open DB schemes declined during 2000 to 2007. This goes together with the rise of DC schemes and closed DB schemes. This raises the question why this trend is different among UK and Netherlands where a shift is observed from DB final-pay to DB average-pay schemes (figure 2). This section analyzes the possible reasons for the difference between these counties.
Figure 3: Occupational pension coverage in UK 2000 – 2007 (Participants in millions)
Source: Dixon and Monk (2009)
47
4.4.1 The introduction of FRS 17 in UK and IAS 19 in the Netherlands
In section 4.2 the Dutch institutional context is described around occupational pension
schemes. There is made a comparison between the Dutch GAAP for pension accounting RJ 271
and IAS 19. RJ 271 is based on the incentives of IAS 19. The main difference between RJ 271
and IAS 19 is the classification of DB and DC schemes.
IAS 19 states that all plans that have a constructive obligation on the part of the plan sponsor to meet pension promises should be classified as DB. RJ 271 had a more broad view in the classification of DB and DC schemes. RJ 271 stated that the sponsoring company only bears DB liability if the fact is specifically stipulated in its financial agreement with the pension foundation (Section 4.2.2). Dutch companies were therefore allowed to comply with RJ 271 up to 2005.
So, Dutch companies have made use of this possibility to escape the accounting requirements
for DB schemes through treating these DB schemes as DC schemes.
Since the year 2005 all listed European companies are required to comply with IAS 19 when
preparing their financial statements. The English situation is different from that of the Dutch
situation. UK’s FRS 17 is largely consistent with IAS 19. The most important difference was
that FRS 17 required the immediate and full recognition of any actuarial and investment gains
and losses on the company’s balance sheet.20 So, when comparing the Dutch setting and the
UK’s setting there can be assumed that the accounting change has a more direct consequence
for UK companies than for Dutch companies. Instead, the UK companies had not the option to
shelter the new accounting requirements for DB schemes.
I mention the distinction between the Dutch and UK’s institutional setting because I am
comparing the introduction of similar accounting standards in different countries. Therefore, it
is important to know that listed and not-listed UK companies had to comply with respectively
IAS 19 and FRS 17. So, listed companies in the UK might react more strongly on the proposed
accounting change than Dutch companies during the adoption period from 2001 to 2005, which
were able to comply with RJ 271.
4.4.2 Differences in National regulations between the UK and Netherlands
When considering the possible regulatory systems for pension accounting in the OECD
countries, there can be distinguished three different approaches to securing benefits’ members
(NAPF, 2008).
20 From harmonization purposes between the IASB and the FASB, in June 2002, the IASB tentatively agreed that actuarial gains and losses should be recognized immediately. So, the 10 percent corridor and spreading options allowed by IAS 19 should be removed. This decision would also exclude the smoothing of actual returns. On 4 April 2008, 6 years later the IASB published a discussion paper which proposes the immediate recognition of all gains and losses.
48
1. Employer Protection: Here, the sponsor underwrites the liabilities backed up by a
pension guarantee scheme. Pension Benefit Guarantee Schemes are insurance style
contracts which take on outstanding obligations which cannot be met by the insolvent
scheme sponsors.
2. Funding Protection: In this approach the liabilities are covered with a minimum of
100%. This means that liabilities are matched with investment (assets), thereby placing
minimal reliance on the sponsor. The present Dutch average-wage DB schemes are
examples of such schemes. The sponsor company pays a fixed contribution (Fixed for a
period) and is not responsible for any deficit. The risk relies on the employee and the
independent pension fund.
3. Combined Employer and Funding Protection: In this approach the liabilities are fully
funded in the pension scheme. But, the sponsor company is the ultimate pension
guarantor. So, the sponsor company is responsible for correcting situations in times of
deficits in the scheme.
When considering the national regulation of the Netherlands and UK for pension
accounting, there can be identified two different regulatory systems:
The Dutch system (Funding Protection approach) is characterized by a strict requirement to
fund at least 105 percent of the pension fund liability in nominal terms and a standard judgment
of the buffer built to finance the fund’s revaluation and indexation principle. But, the Dutch
regulatory system does not offer explicit insolvency coverage.
The UK’s system, on the other hand does not have a strict funding requirement. But, the UK’s
system is known by a strict, risk based sponsor insolvency insurance fund; the Pension
Protection Fund, created under the Pension Act 2004 (Combined Employer and Funding
Protection).
On the other hand, when a scheme has a deficit, the UK’s regulation requires covering
the deficit as soon as possible, if later than 10 years, it will trigger particular regulatory
inspection. In the Netherlands the deficits must be covered within 3 years. So, the UK’s
regulation is not so strict as the Netherlands from this point of view.
The UK’s requirements for the compulsory indexation of postponed pensions and of pensions
in payment are different from the Netherlands. The Netherlands only require indexation when it
is reasonable. So, there are no provisions required except when there is an explicit promise
(Section 4.2.1).
49
4.4.3 The governance of occupational pension schemes: A comparison between the
Netherlands and UK
The most conspicuous difference between the Netherlands and the UK is the
governance structure of pension schemes in these countries. Ponds and Van Riel (2007)
mention that the Dutch pension funds are known as autonomous financial institutions managed
by a board where the employees and employers are represented. In the UK the pension schemes
can be seen as an integrated part of the company. So, in the UK, companies are responsible for
correcting situations in times of underfunding.
4.4.4 Collective risk sharing
According to Dixon and Monk (2008), the Netherlands is also known by the
institutional structure of social solidarity. This characteristic of the Dutch culture is also
recognizable in the modern Dutch pension policy. Ponds and Van Riel (2007) are arguing that
in the Netherlands risk-sharing is both collective and spread more equally between different
stakeholders. These differences concerning the situation of employers are related to the
domination of compulsory industry-wide pension schemes in the Netherlands.
Dixon and Monk (2008) described that the Dutch social policy is build up by four building
blocks of social solidarity:
1. The first block, also mentioned by Ponds and van Riel (2007), stands for the fact that
there is reached a common coverage of workers by means of indirect compulsory
participation via communal contracts. This means that employers, employees and social
partners of a specific branch or business sector are able to create an industry-wide
pension fund, where all companies inside the sector are obliged to participate in.
Nowadays, more than 90 percent of workers are participating in a company or
industry-wide pension scheme. This has made these ‘private’ foundations
apparently ‘public’ in nature (Dixon and Monk, 2008).
2. Secondly, the board of pension institutions are represented by both employers and
employees in the industry-wide pension schemes and corporate pension schemes. So,
the interest of both parties are considered, which leads to collective risk sharing.
3. On the third place, for industry-wide pension plans, pension benefits are settled in
compliance with compensation standards of the specific industry between employees
and employers. So, the risk of default on pension obligation is spread across firms
(Dixon and Monk, 2008). Consequently, the solvency of a scheme is not dependent on
the financial prospects of any single company.
4. At last, the contribution levels to the pension schemes are derived at industry level and
through collective negotiations. As such, this creates incentives to formulate the
50

pension contract in a way that will maintain continuing competitiveness of the industry,
which on his turn will help to assure the solvency of the pension scheme.
4.4.5 Influence of politics
According to Ponds and Van Riel (2007), another aspect that distinguishes the
Netherlands from other countries is that the concern for social solidarity is supported by Dutch
society. There have never been a political party which supported the strengthening of individual
pension provisions at the expense of the first or second pillar pension schemes. Ponds and Van
Riel (2007) mention that the shift to private DC plans in the UK has an ideological and political
dimension:
4.5 Conclusion
In this section I have investigated the differences in the institutional setting between the Netherlands and UK. In relation to the research I am presenting, it is important to consider these differences in order to do the proper analysis. When comparing the accounting changes in both countries, it can be concluded that the introduced accounting standards FRS 17 in UK and IAS 19 (especially) in the Netherlands, are comparable to each other. The national pension regulations in the Netherlands and UK seem also be comparable in headlines. But, one important difference worth to be mentioned is the definition of DB schemes given by the Dutch national accounting standard RJ 271. What I especially want to mention is that IFRS were purposed for all listed companies in Europe. Instead, also listed UK companies were required to comply with IAS 19 since the year 2005. So, up to the year 2005 listed UK companies were required to comply with FRS 17.
51

The Dutch institutional setting is quite different from the UK’s situation. Before the introduction of IAS 19, Dutch listed companies were allowed to comply with RJ 271. So, Dutch companies have made use of this possibility to escape the accounting requirements for DB schemes through treating these DB schemes as DC schemes. So, when purposing that the shift away from DB schemes is triggered by accounting changes, it must be considered that there could happen a delayed effect in the Netherlands.
Another important difference between the Dutch and UK’s institutional setting is the
governance structure of DB schemes. In the Netherlands we know that pension funds are
governed independent from the sponsoring company. The pension schemes are autonomous
institutions governed through their own board. The pension schemes in the UK can be seen as
integrated parts of the sponsor companies. This distinction between pension scheme and
sponsor company in the UK is not clear as in the Dutch situation.
One more difference between the UK and the Netherlands is the feeling of social solidarity
within the Dutch culture which is also recognizable in the Dutch pension policy. In the
Netherlands risk-sharing is both collective and spread more equally between different
stakeholders. An extra factor to strengthen this feeling of social solidarity is that it is supported
through the whole society.
When taking these differences in to account, there might be expected that the reaction
on accounting changes in both countries could be differing from each other. I have considered
these differences in institutional settings when analyzing my results. In the next chapter I have
described the methodology of the explorative research I have done.
52
5 Methodology
5.1 Introduction
As discussed in chapter 2, there are several theoretical approaches to do a research on
economic consequences of accounting standards. In this explorative research I have used the
positive accounting perspective to investigate whether the pension rearrangements in the
Netherlands are explained by the same company-specific characteristics, which also explain the
shifts from DB to DC schemes in the UK. Subsequently in chapter 3, I have discussed several
theories which are used in previous research papers by different investigators to motivate the
shift away from DB schemes. Chapter 3 reviews also different previous studies and their results
concerning the shift away from DB schemes in different countries. According to these studies
there might be concluded that there is worldwide a shift away from DB schemes. But, this trend
appears not to be the same in each country. Therefore, I have analyzed and compared the
institutional settings of the UK and the Netherlands in chapter 4. This information is useful
when analyzing the results obtained in chapter 6.
In the following sections I have described the methodology of this research. Section 5.2
describes the research development and the research hypotheses. Subsequently, section 5.3
discusses the sample selection and section 5.4 the research period maintained in this study.
Section 5.5 follows with the description of the data analysis. Section 5.6 discusses the
methodology for the Dutch sample and section 5.7 for the UK sample. And finally in section
5.8, I have discussed the limitations to this study.
5.2 Research Development As mentioned earlier in this thesis, the introduction of accounting
standards can have economic consequences for the pension contracts. In this thesis I have investigated whether the introduction of IAS 19 and FRS 17 are associating with the choice of the employers to redefine the pension arrangements with the employees. In this study I am comparing the reactions of UK companies and Dutch companies to pension accounting changes. The reason for this is the Dutch pension culture which the Netherlands distinguishes from other countries like the US and UK. Thus, it is essential to compare the Dutch institutional setting with UK’s institutional settings to discover why some trends are occurring as reaction on accounting change.
As can be seen from other studies, there might be a shift away from DB schemes to DC or CDC schemes in different countries. But, this shift is
53

not always the same. From the studies of Ostaszewski (2001), Klumpes et al. (2003) and Beaudoin et al. (2007) analyzed in chapter 3, there can be observed that there is a strong shift to DC schemes in the US and UK. On the other hand, trends found by Brown and Liu (2001), Swinkels (2006), Man (2009) and Ponds and van Riel (2007), based on Canada and the Netherlands, are not showing the same trend as in the US and UK. The expectation is that there might be a shift from DB schemes to DC or CDC schemes in both countries. But, the trend of this shift must be explained by company-specific characteristics and the institutional environment the companies are operating in.
To investigate this expectation, the following research question is formulated:
Are the pension rearrangements in the Netherlands explained by the same company-specific
characteristics, which also explain the shifts from DB to DC schemes in the UK?
In the Netherlands shifts from DB to DC and CDC might be associated with the
introduction of IAS 19. In the UK the shifts from DB to DC schemes might be associated with
the introduction of FRS 17, which is comparable to IAS 19. In this study I try to discover trends
in pension rearrangements in both countries and I try to investigate whether these trends can be
associated with the introduction of the new pension standards.
This investigation is separated in two parts. The first part is an explorative research,
where the company-specific characteristics of Dutch companies which have shifted away from
DB schemes to DC or CDC schemes are compared with the company-specific characteristics of
non-shifting Dutch companies. The following research question is stated for the first part of the
study:
Are the shifts from DB schemes to DC or CDC schemes in the Netherlands explained by
company-specific characteristics?
In the second part of the study, company-specific characteristics of English companies,
which have shifted away from DB schemes to DC or CDC schemes are compared with the
company specific characteristics of non-shifting English companies. For the second part of this
investigation the following research question is stated:
54
Are the shifts from DB schemes to DC or CDC schemes in the UK explained by company-
specific characteristics?
With this approach I am studying two different populations from different institutional
environments. These institutional settings might also be associated with the possible trends
among companies. The institutional setting might strengthen or weaken the effect on the
decision by managers to rearrange pension contracts associated with the introduction of
accounting standards. The Dutch and the English institutional settings will be compared to get
more insight in the possible differences in the pension rearrangements in both countries.
The following research question is formulated to investigate the pension rearrangements from
an institutional view:
Which institutional aspects are associated with the shift towards a DC or CDC scheme?
5.3 Sample selection
The sample for this study is divided in four groups, where Group 1 and 2 are consisting
of the companies that are based in the Netherlands. The first group consists of companies that
did not shift away from a DB scheme. Group 2 consists of companies that have shifted away
from a DB scheme to another scheme. The third group consists of companies that are based in
the UK, and did not change their pension schemes. And finally, group four consists of
companies that are also based in the UK, and have shifted away from a DB scheme to DC or
CDC schemes. The data will be collected from annual reports of these companies and the
annual reports of the pension fund associated to these specific companies and from the
databanks Thomson One Banker, DataStream, and Worldscope. The goal is to find any trend in
pension rearrangements and associated company-specific characteristics of shifting companies
in the Netherlands and the UK.
5.3.1 Group 1 and 2; Dutch sample
The companies from group 1 and 2 are obtained from the studies of Swinkels (2006)
and Man (2009). In appendix II, I have attached a list of the 75 largest companies listed on the
AEX. This list is prepared by Man (2009). All Dutch AEX listed companies with occupational
pension schemes, which have shifted away from DB to DC or CDC schemes are involved in
group 2. Group 1 is used as a control group. Each company in group 2 I compared with
companies in group 1, which are listed on the same index.
55

5.3.2 Group 3 and 4; UK sample
For the UK sample, group 3 consists of companies that are based in the UK, and did
not change their pension schemes. This group is used as a control group for group 4 which
consists of companies that have shifted away from DB schemes.
To find UK companies that have shifted away from DB schemes, first of all, I have used
newspapers and press releases. I have searched for companies which have announced a shift
away from DB schemes. To find more companies which have shifted away from DB schemes, I
have analyzed the annual reports for the years 2000 to 2005 of FTSE companies which are
based in the UK. From the website ‘companyinfo.com’ I have extracted a list of all FTSE listed
companies. Subsequently, I have filtered out all foreign based companies listed on the FTSE
from my sample. After this I sorted all FTSE listed companies which are based in UK by
turnover. All companies which had more than 800 million annual turnover in 2008 are included
in my sample.
In appendix III I have attached the list of 227 companies which I have investigated
between the years 2000 to 2005. In table 2, I have summarized my findings.
Table 2: Summary findings UK sample
5.4 Period of investigation
This study will be based on the period 2003 to 2008 for Dutch companies and 2001 to
2006 for UK companies. For the Dutch companies I have investigated the annual reports for the
years 2003 to 2008. This period is related to the introduction of IFRS in the year 2005. With
this approach I am following the trends of company-specific characteristics, 2 years before and
3 years after the introduction of IFRS. I expect that the effect of an accounting change on
pension contracts would be strongest in this period.
For UK, I have investigated the period 2001 to 2006. The ASB had issued on 30 November
2001 FRS17 ‘Retirement Benefits’ to replace SSAP24. Firstly, FRS 17 had to be adopted for
periods ending after June 2003. In the year 2002, ASB expanded the transitional period of FRS
17 to fiscal years starting on or after January 1st, 2005, which goes together with the adoption
of IFRS in Europe.
56

5.5 Data analysis
In previous studies different methods are used to find motives for the shift from DB
schemes to DC or CDC schemes. Swinkels (2006) and Man (2009) compared the company-
specific characteristics of shifting companies with non-shifting companies in the Netherlands.
Beaudoin et al. (2007) investigated the company specific characteristics to explain the shift
away from DB schemes in the US. In another research Klumpes et al. (2003) investigated
company-specific characteristics of UK companies to find motives for the shift.
In this research I use a mix of these company-specific characteristics as mentioned in the article
by Swinkels (2006), Man (2009), Beaudoin et al. (2007), and Klumpes et al. (2003).
For the Dutch and UK sample, year t is the year a company shifts to a DC or CDC scheme. For
non-shifting Dutch companies year t is the introduction of IFRS, the year 2005. For UK
companies year t is the year 2003, the year FRS 17 was planned firstly to be adopted.
5.5.1 Funding ratio Due to the introduction of IFRS the risk of under-funding is increased because the
liabilities and assets are valued at fair value. So, under-funded plans should be considering
shifting to another pension scheme. In a DB scheme the employer is responsible for the risk of
underfunding.
Swinkels (2006) states in his article, that the funding shortages will be visible on the
balance sheet and earnings statement of the sponsoring company. These shortages will
influence the balance sheet and earnings statement negatively. The expectation is that firms
which have low funding ratios, in comparison to firms which have not, are considering the
shift to a DC scheme.
Also Beaudoin et al. (2007) used this variable. Beaudoin et al. expected that pension
regulations have influenced the decision to switch away from DB pension schemes in the
US. They conjecture that firms with relatively weaker funded pension position are more
likely to switch away from DB schemes.
Klumpes et al. (2003) argue that: “the funding ratio is the reflection of the accumulated
effects of pension flows (contributions and benefit payouts) in the past and is sensitive to a
range of reported actuarial assumptions. We expect that firms with a lower stock funding
ratio would have higher propensity to terminate their pension plans.”
Funding Ratio is calculated as:
57

5.5.2 Funding Ratio Volatility
Another factor I am investigating is the funding ratio volatility. Funding ratio volatility
means that the value of the plan assets and the value of the liabilities are fluctuating strongly.
(Swinkels 2006) motivates that these fluctuations will have an effect on the balance
sheet and earnings statement of the company. A manager prefers fixed cost in favor of
variable cost to avoid fluctuations in the balance sheet and earnings statement. So, a
reason for the shift could be the volatile funding ratios.
Beaudoin et al. (2007) argue that these fluctuations are affecting the balance sheet and
earnings statement of the company badly. Therefore, Beaudion et al. (2007) expect that
companies with less stable annual plan contributions are more likely to shift away from
DB schemes.
The funding ratios became volatile after the introduction of the IFRS. The new
accounting standards are requiring that liabilities and the assets are valued by market ratios (fair
value). The liabilities are long term obligations. The present values of these liabilities are
calculated using market interest rates. Before the introduction of the IFRS, these liabilities were
discounted using a fixed interest rate of 4%. Because of the variable market interest rates, the
liabilities became more volatile. These volatile funding ratios are leading to variable costs for
the company. The reason for this is that a company is obliged to fulfill the liabilities. So, the
company must show that the liabilities are covered in all times. Therefore, the employer must
make each year different service costs.
With the shift from DB plans to DC plans this problem will be solved, because in a DC
scheme the company is not obliged to contribute to the plan in times of shortages, and is not
obliged to show the DB plan on the balance sheet. The costs for a company in a DC plan are the
fixed contributions to the plan.
The volatility is the change of the Funding Ratio at time t-1, one year before the
company shifts away from a DB scheme, in comparison with year t-2, 2 years before the shift.
For non-shifting companies this volatility is computed as the change in Funding ratio in year t-1
in comparison with year t+1, where year t is the year of the accounting change.
5.5.3 Cash flow from investments
Beaudion et al. (2007) argue that the new requirements in pension accounting are
applied to ensure that assets are available to pay required pension obligations. To enhance these
requirements there is need for higher cash flows from operations. So, Beaudoin et al. (2007)
expect that companies with lower cash flows from operations are more likely to shift away
from DB schemes.
58
The information for this ratio I have obtained from annual reports of companies. To
control the size of the company the cash flows are divided by the total assets of the investigated
companies.
5.5.4 Maturity ratio
Swinkels (2006) states that the shifts by firms could be explained by high maturity
ratios and defines the maturity ratio as non-active participants contributing to the
scheme divided by total scheme members. A high maturity ratio means that the biggest
part of the liabilities is promised to the inactive participant. This induces that the
resulting part of the liabilities are promises to the active participants, which are
contributing in the pension fund. Therefore, in times of shortages the company must
make additional contributions, because the shortages could not be compensated by
contributions of active participant. The sponsor company is obliged to make additional
contributions to the pension plan in times of shortages. The low participation by active
members could be a reason for companies to close the DB-plans and start a DC plan to
avoid the risks of under-funding.
Klumpes et al. (2003) predict that firms with higher percentage of retired workers to
current active members will be more likely to terminate their pension plans because
this will significantly reduces the volatility of required contributions. Klumpes et al.
(2003) argue the following: “older schemes with more retired workers are likely to
demand non-trivial periodic contributions to meet the high level of anticipated fund
outflows. They are likely to exhibit slower growth and slower profitability than other
funds. By contrast, younger funds have implicitly higher proportion of younger workers
and growth opportunities.”
For the calculation of the maturity ratio I use the annual reports of the companies.
Maturity Ratio is calculated as follow:
5.5.5 Pension Size ratio
Swinkels (2006) states that companies with bigger pension plan assets consider
reducing their pension scheme risks. The pension size indicates the relation between the
company and the pension scheme. When the pension schemes are large in comparison to the
59
sponsor company, than the influence of a change in the funding level will be more on the
balance sheet of the company.
In this research I will investigate whether the pension size has an impact on the shift from DB
plan to a less risky DC plan. According to Swinkels (2006) the pension size could be calculated
by dividing the total pension plan assets to the market value of equities of the company. The
market value of equities is not always directly available in the annual reports, therefore we
should also calculate the market value of equities by multiplying the common shares with the
shares price.
Pension size is:
5.6 Data collection
The Data needed for the computation of the variables which I used in this research for the Dutch sample are extracted from the annual reports of the companies and pension funds. To find data for the UK sample I used Thomson one banker, DataStream, and Worldscope.
5.7 Research Methodology Dutch Sample: Explorative Research
In his study Swinkels (2006) analyzed Dutch AEX companies. Also Man (2008) used this sample for her investigation. This thesis builds further on the explorative study done by Swinkels (2006). The research sample used by Swinkels (2006) is limited to the AEX companies and the period of investigation is limited to the year 2005. Because there is not enough data available Swinkels (2006) and also Man (2009) have made use of an explorative research method. The explorative research is applied when there is not enough data available to use statistic methods. An assumption to use statistical methods is that the sample must be distributed normally. A sample tends to normality when this sample becomes larger. For the Dutch sample I have data for only 8 shifted companies against 12 non-shifted companies. For the Dutch sample I use the explorative method, because the Dutch sample is to small. If there is a small number of observations, then
it is possible that there are not many probable combinations of the values of the variables. So,
the probability of finding by chance a mixture of those values, which are indicating a strong
relation is high.
60
In her study, Man (2008) investigated the statistical relationship between the shift away from DB schemes to DC or CDC schemes and various company specific characteristics. Man (2008) used a larger sample through including AMX and ASCX companies in her investigation. I use the sample and data which is obtained by Man (2008). Man (2008) finds only a significant relationship between the pension size and the shift and concludes that other company specific characteristics are not influencing the shift away from DB schemes.
Beaudoin et al. (2007) investigated also the statistical relationship between the shift and
company specific characteristics, based on S&P 500 companies. The results indicated for this
sample that shifted companies had lower cash flow from operations than non-shifting
companies. So, I include the CFO ratio (CFO/Assets) in my research.
I compare the company specific characteristics Funding Ratio, CFO Ratio, Maturity
Ratio and Pension Size Ratio of shifting companies with the company specific characteristics of
non-shifting companies. In appendix IV, I attached the computed ratio’s which I used for the
explorative research.
For Dutch companies I compare the average21 ratio’s for the years t-1 to t-322 (year t is
the year of the shift) of shifted companies with average ratio’s t-2 to t+1 of non-shifted
companies (year t is the year 2005).
5.8 Research Methodology UK Sample: Analysis of Variances ( ANOVA)
To test whether the funding ratio, pension size and cash flow ratio are differing among
shifting companies and non-shifting companies I use the Analysis of Variances (ANOVA) test
in SPSS. Unlike the Dutch sample I have enough data to apply statistical method ANOVA for
the UK sample. Specifically, I have 70 shifted companies against 47 non-shifted companies to
compare with. With this analysis I want to test whether there is difference in the means of the
company specific characteristics between the companies which shifted away from DB schemes
to DC schemes and companies which did not shifted away from DB schemes.
For UK companies I compare the average ratio’s t-1 to t-3 (year t is the year of the shift) of
shifted companies with average ratio’s t-1 to t+1 of non-shifted companies (year t is the year
2003).
21 I use the average ratio’s because with this approach I involve the effects of a variable over a longer period. For
example; a company can consider a shift when the Funding Ratio is constantly low during a couple of years. For a
company the possibility consist to correct the underfunded position. When this is the situation a company can decide
not to shift away from a DB scheme.
22 The average ratio’s are computed for the period the data is available for a company. When there is no data for the
year t-3, than I compute the average ratio for the years t-1 and t-2.
61

5.8.1 One-Way ANOVA and Hypotheses
The ANOVA is used when there is a categorical independent variable and a normally
distributed interval dependent variable when testing for differences in the means of the
dependent variable categorized by the rank of the independent variable.
The One-Way ANOVA compares the mean of one or more groups based on one independent
variable. In this study there is one independent qualitative variable, which is the “Shift”. This
“Shift” variable is divided into three groups:
Companies shifted away from DB schemes to DC schemes.
Companies provided DB schemes during the test period.
Companies shifted away from DB final pay schemes to DB average pay schemes.
The dependent quantitative variables are the Funding Ratio, Pension Size, and Cash Flow
Ratio.
The following hypotheses are tested:
Funding Ratio
H01: The Funding Ratio does not differ significantly between shifting companies and non-
shifting companies.
H11: The Funding Ratio differs significantly between shifting companies and non-shifting
companies.
Funding Ratio VolatilityH0V: The Funding Ratio Volatility does not differ significantly between shifting companies and
non-shifting companies.
H1V: The Funding Ratio Volatility differs significantly between shifting companies and non-
shifting companies
Pension SizeH02: The Pension Size does not differ significantly between shifting companies and non-shifting
companies.
H12: The Pension Size differs significantly between shifting companies and non-shifting
companies.
Cash Flow Ratio
H03: The Cash Flow Ratio does not differ significantly between shifting companies and non-
shifting companies.
62
H13: The Cash Flow Ratio differs significantly between shifting companies and non-shifting
companies.
These hypotheses are tested maintaining a 5% significance level. So, when the
significance level in the SPSS output is less than 0.05, than the null-hypothesis (H0) will be
rejected. The alternate hypothesis (H1) is than accepted.
5.8.2 Assumptions One-Way ANOVA
The purpose of the one-way ANOVA is to examine whether two or more population
means are equal.
The assumptions needed for ANOVA:
1. The population variances are homogenous.2. The population is normal distributed.
To test whether the population variances of the sample I have used are homogenous,
the ANOVA analysis is applied. This method runs the statistic “Test of Homogeneity of
Variances”. When the significance of this test statistic is higher than 0.05, than the population
variances are homogenous. Than, I can make use of the One-Way ANOVA method to test the
sample on equality of variances.
To test whether the population is normally distributed I use Q-Q plots. The Q-Q plot is a trend-
line of a normal distribution. When the distribution of the sample fits this trend-line, than I
assume that my sample is normal distributed.
5.8.3 Non-Parametric Method: Kruskal-Wallis ANOVA test
The Kruskal-Wallis ANOVA method is used when there is one independent variable
with two or more categories and an quantitative dependent variable. The Kruskal-Wallis
ANOVA method is the same method as the One-Way ANOVA, but when one of the 3 assumption mentioned in section 5.8.2 is not met for a variable than the
Kruskal-Wallis one-way analysis of variance test can be used.
The Kruskal-Wallis test is performed on ranked data. This means that the measurement
observations are converted to their ranks in the overall data set. The smallest value gets a rank
of 1, the next smallest gets a rank of 2, and so on.23 When converting original values into ranks,
information can be lost. This makes the Kruskal-Wallis test less powerfull than the ANOVA
test. So, the ANOVA should be used if the data meet the assumptions.
23 McDonald, J.H. 2009 - Handbook of Biological Statistics (2nd ed.). Sparky House Publishing, Baltimore, Maryland
63
5.9 Improvement on prior studies
The difference between my research and that of Swinkels (2006) and Man (2009) is
that I have approached AEX, AMX and ASCX companies separately. With this approach I
compared shifted and non-shifted companies from the same index. This will give a better
explanation for my findings, because it is possible that larger companies have more sources to
cover for example funding shortages. A small company can also be affected more than a larger
company through changes in the pension scheme. So, a smaller company can decide to shift,
even when the Pension Size ratio is smaller or the Funding ratio is larger than that of a larger
company.
What I also approach different is that I compute the average ratio’s for my variables.
Specifically, for shifted companies I computed the average Pension Size ratio and the average
Funding ratio for 3 years before the shift, and for non-shifted companies for the years 2003 to
2006. I have done this because there is not a specific year in which companies have shifted.
This varies between the years 2002 to 2007. Swinkels (2006) and Man (2009) have investigated
the variables for shifed firms one year before the shift, and for non-shifted companies for the
year 2004, one year before the introduction of IFRS. With this method I included the effects of
prior year’s funding shortage, cash flow, and pension size.
5.10 Limitations
This study is limited to companies with occupational pension schemes. Also other companies with multi-employer pension schemes have shifted away from DB schemes to DC or CDC schemes. I have excluded companies with multi-employer schemes, because these multi-employer schemes have participants of different companies. The pension funds of the multi-employer schemes do not provide the information of companies separately. Another limitation is that these companies are required to be indexed on the Dutch AEX for Dutch companies and FTSE for English companies. The maturity ratio is excluded from this research for the UK sample, because it was not
possible to collect information about the number of the participants in a pension scheme. Also
information about pension scheme assets and liabilities was not available for some companies
for the years 2000 to 2003. So, these companies are also excluded from the sample. This
reduces the available companies which have shifted away from DB schemes to DC schemes to
70 and companies still providing DB schemes to 47.
64

6 Results of the research
6.1 Introduction
In this chapter the results of the research will be discussed. First of all, section 6.2 discusses the results of the explorative research for the Dutch sample. In section 6.3 the results of ANOVA analysis are discussed for the UK sample. Subsequently, in section 6.4 the results of the Dutch sample and UK sample are compared . Finally, in section 6.5 the conclusion is presented.
6.2 Results Explorative Research: Dutch Sample
In Appendix IV two groups of companies are presented. These are the companies
which have shifted away from DB schemes to DC or CDC schemes and companies which have
provided DB schemes during the period 2003 to 2008 in the Netherlands.
The following company specific characteristics are compared for these two groups:
Funding Ratio Funding Ratio Volatility Pension Size Maturity Ratio Cash flow Ratio
In sections 6.2.1-4 the results are presented.
The ratio’s presented in the tables in sections 6.2.1-4 are the average ratio’s of the ratio’s presented in Appendix IV. For shifted companies I computed the average ratio’s 3 years before they shifted away from DB schemes. For non-shifted companies I computed the average ratio’s for the years 2003, 2004, 2005, and 2006. I have done this because there is not a specific
year in which companies have shifted. This varies between the years 2002 to 2007. So, for non-
shifted companies I have decided to include the years 2003, 2005 and 2006 (Swinkels (2006)
and Man (2009) only investigated the year 2004) to capture a longer test period. This approach involves also pervious years effects for companies which have shifted away from DB schemes. For non-shifting companies I computed average ratio’s to involve the total effect of the company specific
65

characteristic around the introduction of IFRS. This is the period when some Dutch companies decided to shift away from DB schemes to DC schemes.
6.2.1 Funding Ratio and Funding Ratio Volatility
Akzo Nobel is a AEX listed company which shifted away from a DB scheme to a DC scheme in the year 2005. When comparing Akzo Nobel with other AEX listed companies like Unilever, Heineken, Ahold, and Shell it is observable that Akzo Nobel has a lower Funding Ratio with 109% in the years 2002 to 2004 before the shift than other AEX listed companies; Unilever which has a average Funding Ratio of 144%, Heineken with 112%, Hagemeijer with 126%, Ahold with 130%, and Shell with 143% for the years 2003 to 2006. On the other hand has another AEX listed company DSM (shifted in the year 2007) a high Funding Ratio of 142%. The reason for the shift by DSM might be explained by another factor like the Pension Size or the Maturity ratio. Swinkels (2006) stated that when the pension schemes are large
in comparison to the sponsor company, than the influence of a change in the funding level will
be more on the balance sheet of the company. The shift by DSM might be explained by the
Pension Size ratio.
Table 3: Funding Ratio’s Dutch AEX- listed companies
Also the shifted AMX listed companies Arcadis (110%), Nutreco (106%) and SNS Reaal (117%) have lower Funding Ratio’s than non-shifted companies Sligro (118%), Wereldhave (146%), and CSM (136%), which are also AMX listed. But this holds not for all companies. Specifically, the AMX listed company Heijmans has a Funding Ratio of 107%, which did not shifted away from DB scheme. As mentioned before, it is also important to study the Funding ratio in relation to the Pension Size. The low Pension Size of 10% for Heijmans might be a explaining characteristic for the fact that Heijmans did not shift away from the DB scheme.
66

Table 4: Funding Ratio’s Dutch AMX-listed companies
Ballast Nedam, Eriks Group, and Grontmij are ASCX listed companies which have
shifted away from DB schemes, and have respectively Funding Ratio’s of 107%, 97% and
113% one year before the shift. The Fundin Ratio’s for these companies are lower than the
average Funding Ratio’s of other ASCX listed companies which did not shifted away from DB
schemes i.e. Ten Cate, Hunter Douglas, and Super de Boer with respectively Funding Ratio’s of
124%, 122%, and 113%. When comparing the Funding Ratio volatility, there is no obvious
difference between shifting and non-shifting companies.
Table 5: Funding Ratio’s Dutch ASCX-listed companies
6.2.2 Pension Size
The AEX listed companies which have shifted away from DB schemes Akzo Nobel and DSM have respectively Pension Size ratio’s of 39% and 71% the year before they have shifted to DC schemes. Other AEX companies which did not shifted away to DC schemes like Unilever, Heineken, Ahold, and Shell have respectively Pension Size ratio’s of 13%, 33%, 19%, and 12%. There can be concluded that shifting companies have higher Pension Size ratio’s than non-shifting companies.
67
Table 6: Pension Size ratio’s Dutch AEX-listed companies
The shifted AMX companies Arcadis, SNS Real, and Nutreco have Pension Size ratio’s of respectively 315%, 226%, and 29%. This is different for non-shifting AMX companies Sligro, Wereldhave, CSM, and Heijmans which have respectively Pension Size ratio’s of 7%, 20%, 9%, and 10%.
Table 7: Pension Size ratio’s Dutch AMX-listed compaies
The ASCX listed companies Ballast Nedam, Eriks Group, and Grontmij have Pension Size ratio’s of 801%, 498%, and 318% before they shifted to DC schemes. The non-shifted companies Hunter Douglas, Ten Cate, and Super de Boer have contrary to shifted companies, respectively Pension Size ratio’s of 15%, 63% and 184%.
Table 8: Pension Size ratio’s Dutch ASCX-listed companies
68
6.2.3 Maturity Ratio
The maturity ratio’s for shifting and non-shifting companies do not show an necessary difference for both groups. The shifted companies Akzo Nobel and DSM have an average Maturity ratio of respectively 73% and 75%. But when looking to the Maturity ratio’s of non-shifted AEX listed companies there can be seen that Shell has a Maturity ratio of 71% and Unilever even 81%.
The shifted AMX companies Arcadis and Nutreco have both a Maturity ratio’s of 69%. Non-shifted AMX listed companies have also high maturity ratio’s as for example 73% for Wereldhave and 62% for CSM.
There is also not a difference observable for ASCX companies. As can be seen from Appendix IV, the shifted companies Ballast Nedam and Eriks Group have respectively Maturity ratio’s of 64% and 59%. For non-shifted ASCX listed companies Ten Cate and Super de Boer the Maturity ratio is 65%.For this sample there is no evidence that companies with higher Maturity ratio’s are switching.
6.2.4 Cash Flow Ratio
The Cash Flow ratio’s for the shifted AEX listed companies Akzo Nobel and DSM are 16% and 13%. For Unilever, Hagemeijer, and Ahold, which are also AEX listed, the Cash Flow ratio’s are respectively 16%, 4% and 15%.
For shifted companies which are listed on AMX like Arcadis and Nutreco the Cash Flow ratio is 31% en 20%. For non-shifted AMX companies CSM, Heijemans, and Sligro the Cash Flow ratio’s are respectively 10%, 16% and 9%.
There is also not a obvious difference between shifted and non-shifted ASCX listed companies. As can be seen from Appendix IV, the Cash Flow ratio’s for shifted companies Ballast Nedam and Grontmij are respectively –49% and 16%. For the companies Hunter Douglas, Ten Cate and Super de Boer the Cash Flow ratio’s are 15%, 8%, and –15%.The Cash Flow ratio for shifted and non-shifted companies do not show a specific trend for both groups. See Appendix IV.
69

6.2.5 Conclusion Results Dutch Sample
The results of the explorative research based on the Dutch sample shows that the Funding ratio differs between shifted companies and non-shifted companies. The Funding ratio’s for companies which have shifted are higher than companies which did not. This is conform the results of prior studies. Swinkels (2006) stated that the funding shortages would be visible on the balance sheet and earnings statement of sponsoring companies. These shortages are influencing the balance sheet and earnings statement negatively. So, companies with low funding ratios are the first to switch. Beaudoin et al. (2007) confirmed that companies with relatively weaker funded pension positions were more likely to switch away from DB schemes. Also Klumpes et al. (2003) argued that companies with lower stock funding ratio’s have higher propensity to terminate their pension schemes.
The Pension Size ratio shows also a different trend for shifted and non-shifted companies. Specifically, the Pension Size ratio for shifted companies is higher than non-shifted companies. Swinkels (2006) stated that the
pension size indicates the relation between the company and the pension scheme. When the
pension schemes are large in comparison to the sponsor company, than the influence of a
change in the funding level will be more on the balance sheet of the company. This might also
explain the fact that companies with only low Funding Ratio’s are not shifting.
6.3 Results ANOVA test: UK Sample
This section presents the results of the One-Way ANOVA and the Kruskal-Wallis One-
Way ANOVA test. This part of the research is based on the UK sample. In this section the
hypotheses are tested which I have stated in section 5.8.1. Different from the Dutch sample I
use the ANOVA test for the UK sample, because I have a larger sample. The sample I use for
this research consists of 117 companies. The explorative research is applied when there is not enough data available to use statistic methods. If there is a small
number of observations, then it is possible that there are not many probable combinations of the
values of the variables. So, the probability of finding by chance a mixture of those values,
which are indicating a strong relation is high. The UK sample is large enough to apply the
ANOVA statistics in SPSS.
70

6.3.1 Test Assumptions ANOVA: Funding Ratio (volatility), Pension Size, and Cash
Flow Ratio
The One-Way ANOVA can be used if certain conditions are met. The most important
assumptions are as follow:
1. The population variances are homogenous.2. The population is normal distributed.
In section 6.3.1.1-2 these assumptions are tested for the populations of the Funding Ratio (Volatility), Pension Size, and Cash Flow Ratio. The maturity ratio is omitted, because the data needed for the computation of the Maturity ratio was not available at the databanks Thomson One Banker, DataStream, and WoldScope.
6.3.1.1 Homogeneity of Variances
To test whether the population variances are homogenous I performed a ‘Homogeneity
of Variances test’ using SPSS for the data of the Funding ratio, Pension Size, and Cash Flow
ratio. The results are presented in table 9 below.
Table 9: Test of Homogeneity of Varinaces
Test of Homogeneity of Variances Sig.Funding Ratio 0.162
Pension Size 0.366
Cash Flow Ratio 0.809
Funding Ratio Volatility 0.036
As can be seen from table 9 the significances of the Funding ratio, Pension Size, and
Cash flow ratio are higher than the significance level of 5%. This means that the populations of
de variances are homogenous for the Funding Ratio, Pension Size and Cash Flow Ratio. But,
for the Funding Ratio Volatility the significance is 4%. Thus, the population variances of the
Funding Ratio Volatility are not homogenous. This means that the One-Way ANOVA test
cannot be used for the Funding Ratio Volatility. For this ratio the non-parametric method is
used: Kruskal-Wallis one-way analysis of variance test.
6.3.1.2 Normal Distribution
To test whether the populations are normal distributed I used the Q-Q Plot. The Q-Q
plot is a trend-line which presents the normal distribution. When the distribution of the
71
population fits this trend-line, than I assume that the population is normal distributed. In figure
4 the Q-Q plots are illustrated.
72

Figure 4: Q-Q Plots
As can be seen from figure 4, only the population for the Funding Ratio is normal
distributed. The One-Way ANOVA can only be used for the Funding Ratio. For the Funding
Ratio Volatility, Pension Size, and Cash Flow Ratio the non-parametric method is used.
6.3.2 Results One-Way ANOVA
To test whether the Funding Ratio differs among shifting companies and non-shifting
companies I used the Analysis of Variances (ANOVA) test. With this analysis I have tested
whether there is difference in the means of the company specific characteristic ‘Funding Ratio’,
between the companies which shifted away from DB schemes to DC schemes and companies
which did not shifted away from DB schemes.
The data of the Funding Ratio is the only one which meets the assumptions of homogeneity and
normality. So, for this factor the One-Way ANOVA can be applied.
73

The following hypothesis is tested:
H0F: The Funding Ratio does not differ significantly between shifting companies and non-
shifting companies.
H1F: The Funding Ratio differs significantly between shifting companies and non-shifting
companies.
The output of the One-Way ANOVA gives a significance of 0.02 for ‘Between Groups’
effect (see Appendix V). This is lower than the significance level of 0.05. So, the hypothesis
H0F is rejected and the alternative hypothesis H1F is accepted. The means of the Funding
ratio’s of shifted companies and non-shifted companies are significant different from each
other.
When looking further in the Multiple Comparison table in Appendix V, there can be
seen that the mean differences between companies still providing DB during 2003 to 2006 and
companies shifted between 2003 and 2006 is +7.4%. This means that companies which
provided DB during 2003 to 2006 had 7.4% higher Funding Ratio’s than companies shifted to
DC schemes in the same period.
6.3.3 Results Kruskal-Wallis one-way analysis of variance test
Because the data for the Funding Ratio Volatility, Pension Size and Cash Flow ratio do
not meet the normality and homogeneity assumption of the One-Way ANOVA method, the
Kruskal-Wallis One-Way ANOVA method is applied to test the mean differences between
shifted and non-shifted companies. See section 6.3.1.
The following hypothesis are tested
Funding Ratio VolatilityH0V: The Funding Ratio Volatility does not differ significantly between shifting companies and
non-shifting companies.
H1V: The Funding Ratio Volatility differs significantly between shifting companies and non-
shifting companies
Pension SizeH0PS: The Pension Size does not differ significantly between shifting companies and non-shifting
companies.
H1PS: The Pension Size differs significantly between shifting companies and non-shifting
companies.
74

Cash Flow RatioH0CF: The Cash Flow Ratio does not differ significantly between shifting companies and non-
shifting companies.
H1CF: The Cash Flow Ratio differs significantly between shifting companies and non-shifting
companies.
6.3.3.1 Kruskal Wallis ANOVA: Funding Ratio volatility
The significance output for the Funding Ratio Volatility from the Kruskal-Wallis
ANOVA test gives 0.42. This is much higher than the significance level of 0.05. So, the H0V is
accepted. This means that the Funding Ratio Volatility not does not differ between shifted and
non-shifted companies. See Appendix VI for descriptives of the Funding Ratio Volatility.
H0V: The Funding Ratio Volatility does not differ significantly between shifting companies and non-
shifting companies.
6.3.3.2 Kruskal Wallis ANOVA: Pension Size
Also for the Pension Size there exists no significant difference between shifted and
non-shifted companies. The SPSS output of the Kruskal-Wallis ANOVA test gives a
significance of 0.26. This is higher than the maintained significance level of 0.05. The H0PS is
accepted.
H0PS: The Pension Size does not differ significantly between shifting companies and non-shifting
companies
6.3.3.3 Kruskal Wallis ANOVA: Cash Flow Ratio
In Appendix VII the output of the Kruskal-Wallis ANOVA test for the Cash Flow
Ratio is attached. This output table gives a significance of 0.25. This significance is higher than
the significance level of 0.05. Therefore, the H0CF is accepted.
H0CF: The Cash Flow Ratio does not differ significantly between shifting companies and non-shifting
companies
6.3.4 Conclusion Results UK Sample
The results of the One-Way ANOVA and the Kruskal-Wallis ANOVA tests based on the UK sample shows that the Funding ratio differs between shifted companies and non-shifted companies. Companies which provided DB during the years 2002 to 2006 had by average 7.4% higher Funding Ratio’s than companies shifted away from DB schemes between the years
75

2002 to 2006. The Funding ratio’s for companies which have shifted away from DB schemes are higher than companies which did not shifted.
This is in line with the results of previous studies. Swinkels (2006) stated that the funding shortages would be visible on the balance sheet and earnings statement of sponsoring companies. These shortages are influencing the balance sheet and earnings statement negatively. Beaudoin et al. (2007) confirmed that companies with relatively weaker funded pension positions were more likely to switch away from DB schemes. Also Klumpes et al. (2003) argued that companies with lower stock funding ratio have higher propensity to terminate their pension schemes. The Pension Size ratio, the Funding Ratio Volatility, and Cash Flow ratio are not significant different for shifted and non-shifted companies. Specifically, there is no significant difference in Pension Size, Funding Ratio Volatility, and Cash Flow ratio of shifted and non-shifted companies.
6.4 Comparison Dutch Sample and UK Sample
When comparing the findings based on the Dutch sample with that of the UK sample,
there can be seen similarities. For both samples the Funding Ratio is different between shifted
and non-shifted companies. For the Dutch and UK sample, the shifted companies had lower
Funding Ratio’s than non-shifted companies. Further, for both samples there was no obvious
difference for the variables Cash Flow Ratio and Funding Ratio Volatility between shifted and
non-shifted companies.
One important difference between the Dutch research and UK research is that there is
no significant difference in Pension Size between shifted and non-shifted companies in the UK.
For the Dutch sample it was obvious that shifted companies had higher Pension Size ratios than
non-shifted companies (Section 6.2.2).
To analyze whether the Funding ratio, Cash Flow Ratio, and the Pension Size ratio are
significantly different between UK companies and Dutch companies I have also tested the
distribution differences between:
Shifted UK companies and shifted Dutch companies.(2-4)
Non-shifted UK companies and non-shifted Dutch companies.(1-3)
Shifted UK companies and non-shifted Dutch companies.(2-3)
Non-shifted UK companies and shifted Dutch companies.(1-4)
76
To test the differences in Funding ratio, Pension Size ratio, and Cash Flow ratio between
UK and Dutch companies I used the Mann–Whitney U24 test. The Mann-Whitney U test is a
non-parametric test which is used when the data is not normally distributed and/or when the
variance of two samples are not homogeny. The H0 hypothesis in the Mann–Whitney test
adresses that 2 groups of samples are pulled from similar populations. So, the
probability distributions are equal. The H1 hypothesis adresses that distribution of one
sample is higher.
This time I have not used the Kruskal-Wallis ANOVA test, because I want to know what
the differences are between more groups. The Kruskal-Wallis ANOVA test is not able to give
detailed information when there are more than 2 groups. In table 10 below I have presented my
findings.
Table 10: Results Mann–Whitney U; Differences in distributions UK and Dutch sample
Funding
Ratio
Pension
Size
Cash
Flow
Significance
Groups
2-4 0.00 0.04 0.07
1-3 0.00 0.04 0.05
2-3 0.00 0.01 0.00
1-4 0.00 0.00 0.00
Funding Ratio
As can be seen from table 10, the mean differences in Funding ratio between UK
companies and Dutch companies are all significant at a 5% significance level. This means that
the Funding ratio for Dutch companies and UK companies are differing significantly. When
looking at the Descriptive statistics in appendix IX, it is obvious that Dutch companies (shifted
and non-shifted) have higher Funding Ratio’s than UK companies. The mean rank for shifted
Dutch companies is 78, while the mean rank for shifted UK companies is 38. This means that
the Dutch distribution has higher values for the Funding ratio than UK’s distribution. Also the
non-shifted Dutch companies have higher Funding ratio’s than shifted UK companies, with
respectively mean ranks of 51 and 24.
Pension Size24 The Mann-Whitney U test is a non-parametric test to examine if two independent samples come from the same distribution.
77

When looking to the Pension Size ratio in table 10, it is obvious that this ratio is
significantly different for UK companies and Dutch companies (shifted and non-shifted).
Specifically, when looking further to the descriptive statistics attached in appendix IX, it is
obvious that the Pension Size ratio of shifting Dutch companies with a mean rank of 58 is
larger than the mean ranks of shifted UK companies, which have a mean rank of 40. This mean
rank of the Pension Size ratio for shifted Dutch companies (39) is also higher than the mean
rank of non-shifted UK companies (26). But, the mean ranks of the Pension Size ratio for non-
shifted Dutch companies (26 and 17) is lower than the mean ranks of the Pension Size ratio of
shifted UK companies and non-shifted UK companies, which have respectively mean ranks of
46 and 33.
This means that the distribution of the Pension Size ratio for non-shifted Dutch
companies is lower than the distribution of shifted Dutch companies, shifted UK companies,
non-shifted UK companies. On the other hand, the distribution of the Pension Size ratio of
shifted Dutch companies is higher than the Pension Size ratio’s of shifted UK companies and
non-shifted UK companies. So, the difference in Pension Size between shifted and non-shifted
Dutch companies is higher than the difference between shifted and non-shifted UK companies.
Cash Flow Ratio
The differences in mean ranks of the Cash Flow ratio’s for shifted Dutch and UK
companies is not significant. Also the mean ranks for the Cash Flow ratio for shifted Dutch and
non-shifted UK companies is not significantly different. This means that the distributions of the
Cash Flow ratio’s for shifted and non-shifted companies for both countries are similar.
But when analyzing the differences between the mean ranks of shifted UK companies
with non-shifted Dutch companies, and shifted Dutch companies with non-shifted UK
companies, it is noticeable that the mean ranks between these groups are significantly different.
In appendix IX it is observable that the distribution of the Cash Flow ratio is lower for both,
shifted and non-shifted Dutch companies, in comparison with UK companies.
78

7 Institutional Settings Explaining the Results7.1 Introduction
In prior studies Swinkels (2006), Man (2009), Beaudoin et al. (2007), Brown and Liu
(2001), Ostaszewski (2001) and Klumpes et al. (2003) tested different company specific
characteristics (explained in section 5.5, like the Funding Ratio (Volatility), Pension Size,
Maturity Ratio, and Operating Cash Flows) of shifting and non-shifting companies to explain
the differences between shifted and non-shifted companies. I used these company specific
characteristics to explain the differences between shifted UK companies and non-shifted UK
companies (period 2000 to 2005), and shifted Dutch companies with non-shifted Dutch
companies (period 2002 to 2007). I expected that shifted companies had lower Funding ratio’s
and Cash Flow ratio’s than non shifted companies in the years before they have shifted.
Another expectation was that the Pension Size ratio, Maturity Ratio, and the Funding ratio
volatility for shifted companies would be higher than for non-shifted companies.
As extension on prior studies I also compare the findings between the Netherlands and
UK, using the institutional settings of both countries as background information. The reason for
this extension is that the shift in UK was much bigger than the shift in the Netherlands. I
expected that the differences in institutional settings of both countries were explaining the
different trends in UK and Netherlands. Therefore, I analyzed the pension accounting
requirements, national regulatory rules for pensions, governance structures of pension schemes,
and the political environment for UK and Dutch companies. When considering the differences
in pension accounting rules between the Netherlands and UK in combination with the shift to
DC schemes in both countries, it is obvious that in the UK this shift to DC schemes is stronger.
Between the years 2000 to 2005, 40% of the FTSE companies with an annual turnover of more
than 800 million closed their DB schemes to new entrants. For the Netherlands this was only
10% of the AEX listed companies. This chapter presents the possible explanations of the results
of chapter 6. These explanations are given in accordance with the differences in institutional
settings, which are presented in chapter 4. Therefore, in sections 7.2 to 7.5 the results of chapter
6 are evaluated using the institutional settings as background information. Finally, section 7.6
closes this chapter with a comparison with the expectations and findings of prior studies.
Firstly, the differences in (international) pension accounting rules are summarized.
After this, the differences in national regulatory systems are described. Subsequently, the
differences in the governance structures of occupational pension schemes are presented.
Finally, the influences of national culture and politics on pension accounting are discussed.
79
7.2 Pension Accounting Requirements
When analyzing the differences in pension accounting between the Netherlands and
UK, the most important difference is that FRS 17 required the immediate and full recognition
of any actuarial and investment gains and losses on the company’s balance sheet. So, when
comparing the Dutch accounting rules and the UK’s accounting rules it can be assumed that
this stricter accounting rule had a more direct consequence for UK companies than for Dutch
companies up to the year 200825, because the requirement of immediate and full recognition of
actuarial and investment gains and losses was not required by IAS 19.
Another important difference is that the Dutch national pension accounting guideline
RJ 271 was not as strict as the UK’s national pension accounting guideline FRS 17. Listed
Dutch companies were allowed to comply with RJ 271, up to the year 2005. UK companies
were required to comply with FRS 17. RJ 271 was based on the incentives of IAS 19, but RJ 271 had a broader judgment when determining whether a pension scheme was DB or DC. In 2003, contrary to IAS 19, RJ 271 stated that the sponsoring company only bears DB liability, if that fact is specifically stipulated in its financial agreement with the pension foundation. So, Dutch listed companies with DB schemes had the opportunity to escape the accounting requirements of IAS 19, through complying with RJ 271. This stricter accounting requirements for UK companies may be a reason for the strong shift in the UK. Dutch companies were also be able to comply with the RJ 271 up to the year 2005. So, there might be delayed effect in the Netherlands among shifted companies. When combining the less stricter regulation in the Netherlands with the stock market fall in the years 2000 to 2004, there can be stated that more Dutch companies survived with little adjustments in pension schemes, through the shift to average-wage schemes. UK companies struggled with stricter pension accounting rules in times of economic crisis in the years 2000 to 2004. After the year 2004 the economic situation improved which may resulted in a big shift in the UK and a low shift in Netherlands.
7.3 National Regulatory Rules
On the other hand, when considering the national regulatory systems of both countries, it is remarkable that the Dutch regulatory system is stricter than the UK’s regulatory system with the strict funding requirement of 105%. The UK regulatory system had a milder minimum funding 25 On 4 April 2008, the IASB published a discussion paper which proposes the immediate recognition of all gains and losses from harmonization purposes.
80
requirement. When a pension scheme had less than 90% of the assets, than the sponsoring company was required to pay the shortfall below 90% within three years. When the pension scheme has a funding ratio between the 90% and 100%, than the shortfall must be paid within 10 years. But, the creation of the Pension Protection Fund under the Pension Act 2004 in the UK brought stricter pension regulations. These new rules were created to supervise the pension schemes and protect the pension scheme member for insolvency. But this Pension Act is not an explanation for the shift in the UK between the years 2000 to 2005, because this Act became active in the year 2005.
7.4 Governance Structure of Occupational Pension Schemes
An important difference between the Dutch and UK’s institutional setting is the way
pension schemes are governed. The control of pension schemes in the Netherlands is in the
hands of independent institutions represented by their own board. On the other hand, the
pension schemes in the UK can be seen as integrated parts of the sponsor companies. The
pension schemes in the Netherlands are managed by more professional and skilled managers
than the management of UK pension schemes. So, this situation led to healthier pension
schemes in the Netherlands than UK, because the Asset and Liability management was based
on better pension policies.
The fact that Dutch pension schemes were healthier is observable in the Data
Descriptive of the Funding ratio attached in appendix VIII. When analyzing the data, it can be
seen that the highest Funding Ratio is 113%, and the lowest is 18%. The UK has an average
Funding ratio of 77%. In the Netherlands the highest Funding ratio is 166%, and the lowest
97% (see appendix IV). This might also be a reason for the strong shift in the UK to DC
schemes. UK companies were perhaps not able to cover the funding shortages. Dutch pension
schemes are much healthier. This might be the reason for the fact that fewer Dutch companies
have shifted away from DB schemes. The funding shortages would be visible on the balance sheet and earnings statement of sponsoring companies. These shortages are influencing the balance sheet and earnings statement of the sponsoring company negatively.
7.5 Pension Culture: Influence of Politics and Social Solidarity
One more difference between the UK and the Netherlands is the feeling of social
solidarity within the Dutch culture which is also recognizable in the Dutch pension policy. In
the Netherlands risk-sharing is both collective and spread more equally between different
stakeholders. An extra factor to strengthen this feeling of social solidarity is that it is supported
81
through the whole society. There has never been a political party which supported the
strengthening of individual pension provisions at the expense of the first or second pillar
pension. In the UK the shift to individualistic DC schemes had a strong ideological and political
dimension.
This is also observable in the huge lobby in the Netherlands on the intorduction of IAS
19. In the Netherlands a debate ensued on the classification of compulsory multi-employer
pension schemes. The NIVRA and VNO-NCW lobbied against the new requirements. Even,
Minister Donner of the Ministry of Social Affairs and Employment requested the IASB to
revise the accounting standards for the Netherlands. This lobby was unique, because in the UK
where standards FRS 17 and IAS 19 were adapted, the reaction was not as huge as in the
Netherlands. The Dutch regulatory environment around pension accounting differs from other
countries.
7.6 Comparison: Expectations and Prior Studies
In chapter 5, I stated the expectation that the Funding Ratio between shifted companies
and non-shifted was different. Swinkels (2006), Man (2009), Klumpes et al. (2003), and also
Beaudoin et al. (2007) (section 3.4) tested this ratio based on different samples. All of these
studies addressed a significant difference between shifted and non-shifted companies. The
results presented in chapter 6 are conform the findings of prior studies and my expectations.
Specifically, the explorative research based on Dutch companies shows that shifted companies
had lower Funding ratio’s than non-shifted companies ( section 6.2.1). Also the ANOVA test
(section 6.3.2) based on the UK sample shows a significant difference between shifted and non-
shifted companies. When looking further to the descriptive statistics (Appendix of the Dutch
sample and UK sample, it is observable that the Dutch companies had higher Funding ratio’s
than UK companies. This is also witnessed by the results of the Mann-Whitney U test (section
6.4) which compares the Funding ratio distributions of Dutch and UK companies.
On the other hand, I expected that the Funding ratio volatility would be higher for
shifted companies in comparison with non-shifted companies. Beaudoin et al. (2007) has find a
significant difference in the Funding ratio volatility between shifted and non-shifted companies
based on the US sample. However, the results find by Man (2009) shows no difference
between shifted and non-shifted companies. The finings based on the explorative research for
the Dutch companies (section 6.2.1) and the Kruskal-Wallis ANOVA test (section 6.3.2) based
on UK companies are not conform my expectations. The explorative research do not show any
trend between shifted and non-shifted companies. And also the mean difference computed by
SPSS for shifted and non-shifted UK companies is insignificant.
Another expectation was that the Pension Size ratio would be higher for shifted
companies in comparison to non-shifted companies. Swinkels (2006) and Man (2009) both
82
presented significant difference between shifted and non-shifted Dutch companies. This
expectation comes true for the Dutch sample. The explorative research based on the Pension
Size ratio presented in Section 6.2.2 shows that shifted Dutch companies had higher Pension
Size ratio’s than non-shifted companies. However, this expectation is not in line with the results
for the UK sample. The Kruskal-Wallis ANOVA test presented in Section 6.3.3 shows that the
Pension Size ratio’s for shifted UK companies and non-shifted UK companies were not
significantly different. The reason for this may be the fact that shifted Dutch companies have
higher Pension Size ratio’s than both, UK and non-shifted Dutch companies. This is also
addressed in Section 6.4 by the Mann-Whitney U test. From this test comes true that the
distributions of the Pension Size ratio between UK companies and Dutch companies are
significantly different. The distribution of the Pension Size ratio for shifted Dutch companies is
higher than the Pension Size distribution for both, shifted and non-shifted UK companies. On
the other hand, the distribution of the Pension Size ratio for non-shifted Dutch companies is
lower than both, shifted and non-shifted UK companies. So, the differences in distributions of
the Pension Size ratio for shifted and non-shifted UK companies are similar, while the
differences in Pension Size distributions for Dutch companies are much higher. This is in line
with the findings of the explorative research and the Kruskal-Wallis ANOVA test. The Pension
Size ratio is higher for shifted Dutch companies than for non-shifted Dutch companies, while
there is no difference in the Pension Size ratio for shifted and non-shifted UK companies.
I also expected that the Cash Flow ratio would be lower for shifted companies than for
non-shifted companies. Beaudoin et al. (2007) presented a significant difference in the Cash
Flow ratio for shifted and non-shifted US companies. But neither for the Dutch sample, nor for
the UK sample the results are in line with this expectation. From the explorative research
presented in Section 6.3.4 there is no trend observable in the Cash Flow ratio for shifted Dutch
companies. Also the Kruskal-Wallis ANOVA test (Section 6.3.3) do not show any significant
difference between shifted and non-shifted companies. The Mann-Whitney U test presented in
Section 6.4 shows that the differences in distributions of the Cash Flow ratio’s for shifted Dutch
and UK companies is not significant. Also the mean ranks for the Cash Flow ratio for shifted
Dutch and non-shifted UK companies is not significantly different. This means that the
differences in distributions of the Cash Flow ratio’s for shifted and non-shifted companies for
both countries are similar. This is also in line with the results of the explorative research and the
Kruskal-Wallis ANOVA test. In both countries there is no significant difference in Cash Flow
ratio between shifted and non-shifted companies.
Swinkels (2006) and Klumpes et al. (2003) tested the Maturity ratio for their samples.
Klumpes et al. (2003) cite the following:
83
“Older schemes with more retired workers are likely to demand non-trivial periodic
contributions to meet the high level of anticipated fund outflows. They are likely to exhibit
slower growth and slower profitability than other funds. By contrast, younger funds have
implicitly higher proportion of younger workers and growth opportunities.”
For shifted companies I expected a higher Maturity ratio in comparison to non-shifted
companies. This company specific characteristic I only tested for the Dutch sample, because the
data needed for the computation of the Maturity ratio for UK companies was not available. The
findings of the explorative research based on the Dutch sample presented in section 6.3.2 shows
no obvious difference in the Maturity ratio between shifted and non-shifted Dutch companies.
This finding is not conform my expectations.
The findings of this research are summarize in table 10 below.
Table 10 Summary Results Dutch and UK sample
Dutch Sample UK Sample
Variables
Funding Ratio Explains the shift Explains the shift
Funding Ratio Volatility No relation No relation
Pension Size Explains the shift No relation
Cash Flow Ratio No relation No relation
84

8 ConclusionPrior studies; Swinkels (2006), Man (2009), Beaudoin et al. (2007), Brown and Liu
(2001), Ostaszewski (2001) and Klumpes et al. (2003) have witnessed that there is a shift to DC
schemes in the Netherlands, UK, Canada and US. All of these studies describe different
motives for the shift. One of these motives, which is also addressed in most studies, is the
introduction of new stricter pension accounting standards (IAS 19, FRS 17, SFAS 158 and
SFAS 87).
IAS 19.25-27 states that in case of DC schemes, the entity’s legal or constructive
obligation is restricted to the fixed amount that it agrees to pay in the scheme. As a result, the
employee carries actuarial- and investment risks. For DC schemes, the employers have to pay a
fixed contribution and they do not face any other liability.
IAS 19.54 requires for DB schemes to recognize the present value of the defined
benefit obligation in the balance sheet, as adjusted for unrecognized actuarial gains and losses
and unrecognized past service cost, and reduced by the fair value of scheme assets at the
balance sheet date.
UK’s FRS 17 is largely consistent with IAS 19 and required companies to recognize
pension scheme assets and liabilities in their financial statements, measured annually using
market-values.
The present value of these liabilities, which are based on the market interest rate, are
implicated promises to different generations that are participating in a pension scheme. The
requirements of IAS 19 and FRS 17 can bring volatility into the balance sheet of a company
with a DB scheme, because it is difficult to prepare an asset portfolio (coverage of the pension
promises) that matches the long term liabilities. This asset and liability match would be extra
difficult when considering an economic crisis, where the market interest rate is low, and the fair
value of the assets are declined. This situation increases the liability and decreases the market
value of the assets, which leads to funding shortages.
Funding shortages would be visible on the balance sheet and earnings statement of the
sponsoring company. These shortages would have influenced the balance sheets and earnings
statements negatively. Therefore, companies with low funding ratios, in comparison to
companies which have not, are considering the shift to a DC scheme.
The research based on Dutch companies shows a different trend between shifted and
non-shifted companies. Specifically, the company-specific characteristic Funding Ratio is
lower for shifted companies than for non-shifted companies. Also the Funding Ratio for shifted
85
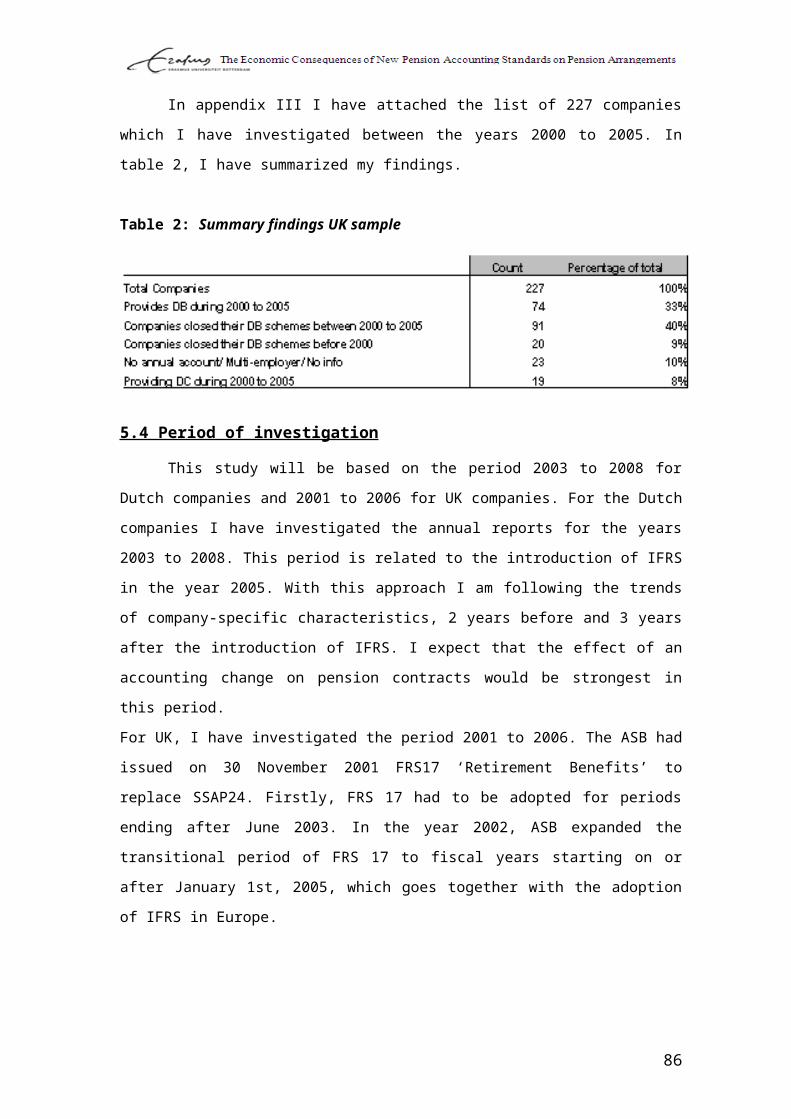
UK companies is lower than the Funding Ratio of non-shifting UK companies. However, the
Funding Ratio is considerably higher for Dutch companies than for UK companies. This might
be the reason for the stronger shift by UK companies.
Also the Pension Size ratio differs between shifted and non-shifted Dutch companies.
The Pension Size ratio is higher for shifted companies. The pension size indicates the relation
between the company and the pension scheme. When the pension schemes are large in
comparison to the sponsor company, than the influence of a change in the funding level will be
more on the balance sheet of the sponsor company. For UK companies there is not a significant
difference in Pension Size ratio between shifted and non-shifted companies.
When comparing the accounting changes in both countries, it is obvious that the introduced accounting standards FRS 17 and IAS 19 are comparable. Also the national pension regulations in the Netherlands and UK look comparable to a large extent. Although, one important difference is the classification of DB schemes given by the Dutch national accounting standard RJ 271. In particular IFRS were required for all listed companies in Europe. Also listed UK companies were required to comply with IAS 19 since the year 2005. So, up to the year 2005 listed UK companies were required to comply with FRS 17. The Dutch institutional setting is reasonably dissimilar from that of the UK’s. Before the introduction of IAS 19, Dutch companies were allowed to comply with RJ 271. As a result, Dutch companies have made use of this opportunity to offset the accounting requirements for DB schemes through treating these DB schemes as DC schemes. So, presuming that the shift away from DB schemes is caused by accounting changes, one must take into account a delayed effect could occur in the Netherlands. When considering the less stricter regulation in the Netherlands with the stock market fall in the years 2000 to 2004, it is obvious that more Dutch companies survived with little adjustments in pension schemes, through the shift to average-wage schemes. UK companies struggled with stricter pension accounting rules in times of economic crisis in the years 2000 to 2004. After the year 2004 the economic situation improved which may have resulted in a big shift in the UK and a low shift in Netherlands.
A further difference between the Dutch and UK’s institutional setting is the governance
structure of pension schemes. The management of pension schemes in the Netherlands are in
86
the hands of independent institutions represented by their own board. The pension schemes in
the UK can be seen as integrated parts of the sponsor companies. The pension schemes in the
Netherlands are managed by more professional and capable managers than the management of
UK pension schemes. So, this situation led to healthier pension schemes in the Netherlands than
UK, because the Asset and Liability management is based on more prosperous pension policies.
This might also be a reason for the strong shift in the UK to DC schemes. UK companies were
perhaps not able to cover the funding shortages. Dutch pension schemes are much healthier.
This might be the reason for the fact that fewer Dutch companies have shifted away from DB
schemes.
One more difference between the UK and the Netherlands is the feeling of social
solidarity within the Dutch culture which is also recognizable in the Dutch pension policy. In
the Netherlands risk-sharing is both collective and spread more equally between different
stakeholders. An additional factor to strengthen this feeling of social solidarity is that
politicians support it. In the Netherlands a debate ensued on the classification of compulsory
multi-employer pension schemes. The NIVRA and VNO-NCW lobbied against the new
requirements. Even, Minister Donner of the Ministry of Social Affairs and Employment
requested the IASB to revise the accounting standards for the Netherlands. This lobby was
unique, because in the UK where standards FRS 17 and IAS 19 were adapted, the reaction was
not as huge as in the Netherlands.
When taking these differences into account, it is reasonable that the response on
accounting changes in both countries is differing from each other. Between the years 2000 to
2005 this was 40% of the UK companies. In the Netherlands only 10% of the listed companies
shifted between the years 2003 to 2008 to DC or CDC schemes. A more important trend in the
Netherlands is the shift from DB final pay schemes to DB average pay schemes.
Finally, one has to keep in mind certain limitations. When analyzing the findings of this
study, one must consider that the introduction of FRS 17 was in times of the stock market fall
in the years 2000 to 2003. So, the economic environment of UK companies may reinforce the
situation in the UK. The test period for Dutch companies is a much healthier period (2003 to
2008). It is now the question for how long Dutch pension schemes will preserve their DB
characters, when considering the bad economic circumstances nowadays, triggered by the
Subprime Mortgage Crises, which is attended with up-coming stricter pension regulations
(Amendments on IAS 19). I expect that in the future more companies will close their DB
schemes in the Netherlands.
87

For further research it would be interesting when analyzing the shift away from DB
schemes from the perspective of companies which have not shifted in the UK. After this study I
am curious to the characteristics of companies still providing DB schemes, while most
companies have closed their DB schemes. Possible company characteristics, which can be
examined, are the financial health and industry.
Another interesting trend is the shift to DB average-wage schemes by Dutch companies. In the
Netherlands there was a strong shift from DB final-wage schemes to DB average-wage
schemes in the years 2002 to 2006. A research to the company specific characteristics of
shifting companies in comparison with non-shifting companies might explain the delayed shift
to DC schemes in the Netherlands. I expect that Dutch companies preserved their DB
characters for a while, through the shift to DB average-wage schemes.
88
References
Aboody, D., M.E. Barth en R. Kasznik (2004b), “Firm’s voluntary recognition of stock-
based compensation expense”, Journal of Accounting Research, 42 (2): 123-150.
Association of Consulting Actuaries (2007), “Trends in: Scheme provision,
contributions and scheme deficits”, UK Pension Trends Survey Report, website
publication. ( www.aca.org.uk).
Beattie, V., Goodacre, A. and Thomson, S.J., “International lease-accounting reform and
economic consequences: The views of U.K. users and preparers”, The International Journal of
Accounting, 41: 75-103.
Beaudoin, C., Chandar, N. and Werner, E. (2007), “An empirical investigation on the defined
benefit pension plan freeze decision” Working Paper Series at SSRN:
http://papers.ssrn.com/sol3/papers.cfm?abstract_id=1012672
Blake, J. (1992), “A Classification System for Economic Consequences Issues in Accounting
Regulation”, Accounting and Business Research, 22 (88): 305-321.
Bodie, Z. (1990), “Pensions as Retirement Income Insurance”, Journal of Economic Literature, 28 (1): 28-49.
Brown, R.L. and Liu J. (2001), “The Shift to Defined Contribution Pension Plans: Why
Did It Not Happen in Canada?” North American Actuarial Journal, 5: 65-77.
Dechow, P., A. Hutton, and R. Sloan (1996), “Economic consequences of accounting
for stock-based compensation”, Journal of Accounting Research, 34: 1–20.
Dixon, A.D. and Monk, A.H.B. (2008), “The Power of Finance: Global Influence with Local
Differences”, Working Paper Series, SSRN: http://ssrn.com/abstract=1265635
Donner, J.P.H. (2008), “Comments on IASB Discussion Paper: Preliminary Views on
Amendments to IAS 19 Employee Benefits”.
Downs, A. (1957), “An Economic Theory of Democracy” New York: Harper
89

European Financial Reporting Advisory Group (EFRAG) and Accounting Standards Board
(ASB) (2008), Discussion paper, “The Financial Reporting of Pensions”, website publication
www.efrag.org.
Fore, D. (2004), “Changes in accounting practices will drive pension paradigm shift”, Pension
Research Council working paper, 8 (16): 173-188.
Georgiou, G., “Corporate Lobbying on Accounting Standards: Methods, Timing and Perceived
Effectiveness” Abacus, 40 (2): 219-237.
International Accounting Standards Board, Discussion Paper: “Preliminary views on
amendments to IAS 19 Employee Benefits”, Issue 4 July 2008
Imhoff, Jr. and Thomas, J. K. (1988), “Economic consequences of accounting standards: The
lease disclosure rule change.” Journal of Accounting and Economics, 10 (4): 277-310
Jorissen, A., Lybaert, N., Orens, R. & Van Der Tas, L. (2007), “Lobbying towards the IASB: a
multi-issue analysis of the participation in the due process of standard setting”, presented at the
Workshop on Accounting and Regulation, 22 September 2007, Siena
Kamatsubara, A. (2000), “The Growing Importance of Personal Pensions in the U.K. Pension
System”, NLI Research Institute, No 134
Kiosse, P.V. and Peasnell, K.V. (2009), “Have Changes in Pension Accounting Changed
Pension Provision? A Review of the Evidence”, Accounting and Business Research, 39 (3):
255-267.
Klumpes, P.J.M. (2001), “Implications of four theoretical perspectives for pension
accounting research”, Journal of Accounting Literature, 20: 30-61.
Klumpes, P.J.M. and Whittington, M. (2003), “Determinants of actuarial valuation method
changes for pension funding and reporting: evidence from the UK”, Journal of Business
Finance & Accounting, 30: 175 – 205.
90

Knoops, C.D. and Korthals, A. (1996),”Philosophical preconditions of market-based
accounting research”, Paper presented at the 19th Annual Congress of the European
Accounting Association, Bergen, Norway.
Lev, B. and Ohlson, J.A. (1982), “Market-Based Empirical Research in Accounting: A Review,
Interpretation, and Extension” Journal of Accounting Research, 20: 249-322.
Man, W.O. (2009), “The Introduction of IFRS in the Netherlands: Economic Consequences on
Pension Contracts, Master thesis, Erasmus University, Rotterdam.
McDonald, J.H. (2009), “Handbook of Biological Statistics”, (second edition), Sparky
House Publishing, Baltimore, Maryland
Ostaszewski, K.M. (2001), “Macroeconomic aspects of private retirement programs” North
American Actuarial Journal, 5 (3): 52-64.
Ponds, E. and Van Riel, B, (2007) "The Recent Evolution of Pension Funds in the Netherlands:
The Trend to Hybrid DB-DC Plans and Beyond", Working Paper Series, SSRN:
http://ssrn.com/abstract=964428.
Raad voor de Jaarverslaggeving, Issue paper; “Application of IAS 19 to the classification of
compulsory industry wide multi-employer pension scheme in the Netherlands”, Brussels, 19
October 2007
Rappaport, A. (1977), “Economic impact of accounting standards – Implications for the
FASB”, Journal of Accountancy, May: 89-98.
Sikka, P. (2001), ‘Regulation of Accountancy and the Power of Capital: Some Observations’, Critical Perspectives on Accounting, 12 (2): 199-211
Sutton, T. G. (1984), “Lobbying of accounting standard-setting bodies in the U.K. and the
U.S.A.: A Downsian analysis”, Accounting, Organizations and Society, 9(1), 81-95.
Swinkels, L. (2006) “Have Pension Plans Changed After the Introduction of IFRS?”, Working
Paper, Erasmus University Rotterdam, Department of Finance.
91

Vlaar P. (2005) “Defined benefit plans and regulations”, DNB Working Paper, No. 63/2005: 1-
32.
VNO-NCW (2002), ‘12 argumenten waarom de pensioenparagrafen van RJ richtlijn
271 onjuist zijn!’
Watts, R.L. and Zimmerman, J.L. (1978), “The Demand for and Supply of Accounting
Theories: The Market for Excuses” The Accounting Review, April 1979: 273-305.
Watts, R.L. and Zimmerman, J.L., (1979), “Towards a Positive Theory of the Determination of
Accounting Standards”, The Accounting Review, January 1980: 112-134.
Whelan, S. (2003) “Promises, Promises: Defined Benefit Pension Schemes in a Cynical
Age”, Irish Banking Review, Winter 2003: 48-62.
Wolk, H.I., Dodd, J.L. & Tearney, M.G. (2004), “Accounting theory: conceptual issues in a
Political and economic environment”, (sixth edition), Thomson South Western, Mason, Ohio.
Wyatt, A. (1977), “The economic impact of financial accounting standards” The Journal of
Accountancy, October 1977: 92-94
Yermo, J. (2007), "Reforming the Valuation and Funding of Pension Promises: are
Occupational pension Plans Safer?", OECD Working Papers on Insurance and Private
Pensions, No. 14, OECD Publishing.
Zeff, S.A.(1978),“The Rise of ‘Economic Consequences’,” The Journal of Accountancy, 1979
146 (6): 56-63.
Zeff, S.A. (1979). “Paton on the effects of changing prices on accounting, 1915-55”, Essays in Honor of William A. Paton: Pioneer Accounting Theorist, 91-137.
92
Appendix I Summary Literature Review
Article Influencing factor
Population Method Result Theory
Swinkels (2006)
Company specific characteristic.
The Netherlands: Analyzing annual reports of 24 Dutch companies from the major stock market index. Test period 2003 to 2006
Explorative research: Comparing company specific characteristics of shifting firms with non-shifting firms.
Regulations and accounting standards have big impact on pension plans
Excessive regulation theory, Separation theory, Insurance theory
Klumpes et al. (2003)
Company specific characteristics; pension fund specific characteristics; actuarial valuation method.
United Kingdom; Based on a sample of 80 UK sponsoring companies; divided into 40 shift companies and 40 non-shift companies. Test period 1994 to 2001.
Empirical research; regression analysis: using company specific and pension fund specific characteristics as independent variables explaining the dependent variable ‘switch or not’.
The need to curtail unfunded pension liabilities and option value to default on implicit pension promises appear to be primary motivations associated with the decision to terminate under-funded UK pension schemes. In addition firms’ termination decision is conditional upon their prior voluntary accounting choice, i.e. the actuarial valuation method switch.
Integration theory, Insurance theory
Brown and Liu (2001)
Institutional environment, accounting regulation and tax
United States and Canada; 1973 to 1997. Using macro-economic data.
Comparison between two countries
Pension regulation and tax are important factors for the
Excessive regulation theory
93

shift away of DB plans
Ostaszewski (2001)
Macro-economic factors; wages/labour, capital market situations.
United States; for the period 1973 to 1997. Using macro-economic data.
Derive correlations and hypothesize causations between macro-economic factors; national income, labour, social insurance contributions.
Changing regulations have no impact to the decline of DB schemes. Correlation between shift away from DB and shift away from compensating labour in the form of wages
Beaudoin et al. (2007)
Financial accounting considerations, cash flow related incentives, and improving a firm’s competitive position.
United States; Based on a sample from S&P 500 companies with DB schemes. The test period is from 2001 to 2006
Empirical research; Using logistic regression models: Comparison between 55 “termination” companies and 276 companies that did not decide to terminate their DB schemes.
The effect of proposed pension accounting changes plays a primary role in the decision to terminate DB schemes.
Excessive regulation theory, Integration theory, Insurance theory
94

Appendix II Dutch Sample
Total overview pension scheme from the 75 largest companies of the Euronext 2002-2007
(Man, 2009).
Company Industry 2002 2003 2004 2005 2006 2007
A
E
X 1 Aegon Financial
CP-
DBAP
CP-
DBAP
CP-
DBAP
CP-
DBAP
CP-
DBAP
CP-
DBAP
2 Ahold Food
CP-
DBAP
CP-
DBAP
CP-
DBAP
CP-
DBAP
CP-
DBAP
CP-
DBAP
3 Akzo Nobel Chemical
CP-
DB
CP-
DB
CP-
DB
CP-
DC
CP-
DC
CP-
DC
4 Arcelor mittal Metal
ME-
DB
ME-
DB
ME-
DB
ME-
DB
ME-
DC
ME-
DC
5 ASML Electronic
ME-
DBAP
ME-
DBAP
ME-
DBAP
ME-
DBAP
ME-
DBAP
ME-
DBAP
6 orio Financial
ME-
DBAP
ME-
DB
ME-
DB
ME-
DBAP
ME-
DBAP
ME-
DC
7
Corporate
Express Whole sale
CP-
DB
CP-
DB
CP-
DB
CP-
DB
CP-
DB
CP-
DB
8 DSM Chemical
CP-
DB
CP-
DB
CP-
DB
CP-
DC
CP-
DC
CP-
DC
9 Fortis Financial
ME-
DB
ME-
DB
ME-
DB
ME-
DB
ME-
DB
ME-
DB
1
0 Hagemeyer Whole sale
CP-
DB
CP-
DB
CP-
DB
CP-
DB
CP-
DB
CP-
DBAP
1
1 Heineken Food
CP-
DB
CP-
DB
CP-
DB
CP-
DB
CP-
DB
CP-
DB
1
2 ING group Financial
ME-
DB
ME-
DB
ME-
DB
ME-
DB
ME-
DB
ME-
DB
1
3 KPN
Communic
ation
CP-
DBFP
CP-
DBFP
CP-
DBFP
CP-
DBFP
CP-
DBFP
CP-
DBFP
1
4 Philips Electronic
CP-
DBFP
CP-
DBFP
CP-
DBAP
CP-
DBAP
CP-
DBAP
CP-
DBAP
1
5
Randstad
Holding Service
CP-
DB
CP-
DB
CP-
DB
CP-
DB
CP-
DB
CP-
DB
1 Rodamco Europe Financial CP- CP- CP- CP- CP- CP-
95
6 DB DB DB DB DB DB
1
7
Royal Dutch
Shell
Utilities,
chemical
CP-
DBFP
CP-
DBFP
CP-
DBFP
CP-
DBFP
CP-
DBFP
CP-
DBFP
1
8 Reed Elsevier Media
CP-
DBFP
CP-
DBFP
CP-
DBFP
CP-
DBFP
CP-
DBFP
CP-
DBFP
1
9 SBM offshore Transport
ME-
DBD
C
ME-
DBD
C
ME-
DBD
C
ME-
DBD
C
ME-
DBD
C
ME-
DBD
C
2
0 Tele atlas IT
CP-
DC
CP-
DC
CP-
DC
CP-
DC
CP-
DC
CP-
DC
2
1 TNT Transport
CP-
DBAP
CP-
DBAP
CP-
DBAP
CP-
DBAP
CP-
DBAP
CP-
DBAP
2
2 Tomtom IT
CP-
DC
CP-
DC
CP-
DC
CP-
DC
CP-
DC
CP-
DC
2
3 Unilever Food
CP-
DBFP
CP-
DBFP
CP-
DBFP
CP-
DBFP
CP-
DBFP
CP-
DBFP
2
4 Vedior Service
ME-
DBFP
ME-
DBFP
ME-
DBFP
ME-
DBFP
ME-
DBFP
ME-
DC
2
5 Wolters Kluwer Media
CP-
DBFP
CP-
DBFP
CP-
DBFP
CP-
DBFP
CP-
DBAP
CP-
DBAP
A
M
X
2
6
Aalberts
Industries Metal ME ME ME ME ME ME
2
7 AMG Metal
CP-
DC
CP-
DC
CP-
DC
CP-
DC
CP-
DC
CP-
DC
2
8 Arcadis Service
CP-
DBFP
CP-
DBFP
CP-
DC
CP-
DC
CP-
DC
CP-
DC
2
9
ASM
international Electronic
ME-
DB
ME
DB
ME
DB
ME
DB
ME
DB
ME
DB
3
0 BAM Groep
Constructi
on
ME-
DBFP
ME-
DBFP
ME-
DBFP
ME-
DBFP
ME-
DBAP
ME-
DC
3
1 Binckbank Financial
ME-
DB
ME-
DB
ME-
DB
ME-
DB
ME-
DB
ME-
DB
3
2
Boskalis
Westminster
Constructi
on
ME-
DBFP
ME-
DBFP
ME-
DBAP
ME-
DBAP
ME-
DBAP
ME-
DBAP
3
3 Crucell Pharmacy
CP-
DC
CP-
DC
CP-
DC
CP-
DC
CP-
DC
CP-
DC
3
4 CSM Food
CP-
DBFP
CP-
DBFP
CP-
DBFP
CP-
DBAP
CP-
DBAP
CP-
DBAP
3
5 Draka Holding Metal
ME-
DB
ME-
DB
ME-
DB
ME-
DB
ME-
DB
ME-
DB
3
6
Eurocommercial
Properties
Service,
Financial
CP-
DC
CP-
DC
CP-
DC
CP-
DC
CP-
DC
CP-
DC
3
7 Fugro
Constructi
on
ME-
DBAP
ME-
DBAP
ME-
DBAP
ME-
DBAP
ME-
DBAP
ME-
DBAP
3
8 Heijmans
Constructi
on
CP-
DBFP
CP-
DBFP
CP-
DBFP
CP-
DBFP
CP-
DBFP
CP-
DBFP
3 Imtech Service, IT ME- ME- ME- ME- ME- ME-
96
9 DB DB DB DB DB DB
4
0 Logica CMG IT
CP-
DBFP
CP-
DBFP
CP-
DBFP
CP-
DBFP
CP-
DBFP
CP-
DBFP
4
1 Nutreco Food
CP-
DB
CP-
DB
CP-
DB
CP-
DB
CP-
DC
CP-
DC
4
2 OCE IT
CP-
DBFP
CP-
DBFP
CP-
DBFP
CP-
DBFP
CP-
DBAP
CP-
DBAP
4
3 Ordina IT
ME-
DB
ME-
DB
ME-
DC
ME-
DC
ME-
DC
ME-
DC
4
4 SNS reaal Financial
CP-
DBFP
CP-
DBFP
CP-
DBAP
CP-
DC
CP-
DC
CP-
DC
4
5 USG people Service
ME-
DBFP
ME-
DBFP
ME-
DC
ME-
DC
ME-
DC
ME-
DC
4
6 Vastned Retail Financial
CP-
DB
CP-
DB
CP-
DB
CP-
DB
CP-
DB
CP-
DB
4
7 Vopak Transport
CP-
DBAP
CP-
DBAP
CP-
DBAP
CP-
DBAP
CP-
DBAP
CP-
DBAP
4
8 Wavin
Constructi
on
ME-
DB
ME-
DB
ME-
DB
ME-
DB
ME-
DB
ME-
DB
4
9 Wereldhave Financial
CP-
DBFP
CP-
DBFP
CP-
DBFP
CP-
DBFP
CP-
DBFP
CP-
DBFP
5
0 Wessanen Food
CP-
DBFP
CP-
DBFP
CP-
DBFP
CP-
DBFP
CP-
DBAP
CP-
DBAP
As
cX
5
1 OPG Pharmacy
CP-
DBFP
CP-
DBFP
CP-
DBFP
CP-
DBAP
CP-
DBAP
CP-
DBAP
5
2 Antonov Metal
ME-
DC
ME-
DC
ME-
DC
ME-
DC
ME-
DC
ME-
DC
5
3 Ballast Nedam
Constructi
on
CP-
DB
CP-
DB
CP-
DB
CP-
CDC
CP-
CDC
CP-
CDC
5
4 Beter bed Whole sale
ME-
DB
ME-
DB
ME-
DB
ME-
DB
ME-
DB
ME-
DB
5
5
Brunel
international Service
CP-
DC
CP-
DC
CP-
DC
CP-
DC
CP-
DC
CP-
DC
5
6 Eriks groep Whole sale
CP-
DBFP
CP-
DBFP
CP-
CDC
CP-
CDC
CP-
CDC
CP-
CDC
5
7 Exact holding IT
CP-
DC
CP-
DC
CP-
DC
CP-
DC
CP-
DC
CP-
DC
5
8 Grontmij Service
CP-
DBFP
CP-
DBFP
CP-
DBFP
CP-
DBFP
CP-
CDC
CP-
CDC
5
9 Hunter Douglas
Constructi
on
CP-
DB
CP-
DB
CP-
DB
CP-
DB
CP-
DB
CP-
DB
6
0 Innoconcepts Service
ME-
DC
ME-
DC
ME-
DC
ME-
DC
ME-
DC
ME-
DC
6
1 Kardan Financial
ME-
DC
ME-
DC
ME-
DC
ME-
DC
ME-
DC
ME-
DC
6
2
Macintosh retail
group Whole sale
ME-
DBAP
ME-
DBAP
ME-
DBAP
ME-
DBAP
ME-
DBAP
ME-
DBAP
6 Nieuwe steen Financial ME- ME- ME- ME- ME- ME-
97
3 investments DC DC DC DC DC DC
6
4 Pharming Pharmacy
ME-
DC
ME-
DC
ME-
DC
ME-
DC
ME-
DC
ME-
DC
6
5 Qurius IT
ME-
DBAP
ME-
DBAP
ME-
DBAP
ME-
DBAP
ME-
DBAP
ME-
DBAP
6
6 Sligro Whole sale
CP-
DBAP
CP-
DBAP
CP-
DBAP
CP-
DBAP
CP-
DBAP
CP-
DBAP
6
7
Smit
Internationale Transport
CP-
DBFP
CP-
DBFP
CP-
DBAP
CP-
DBAP
CP-
DBAP
CP-
DBAP
6
8 Super de boer Food
CP-
DBAP
CP-
DBAP
CP-
DBAP
CP-
DBAP
CP-
DBAP
CP-
DBAP
6
9 Telegraaf Media
CP-
DBAP
CP-
DBAP
CP-
DBAP
CP-
DBAP
CP-
DBAP
CP-
DBAP
7
0 Ten Cate Chemical
CP-
DBAP
CP-
DBAP
CP-
DBAP
CP-
DBAP
CP-
DBAP
CP-
DBAP
7
1 TKH group Electronic
ME-
DBAP
ME-
DBAP
ME-
DBAP
ME-
DBAP
ME-
DBAP
ME-
DBAP
7
2 Unit 4 agresso IT
CP-
DBAP
CP-
DBAP
CP-
DBAP
CP-
DBAP
CP-
DBAP
CP-
DBAP
7
3 van der Moolen Financial
ME-
DBAP
ME-
DBAP
ME-
DBAP
ME-
DBAP
ME-
DBAP
ME-
DBAP
7
4
van Lanschot
bankiers Financial
CP-
DB
CP-
DB
CP-
DB
CP-
DB
CP-
DB
CP-
DB
7
5 Vastned o/i Financial
CP-
DBFP
CP-
DBFP
CP-
DBFP
CP-
DBAP
CP-
DBAP
CP-
DBAP
Appendix III UK Sample
Research population: Results FTSE listed companies based in the UK with larger than
800 million annual turnover.
Company Industry Turnover Pension scheme Switch year
3i GroupInvestment firms and holding companies 1.522.004.460 Provides DB
Abbey National Banking 3.345.193.280 DBFP to DBAP, 2002
Abbot Group Oil, coal and gasOlie, kolen en gas 1.127.102.029 DB closed 2002
Aegis Group ConsultingAdvies 13.118.055.584 DC
Aggreko ElectricityElektriciteit 1.192.413.088 DB closed 2002
Alliance & Leicester BanksBanken 977.511.679 DB closed before 2000
Alpha Airports RetailDetailhandel 820.946.690 DB closed 2001
AMEC ConsultingAdvies 3.283.229.952 Provides DB
Amlin InsuranceVerzekeraars 1.421.560.938 DB closed before 2000
Anglo American MiningMijnbouw 17.981.200.510 DB closed 2002
Antofagasta MiningMijnbouw 2.304.868.566 Provides DB
Arriva Land transportLandtransport 2.925.143.442 Provides DB
Ashtead Group Machinery and transportation 1.427.116.766 DB closed 2001
Associated British Foods Food producing and processing 10.373.464.800 DB closed 2002
98

AstraZeneca PharmaceuticalsFarmacie 23.559.409.770 DB closed 2000
Avis Europe Transport servicesTransportdiensten 1.326.800.000 Provides DB
Aviva InsuranceVerzekeraars 59.772.000.000 DB closed 2002
AWG WaterWater 2.281.784.352 DB closed 2002Babcock International Group ConsultingAdvies 1.959.936.111 Provides DB
Balfour Beatty ConstructionBouw 10.947.905.280 Provides DB
Barclays BanksBanken 34.142.025.119 Provides DB
Barclays Banks Financial services 34.142.025.119 DBFP to DBAP, 1997
Barratt Developments ConstructionBouw 5.197.184.682 DB closed 2001
BBA Aviation Transport servicesTransportdiensten 1.431.941.564 DB closed 2002
Bellway ConstructionBouw 1.979.661.405 Provides DB
Berkeley Group ConstructionBouw 1.342.770.524 DB closed 2002
BG Group Oil, coal and gasOlie, kolen en gas 12.121.939.460 DB closed 2003
Biffa Environmental servicesMilieu 1.085.871.962 na
Bodycote International ConsultingAdvies 936.449.430 DB closed 2001
Boots Chemie 17.347.341.900 DB closed 2001
Bovis Homes ConstructionBouw 812.469.666 Provides DB
Bradford & Bingley BanksBanken 934.256.340 DB closed 2002
Brit Insurance Holdings InsuranceVerzekeraars 1.700.814.398 DB closed 2001Britisch Telecom Company PLC Telecom 30.270.490.240 DB closed 2001
British Airways Air transportLuchttransport 12.797.411.180 DB closed 2003
British American Tobacco TobaccoTabak 38.355.682.040 DB closed 2005
British Energy Group ElectricityElektriciteit 4.109.850.660 Provides DB
British Land Company Real estateOnroerend goed 812.493.600 Provides DBBritish Sky Broadcasting Group EntertainmentEntertainment 6.237.935.360 DC
Britvic BeveragesDrankenproductie 1.354.598.590 na
BSS Group ConstructionBouw 1.884.595.340 DB closed 2002
BT GroupTelecommunicationTelecommunicatie 30.270.490.240 DB closed 2001
Bunzl WholesaleGroothandel 5.236.952.714 DB closed 2003
Cable & WirelessTelecommunicationTelecommunicatie 4.608.413.120 DB closed 2003
Cadburry Schweppes Food 7.871.731.040 Provides DB
Cadbury Food producing and processing 7.871.731.040 DBFP to DBAP, 2001
Canary Wharf Group Real estateOnroerend goed 878.248.895 DC
Capita ConsultingAdvies 3.075.382.752 Provides DB
Carillion ConstructionBouw 6.557.642.144 DB closed 2002
Carnival Tourism 10.703.589.720 Provides DBCarphone Warehouse Group RetailDetailhandel 6.541.841.264 DB closed before 2000
Cattles InsuranceVerzekeraars 1.202.105.732 DB closed before 2000
Centrica Gas distributionGasdistributie 26.887.869.600 DBFP to DBAP, 2003
Charter Machinery and transportation 2.121.595.265 Provides DB
Christian Salvesen Transport servicesTransportdiensten 1.314.391.940 DB closed 2000
Coats Domestic appliance manufacturing 2.458.015.272 Provides DB
Cobham Aerospace and defence 1.551.391.866 DB closed 2003
Compass Group Food service 16.725.966.399 DB closed 2000
Computacenter IT servicesIT dienstverleners 3.224.950.856 DC
Cookson Group ChemicalsChemie 2.369.999.260 DB closed 2005
Costain Group ConstructionBouw 1.254.641.280 DB closed 2005
Crest Nicholson ConstructionBouw 1.013.429.575 DB closed 2001
Croda International PharmaceuticalsFarmacie 1.295.531.366 Provides DB
Dairy Crest Group Food producing and processing 2.294.995.582 Provides DB
99

Davis Service Group Domestic appliance manufacturing 1.394.659.034 DB closed 2002
Dawson Holdings Transport servicesTransportdiensten 976.503.935 DB closed before 2000
De La Rue Printed mediaGedrukte media 1.008.734.375 Provides DB
Debenhams RetailDetailhandel 2.689.020.752 Provides DB
Diageo Food industry 15.560.704.580 Provides DB
Dimension Data IT servicesIT dienstverleners 3.082.616.482 DC
Dixons Group Electricity 10.765.099.312 DB closed 2002
DMGT Printed mediaGedrukte media 3.379.844.102 Provides DB
Drax Group ElectricityElektriciteit 2.207.967.104 DB closed 2002
DS SmithPackaging and paperVerpakkingen en papier 2.876.603.050 DB closed 2005
eaga ConstructionBouw 934.197.857 na
EasyJet Air transportLuchttransport 3.454.555.368 DC
Electrocomponents RetailDetailhandel 1.352.113.088 DB closed 2003
EMAP EntertainmentEntertainment 1.292.461.040 Provides DB
Enodis Domestic appliance manufacturing 1.176.081.064 Provides DB
FCE Bank BanksBanken 807.057.120 Provides DB
Findel RetailDetailhandel 812.566.661 DB closed 2002
FirstGroup Land transportLandtransport 6.882.793.656 Provides DB
Friends Provident Insurance 6.159.835.200 DB closed 2002
G4SFacility management and outsourcing 7.486.152.271 na
Galiform RetailDetailhandel 1.177.981.742 na
Galliford Try ConstructionBouw 2.678.347.714 DB closed 2001
Game Group, The RetailDetailhandel 1.879.334.227 DC
GKN Metal and metal products 5.512.359.680 Provides DB
GlaxoSmithKline PharmaceuticalsFarmacie 30.675.727.359 DB closed 2001
Go-Ahead Group, The Land transportLandtransport 3.215.216.146 DB closed 2002
gsk Chemie 30675727359 DB closed 2001
Guinness Peat GroupInvestment firms and holding companies 1.928.457.140 na
Halfords Group RetailDetailhandel 1.165.846.644 DC
Hays ConsultingAdvies 3.199.587.200 DB closed 2001
HBOS BanksBanken 12.565.529.000 DB closed 2002
Hiscox InsuranceVerzekeraars 1.360.394.195 DB closed 2001
HMV Group RetailDetailhandel 2.741.216.294 DB closed 2002
Home Retail Group RetailDetailhandel 8.750.136.688 na
Homeserve Environmental servicesMilieu 811.260.542 Provides DB
HSBC Holdings BanksBanken 64.729.458.220 DB closed before 2000
Hunting Oil, coal and gasOlie, kolen en gas 2.850.285.970 DB closed 2002
ICAPInvestment firms and holding companies 1.907.111.064 DC
ICI Chemie 7.108.826.250 DB closed 2001
IMI Machinery and transportation 2.779.376.060 DB closed 2005
Imperial Tobacco TobaccoTabak 30.013.167.680 Provides DB
Inchcape RetailDetailhandel 7.885.344.863 Provides DB
Informa Printed mediaGedrukte media 1.868.502.445 DB closed 2004
International Power ElectricityElektriciteit 4.386.205.760 Provides DB
Interserve Real estateOnroerend goed 2.631.708.000 DB closed 2002
Intertek ConsultingAdvies 1.467.177.210 DB closed 2002
Invensys Electrical and electronic equipment 3.082.022.480 Provides DB
ITV EntertainmentEntertainment 2.966.519.740 na
JJB Sports RetailDetailhandel 1.186.833.053 Provides DB
John Lewis Partnership RetailDetailhandel 9.887.619.368 Provides DB
John Menzies Transport servicesTransportdiensten 2.253.180.666 DB closed 2004
100

Johnson Matthey ChemicalsChemie 10.963.549.322 Provides DB
Kazakhmys MiningMijnbouw 3.764.453.820 na
Kelda WaterWater 1.285.004.534 Provides DB
Keller Group ConstructionBouw 1.749.500.996 DB closed before 2000
Kesa Electricals RetailDetailhandel 7.831.670.596 na
Kier Group ConstructionBouw 3.410.108.744 na
Ladbrokes EntertainmentEntertainment 1.713.680.526 Provides DB
Laird Electrical and electronic equipment 825.040.458 Provides DB
Land SecuritiesInvestment firms and holding companies 2.282.568.072 DB closed before 2000
Legal & General InsuranceVerzekeraars 6.710.315.360 DB closed before 2000
Lloyd's InsuranceVerzekeraars 20.964.478.340 Provides DB
Lloyds Banking Group BanksBanken 12.918.018.400 DB closed
Lloyds TSB Banking and insurance 20.692.535.180 DB closed before 2000 2001
Logica IT servicesIT dienstverleners 5.245.871.280 Provides DB
Lonmin MiningMijnbouw 1.524.687.710 Provides DB
Man GroupInvestment firms and holding companies 4.636.192.260 DB closed before 2000
Marks & Spencer RetailDetailhandel 11.364.832.960 DB closed 2002
Marks and Spencer Retail sector 11.364.832.960 DB closed 2002
Marston's BeveragesDrankenproductie 973.878.166 na
McBride Personal care and cleaning 1.024.757.854 DB closed 2001
MecomInvestment firms and holding companies 1.774.007.343 na
Meggitt Electrical and electronic equipment 1.700.083.368 Provides DB
MelroseMachinery and transportation tool manuf 1.181.957.744 DB closed 2003
Michael Page International Personnel servicesPersoneel 1.422.265.650 DC
Millenium HotelsTravel and recreationReizen en recreatie 1.027.681.974 DB closed 2002
Mitchells & ButlersTravel and recreationReizen en recreatie 2.789.610.480 DB closed 2002
MITIE GroupFacility management and outsourcing 2.057.410.831 Provides DB
Morgan Crucible ChemicalsChemie 1.220.820.100 Provides DB
Morgan Sindall ConstructionBouw 3.725.475.086 DB closed before 2000
Mothercare RetailDetailhandel 989.522.208 DBFP to DBAP, 2004
Mouchel ConsultingAdvies 960.197.670 DB closed 2002
National Express Group Land transportLandtransport 4.045.520.020 DB closed 2002
National Grid Gas Gas distributionGasdistributie 3.567.426.400 na
Northern Foods Food producing and processing 1.173.769.824 Provides DB
NorthgateTravel and recreationReizen en recreatie 845.746.151 DC
Northumbrian Water Group WaterWater 980.165.024 na
Old Mutual InsuranceVerzekeraars 6.494.910.080 Provides DB
Payzone BanksBanken 1.080.849.000 na
Pearson Printed mediaGedrukte media 7.033.970.660 DB closed 2003
Pendragon RetailDetailhandel 7.424.578.450 DB closed 2000
Pennon Group WaterWater 1.279.302.500 Provides DB
Persimmon ConstructionBouw 4.423.612.025 DB closed 2002
Petrofac Oil, coal and gasOlie, kolen en gas 1.783.384.235 DC
Premier Farnell WholesaleGroothandel 1.088.796.082 DB closed before 2000
Premier Foods Food producing and processing 3.279.702.848 Provides DB
Premier Oil Oil, coal and gasOlie, kolen en gas 825.342.336 DB closed before 2000
Provident FinancialSpeciality financeSpeciale financiering 1.098.299.472 DB closed 2003
Prudential InsuranceVerzekeraars 23.925.102.240 Provides DB
Punch TavernsTravel and recreationReizen en recreatie 2.281.690.836 DB closed 2005
101

PZ Cussons Personal care and cleaning 847.923.775 Provides DB
QinetiQ Aerospace and defence 1.997.173.960 na
Reckitt Benckiser Personal care and cleaning 8.267.279.839 Provides DB
Redrow ConstructionBouw 950.485.206 DB closed 2001
Regus Group Personnel servicesPersoneel 1.356.927.296 na
Rentokil InitialFacility management and outsourcing 3.035.702.832 DB closed 2002
RexamPackaging and paperVerpakkingen en papier 5.817.202.240 Provides DB
Rio Tinto MiningMijnbouw 42.435.063.300 DB closed 2005
Robert Wiseman Dairies Food producing and processing 1.055.582.464 na
Rolls-Royce Aerospace and defence 11.440.413.760 Provides DB
Royal Bank of Scotland BanksBanken 32.585.402.239 Provides DB
RPC Group Packaging and paper 1.016.424.112 Provides DB
RSA Group InsuranceVerzekeraars 8.534.044.219 DB closed 2002
SABMiller BeveragesDrankenproductie 15.646.856.200 Provides DB
SageSoftware and internetSoftware en internet 1.893.367.700 DC
Sainsbury RetailDetailhandel 22.468.912.160 DB closed 2002
SchrodersInvestment firms and holding companies 1.368.195.748 Provides DB
Serco ConsultingAdvies 3.934.610.479 Provides DB
Severn Trent WaterWater 2.269.701.944 DB closed 2005
Shire PharmaceuticalsFarmacie 1.780.496.766 DC
Sibir Energy Oil, coal and gasOlie, kolen en gas 2.583.229.014 DC
SIG WholesaleGroothandel 3.589.649.712 DB closed 2001
Signet Group RetailDetailhandel 4.617.105.104 DB closed 2004
Smith & Nephew Health and welfareZorginstellingen 2.462.132.580 DB closed 2002
Smiths Group Aerospace and defence 3.159.365.454 DBFP to DBAP, 2004Southern Cross Heathcare Group Health and welfareZorginstellingen 1.300.356.164 na
Spectris Electrical and electronic equipment 991.494.127 Blijft DB
Sportingbet EntertainmentEntertainment 1.994.542.252 DC
Sports Direct International Domestic appliance manufacturing 1.586.579.556 na
St. James's Place ConsultingAdvies 2.231.542.178 DB closed before 2000
Stagecoach Land transportLandtransport 2.578.489.016 Blijft DB
Standard Chartered BanksBanken 6.523.299.320 DB closed before 2000
Standard Life InsuranceVerzekeraars 5.330.670.760 DB closed 2004
Tate & Lyle Food producing and processing 5.006.093.440 DB closed 2002
Taylor Wimpey ConstructionBouw 4.368.192.336 na
TDG Transport servicesTransportdiensten 978.849.170 DB closed 2003
Tesco RetailDetailhandel 69.152.513.880 DBFP to DBAP, 2005
Thomas Cook GroupTravel and recreationReizen en recreatie 11.940.790.226 DC
Tomkins Machinery and transportation 4.301.234.314 DB closed 2002
Trinity Mirror Printed mediaGedrukte media 1.420.098.878 Provides DB
TUI TravelTravel and recreationReizen en recreatie 20.369.127.508 DB closed 2004
Tullow Oil Oil, coal and gasOlie, kolen en gas 934.553.138 DC
Uniq Food producing and processing 1.004.216.895 DB closed 2002
United Business MediaSoftware and internetSoftware en internet 1.117.336.160 DB closed before 2000
United Utilities WaterWater 3.454.701.574 Provides DB
Vedanta Resources MiningMijnbouw 5.606.490.617 na
Vodafone GroupTelecommunicationTelecommunicatie 51.870.964.680 Provides DB
VT GroupMachinery and transportation tool manuf 1.491.301.200 Provides DB
Wagon Automobile production 1.038.062.599 DB closed 2002
102

Weir Group ConsultingAdvies 1.705.102.847 DB closed 2001
Wetherspoon J D BeveragesDrankenproductie 1.326.819.450 DC
WH Smith RetailDetailhandel 1.976.705.120 DB closed before 2000
WhitbreadTravel and recreationReizen en recreatie 1.778.888.402 DB closed 2002
William Hill EntertainmentEntertainment 1.408.987.222 DB closed before 2000
Wincanton Transport servicesTransportdiensten 3.164.921.282 DB closed 2003
Wolseley ConstructionBouw 24.195.630.940 Provides DB
Wood Group (John) Oil, coal and gasOlie, kolen en gas 3.239.505.814 DB closed 2003
Woolworths Group WholesaleGroothandel 4.341.733.376 Provides DB
WPP Group ConsultingAdvies 46.518.722.720 DB closed before 2000
WS Atkins ConsultingAdvies 2.046.152.970 DB closed 2001
WSP Group ConsultingAdvies 951.310.335 DB closed 2002
Yell ConsultingAdvies 3.243.872.522 DB closed 2001
Yule Catto ChemicalsChemie 848.931.980 DB closed before 2000
103
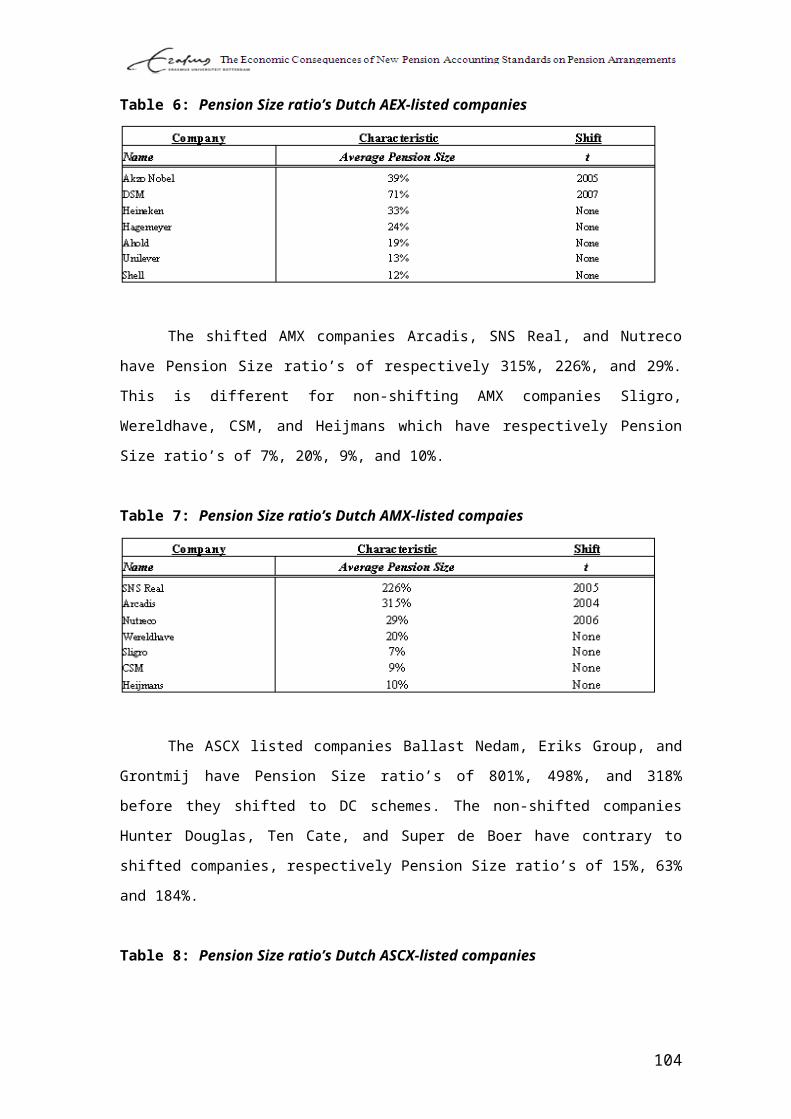
Appendix IV Ratio’s Dutch Sample
104

105

Appendix V Statistics Funding Ratio
Test of Homogeneity of Variances
Levene Statistic df1 df2 Sig.
FundingRatio 1.847 2 117 .162
PensionSize 1.013 2 117 .366
CashFlowRatio .213 2 117 .809
Test of Homogeneity of Variances
FundRatioVol
Levene Statistic df1 df2 Sig.
3.513 2 60 .036
ANOVA
Sum of Squares df Mean Square F Sig.
FundingRatio Between Groups 1543.090 2 771.545 4.164 .018
Within Groups 21676.377 117 185.268
Total 23219.467 119
Multiple Comparisons
Scheffe
Dependent
Variable
(I)
PensionSche
me
(J)
PensionSche
me
Mean
Difference (I-
J) Std. Error Sig.
95% Confidence Interval
Lower
Bound
Upper
Bound
FundingRatio Provide DB Shifted to DC 7.43711* 2.58194 .018 1.0354 13.8388
Shifted to
DBAP5.51064 6.40277 .691 -10.3645 21.3858
Shifted to DC Provide DB -7.43711* 2.58194 .018 -13.8388 -1.0354
Shifted to
DBAP-1.92647 6.30699 .954 -17.5642 13.7112
Shifted to
DBAP
Provide DB -5.51064 6.40277 .691 -21.3858 10.3645
Shifted to DC 1.92647 6.30699 .954 -13.7112 17.5642
106
Appendix VI Statistics Funding Ratio Volatility
Ranks
PensionSchem
e N Mean Rank
FundRatioVol Provides DB 46 32.04
Shifted to DC 15 27.80
Total 61
Descriptive Statistics
N Mean Std. Deviation Minimum Maximum
FundRatioVol 63 10.9524 8.07910 1.00 39.00
PensionScheme 63 1.3016 .52777 1.00 3.00
Test Statisticsa,b
FundRatioVol
Chi-Square .653
df 1
Asymp. Sig. .419
a. Kruskal Wallis Test
b. Grouping Variable:
PensionScheme
107

Appendix VII Statistics Pension Size and Cash Flow Ratio
Descriptive Statistics
N Mean Std. Deviation Minimum Maximum
CashFlowRatio 120 30.7833 48.98451 .00 422.00
PensionSize 120 117.9833 183.54511 1.00 1418.00
PensionScheme 120 1.5667 .49761 1.00 2.00
Ranks
PensionSchem
e N Mean Rank
CashFlowRatio Provide DB 52 64.67
Shifted to DC 68 57.31
Total 120
PensionSize Provide DB 52 64.57
Shifted to DC 68 57.39
Total 120
Test Statisticsa,b
CashFlowRatio PensionSize
Chi-Square 1.322 1.255
df 1 1
Asymp. Sig. .250 .263
a. Kruskal Wallis Test
b. Grouping Variable: PensionScheme
108

Appendix VIII Descriptive Statistics
Funding RatioDescriptives
N Mean
Std.
Deviation
Std.
Error
95% Confidence
Interval for Mean
Minimu
m
Maximu
m
Lower
Bound
Upper
Bound
FundingRati
o
Provide DB 47 81.5106 11.92344 1.73921 78.0098 85.0115 54.00 108.00
Shifted to
DC68 74.0735 14.94000 1.81174 70.4573 77.6898 18.00 113.00
Shifted to
DBAP5 76.0000 6.74537 3.01662 67.6245 84.3755 68.00 84.00
Total 120 77.0667 13.96859 1.27515 74.5417 79.5916 18.00 113.00
109
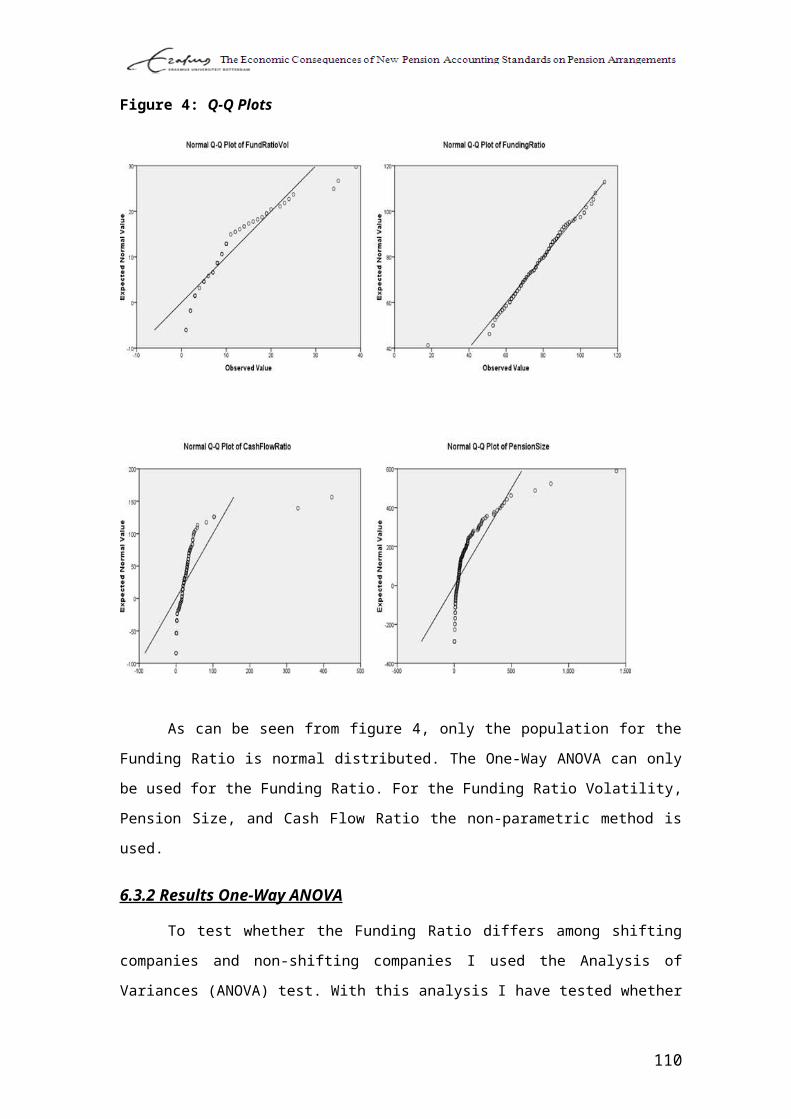
Appendix IX Comparison Dutch and UK sample: Mann-Whithney U test
1 en 4Ranks
PensionPlan N Mean Rank Sum of RanksFundingRatio Provides DB uk 47 24.12 1133.50
Shifted Dutch companies 8 50.81 406.50Total 55
PensionSize Provides DB uk 47 26.23 1233.00Shifted Dutch companies 8 38.38 307.00Total 55
CashFlow Provides DB uk 47 29.74 1398.00Shifted Dutch companies 8 17.75 142.00Total 55
Test Statistics(b)
FundingRatio PensionSize CashFlowMann-Whitney U 5.500 105.000 106.000Wilcoxon W 1133.500 1233.000 142.000Z -4.360 -1.982 -1.959Asymp. Sig. (2-tailed) .000 .048 .050Exact Sig. [2*(1-tailed Sig.)] .000(a) .048(a) .050(a)
a Not corrected for ties.b Grouping Variable: PensionPlan
2 en 4Ranks
PensionPlan N Mean Rank Sum of RanksFundingRatio Shifted to DC uk 74 37.58 2781.00
Shifted Dutch companies 8 77.75 622.00Total 82
PensionSize Shifted to DC uk 74 39.68 2936.00Shifted Dutch companies 8 58.38 467.00Total 82
CashFlow Shifted to DC uk 74 43.05 3185.50Shifted Dutch companies 8 27.19 217.50Total 82
Test Statistics(a)
FundingRatio PensionSize CashFlowMann-Whitney U 6.000 161.000 181.500Wilcoxon W 2781.000 2936.000 217.500Z -4.534 -2.110 -1.791Asymp. Sig. (2-tailed) .000 .035 .073
a Grouping Variable: PensionPlan
110
2 en 3Ranks
PensionPlan N Mean Rank Sum of RanksFundingRatio Shifted to DC uk 74 37.64 2785.50
Non-shifted Dutch companies 12 79.63 955.50
Total 86PensionSize Shifted to DC uk 74 46.42 3435.00
Non-shifted Dutch companies 12 25.50 306.00
Total 86CashFlow Shifted to DC uk 74 46.76 3460.00
Non-shifted Dutch companies 12 23.42 281.00
Total 86
Test Statistics(a)
FundingRatio PensionSize CashFlowMann-Whitney U 10.500 228.000 203.000Wilcoxon W 2785.500 306.000 281.000Z -5.405 -2.692 -3.006Asymp. Sig. (2-tailed) .000 .007 .003
a Grouping Variable: PensionPlan
1 en 3Ranks
PensionPlan N Mean Rank Sum of RanksFundingRatio Provides DB uk 47 24.22 1138.50
Non-shifted Dutch companies 12 52.63 631.50
Total 59PensionSize Provides DB uk 47 33.23 1562.00
Non-shifted Dutch companies 12 17.33 208.00
Total 59CashFlow Provides DB uk 47 33.22 1561.50
Non-shifted Dutch companies 12 17.38 208.50
Total 59
Test Statistics(a)
FundingRatio PensionSize CashFlowMann-Whitney U 10.500 130.000 130.500Wilcoxon W 1138.500 208.000 208.500Z -5.116 -2.863 -2.855Asymp. Sig. (2-tailed) .000 .004 .004
a Grouping Variable: PensionPlan
111