1 inventory management chapter 12 © prentice hall 2007
Post on 21-Dec-2015
220 views
TRANSCRIPT

1
Inventory ManagementInventory Management
Chapter 12Chapter 12
© Prentice Hall 2007© Prentice Hall 2007

2
General ConsiderationsGeneral Considerations
Marketing-prefer large quantities of Marketing-prefer large quantities of inventoryinventory
Accounting/Finance-tied up capitalAccounting/Finance-tied up capital Operations-tool that can be used to Operations-tool that can be used to
promote efficient operation of the promote efficient operation of the production facilitiesproduction facilities
Inventories are simply allowed to Inventories are simply allowed to fluctuate so that production can be fluctuate so that production can be adjusted to its most efficient level.adjusted to its most efficient level.
3
Types of InventoryTypes of Inventory
Pipeline Inventories: exist because Pipeline Inventories: exist because materials must be moved from one materials must be moved from one location to another.location to another.
Buffer Inventories (safety stocks): Buffer Inventories (safety stocks): provide protection against irregularities provide protection against irregularities or uncertainties in an item’s demand or or uncertainties in an item’s demand or supply. supply.
Anticipation Inventories: needed for Anticipation Inventories: needed for products with seasonal patterns of products with seasonal patterns of demand and uniform supply. demand and uniform supply.

4
Types of InventoryTypes of Inventory
Cycle Inventories (Lot-size Cycle Inventories (Lot-size inventories): exists whenever orders inventories): exists whenever orders are made in larger quantities than are made in larger quantities than needed to satisfy immediate needed to satisfy immediate requirements. Results from ordering requirements. Results from ordering in batches or “lots” rather than as in batches or “lots” rather than as needed.needed.

5
Forms of InventoriesForms of Inventories
Raw MaterialsRaw Materials: objects, commodities, : objects, commodities, elements, and items that are received elements, and items that are received (usually purchased) from outside the (usually purchased) from outside the organization to be used directly in organization to be used directly in the production of the final output. the production of the final output.
Maintenance, repair, and operating Maintenance, repair, and operating supplies:supplies: used to support and used to support and maintain the operation, including maintain the operation, including spares, supplies, and stores. spares, supplies, and stores.

6
Forms of InventoriesForms of Inventories
Work-In-Process (WIP):Work-In-Process (WIP): all the all the materials, parts, and assemblies that materials, parts, and assemblies that are being worked on or are waiting are being worked on or are waiting to be processed within the to be processed within the operations system. operations system.
Finished GoodsFinished Goods: stock of completed : stock of completed products. products.
7
Placement of InventoriesPlacement of Inventories
Standard: An item is made to stock Standard: An item is made to stock or ordered to stock and normally the or ordered to stock and normally the item is available upon request.item is available upon request.
Special: An item made to order.Special: An item made to order.
8
Inventory-Related Costs Inventory-Related Costs Ordering or Setup CostsOrdering or Setup Costs: ordering costs are associated : ordering costs are associated
with outside procurement of material and setup costs are with outside procurement of material and setup costs are costs associated with internal procurement (i.e. internal costs associated with internal procurement (i.e. internal manufacture) of parts of material. manufacture) of parts of material.
ExEx: writing the order, processing the order through the : writing the order, processing the order through the purchasing system, postage, processing invoices, purchasing system, postage, processing invoices, handling, testing, inspection, transportation, setup labor, handling, testing, inspection, transportation, setup labor, machine downtime due to a new setup, parts damaged machine downtime due to a new setup, parts damaged during setup.during setup.
Inventory Carrying or Holding Costs: Inventory Carrying or Holding Costs: cost items related to cost items related to inventory quantity, items’ value, and length of the time inventory quantity, items’ value, and length of the time the inventory is carried. the inventory is carried.
ExEx: interest on money invested in inventory and in the land, : interest on money invested in inventory and in the land, buildings, and equipment necessary to hold and maintain buildings, and equipment necessary to hold and maintain the inventory; heat, power, and light, salaries of security the inventory; heat, power, and light, salaries of security personnel, taxes and insurance on equipment; insurance personnel, taxes and insurance on equipment; insurance on inventory, physical deterioration of the inventory.on inventory, physical deterioration of the inventory.

9
Inventory-Related CostsInventory-Related Costs
Stockout Costs: Stockout Costs: if inventory is if inventory is unavailable when customers request it, unavailable when customers request it, a situation that marketing detests, or a situation that marketing detests, or when it is needed for production, a when it is needed for production, a stockout occurs. stockout occurs.
Ex: lost goodwill, lost sales, cost Ex: lost goodwill, lost sales, cost associated with processing back orders associated with processing back orders (such as extra paperwork, special (such as extra paperwork, special handling, and higher shipping costs)handling, and higher shipping costs)
10
Determining inventory Determining inventory system performancesystem performance
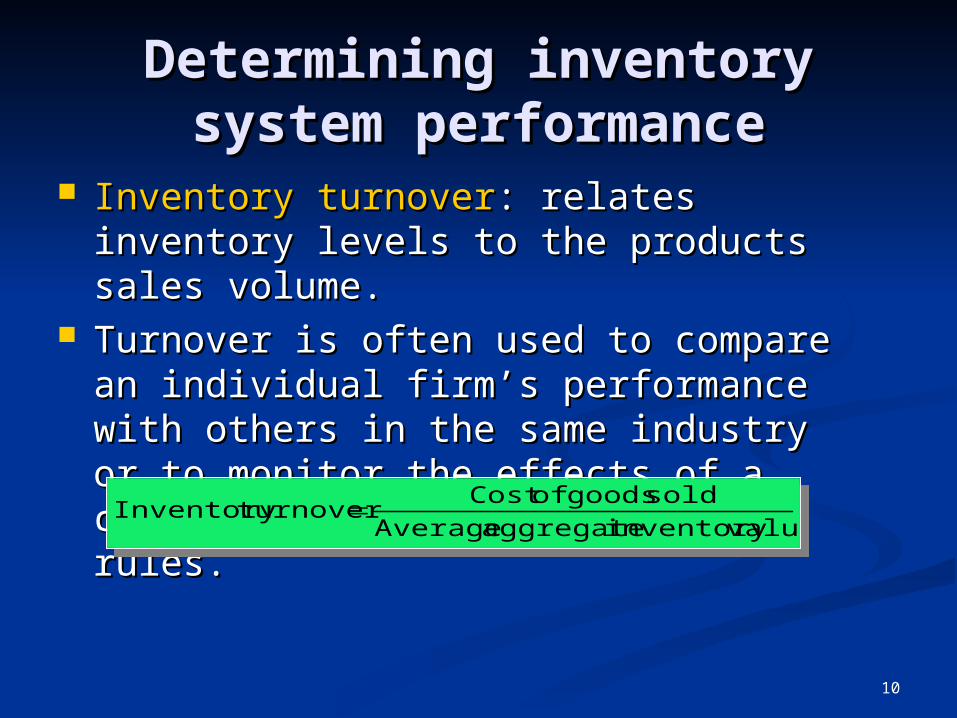
Inventory turnoverInventory turnover: relates inventory : relates inventory levels to the products sales volume.levels to the products sales volume.
Turnover is often used to compare an Turnover is often used to compare an individual firm’s performance with individual firm’s performance with others in the same industry or to others in the same industry or to monitor the effects of a change in monitor the effects of a change in inventory decision rules.inventory decision rules.
valueinventory aggregate Average
sold goods ofCost turnoverInventory valueinventory aggregate Average
sold goods ofCost turnoverInventory

11
Example of measuring Example of measuring inventory system performanceinventory system performance
Suppose a company’s new annual Suppose a company’s new annual report claims their costs of goods report claims their costs of goods sold for the year is $160 million and sold for the year is $160 million and their total average inventory their total average inventory (production materials + work-in-(production materials + work-in-process) is worth $35 million. This process) is worth $35 million. This company normally has an inventory company normally has an inventory turn ratio of 10. What is this year’s turn ratio of 10. What is this year’s Inventory Turnover ratio? What Inventory Turnover ratio? What does it mean?does it mean?
Suppose a company’s new annual Suppose a company’s new annual report claims their costs of goods report claims their costs of goods sold for the year is $160 million and sold for the year is $160 million and their total average inventory their total average inventory (production materials + work-in-(production materials + work-in-process) is worth $35 million. This process) is worth $35 million. This company normally has an inventory company normally has an inventory turn ratio of 10. What is this year’s turn ratio of 10. What is this year’s Inventory Turnover ratio? What Inventory Turnover ratio? What does it mean?does it mean?

Example of measuring inventory Example of measuring inventory system performancesystem performance (Continued)(Continued)
= $160/$35= $160/$35 = 4.57= 4.57Since the company’s normal inventory turnover Since the company’s normal inventory turnover
ratio is 10, a drop to 4.57 means that the ratio is 10, a drop to 4.57 means that the inventory is not turning over as quickly as it inventory is not turning over as quickly as it had in the past. Without knowing the industry had in the past. Without knowing the industry average of turns for this company it is not average of turns for this company it is not possible to comment on how they are possible to comment on how they are competitively doing in the industry, but they competitively doing in the industry, but they now have more inventory relative to their cost now have more inventory relative to their cost of goods sold than before.of goods sold than before.
valueinventory aggregate Average
sold goods ofCost turnoverInventory
valueinventory aggregate Average
sold goods ofCost turnoverInventory
13
Determining inventory Determining inventory system performancesystem performance
Fill rateFill rate: to capture the benefits of : to capture the benefits of having inventory, some companies having inventory, some companies use customer service to asses their use customer service to asses their inventory system performance. inventory system performance.
The percentage of units immediately The percentage of units immediately available when requested by available when requested by customers. customers.

14
Priorities for Inventory Priorities for Inventory Management: The ABC Management: The ABC
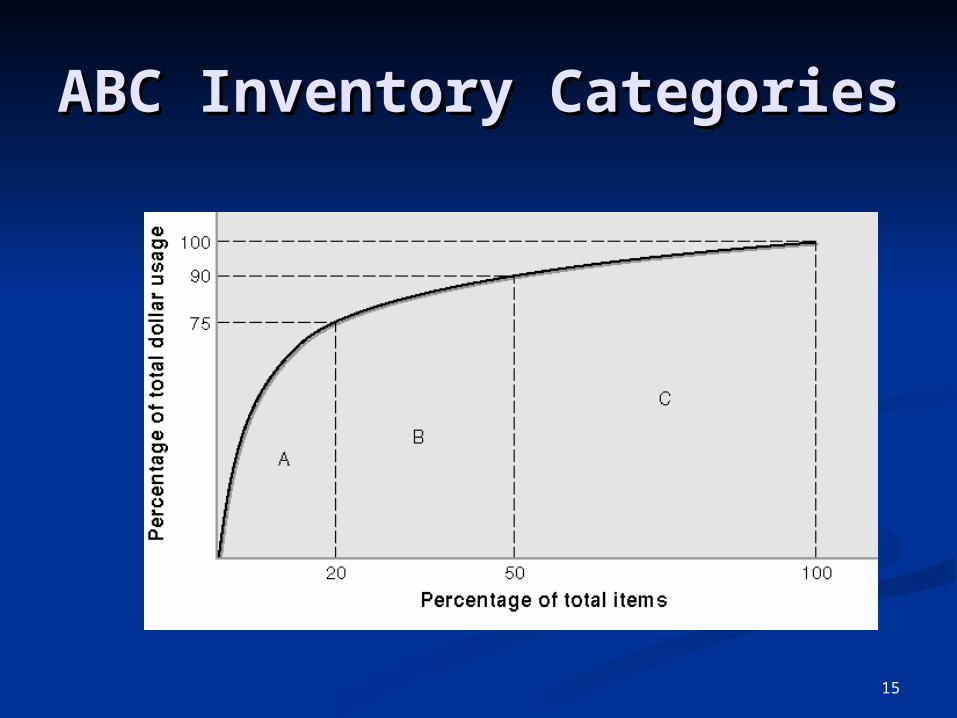
AnalysisAnalysis Classifying inventory according to some measure of Classifying inventory according to some measure of importance and allocating control efforts accordingly.importance and allocating control efforts accordingly.
A itemsA items 15-20% of items that account for 75-80% of annual 15-20% of items that account for 75-80% of annual
inventory value, should be subject to the tightest inventory value, should be subject to the tightest control.control.
B itemsB items 30-40% of items that account for 15% of annual 30-40% of items that account for 15% of annual
inventory valueinventory value C itemsC items
40-50% of items that account for 10-15% of annual 40-50% of items that account for 10-15% of annual inventory valueinventory value
15
ABC Inventory ABC Inventory CategoriesCategories
16
The Economic The Economic Order Quantity Order Quantity
(EOQ)(EOQ)

17
Economic Order Economic Order QuantityQuantity
1.1. Demand rate is constantDemand rate is constant2.2. No constraints on lot sizeNo constraints on lot size3.3. Only relevant costs are holding and Only relevant costs are holding and
ordering/setupordering/setup4.4. Decisions for items are independent Decisions for items are independent
from other itemsfrom other items5.5. No uncertainty in lead time or supplyNo uncertainty in lead time or supply
AssumptionsAssumptions
18
When to use EOQWhen to use EOQ
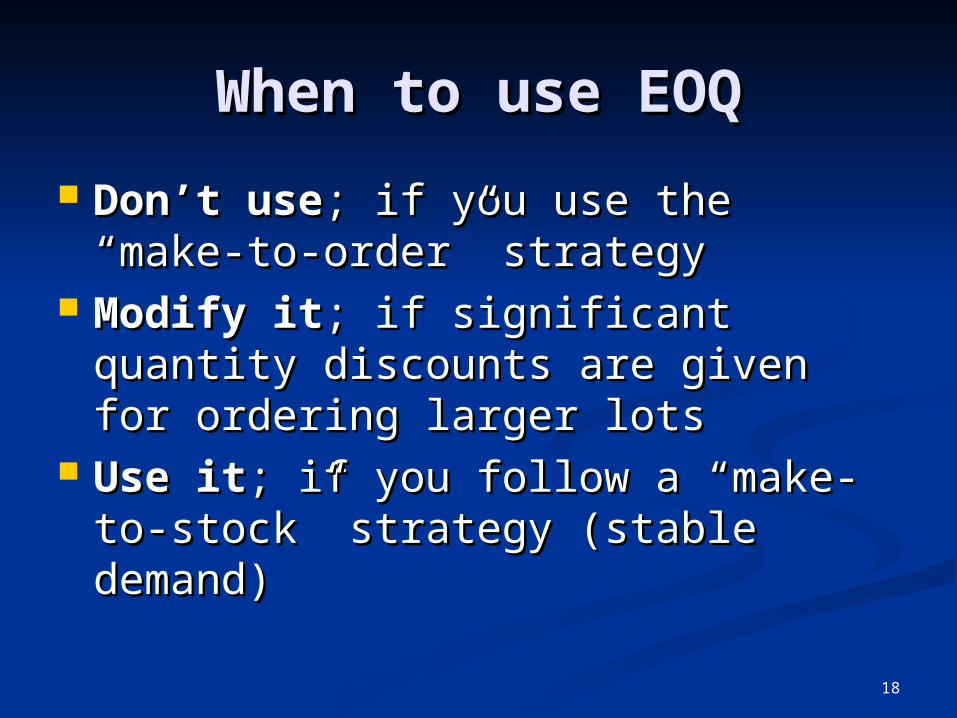
Don’t useDon’t use; if you use the “make-to-; if you use the “make-to-order” strategyorder” strategy
Modify itModify it; if significant quantity ; if significant quantity discounts are given for ordering discounts are given for ordering larger lotslarger lots
Use itUse it; if you follow a “make-to-; if you follow a “make-to-stock” strategy (stable demand)stock” strategy (stable demand)
19
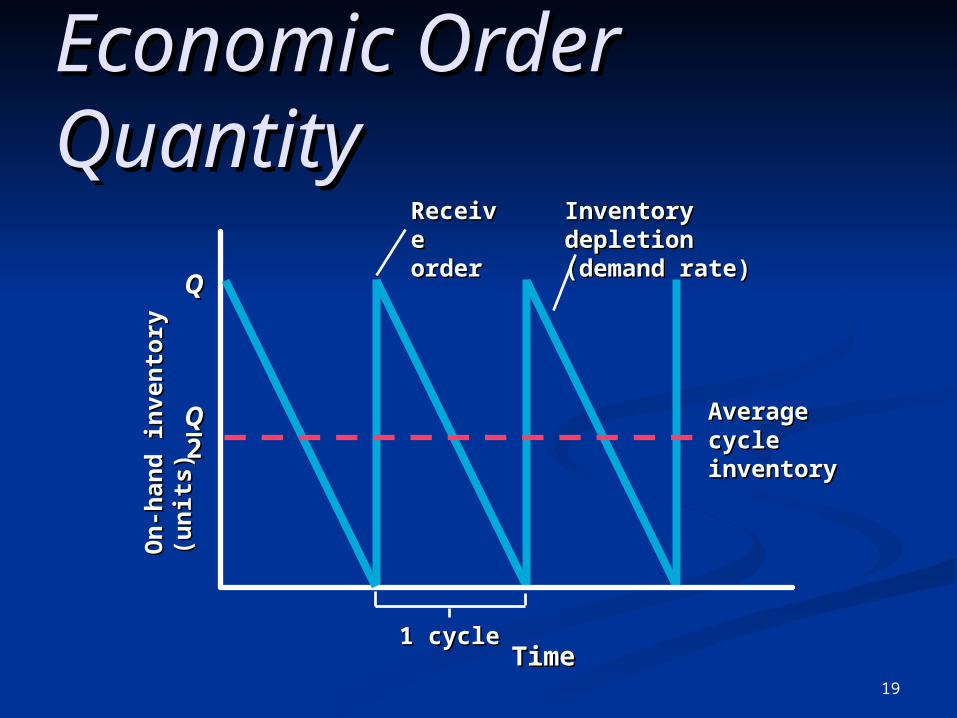
Economic Order Economic Order QuantityQuantity
Inventory depletion Inventory depletion (demand rate)(demand rate)
Receive Receive orderorder
1 cycle1 cycle
On
-han
d i
nve
nto
ry (
un
its)
On
-han
d i
nve
nto
ry (
un
its)
TimeTime
AverageAveragecyclecycleinventoryinventory
QQ——22

20
Economic Order Economic Order QuantityQuantity
An
nu
al c
os
t (d
olla
rs)
An
nu
al c
os
t (d
olla
rs)
Lot Size (Lot Size (QQ))
Holding cost (Holding cost (HCHC))
Ordering cost (Ordering cost (OCOC))
Total cost = Total cost = HCHC + + OCOC

21
3000 3000 —
2000 2000 —
1000 1000 —
0 0 —| | | | | | | |
5050 100100 150150 200200 250250 300300 350350 400400
Lot Size (Lot Size (QQ))
An
nu
al c
ost
(d
oll
ars)
An
nu
al c
ost
(d
oll
ars) Total cost = (Total cost = (HH) + () + (SS))
DDQQ
QQ22
Holding cost = (Holding cost = (HH))QQ22
Ordering cost = (Ordering cost = (SS))DDQQ
Economic Order Economic Order QuantityQuantity

22
Basic Economic-Order Quantity Basic Economic-Order Quantity (EOQ) Model Formula(EOQ) Model Formula
Annualcarryingcost
Annualorderingcost
Total cost = +
Q2
H DQ
STC = +
TC=Total annual costD =DemandC =Cost per unitQ =Order quantityS =Cost of placing an order or setup costR =Reorder pointL =Lead timeH=Annual holding and storage cost per unit of inventory
TC=Total annual costD =DemandC =Cost per unitQ =Order quantityS =Cost of placing an order or setup costR =Reorder pointL =Lead timeH=Annual holding and storage cost per unit of inventory

23
Total cost = (Total cost = (HH) + () + (SS))DDQQ
QQ22
Holding cost = (Holding cost = (HH))QQ22
Ordering cost = (Ordering cost = (SS))DDQQ
3000 3000 —
2000 2000 —
1000 1000 —
0 0 —| | | | | | | |
5050 100100 150150 200200 250250 300300 350350 400400
Lot Size (Lot Size (QQ))
An
nu
al c
ost
(d
oll
ars)
An
nu
al c
ost
(d
oll
ars)
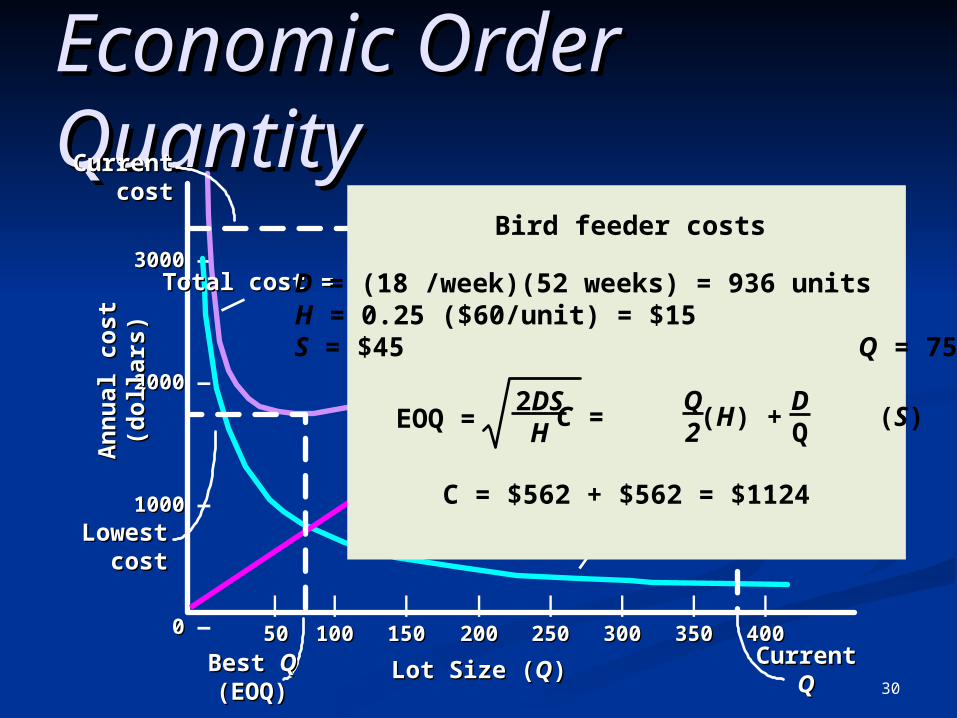
Economic Order Economic Order QuantityQuantity
Bird feeder costs
C = (H) + (S)Q2
DQ
D = (18 /week)(52 weeks) = 936 unitsH = 0.25 ($60/unit) = $15S = $45 Q = 390 units
C = $2925 + $108 = $3033

24
3000 3000 —
2000 2000 —
1000 1000 —
0 0 —| | | | | | | |
5050 100100 150150 200200 250250 300300 350350 400400
Lot Size (Lot Size (QQ))
An
nu
al c
ost
(d
oll
ars)
An
nu
al c
ost
(d
oll
ars) Total cost = (Total cost = (HH) + () + (SS))
DDQQ
QQ22
Holding cost = (Holding cost = (HH))QQ22
Ordering cost = (Ordering cost = (SS))DDQQ
Bird feeder costs
C = (H) + (S)Q2
DQ
D = (18 /week)(52 weeks) = 936 unitsH = 0.25 ($60/unit) = $15S = $45 Q = 390 units
C = $2925 + $108 = $3033
CurrentCurrentcostcost
CurrentCurrentQQ
Economic Order Economic Order QuantityQuantity

25
3000 3000 —
2000 2000 —
1000 1000 —
0 0 —| | | | | | | |
5050 100100 150150 200200 250250 300300 350350 400400
Lot Size (Lot Size (QQ))
An
nu
al c
ost
(d
oll
ars)
An
nu
al c
ost
(d
oll
ars) Total cost = (Total cost = (HH) + () + (SS))
DDQQ
QQ22
Holding cost = (Holding cost = (HH))QQ22
Ordering cost = (Ordering cost = (SS))DDQQ
Bird feeder costs
C = (H) + (S)Q2
DQ
D = (18 /week)(52 weeks) = 936 unitsH = 0.25 ($60/unit) = $15S = $45 Q = 468468 units
CurrentCurrentcostcost
CurrentCurrentQQ
Economic Order Economic Order QuantityQuantity
C = $3510 + $90 = $3600
26
3000 3000 —
2000 2000 —
1000 1000 —
0 0 —| | | | | | | |
5050 100100 150150 200200 250250 300300 350350 400400
Lot Size (Lot Size (QQ))
An
nu
al c
ost
(d
oll
ars)
An
nu
al c
ost
(d
oll
ars) Total cost = (Total cost = (HH) + () + (SS))
DDQQ
QQ22
Holding cost = (Holding cost = (HH))QQ22
Ordering cost = (Ordering cost = (SS))DDQQ
CurrentCurrentcostcost
CurrentCurrentQQ
Economic Order Economic Order QuantityQuantity
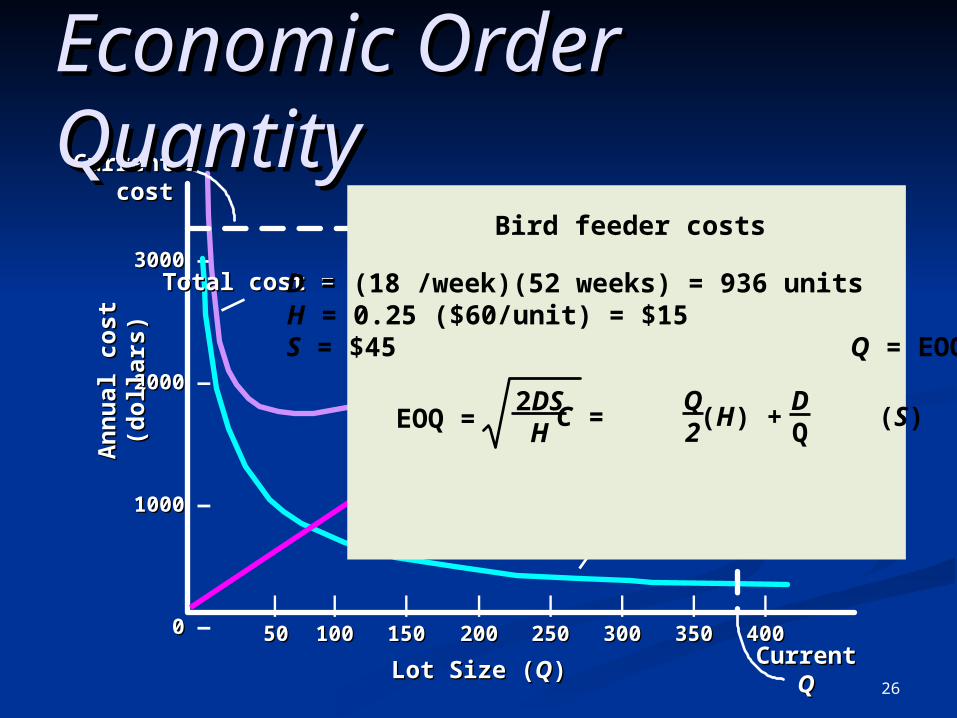
Bird feeder costs
D = (18 /week)(52 weeks) = 936 unitsH = 0.25 ($60/unit) = $15S = $45 Q = EOQ
C = (H) + (S)Q2
DQEOQ =
2DSH

27
3000 3000 —
2000 2000 —
1000 1000 —
0 0 —| | | | | | | |
5050 100100 150150 200200 250250 300300 350350 400400
Lot Size (Lot Size (QQ))
An
nu
al c
ost
(d
oll
ars)
An
nu
al c
ost
(d
oll
ars) Total cost = (Total cost = (HH) + () + (SS))
DDQQ
QQ22
Holding cost = (Holding cost = (HH))QQ22
Ordering cost = (Ordering cost = (SS))DDQQ
CurrentCurrentcostcost
CurrentCurrentQQ
Economic Order Economic Order QuantityQuantity
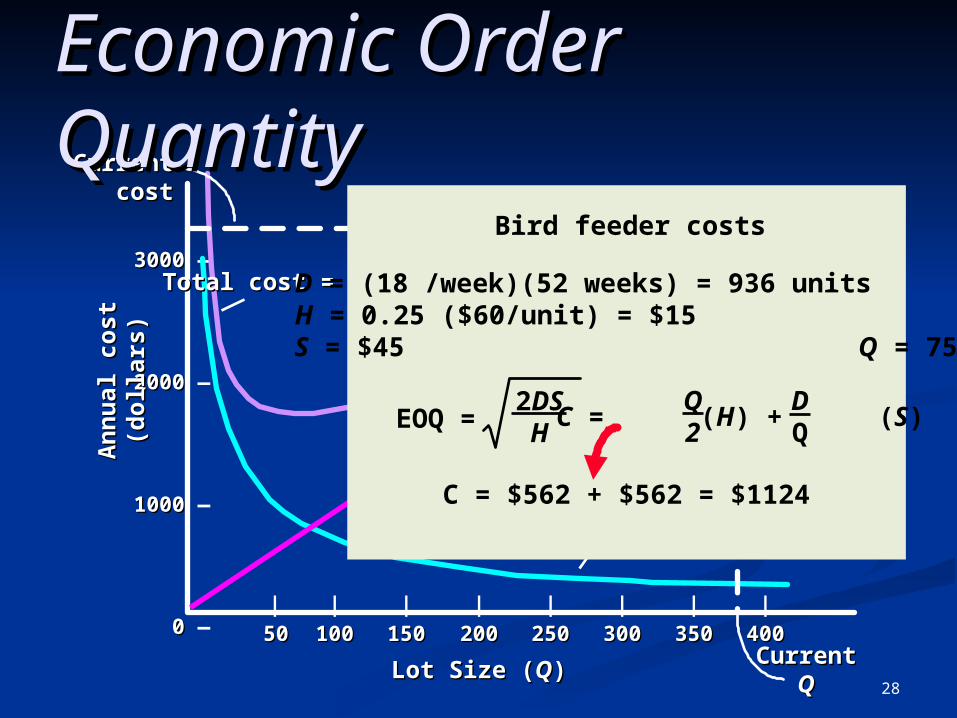
Bird feeder costs
D = (18 /week)(52 weeks) = 936 unitsH = 0.25 ($60/unit) = $15S = $45 Q = 75
C = (H) + (S)Q2
DQEOQ =
2DSH
28
3000 3000 —
2000 2000 —
1000 1000 —
0 0 —| | | | | | | |
5050 100100 150150 200200 250250 300300 350350 400400
Lot Size (Lot Size (QQ))
An
nu
al c
ost
(d
oll
ars)
An
nu
al c
ost
(d
oll
ars) Total cost = (Total cost = (HH) + () + (SS))
DDQQ
QQ22
Holding cost = (Holding cost = (HH))QQ22
Ordering cost = (Ordering cost = (SS))DDQQ
CurrentCurrentcostcost
CurrentCurrentQQ
Economic Order Economic Order QuantityQuantity
Bird feeder costs
D = (18 /week)(52 weeks) = 936 unitsH = 0.25 ($60/unit) = $15S = $45 Q = 75
C = (H) + (S)Q2
DQEOQ =
2DSH
C = $562 + $562 = $1124
29
3000 3000 —
2000 2000 —
1000 1000 —
0 0 —| | | | | | | |
5050 100100 150150 200200 250250 300300 350350 400400
Lot Size (Lot Size (QQ))
An
nu
al c
ost
(d
oll
ars)
An
nu
al c
ost
(d
oll
ars) Total cost = (Total cost = (HH) + () + (SS))
DDQQ
QQ22
Holding cost = (Holding cost = (HH))QQ22
Ordering cost = (Ordering cost = (SS))DDQQ
CurrentCurrentcostcost
CurrentCurrentQQ
Economic Order Economic Order QuantityQuantity
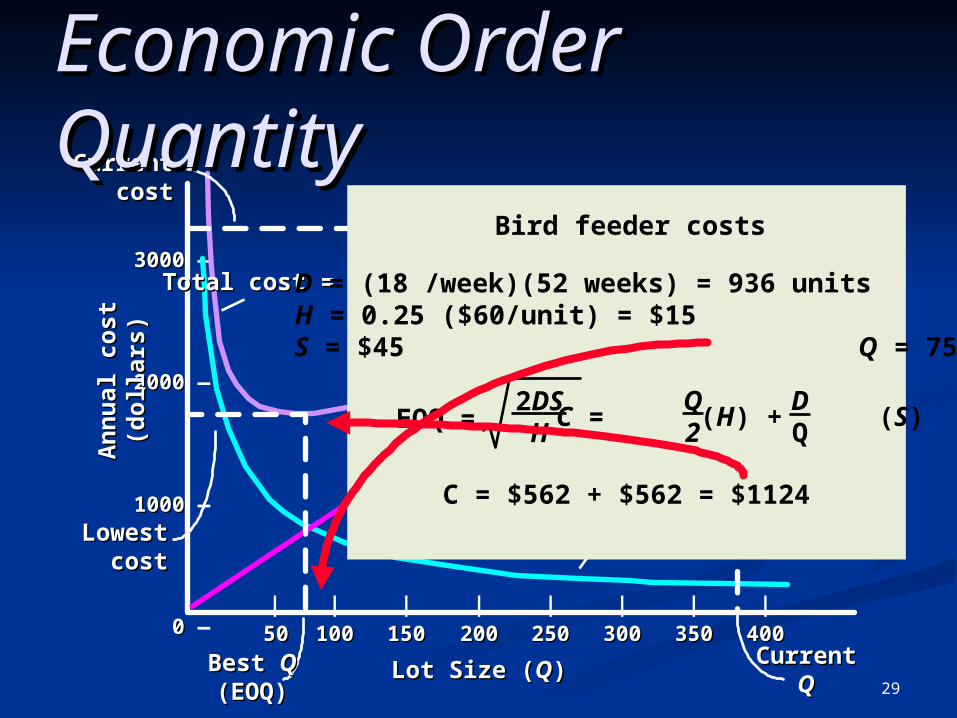
Bird feeder costs
D = (18 /week)(52 weeks) = 936 unitsH = 0.25 ($60/unit) = $15S = $45 Q = 75
C = (H) + (S)Q2
DQEOQ =
2DSH
C = $562 + $562 = $1124
LowestLowestcostcost
Best Best QQ(EOQ)(EOQ)
30
Economic Order Economic Order QuantityQuantity
3000 3000 —
2000 2000 —
1000 1000 —
0 0 —| | | | | | | |
5050 100100 150150 200200 250250 300300 350350 400400
Lot Size (Lot Size (QQ))
An
nu
al c
ost
(d
oll
ars)
An
nu
al c
ost
(d
oll
ars) Total cost = (Total cost = (HH) + () + (SS))
DDQQ
QQ22
Holding cost = (Holding cost = (HH))QQ22
Ordering cost = (Ordering cost = (SS))DDQQ
CurrentCurrentcostcost
CurrentCurrentQQ
Bird feeder costs
D = (18 /week)(52 weeks) = 936 unitsH = 0.25 ($60/unit) = $15S = $45 Q = 75
C = (H) + (S)Q2
DQEOQ =
2DSH
C = $562 + $562 = $1124
LowestLowestcostcost
Best Best QQ(EOQ)(EOQ)

31
LowestLowestcostcost
Best Best QQ(EOQ)(EOQ)
Economic Order Economic Order QuantityQuantity
3000 3000 —
2000 2000 —
1000 1000 —
0 0 —| | | | | | | |
5050 100100 150150 200200 250250 300300 350350 400400
Lot Size (Lot Size (QQ))
An
nu
al c
ost
(d
oll
ars)
An
nu
al c
ost
(d
oll
ars) Total cost = (Total cost = (HH) + () + (SS))
DDQQ
QQ22
Holding cost = (Holding cost = (HH))QQ22
Ordering cost = (Ordering cost = (SS))DDQQ
CurrentCurrentcostcost
CurrentCurrentQQ
Bird feeder costs
D = (18 /week)(52 weeks) = 936 unitsH = 0.25 ($60/unit) = $15S = $45 Q = 75
C = (H) + (S)Q2
DQEOQ =
2DSH
C = $562 + $562 = $1124
Time between orders
TBOEOQ = = 75/936 = 0.080 yearEOQ
D
TBOEOQ = (75/936)(12) = 0.96 months
TBOEOQ = (75/936)(52) = 4.17 weeks
TBOEOQ = (75/936)(365) = 29.25 days

EOQ Example (1) Problem DataEOQ Example (1) Problem Data
Annual Demand = 1,000 unitsDays per year considered in average
daily demand = 365Cost to place an order = $10Holding cost per unit per year = $2.50Lead time = 7 daysCost per unit = $15
Given the information below, what are the EOQ and reorder point?
Given the information below, what are the EOQ and reorder point?
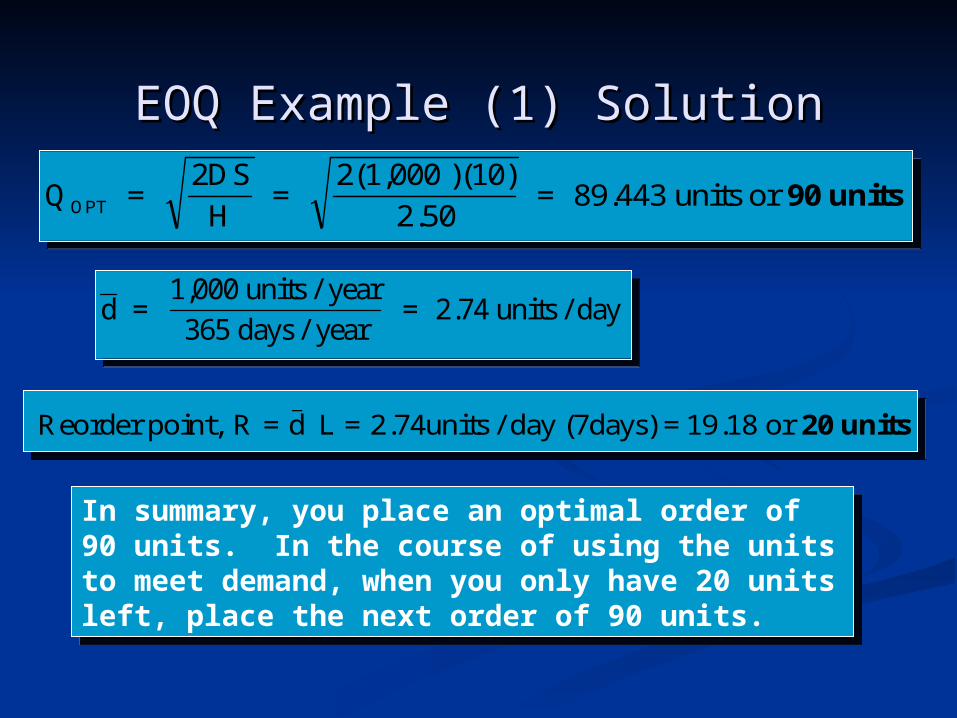
EOQ Example (1) SolutionEOQ Example (1) Solution
Q = 2DS
H =
2(1,000 )(10)
2.50 = 89.443 units or OPT 90 unitsQ =
2DS
H =
2(1,000 )(10)
2.50 = 89.443 units or OPT 90 units
d = 1,000 units / year
365 days / year = 2.74 units / dayd =
1,000 units / year
365 days / year = 2.74 units / day
Reorder point, R = d L = 2.74units / day (7days) = 19.18 or _
20 units Reorder point, R = d L = 2.74units / day (7days) = 19.18 or _
20 units
In summary, you place an optimal order of 90 units. In the course of using the units to meet demand, when you only have 20 units left, place the next order of 90 units.
In summary, you place an optimal order of 90 units. In the course of using the units to meet demand, when you only have 20 units left, place the next order of 90 units.

34
EOQ Example (2)EOQ Example (2)
Given:Given: 25,000 annual demand25,000 annual demand $3 per unit per year holding cost$3 per unit per year holding cost $100 ordering costs$100 ordering costs
12913
100)2(25,000)( = EOQ

E(1)
Independent vs. Dependent Independent vs. Dependent DemandDemand
Independent Demand (Demand for the final end-product or demand not related to other items)
Dependent Demand
(Derived demand items for
component parts,
subassemblies, raw materials,
etc)
Finishedproduct
Component parts

36
Decisions in Inventory Decisions in Inventory ManagementManagement
Only two decisions need to be made in Only two decisions need to be made in managing independent-demand managing independent-demand inventories: inventories:
When to order? (timing)When to order? (timing)
How much to order? (size)How much to order? (size)
37
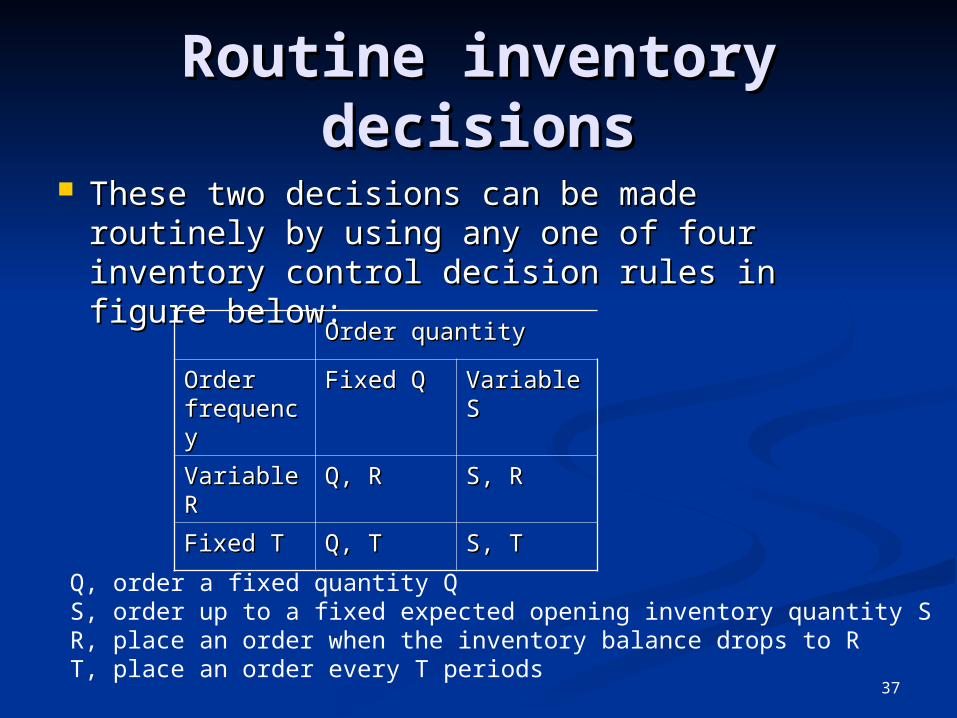
Routine inventory Routine inventory decisionsdecisions
These two decisions can be made routinely These two decisions can be made routinely by using any one of four inventory control by using any one of four inventory control decision rules in figure below: decision rules in figure below:
Order quantityOrder quantity
Order Order frequencfrequencyy
Fixed QFixed Q Variable Variable SS
Variable Variable RR
Q, RQ, R S, RS, R
Fixed TFixed T Q, TQ, T S, TS, T
Q, order a fixed quantity QS, order up to a fixed expected opening inventory quantity SR, place an order when the inventory balance drops to RT, place an order every T periods

38
How How Much?Much? When!When!

39
Types of Inventory Types of Inventory Management SystemsManagement Systems
Continuous review (Reorder point) Continuous review (Reorder point) systemssystems time between orders variestime between orders varies constant order quantityconstant order quantity
Periodic review systemsPeriodic review systems time between orders fixedtime between orders fixed order quantity variesorder quantity varies
Material requirements planning (MRP)Material requirements planning (MRP) dependent demand itemsdependent demand items

40
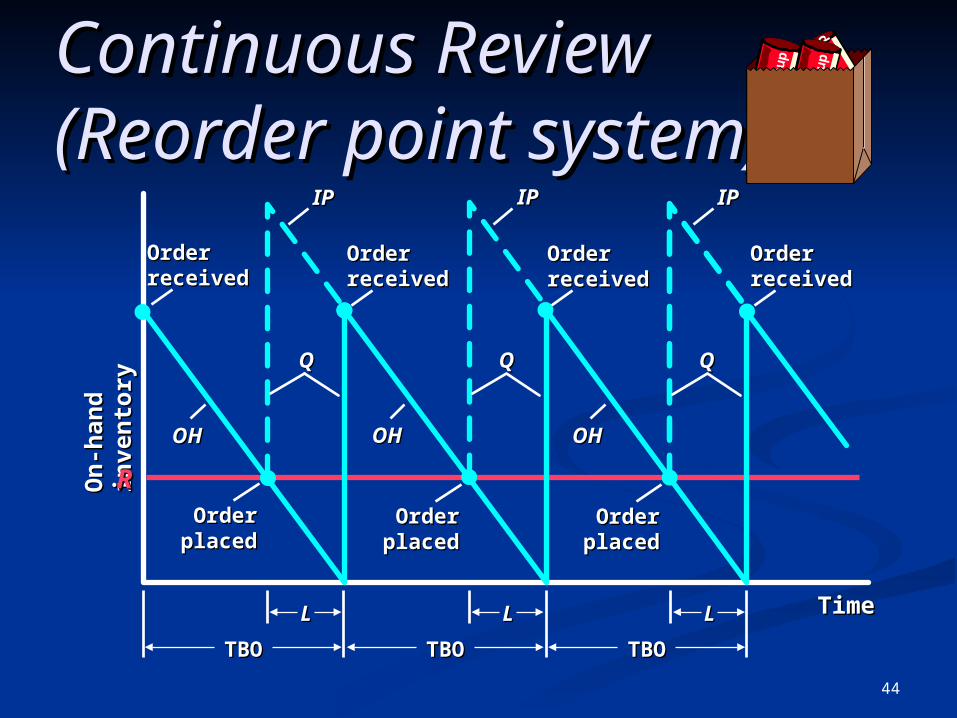
Continuous Review Continuous Review (Reorder point system)(Reorder point system)
Reorder pointReorder point: whenever the inventory on hand : whenever the inventory on hand reaches the predetermined inventory level-reaches the predetermined inventory level-thethe reorder point-reorder point- an order may be placed for a an order may be placed for a prespecified amount if there are no current prespecified amount if there are no current outstanding orders. outstanding orders.
Order quantityOrder quantity is fixed, and the is fixed, and the reorder periodreorder period varies. varies. Lead timeLead time: the time between placement of an order : the time between placement of an order
and receipt of the shipment.and receipt of the shipment. The quantity of inventory to be ordered is often based The quantity of inventory to be ordered is often based
on on economic order quantityeconomic order quantity (one answer to the (one answer to the question “how much to order”). It can be also based question “how much to order”). It can be also based on a price-break quantity, or a container size (such as on a price-break quantity, or a container size (such as a truckload). a truckload).
41
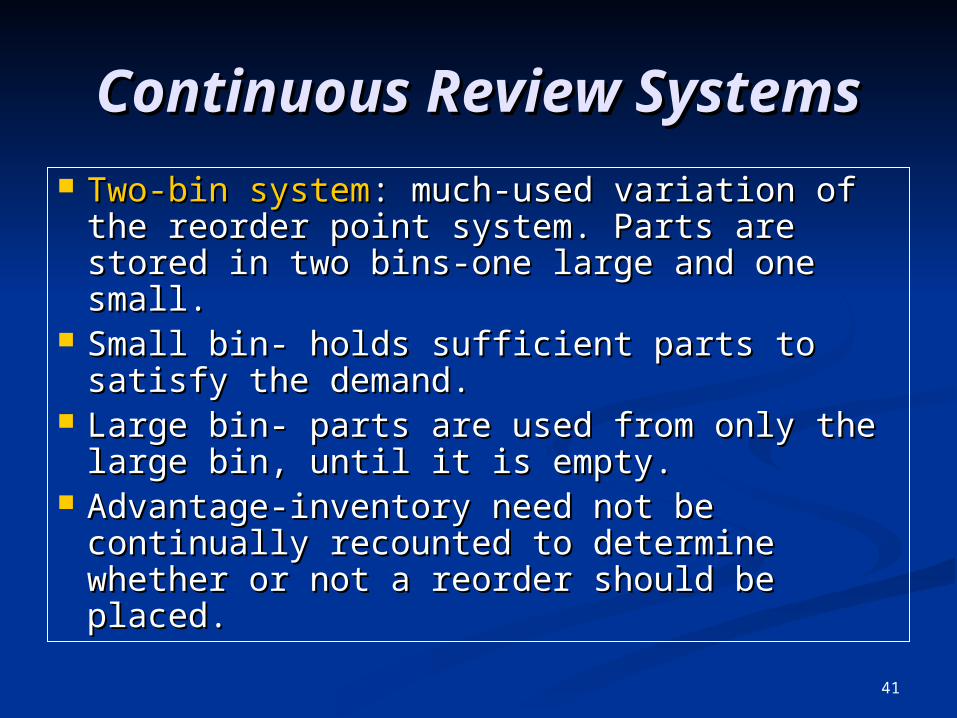
Continuous Review Continuous Review SystemsSystems
Two-bin systemTwo-bin system: much-used variation of : much-used variation of the reorder point system. Parts are stored the reorder point system. Parts are stored in two bins-one large and one small. in two bins-one large and one small.
Small bin- holds sufficient parts to satisfy Small bin- holds sufficient parts to satisfy the demand.the demand.
Large bin- parts are used from only the Large bin- parts are used from only the large bin, until it is empty. large bin, until it is empty.
Advantage-inventory need not be Advantage-inventory need not be continually recounted to determine continually recounted to determine whether or not a reorder should be whether or not a reorder should be placed.placed.

42
Continuous Review Continuous Review SystemsSystems
Perpetual inventory systemPerpetual inventory system: System that : System that keeps track of removals from inventory keeps track of removals from inventory continuously, thus monitoring current continuously, thus monitoring current levels of each item.levels of each item.
Requires either a manual card system or Requires either a manual card system or a computerized system to keep track of a computerized system to keep track of daily usage and daily stock levels.daily usage and daily stock levels.
A reorder point system could not A reorder point system could not adequately perform without either a adequately perform without either a two-bin system or perpetual inventory two-bin system or perpetual inventory systemsystem..

43
Continuous Review Continuous Review SystemsSystems
Continuous review system tracks the Continuous review system tracks the remaining inventory of an item each remaining inventory of an item each time a withdrawal is made to determine time a withdrawal is made to determine whether it is time to reorder.whether it is time to reorder.
At each review, a decision is made At each review, a decision is made about an item’s inventory position (IP). about an item’s inventory position (IP).
Inventory position (IP)=On-hand Inventory position (IP)=On-hand inventory (OH)+ scheduled receipts inventory (OH)+ scheduled receipts (open orders) (SR)-backorders (BO)(open orders) (SR)-backorders (BO)
44
Continuous Review Continuous Review (Reorder point (Reorder point system)system)
So
up Sou
pS
ou
p
TimeTime
On
-han
d i
nve
nto
ryO
n-h
and
in
ven
tory
RR
TBOTBO
LL
TBOTBO
LL
TBOTBO
LL
OrderOrderreceivedreceived
OrderOrderreceivedreceived
OHOH
OrderOrderplacedplaced
IPIP
OrderOrderreceivedreceived
OHOH
OrderOrderplacedplaced
IPIP
OrderOrderreceivedreceived
OrderOrderplacedplaced
IPIP
OHOH

45
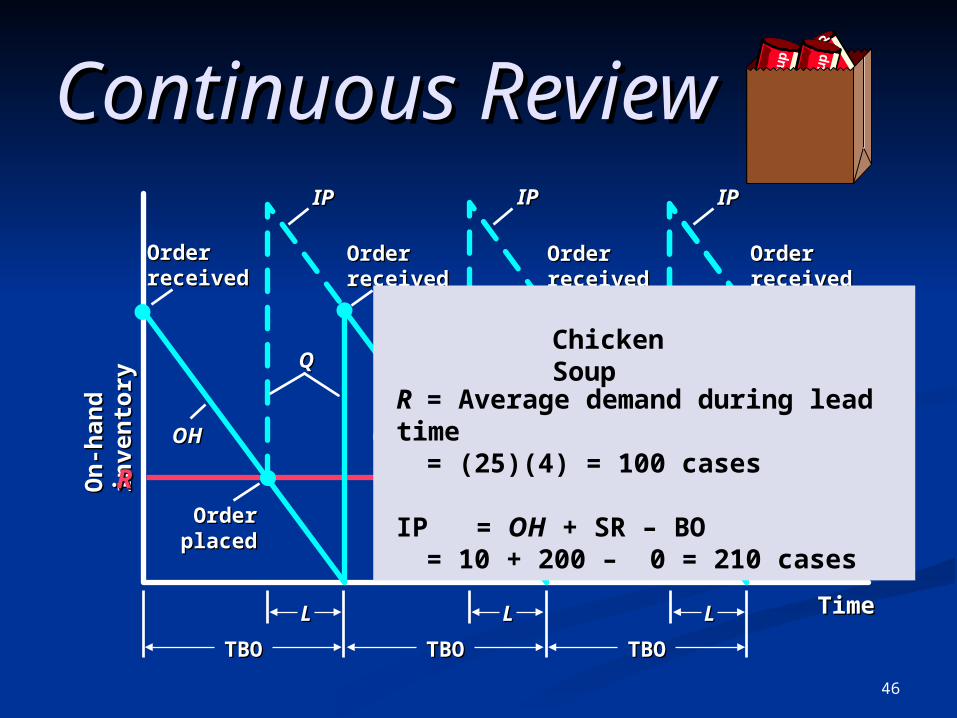
ExampleExample
Demand for chicken soup at a Demand for chicken soup at a supermarket is always 25 cases a day supermarket is always 25 cases a day and the lead time is always four days. and the lead time is always four days. The shelves were just restocked with The shelves were just restocked with chicken soup, leaving an on-hand chicken soup, leaving an on-hand inventory of only 10 cases. There are inventory of only 10 cases. There are no backorders, but there is one open no backorders, but there is one open order for 200 cases. What is the order for 200 cases. What is the inventory position? Should a new order inventory position? Should a new order be placed?be placed?
46
TimeTime
On
-han
d i
nve
nto
ryO
n-h
and
in
ven
tory
RR
TBOTBO
LL
TBOTBO
LL
TBOTBO
LL
OrderOrderreceivedreceived
OHOH
OrderOrderplacedplaced
IPIP
OrderOrderreceivedreceived
OHOH
OrderOrderplacedplaced
IPIP
OrderOrderreceivedreceived
OHOH
OrderOrderplacedplaced
IPIP
OrderOrderreceivedreceived
Continuous Continuous ReviewReview
So
up Sou
pS
ou
p
Chicken Soup
R = Average demand during lead time
= (25)(4) = 100 cases
IP = OH + SR – BO= 10 + 200 – 0 = 210 cases
47
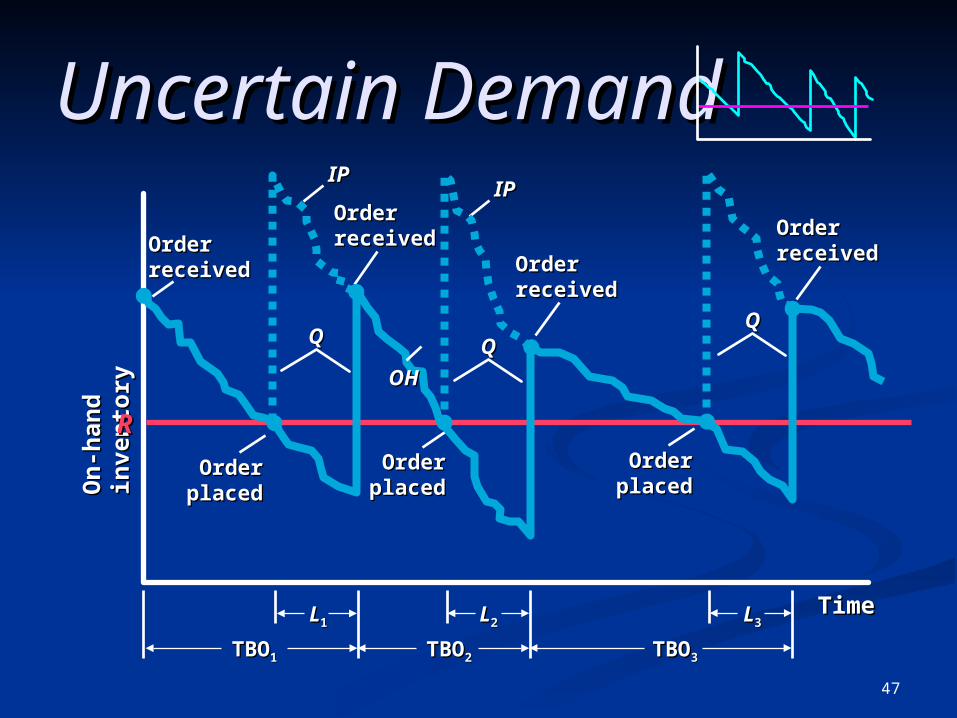
Uncertain Uncertain DemandDemand
TimeTime
On
-han
d i
nve
nto
ryO
n-h
and
in
ven
tory
TBOTBO11 TBOTBO22 TBOTBO33
LL11 LL22 LL33
RR
OrderOrderreceivedreceived
OrderOrderplacedplaced
OrderOrderplacedplaced
OrderOrderreceivedreceived
IPIPIPIP
OrderOrderplacedplaced
OrderOrderreceivedreceived
OrderOrderreceivedreceived
OHOH

48
Reorder Point / Safety Reorder Point / Safety StockStock
Because of uncertain demand, sales during lead time Because of uncertain demand, sales during lead time are unpredictable, and are unpredictable, and safety stocksafety stock is added to is added to hedge against lost sales.hedge against lost sales.
Deciding on a small or large safety stock is a trade-Deciding on a small or large safety stock is a trade-off between customer service and inventory holding off between customer service and inventory holding costs. costs.
The usual approach for determining R is for The usual approach for determining R is for management is to set a reasonable management is to set a reasonable service level service level policypolicy for the inventory and then determine the for the inventory and then determine the safety stock level that satisfies this policy.safety stock level that satisfies this policy.
Service levelService level is the desired probability of not running is the desired probability of not running out of stock in any one ordering cycle, which begins out of stock in any one ordering cycle, which begins at the time an order is placed and ends when it at the time an order is placed and ends when it arrives in stock.arrives in stock.

49
Reorder Point / Reorder Point / Safety StockSafety Stock
Average Average demand demand
during during lead timelead time
Average demand
during lead time
Cycle-service level = 85%Cycle-service level = 85%
Probability of stockoutProbability of stockout(1.0 – 0.85 = 0.15)(1.0 – 0.85 = 0.15)
zzLL
RR
z=the number of standard deviations for a specified service probabilityσL=standard deviation of demand during lead time

50
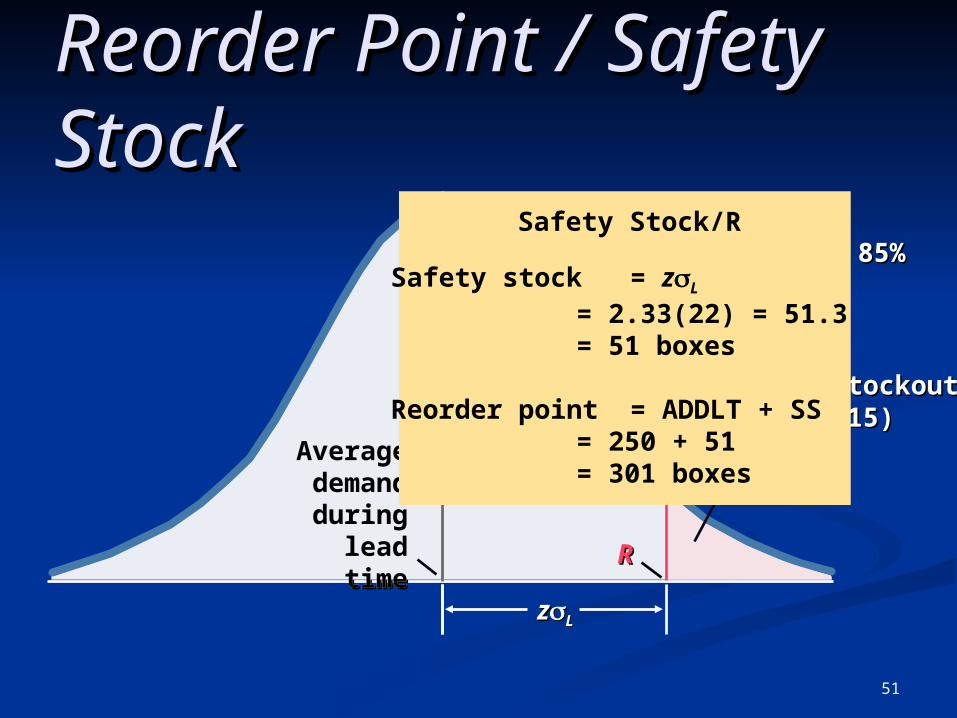
ExampleExample
Records show that the demand Records show that the demand for dishwasher detergent during for dishwasher detergent during lead time is normally distributed, lead time is normally distributed, with an average of 250 boxes and with an average of 250 boxes and σσLL=22. What safety stock should =22. What safety stock should be carried for a 99 percent cycle-be carried for a 99 percent cycle-service level? What is R?service level? What is R?
51
Reorder Point / Reorder Point / Safety StockSafety Stock
Average Average demand demand
during during lead timelead time
Average demand
during lead time
Cycle-service level = 85%Cycle-service level = 85%
Probability of stockoutProbability of stockout(1.0 – 0.85 = 0.15)(1.0 – 0.85 = 0.15)
zzLL
RR
Safety Stock/R
Safety stock = zL
= 2.33(22) = 51.3= 51 boxes
Reorder point = ADDLT + SS= 250 + 51= 301 boxes

52
Reorder Point / Safety Reorder Point / Safety StockStock
Sometimes average demand during lead Sometimes average demand during lead time and the standard deviation of demand time and the standard deviation of demand during lead time are not directly available. during lead time are not directly available.
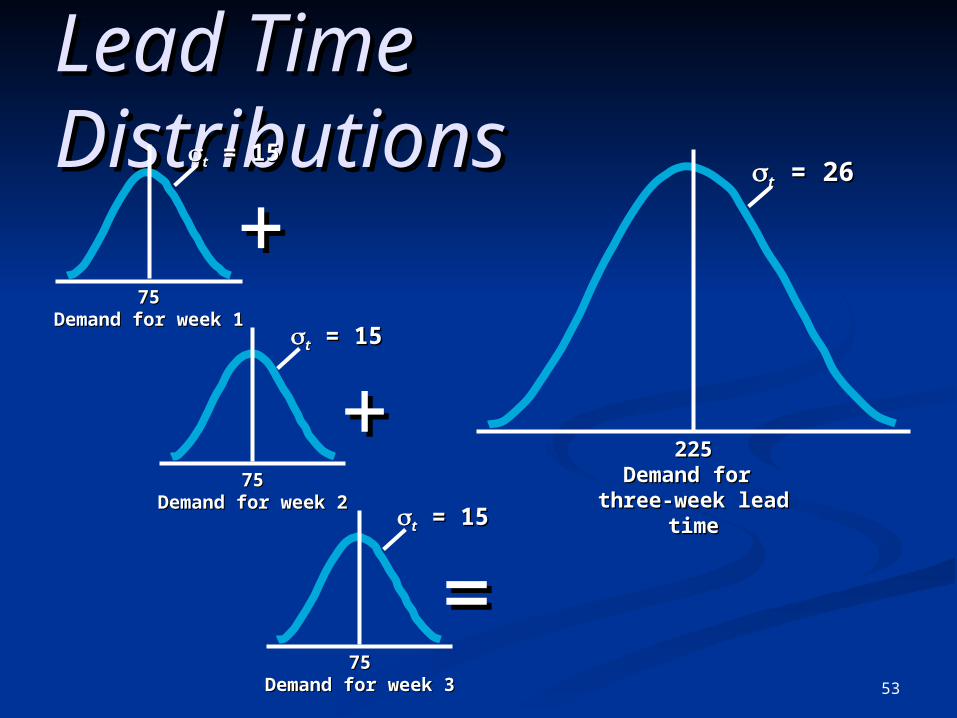
Average demand may be known along with Average demand may be known along with standard deviation of demand, standard deviation of demand, σσtt, over , over some time interval t (days or weeks), where some time interval t (days or weeks), where t does not equal the lead time. In that case t does not equal the lead time. In that case standard deviation of demand during lead standard deviation of demand during lead time can be found as:time can be found as:
σσtt=√ =√ σσtt 2 2 L= L= σσtt √ L √ L
53
Lead Time Lead Time DistributionsDistributionstt = 15 = 15
++7575
Demand for week 1Demand for week 1
tt = 26 = 26
225225Demand for Demand for
three-week lead timethree-week lead time
++7575
Demand for week 2Demand for week 2
tt = 15 = 15
==7575
Demand for week 3Demand for week 3
tt = 15 = 15

54
Lead Time Lead Time DistributionsDistributionstt = 15 = 15
++7575
Demand for week 1Demand for week 1
tt = 26 = 26
225225Demand for Demand for
three-week lead timethree-week lead time
++7575
Demand for week 2Demand for week 2
tt = 15 = 15
==7575
Demand for week 3Demand for week 3
tt = 15 = 15
t = 1 week d = 18 L = 2
L = t L = 5 2 = 7.1
Safety stock = zL = 1.28(7.1) = 9.1 or 9 units
Reorder point = dL + Safety stock= 2(18) + 9 = 45 units
Bird feeder Lead Time Distribution
σt=5
Service-level=90%
55
Calculating Total Q Systems Calculating Total Q Systems CostsCosts
Total cost=Annual inventory holding Total cost=Annual inventory holding cost + annual ordering cost +annual cost + annual ordering cost +annual safety stock holding costsafety stock holding cost

56
Lead Time Lead Time DistributionsDistributionstt = 15 = 15
++7575
Demand for week 1Demand for week 1
tt = 26 = 26
225225Demand for Demand for
three-week lead timethree-week lead time
++7575
Demand for week 2Demand for week 2
tt = 15 = 15
==7575
Demand for week 3Demand for week 3
tt = 15 = 15
Reorder point = 2(18) + 9 = 45 unitst = 1 week d = 18 L = 2
Bird feeder Lead Time Distribution
C = ($15) + ($45) + 9($15)75
2
936
75
C = $562.50 + $561.60 + $135 = $1259.10

57
Periodic Review SystemPeriodic Review System
Inventory level is reviewed at equal Inventory level is reviewed at equal time intervals, and at each review a time intervals, and at each review a reorder may be placed to bring the reorder may be placed to bring the level up to a desired quantity. level up to a desired quantity.
Appropriate for retailers ordering Appropriate for retailers ordering families of goods.families of goods.
58
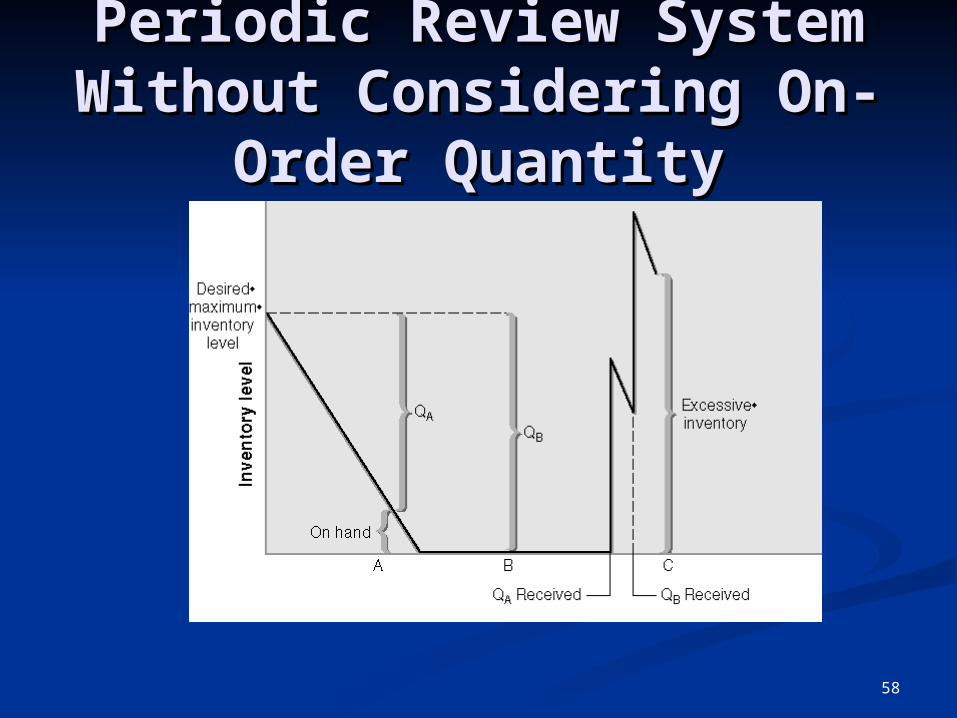
Periodic Review System Periodic Review System Without Considering On-Without Considering On-
Order QuantityOrder Quantity

59
Periodic Review SystemPeriodic Review System
Review periodReview period (therefore the reorder (therefore the reorder period) is fixed, and the period) is fixed, and the order order quantityquantity varies. varies.
Since inventory is not continuously Since inventory is not continuously tracked, there is a significant chance tracked, there is a significant chance of stocking out. This possibility can of stocking out. This possibility can be avoided by using safety stock. be avoided by using safety stock.

60
Periodic Review System Periodic Review System (Assumes None On Order at (Assumes None On Order at
Time of Reorder)Time of Reorder)
Source: Meredith and Shafer, Operations Management for MBAs, Wiley, 2nd edition, 2002; Chase, Jacobs, Aquilano, Operations Management for Competitive Advantage, Mc-Graw Hill 2004; J. Krajewski, Larry P Ritzman, and Manoj K. Malhotra, Operations Management: Process and Value
Chains, Seventh Edition, Prentice Hall, 2005.

Supplement DSupplement DSpecial Inventory (Price-Break) Special Inventory (Price-Break)
ModelsModels
Cost Holding Annual
Cost) Setupor der Demand)(Or 2(Annual =
iC
2DS = QOPT
Based on the same assumptions as the EOQ model, the price-break model has a similar Qopt formula:
i = percentage of unit cost attributed to carrying inventoryC = cost per unit
Since “C” changes for each price-break, the formula above will have to be used with each price-break cost value

62
Total Costs with Total Costs with Purchasing CostPurchasing Cost
Annualcarryingcost
PurchasingcostTC = +
Q2
H DQ
STC = +
+Annualorderingcost
DC +
The buyer’s goal with quantity discounts (price breaks) is to select the order quantity that will minimize total cost, where total cost is the sum of carrying cost, ordering cost, and purchasing cost.

Price-Break Example Problem Price-Break Example Problem Data Data
A company has a chance to reduce their inventory ordering costs by placing larger quantity orders using the price-break order quantity schedule below. What should their optimal order quantity be if this company purchases this single inventory item with an e-mail ordering cost of $4, a carrying cost rate of 2% of the inventory cost of the item, and an annual demand of 10,000 units?
A company has a chance to reduce their inventory ordering costs by placing larger quantity orders using the price-break order quantity schedule below. What should their optimal order quantity be if this company purchases this single inventory item with an e-mail ordering cost of $4, a carrying cost rate of 2% of the inventory cost of the item, and an annual demand of 10,000 units?
Order Quantity(units) Price/unit($)0 to 2,499 $1.202,500 to 3,999 1.004,000 or more .98
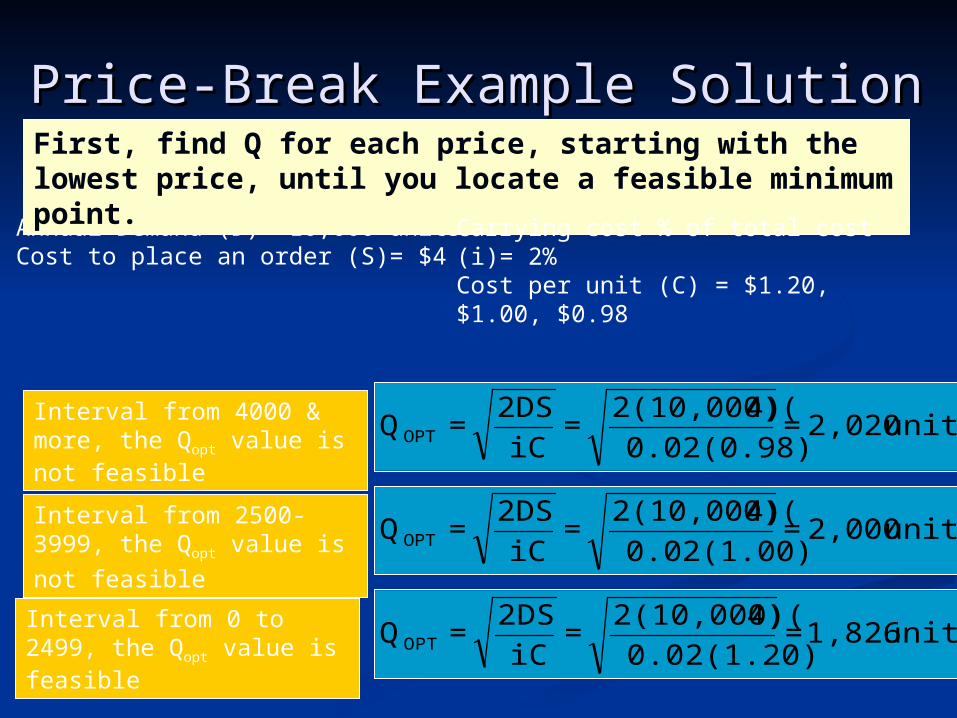
Price-Break Example SolutionPrice-Break Example Solution
units 1,826 = 0.02(1.20)
4)2(10,000)( =
iC
2DS = QOPT
Annual Demand (D)= 10,000 unitsCost to place an order (S)= $4
First, find Q for each price, starting with the lowest price, until you locate a feasible minimum point.
units 2,000 = 0.02(1.00)
4)2(10,000)( =
iC
2DS = QOPT
units 2,020 = 0.02(0.98)
4)2(10,000)( =
iC
2DS = QOPT
Carrying cost % of total cost (i)= 2%Cost per unit (C) = $1.20, $1.00, $0.98
Interval from 0 to 2499, the Qopt value is feasible
Interval from 2500-3999, the Qopt value is not feasible
Interval from 4000 & more, the Qopt value is not feasible

Price-Break Example SolutionPrice-Break Example Solution
iC 2
Q + S
Q
D + DC = TC iC
2
Q + S
Q
D + DC = TC
Next, we plug the Qopt value into the total cost annual cost function to determine the total cost for 1826, and compare it to the total cost of the minimum quantity necessary to obtain the minimum price of .98
Next, we plug the Qopt value into the total cost annual cost function to determine the total cost for 1826, and compare it to the total cost of the minimum quantity necessary to obtain the minimum price of .98
TC(0-2499)=(10000*1.20)+(10000/1826)*4+(1826/2)(0.02*1.20) = $12,043.82TC(4000&more)= $9,949.20
TC(0-2499)=(10000*1.20)+(10000/1826)*4+(1826/2)(0.02*1.20) = $12,043.82TC(4000&more)= $9,949.20
Finally, we select the least costly Qopt, which is this problem occurs in the 4000 & more interval. In summary, our optimal order quantity is 4000 units
Finally, we select the least costly Qopt, which is this problem occurs in the 4000 & more interval. In summary, our optimal order quantity is 4000 units

66
Procedure for Price-Break Procedure for Price-Break ModelsModels
Beginning with the lowest unit price, Beginning with the lowest unit price, compete the Q for each price range until compete the Q for each price range until you find a feasible Q.you find a feasible Q.
If the Q for If the Q for the lowest unit price is the lowest unit price is feasiblefeasible, it is the , it is the optimal order quantityoptimal order quantity..
If the Q is not feasible in the lowest price If the Q is not feasible in the lowest price range, compare the total cost of feasible range, compare the total cost of feasible Q/Qs with the total cost of the minimum Q/Qs with the total cost of the minimum quantity in the lowest price range.quantity in the lowest price range.