1 © ipsos mrbi12-076738/tam ireland viewing habits © ipsos mrbi tam ireland viewing habits 13 th...
TRANSCRIPT

1
© Ipsos MRBI 12-076738/TAM Ireland Viewing Habits12-076738/TAM Ireland Viewing Habits© Ipsos MRBI
TAM Ireland Viewing Habits
13th March 2013

2
© Ipsos MRBI 12-076738/TAM Ireland Viewing Habits
Table of Contents
● Introduction
− Background
− Objectives
− Research Methodology
− Sample Profile
● Findings
− Respondent-Based Findings
− Time-Weighted Findings
− Profiles
● Conclusions

3
© Ipsos MRBI 12-076738/TAM Ireland Viewing Habits
REPORT HIGHLIGHTS…..if you only have 2 minutes
1. 97% of Irish adults watched audio-visual content on a TV set yesterday.
2. 15% watched content yesterday on another device in addition to a TV set (rising to 26% amongst 15-34 year olds).
3. Beyond the TV set, laptops are by far the most popular devices for viewing content.
4. Younger Irish are the most likely to be viewing content on non-TV devices.
5. 216 minutes of audio-visual content is viewed in a typical day.

4
© Ipsos MRBI 12-076738/TAM Ireland Viewing Habits
REPORT HIGHLIGHTS…..if you only have 2 minutes
6. TV Set is the most popular device (192 minutes); Own Home is the most popular location (202 minutes); and Live TV is the most popular format (182 minutes).
7. Younger (15-34) adults spend less time viewing content on a TV set than average (176 minutes per day vs. an average of 192 minutes), but almost reach the average when all devices are taken into account (215 minutes per day vs. an average of 216 minutes).
8. Almost half of the time (49%) we do not do anything else while watching the TV set. Same for mobile (48%). While on the laptop we are somewhat more likely to be active, only reporting to be engaged in no other activity 35% of the time.

5
© Ipsos MRBI 12-076738/TAM Ireland Viewing Habits© Ipsos MRBI 12-076738/TAM Ireland Viewing Habits
Introduction

6
© Ipsos MRBI 12-076738/TAM Ireland Viewing Habits
Background
● TAM Ireland commissioned Ipsos MRBI to conduct research into the diversified Irish viewing universe.
● While linear TV remains the leader in delivering viewing content to consumers, it now competes with a variety of other devices, including laptops, tablets, and smartphones, for viewing time. The introduction of Sky to the Irish market has also expanded the universe.
● These options provide a service and convenience that linear television does not including freedom from the constraints of time, place, and selection which the traditional television viewer has experienced.

7
© Ipsos MRBI 12-076738/TAM Ireland Viewing Habits
Objectives
● The main objectives of the research were:
− To determine viewing habits of the Irish market across all platforms (devices);
− To establish relative consumption levels by device.
● Further objectives included:
− To examine where each viewing device is being used;
− To evaluate when (during the course of the day) each device is used;
− To determine the content viewed across platforms;
− To examine activities engaged in while viewing;
− To explore the viewing habits of the younger generation.
What does the current viewing landscape look like?

8
© Ipsos MRBI 12-076738/TAM Ireland Viewing Habits
Research Methodology
● In home, face-to-face survey with 1,000 audio-visual content viewers.
● The sample excluded those who had not viewed any audio-visual content yesterday. Therefore, figures are a reflection of yesterday’s population of audio-visual content consumers.
● Fieldwork conducted w/c 26th November - 20th December, 2012.
● CAPI (Computer-Assisted Personal Interviewing) provided advantages including:
− faster turnaround of results
− interviewer error reduced due to automatic routing
− elimination of data entry phase

9
© Ipsos MRBI 12-076738/TAM Ireland Viewing Habits
Research Methodology – Audio-Visual Content Defined
● For the purposes of this study, audio-visual content was defined to participants by interviewers as:
− Any moving, audible material presented on a screen of any kind, including regularly scheduled (live) and pre-recorded (time shifted) TV shows or programs, short-form video clips, music videos, movies, box sets, DVD/VCR etc.
● Participants were told that we were interested in all of the audio-visual content viewed on any personal or communal device used for viewing, including:
− Television, DVD/VCR player, computer, laptop, tablet, mobile, games console or public screen.
● Interviewers confirmed understanding of ‘audio-visual content’ before progressing with the survey.

10
© Ipsos MRBI 12-076738/TAM Ireland Viewing Habits
Research Methodology
● Questionnaire Design
− Day after recall: respondents were asked to recall viewing activities from the previous day (yesterday)
− Device based: device (e.g. television set, laptop) basis for each question providing pointed information in relation to platform
● The nationally representative sample was comprised as follows, with disproportionate sampling for 15-34’s and a booster sample of 12-14 year olds*:
Age No. of Participants
15-34 450
35+ 450
12-14 100
Total 1,000
*At the analysis stage, corrective weights were applied to eliminate obvious demographic biases and to weight back disproportionate sampling to known profile population according to latest CSO estimates.

11
© Ipsos MRBI 12-076738/TAM Ireland Viewing Habits
Sample Profile
Male
Female
15-24
25-34
35-54
55+
Dublin
Rest of Leinster
Munster
Conn/ Ulster
Base: All Respondents 15+: 912
Gender%
Age%
Region%
AB
C1
C2
DE
F
Social Class%
Housekeeper%
Resp./ shared
Other person

12
© Ipsos MRBI 12-076738/TAM Ireland Viewing Habits
A Bit About This Report …
● First, findings will be explored based on respondent figures (proportions of the sample which indicated use/activity).
● Then, findings based on time-weighted data will be presented.
− Time-weighted data is based on the aggregation of all answers given for each time segment, multiplied by the relevant number of minutes for each segment.
● Please note these icons at the bottom of each page which indicate “respondent” or “time-weighted” data.
Respondent Based
Time-Weighted

13
© Ipsos MRBI 12-076738/TAM Ireland Viewing Habits
Legends
Television Set
Laptop
Desktop Computer
Tablet
Mobile Phone
Games Console*
Out Of Home Screen
At Own Home
Someone’s Else’s Home
Commuting
At Work
Socially
Public Space
DVD
PaidFor
Rec.TV
LiveTV
FromPlayers
ShortFormVideo
Any other
internet
Live TV
Recorded TV
Paid For Subscription Service
DVD
From Players (RTE Player, 3 Player, 4OD SkyGo)
Short Form Video (e.g. You Tube, Facebook etc.)
Any other downloaded audio-visual content from internet
School/College
Digital Player(Apple TV)
*Games console as used for viewing audio-visual content not game playing

14
© Ipsos MRBI 12-076738/TAM Ireland Viewing Habits© Ipsos MRBI 12-076738/TAM Ireland Viewing Habits
Respondent Based Findings

15
© Ipsos MRBI 12-076738/TAM Ireland Viewing Habits© Ipsos MRBI 12-076738/TAM Ireland Viewing Habits
Devices
● 97% of Irish adults watched audio-visual content on a TV set yesterday.
● 15% watched content yesterday on another device in addition to a TV set (rising to 26% amongst 15-34 year olds).
● Beyond the TV set, laptops are by far the most popular devices for viewing content.
Summary Points

16
© Ipsos MRBI 12-076738/TAM Ireland Viewing Habits
Devices On Which Audio-Visual Content Was Viewed Yesterday – Summary
On A TV Set
On Other Device In Addition To TV Set
Only On Other Device (Not TV Set)
Base: All Respondents 15+: 912
12-17 yrs 94% 29% 6%
15-34 yrs 94% 26% 6%
35-54 yrs 98% 10% 2%
55+ yrs 98% 6% 2%
H’keeper with kids 97% 14% 3%
15+

17
© Ipsos MRBI 12-076738/TAM Ireland Viewing Habits
Devices On Which Audio-Visual Content Was Viewed Yesterday By Device
Base: All Respondents 15+: 912
Q.1 Which of the following devices (including devices which were either connected directly to your TV set or standalone) did you use to view audio/visual content on yesterday?
*Caution: Small Base Size
Public
Most viewed location
While majority of viewing is in own home, 38% view on tablet outside of home
outside

18
© Ipsos MRBI 12-076738/TAM Ireland Viewing Habits
Reach – Devices On Which Audio-Visual Content Was Viewed Yesterday
Base: All Respondents 15+: 912
Q.1 Which of the following devices (including devices which were either connected directly to your TV set or standalone) did you use to view audio/visual content on yesterday?
15+ yrs
12-17 yrs
15-34 yrs
35-54 yrs
55+ yrs
H’keeperwith kids
% % % % % %
TV set 97 94 94 98 98 97
Any other device 18 35 32 12 8 17
Laptop/notebook 10 13 17 8 5 11
Desktop 2 4 1 4 1 3
Tablet 2 6 5 1 - 1
Mobile phone 6 9 10 5 1 4
Games console 2 10 5 * - 1
Out of home screen 1 1 1 1 1 2
*=<0.5%

19
© Ipsos MRBI 12-076738/TAM Ireland Viewing Habits
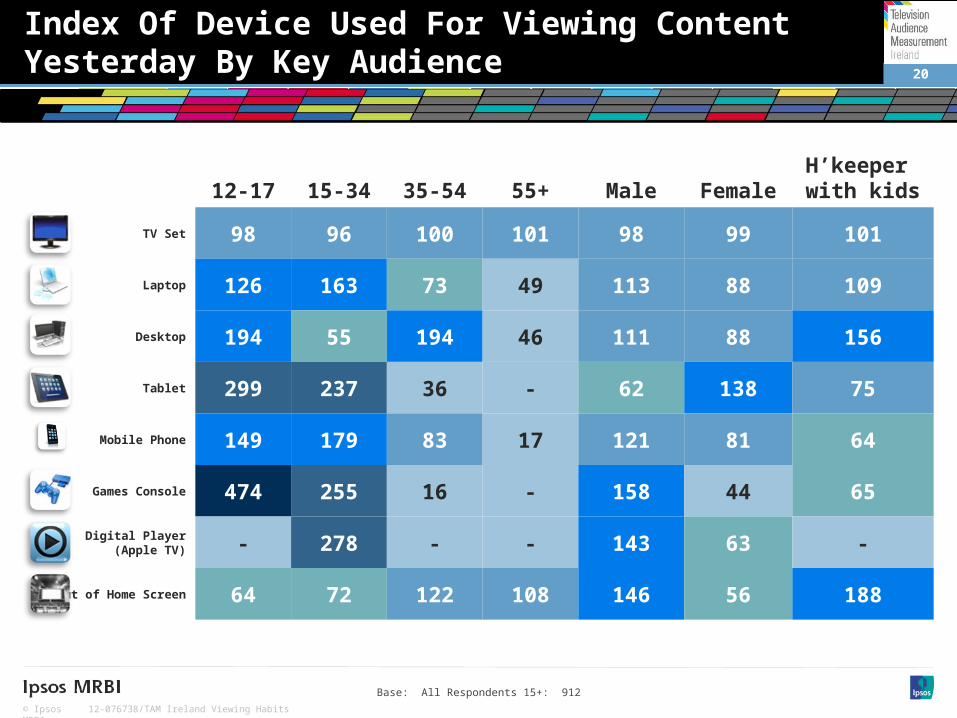
Index Of Device Used For Viewing Content Yesterday By Key Audience
Base: All Respondents 15+: 912
12-17 15-34 35-54 55+ Male FemaleH’keeper with kids
% % % % % % %
TV Set 98 96 100 101 98 99 101
Laptop 126 163 73 49 113 88 109
Desktop 194 55 194 46 111 88 156
Tablet 299 237 36 - 62 138 75
Mobile Phone 149 179 83 17 121 81 64
Games Console 474 255 16 - 158 44 65
Digital Player (Apple TV) - 278 - - 143 63 -
Out of Home Screen 64 72 122 108 146 56 188
20
© Ipsos MRBI 12-076738/TAM Ireland Viewing Habits
Index Of Device Used For Viewing Content Yesterday By Key Audience
Base: All Respondents 15+: 912
12-17 15-34 35-54 55+ Male FemaleH’keeper with kids
TV Set 98 96 100 101 98 99 101
Laptop 126 163 73 49 113 88 109
Desktop 194 55 194 46 111 88 156
Tablet 299 237 36 - 62 138 75
Mobile Phone 149 179 83 17 121 81 64
Games Console 474 255 16 - 158 44 65
Digital Player(Apple TV) - 278 - - 143 63 -
Out of Home Screen 64 72 122 108 146 56 188
21
© Ipsos MRBI 12-076738/TAM Ireland Viewing Habits
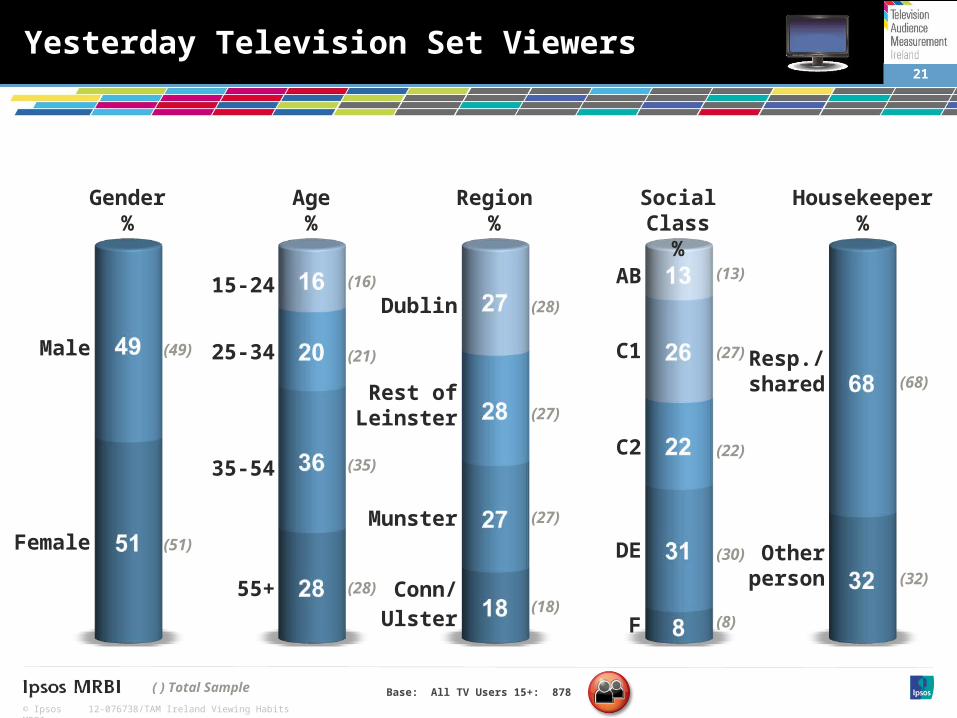
Yesterday Television Set Viewers
Male
Female
15-24
25-34
35-54
55+
Dublin
Rest of Leinster
Munster
Conn/Ulster
Base: All TV Users 15+: 878
AB
C1
C2
DE
F
( ) Total Sample
(49)
(51)
(16)
(35)
(21)
(28)
(28)
(27)
(27)
(18)
(13)
(22)
(30)
(8)
Gender%
Region%
Social Class%
Housekeeper%
(27) Resp./ shared
Other person
(68)
(32)
Age%
22
© Ipsos MRBI 12-076738/TAM Ireland Viewing Habits
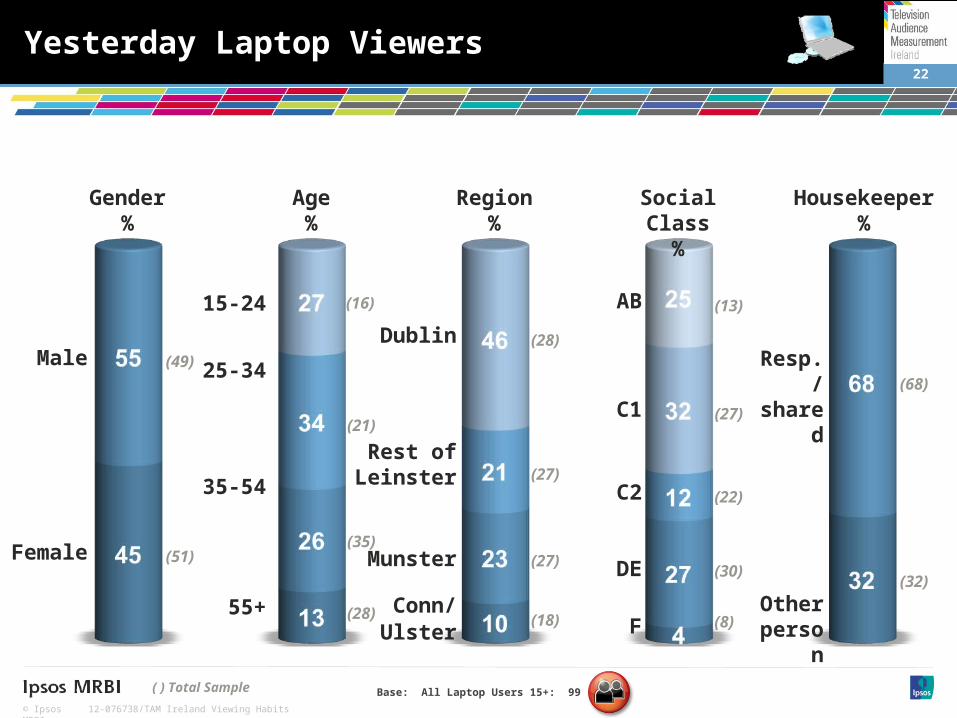
Yesterday Laptop Viewers
Base: All Laptop Users 15+: 99
(49)
(51)
(16)
(35)
(21)
(28)
(28)
(27)
(27)
(18)
(22)
(30)
(8)
( ) Total Sample
(68)
(32)
(13)
(27)
Male
Female
15-24
25-34
35-54
55+
Dublin
Rest of Leinster
Munster
Conn/Ulster
AB
C1
C2
DE
F
Resp./ shared
Other person
Gender%
Age%
Region%
Social Class%
Housekeeper%

23
© Ipsos MRBI 12-076738/TAM Ireland Viewing Habits
Yesterday Mobile Phone Viewers
Base: All Mobile Phone Users 15+: 55
(49)
(51)
(16)
(35)
(21)
(28)
(28)
(27)
(27)
(18)
(22)
(30)
(8)
Male
Female
15-24
25-34
35-54
55+
Dublin
Rest of Leinster
Munster
Conn/Ulster
( ) Total Sample
Gender%
Region%
Social Class%
Housekeeper%
(68)
(32)
(13)
(27)
AB
C1
C2
DE
F
Resp./ shared
Otherperson
Age%

24
© Ipsos MRBI 12-076738/TAM Ireland Viewing Habits
Yesterday Desktop Viewers
Male
Female
15-24
25-34
35-54
55+
Dublin
Rest of Leinster
Munster
Conn/Ulster
Base: All Desktop Users 15+: 18*
(49)
(51)
(16)
(35)
(21)
(28)
(28)
(27)
(27)
(18)
(22)
(30)(8)
( ) Total Sample
Gender%
Region%
Social Class%
Housekeeper%
(68)
(32)
(13)
(27)
AB
C1
C2
DEF
Age%
*Caution: Small Base Size
Resp./ shared
Otherperson

25
© Ipsos MRBI 12-076738/TAM Ireland Viewing Habits
Yesterday Tablet Viewers
Male
Female
15-24
25-34
35-5455+
Dublin
Rest of Leinster
Munster
Conn/Ulster
Base: All Tablet Users 15+: 24*( ) Total Sample
(49)
(51)
(16)
(35)
(21)
(28)
(28)
(27)
(27)
(18)
(22)
(30)(8)
Gender%
Region%
Social Class%
Age%
AB
C1
C2DE
F
Housekeeper%
(68)
(32)
(13)
(27)
Resp./ shared
Otherperson
*Caution: Small Base Size

26
© Ipsos MRBI 12-076738/TAM Ireland Viewing Habits
Yesterday Games Console Viewers
Male
Female
15-24
25-34
35-5455+
Dublin
Rest of Leinster
Munster
Conn/Ulster
Base: All Game Console Users 15+: 25*
(49)
(51)
(16)
(35)
(21)
(28)
(28)
(27)
(27)
(18)
(22)
(30)
(8)
( ) Total Sample
Gender%
Region%
Social Class%
Age%
(13)
(27)
Housekeeper%
(68)
(32)
Resp./ shared
Otherperson
*Caution: Small Base Size
AB
C1
C2
DE
F

27
© Ipsos MRBI 12-076738/TAM Ireland Viewing Habits© Ipsos MRBI 12-076738/TAM Ireland Viewing Habits
Live TV
● 94% of respondents viewed Live TV yesterday.
● The vast majority of Live TV is viewed on a TV set at home.
Summary Points

28
© Ipsos MRBI 12-076738/TAM Ireland Viewing Habits
How Many Watched Live TV Yesterday
Q.4 Which of the following did you view on <device> yesterday?
Mentions <1% not shownBase: All Respondents 15+: 912
Live TV By DeviceLive TV By DeviceLive TV On Any DeviceLive TV On Any Device
*Note: multicode
94% viewed Live TV
yesterday
12-17 yrs
15-34 yrs
35-54 yrs
55+ yrs
H’keeperwith kids
Viewed Live TV Yesterday
93% 89% 95% 98% 92%
Viewed Live TV Yesterday On …
TV Set 92%
Laptop 3%
Mobile Phone 1%
Tablet 1%
Out Of Home Screen 1%

29
© Ipsos MRBI 12-076738/TAM Ireland Viewing Habits© Ipsos MRBI 12-076738/TAM Ireland Viewing Habits
Time-WeightedFindings

30
© Ipsos MRBI 12-076738/TAM Ireland Viewing Habits© Ipsos MRBI 12-076738/TAM Ireland Viewing Habits
Device Viewing By Location & Format
● 216 minutes of audio-visual content is viewed in a typical day.
● TV Set is the most popular device (192 minutes); Own Home is the most popular location (202 minutes); and Live TV is the most popular format (182 minutes).
Summary Points

31
© Ipsos MRBI 12-076738/TAM Ireland Viewing Habits
Legends
At own home
Someone’s else’s home
Commuting
At work
Socially
Public spacePublic
DVD
PaidFor
Rec.TV
LiveTV
FromPlayers
ShortFormVideo
Any other
internet
Live TV
Recorded TV
Paid for subscription service
DVD
From Players (RTE Player, 3 Player, 4OD SkyGo)
Short form video (e.g. You Tube, Facebook etc.)
Any other downloaded audio-visual content from internet
School/College

32
© Ipsos MRBI 12-076738/TAM Ireland Viewing Habits
Total Pie Of Viewing Minutes
Q.2 You mentioned you viewed audio/visual content on a [device] yesterday, can you identify all of the times you viewed audio/visual content on a [device] yesterday?
216 minutes of audio-visual
content viewed on average each
day
Base: All Respondents 15+: 912

33
© Ipsos MRBI 12-076738/TAM Ireland Viewing Habits
Viewing Minutes – Device Share Of Viewing
Device Share Of Viewing
Q.2 You mentioned you viewed audio/visual content on a [device] yesterday, can you identify all of the times you viewed audio/visual content on a [device] yesterday?
Base: All Responses 15+

34
© Ipsos MRBI 12-076738/TAM Ireland Viewing Habits
Viewing Minutes – Format Share Of Viewing
Format Share Of Viewing
Q.4 Which of the following did you view on the [device] yesterday?
Base: All Responses 15+

35
© Ipsos MRBI 12-076738/TAM Ireland Viewing Habits
1.5%TV
some-one
else’s home
1.5%TV
some-one
else’s home
0.9% TV
at work
0.9% TV
at work
Television setLaptopDesktop computerTabletMobile phoneGames consoleOut of home screen
0.6%mobile
ownhome
0.6%mobile
ownhome
4.6% laptop at home4.6% laptop at home
0.4% desktopat work
0.4% desktopat work
0.1% out of home screen at work
0.1% out of home screen at work
0.7% TV
socially
0.7% TV
socially
0.8% laptop at work
0.8% laptop at work
0.2% laptop someone else’s home
0.2% laptop someone else’s home
0.2% mobile commuting
0.2% mobile commuting
0.5%tabletown
home
0.5%tabletown
home
0.1% mobile in a public space
0.1% mobile in a public space
0.2%tablet commuting
0.2%tablet commuting
0.3% mobile at work
0.3% mobile at work
0.1% TV in a public space
0.1% TV in a public space
0.9%games
consoleown home
0.9%games
consoleown home
1.1% desktop
own home
1.1% desktop
own home
0.4% TV
other
0.4% TV
other0.2% laptop
someone else’s home
0.2% laptop someone
else’s home
0.3% mobile
someone else’s home
0.3% mobile
someone else’s home
0.2% out of home
screenin a public
space
0.2% out of home
screenin a public
space
85.4%TV at home
85.4%TV at home
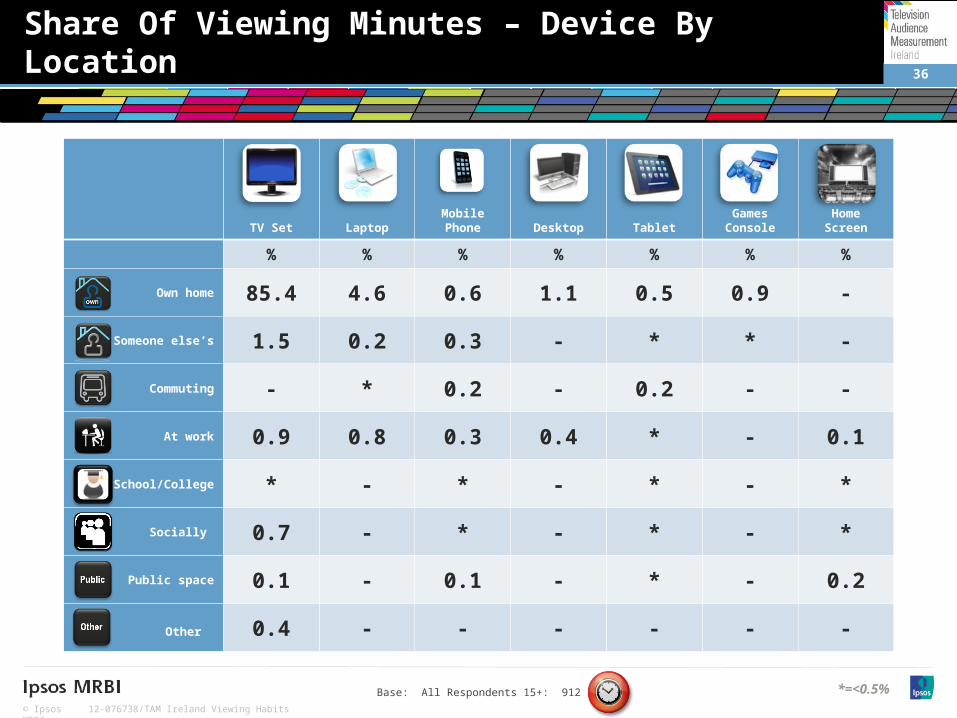
Share Of Viewing Minutes– Device By Location
Base: All Respondents 15+: 912
36
© Ipsos MRBI 12-076738/TAM Ireland Viewing Habits
Share Of Viewing Minutes – Device By Location
Base: All Respondents 15+: 912
TV Set Laptop Mobile Phone Desktop Tablet Games ConsoleOut of Home
Screen
% % % % % % %
Own home 85.4 4.6 0.6 1.1 0.5 0.9 -
Someone else’s 1.5 0.2 0.3 - * * -
Commuting - * 0.2 - 0.2 - -
At work 0.9 0.8 0.3 0.4 * - 0.1
School/College * - * - * - *
Socially 0.7 - * - * - *
Public space 0.1 - 0.1 - * - 0.2
Other 0.4 - - - - - -
*=<0.5%

37
© Ipsos MRBI 12-076738/TAM Ireland Viewing Habits
Viewing On Television Set – Location & Format?
96% 2% 1% 1%
DVDPaidFor
Rec.TV
LiveTV
92% 6% 1% 1%
Q.3 Where did you view content on the [device] yesterday?Q.4 Which of the following did you view on the [device] yesterday?
Base: All TV Set Users 15+

38
© Ipsos MRBI 12-076738/TAM Ireland Viewing Habits
Viewing On Any Other Device (Not Television Set)– Location & Format?
71% 14% 6% 4%
DVDPaidFor
Rec.TV
LiveTV
25% 22% 17% 11%
Q.3 Where did you view content on the [device] yesterday?Q.4 Which of the following did you view on the [device] yesterday?
Base: All Any Other Device Users 15+
Public
1% 1%4%
FromPlayers
Any other
internet
ShortFormVideo
Other
9% 7% 5% 4%

39
© Ipsos MRBI 12-076738/TAM Ireland Viewing Habits
Viewing On Laptop – Location & Format?
82% 4% 1% 13%
FromPlayers
Rec.TV
28% 12% 11% 16%
Any other
internet
17%
ShortFormVideo
LiveTV
Base: All Laptop Users 15+
Q.3 Where did you view content on the [device] yesterday?Q.4 Which of the following did you view on the [device] yesterday?
*Format <10% not shown

40
© Ipsos MRBI 12-076738/TAM Ireland Viewing Habits
Viewing On Mobile Phone – Location & Format?
Public
39% 18% 17%15% 9%
16% 12% 38% 23%
Rec.TV
Any other
internet
ShortFormVideo
LiveTV
Base: All Mobile Phone Users 15+
Q.3 Where did you view content on the [device] yesterday?Q.4 Which of the following did you view on the [device] yesterday?
*Format <10% not shown*Location <8% not shown

41
© Ipsos MRBI 12-076738/TAM Ireland Viewing Habits
Viewing On Desktop Computer – Location & Format?
73% 27%
7% 14% 46% 11%
Rec.TV
PaidFor
ShortFormVideo
LiveTV
Base: All Desktop Users 15+ *Format <5% not shown
Q.3 Where did you view content on the [device] yesterday?Q.4 Which of the following did you view on the [device] yesterday?
18%
Any other
internet
*Caution: Small Base Size (18)

42
© Ipsos MRBI 12-076738/TAM Ireland Viewing Habits
Viewing On Tablet – Location & Format?
62% 20% 7% 4%
DVDRec.TV
LiveTV
36% 24% 17% 13%
Q.3 Where did you view content on the [device] yesterday?Q.4 Which of the following did you view on the [device] yesterday?
Base: All Tablet Users 15+
Public
2% 1%4%
FromPlayers
Any other
internet
ShortFormVideo
8% 1%
*Caution: Small Base Size (18)

43
© Ipsos MRBI 12-076738/TAM Ireland Viewing Habits© Ipsos MRBI 12-076738/TAM Ireland Viewing Habits
Viewing Minutes By Key Audiences
● Younger (15-34) adults spend less time viewing content on a TV set than average (176 minutes per day vs. an average of 192 minutes), but almost reach the average when all devices are taken into account (215 minutes per day vs. an average of 216 minutes).
● Younger viewers (15-34 years) are also more likely than viewers generally to consume beyond Live TV, viewing more Recorded TV, DVD and content from Players.
Summary Points

44
© Ipsos MRBI 12-076738/TAM Ireland Viewing Habits
Device Used For Viewing By Key Audience
15+ yrs
12-17Yrs
15-34Yrs
35-54Yrs
55+yrs
H’keeper with kids
No. of Mins/Share %
No. of Mins/Share %
No. of Mins/Share %
No. of Mins/Share %
No. of Mins/Share %
No. of Mins/Share %
TV Set 192.3 (89%) 141 (79%) 176 (82%) 189 (90%) 218 (96%) 191 (89%)
Laptop 12.1 (6%) 14 (8%) 19 (9%) 10 (5%) 6 (3%) 12 (6%)
Mobile Phone 3.4 (2%) 5 (3%) 6 (3%) 2 (1%) - 2 (1%)
Desktop 3.3 (2%) 2 (2%) 1 (*) 7 (3%) 1 (*) 6 (3%)
Tablet 1.8 (1%) 6 (3%) 4 (2%) 1 (*) - 1 (*)
Games Console 2.1 (1%) 10 (6%) 6 (3%) * - 2 (1% )
Out of Home Screen .9 (*) * 1 (*) 1 (*) 1 (*) 2 (1%)
Base: All Responses 15+ *=<0.5%

45
© Ipsos MRBI 12-076738/TAM Ireland Viewing Habits
Format Of Viewing By Key Audience
15+ yrs
12-17Yrs
15-34Yrs
35-54Yrs
55+yrs
H’keeper with kids
No. of Mins/Share %
No. of Mins/Share %
No. of Mins/Share %
No. of Mins/Share %
No. of Mins/Share %
No. of Mins/Share %
182 (84%) 138 (76%) 166 (77%) 177 (84%) 210 (93%) 176 (81%)
Any Other Format (Not Live TV) 34.3 (16%) 43 (24%) 49 (23%) 34 (16%) 16 (7%) 40 (19%)
14.2 (7%) 15 (8%) 20 (9%) 12 (6%) 10 (4%) 18 (8%)
2.6 (1%) 7 (4%) 5 (2%) 2 (1%) 1 (*) 2 (1%)
5.2 (2%) 7 (4%) 7 (3%) 6 (3%) 2 (1%) 8 (4%)
4.8 (2%) 3 (2%) 8 (4%) 5 (2%) 1 (*) 5 (2%)
2.2 (1%) 1 (1%) 3 (1%) 1 (*) 3 (1%) 2 (1%)
4.8 (2%) 7 (4%) 6 (3%) 5 (2%) 1 (*) 4 (2%)
1 (*) 3 (2%) 1 (*) 2 (1%) - 2 (1%)
Base: All Responses 15+ *=<0.5%

46
© Ipsos MRBI 12-076738/TAM Ireland Viewing Habits
Location Of Viewing By Key Audience
15+ yrs
12-17Yrs
15-34Yrs
35-54Yrs
55+yrs
H’keeper with kids
No. of Mins/Share %
No. of Mins/Share %
No. of Mins/Share %
No. of Mins/Share %
No. of Mins/Share %
No. of Mins/Share %
Own home 201.6 (93%) 166 (92%) 190 (89%) 200 (95%) 219 (97%) 206 (95%)
Someone else’s 4.5 (2%) 10 (6%) 10 (5%) 1 (*) 2 (1%) 3 (1%)
Commuting .9 (*) 2 (1%) 2 (1%) * - *
At work 5.3 (2%) - 6 (3%) 5 (2%) 4 (2%) 2 (1%)
School/College * * * * - *
Socially 1.6 (1%) 1 (1%) 4 (2%) 1 (*) * *
Public space 1.1 (1%) 1 (1%) 2 (1%) 1 (*) * 2 (1%)
Other .8 (*) - - 2 (1%) - 2 (1%)
Base: All Responses 15+ *=<0.5%

47
© Ipsos MRBI 12-076738/TAM Ireland Viewing Habits
Share Of Minutes – Device By Format
Base: All Respondents 15+: 912
TV Set Laptop Desktop Tablet Mobile Phone Games ConsoleDigital Player
(Apple TV)Out of Home
Screen
% % % % % % % %
81.4 1.6 0.1 0.3 0.2 0.1 0.1 0.4
5.4 0.6 0.2 0.1 0.2 - * *
0.1 0.8 * 0.1 * 0.2 * -
* 0.2 * - 0.1 * * -
0.5 0.9 0.7 0.1 0.6 * * -
1.3 0.4 * * * * * -
0.1 0.9 0.3 0.2 0.4 0.1 * -
0.1 0.2 - - * 0.2 * -
*=<0.5%

48
© Ipsos MRBI 12-076738/TAM Ireland Viewing Habits© Ipsos MRBI 12-076738/TAM Ireland Viewing Habits
Other Activities Engaged In
● Almost half of the time (49%) we do not do anything else while watching the TV set. Same for mobile (48%). While on the laptop, we are somewhat more likely to be active, with only 35% not engaged in any other activity.
● Just 1% of content is viewed simultaneously with another form of content.
Summary Points

49
© Ipsos MRBI 12-076738/TAM Ireland Viewing Habits
Proportion Of Time Spent On Other Activities While Viewing On Television Set
Q.5 Which of the following activities, if any, were you also engaged in while viewing audio/visual content on the <device>?
*Mentions <1% not shown
TV Set
Base: All TV Set Users 15+: 878
% Of Minutes Spent On Activity

50
© Ipsos MRBI 12-076738/TAM Ireland Viewing Habits
Proportion Of Time Spent On Other Activities While Viewing On Laptop
Q.5 Which of the following activities, if any, were you also engaged in while viewing audio/visual content on the <device>?
*Mentions <1% not shown
Laptop
Base: All Laptop Users 15+: 99
% Of Minutes Spent On Activity

51
© Ipsos MRBI 12-076738/TAM Ireland Viewing Habits
Proportion Of Time Spent On Other Activities While Viewing On Mobile Phone
Q.5 Which of the following activities, if any, were you also engaged in while viewing audio/visual content on the <device>?
*Mentions <1% not shown
Mobile
Base: All Mobile Phone Users 15+: 55
% Of Minutes Spent On Activity

52
© Ipsos MRBI 12-076738/TAM Ireland Viewing Habits
Simultaneous Viewing
● 3% of respondents viewed audio-visual content simultaneously on any 2(+) devices yesterday.
● TV set, laptop and mobile are devices most often used for simultaneous viewing.
● 1% of total daily viewing is spent simultaneous viewing.
Base: All Respondents 15+: 912

53
© Ipsos MRBI 12-076738/TAM Ireland Viewing Habits© Ipsos MRBI 12-076738/TAM Ireland Viewing Habits
Profiles

54
© Ipsos MRBI 12-076738/TAM Ireland Viewing Habits
Overall Profile – Male
Base: All Males 15+: 446
Location%
Viewing on Television SetViewing on Television Set
Format%
Ownhome
Someone else’s home
WorkSocially
Public spaceOther
Live TV
Rec. TVDVD
Paid for service
217.5 average minutes viewing daily217.5 average minutes viewing daily
Q.1 / Q.2 / Q.3 / Q.4
*Devices <1% not shown

55
© Ipsos MRBI 12-076738/TAM Ireland Viewing Habits
Overall Profile – Female
Location%
Viewing on Television SetViewing on Television Set
Format%
Ownhome
Someone else’s home
Work
Live TV
Rec. TVDVD
Paid for service
215 average minutes viewing daily215 average minutes viewing daily
Q.1 / Q.2 / Q.3 / Q.4
Base: All Females 15+: 466*Devices <1% not shown

56
© Ipsos MRBI 12-076738/TAM Ireland Viewing Habits
Overall Profile – 15-34 Year Olds
Location%
Viewing on Television SetViewing on Television Set
Format%
Ownhome
Someone else’s home
WorkSocially
Public space
Live TV
Rec. TVDVD
214.5 average minutes viewing daily214.5 average minutes viewing daily
Q.1 / Q.2 / Q.3 / Q.4
Base: All 15-34 Year Olds: 442 *Devices <1% not shown

57
© Ipsos MRBI 12-076738/TAM Ireland Viewing Habits
Overall Profile – 35-54 Year Olds
Location%
Viewing on Television SetViewing on Television Set
Format%
Ownhome
Someone else’s home
SociallyOther
Live TV
Rec. TVDVD
Paid for service
210.4 average minutes viewing daily210.4 average minutes viewing daily
Q.1 / Q.2 / Q.3 / Q.4
Base: All 35-54 Year Olds: 270*Devices <1% not shown

58
© Ipsos MRBI 12-076738/TAM Ireland Viewing Habits
Overall Profile – 55+ Year Olds
Location%
Viewing on Television SetViewing on Television Set
Format%
Ownhome
Someone else’s home
Work
Live TV
Rec. TVPaid for service
225.7average minutes viewing daily225.7average minutes viewing daily
Q.1 / Q.2 / Q.3 / Q.4
*Devices <1% not shown Base: All 55+ Year Olds: 200

59
© Ipsos MRBI 12-076738/TAM Ireland Viewing Habits
Overall Profile – Housekeeper/Shared
Location%
Viewing on Television SetViewing on Television Set
Format%
Ownhome
Someone else’s home
WorkSocially
Live TV
Rec. TVDVD
Paid for service
220.7 average minutes viewing daily220.7 average minutes viewing daily
Q.1 / Q.2 / Q.3 / Q.4
Base: All Head of Households: 592*Devices <1% not shown

60
© Ipsos MRBI 12-076738/TAM Ireland Viewing Habits
Overall Profile – Non-Housekeeper
Location%
Viewing on Television SetViewing on Television Set
Format%
Ownhome
Someone else’s home
SociallyWork
Live TV
Rec. TVDVD
206.7 average minutes viewing daily206.7 average minutes viewing daily
Q.1 / Q.2 / Q.3 / Q.4
*Devices <1% not shown Base: All Non-Head of Households: 320

61
© Ipsos MRBI 12-076738/TAM Ireland Viewing Habits
Overall Profile – Housekeeper/Shared With Kids
Base: All Head of Households/Shared With Kids: 290
Location%
Viewing on Television SetViewing on Television Set
Format%
Ownhome
Someone else’s home
WorkSocially
Other
Live TV
Rec. TVDVD
Paid for service
215.8 average minutes viewing daily215.8 average minutes viewing daily
Q.1 / Q.2 / Q.3 / Q.4
*Devices <1% not shown

62
© Ipsos MRBI 12-076738/TAM Ireland Viewing Habits
Overall Profile – Housekeeper/Shared Without Kids
Base: All Head of Households/Shared Without Kids: 302
Location%
Viewing on Television SetViewing on Television Set
Format%
Ownhome
Someone else’s home
Socially
Live TV
Rec. TVDVD
Paid for service
225.1average minutes viewing daily225.1average minutes viewing daily
Q.1 / Q.2 / Q.3 / Q.4
*Devices <1% not shown

63
© Ipsos MRBI 12-076738/TAM Ireland Viewing Habits© Ipsos MRBI 12-076738/TAM Ireland Viewing Habits
Conclusions

64
© Ipsos MRBI 12-076738/TAM Ireland Viewing Habits
Conclusions
Now
●Adults in Ireland still prefer to watch TV at home, which accounts for 85.4% of all audio-visual content consumed.
●Outside of TV at home, laptop at home viewing is next most popular, accounting for 4.6% of content consumed. Beyond TV at home and laptop at home, the viewing market begins to fragment with, interestingly, watching a TV set in someone else’s home (1.5%) the third most popular device/location combination.
●Mobiles and tablets combined accounted for 2.2% of viewing, with most of this taking place at home or in someone else’s home. Just 0.5% of all viewing can be classified as pure mobile (in other words mobile or tablet while commuting, out socially or in a public space).

65
© Ipsos MRBI 12-076738/TAM Ireland Viewing Habits
Conclusions
The Future
●While the TV set accounts for the majority of audio-visual minutes viewed, consumption via other devices is likely to grow with advances in technology, accompanied by an increase in technology literacy and greater affordability.
●3% of Irish adults rely solely on a device other than a TV set to view content in a typical day, with this figure rising to 6% of those aged 15-34.
●A further 15% of adults consume content on another device in addition to a TV set, and this rises to 29% for 15-34s. It will be interesting to see if these new behaviours are carried with them as they grow older.
●So far, new devices are being used to view content at home more than out of home. The future may be mobile, but for audio-visual content, it is not here yet for the vast majority of consumers.

66
© Ipsos MRBI 12-076738/TAM Ireland Viewing Habits
Thank you
© 2013 Ipsos MRBI – all rights reserved
Ipsos MRBI© Ipsos MRBI 12-076738/TAM Ireland Viewing Habits
For further information [email protected]@[email protected] on 0035314389000