1 lecture 21 state minimization via implication charts
TRANSCRIPT
1
Lecture 21
State minimization via implication charts
2
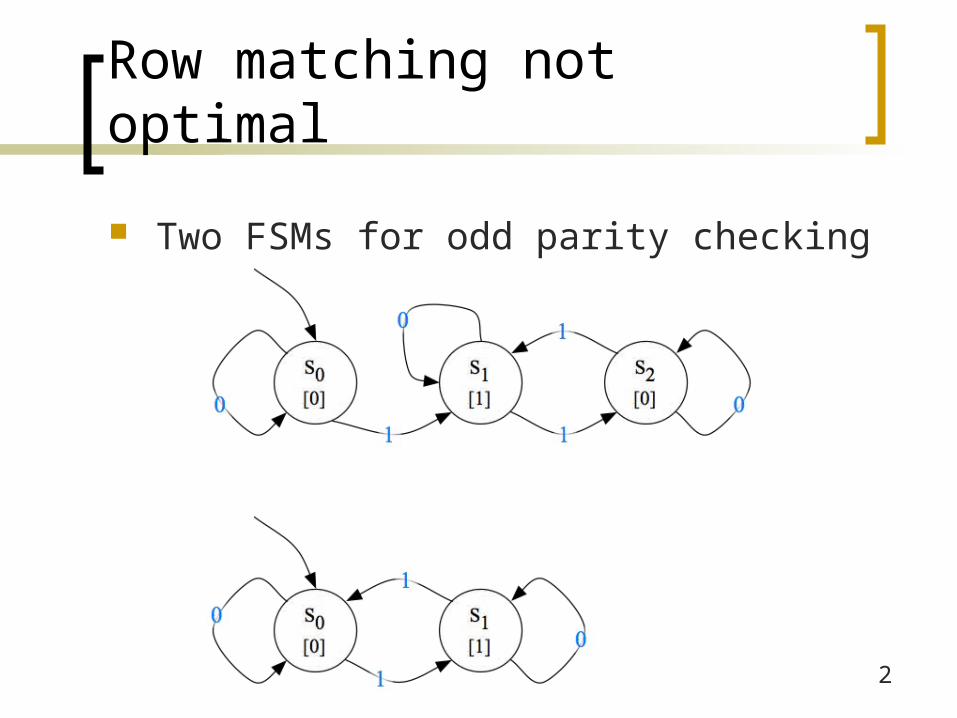
Row matching not optimal
Two FSMs for odd parity checking

3
No rows match!
Present StateNext State
OutputX=0 X=1
S0 S0 S1 0
S1 S1 S2 1
S2 S2 S1 0
4
FSM minimization
Row matching Easier to do by hand Misses minimization opportunities
Implication chart Guaranteed to find the most reduced
FSM More complicated algorithm (but still
relatively easy to write a program to do it)
5
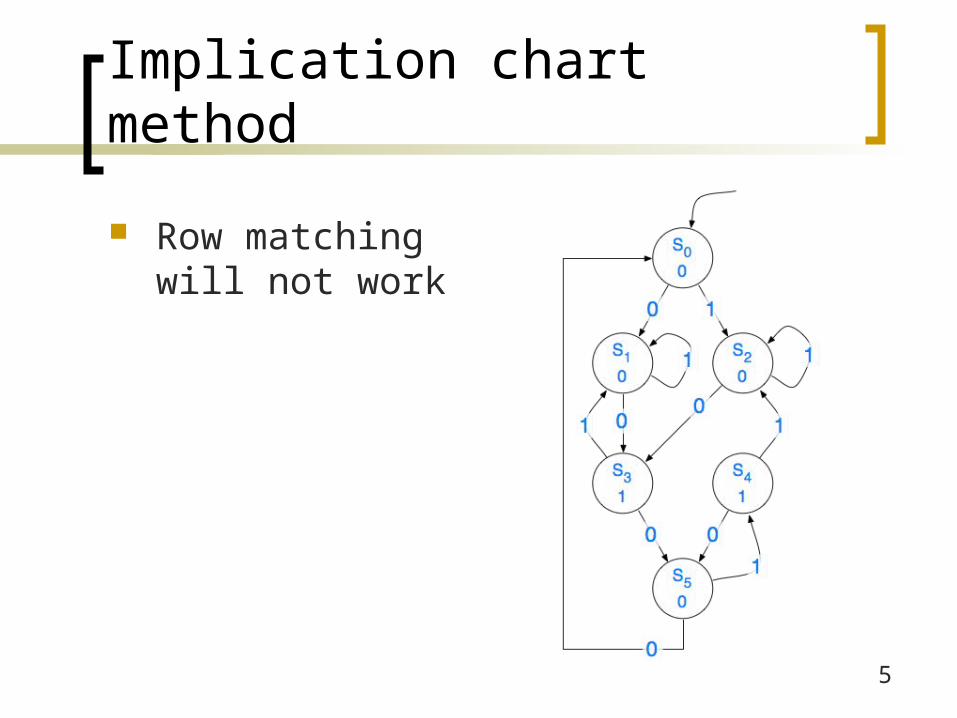
Implication chart method
Row matching will not work

6
Implication chart method
Basic Idea: Assume that all states are grouped together and only split state pairs that must be split

7
Implication chart method
1. Draw a table with a box for every pair of states2. Cross out boxes for pairs of states with different
outputs3. Fill rest of table with transition pairs
For each box and possible input, list pairs of destination states, one per source state
4. Repeat until no more boxes can be crossed out: If box (Si,Sj) contains some transition pair Sk-Sl
corresponding to an already crossed-out box then cross out box (Si,Sj)
5. Combine all pairs of states that are left

8
Step 1: Draw table of state pairs

9
Step 2: Consider the outputs

10
Step 3: Add transition pairs
01
C-R
11
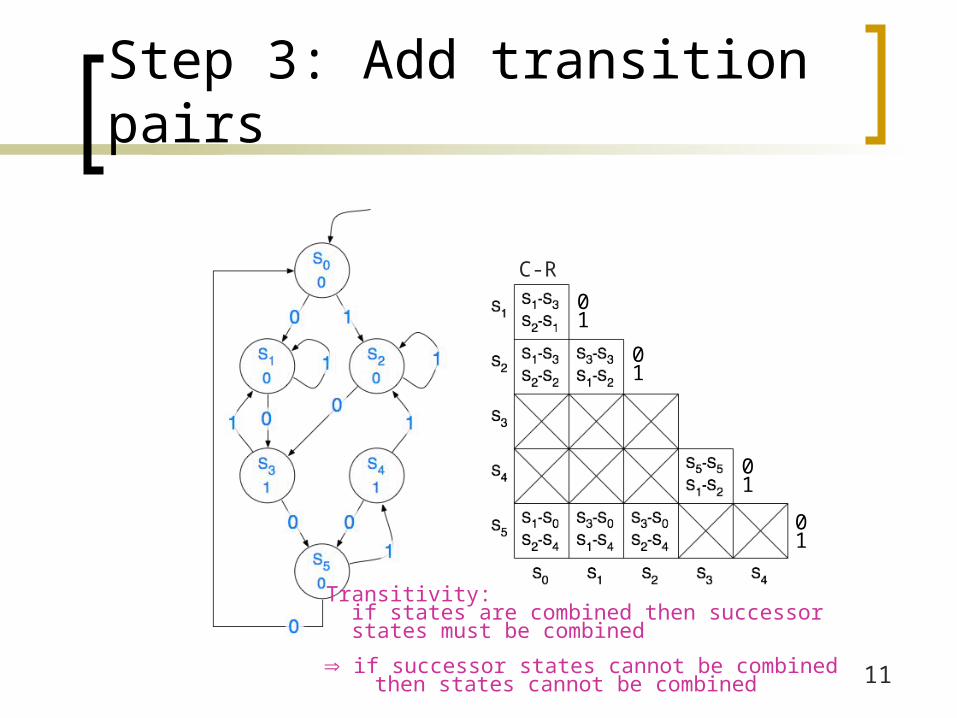
Step 3: Add transition pairs
Transitivity: if states are combined then successor states must be combined
01
C-R
01
01
01
if successor states cannot be combined then states cannot be combined

12
Step 4: Consider transitions
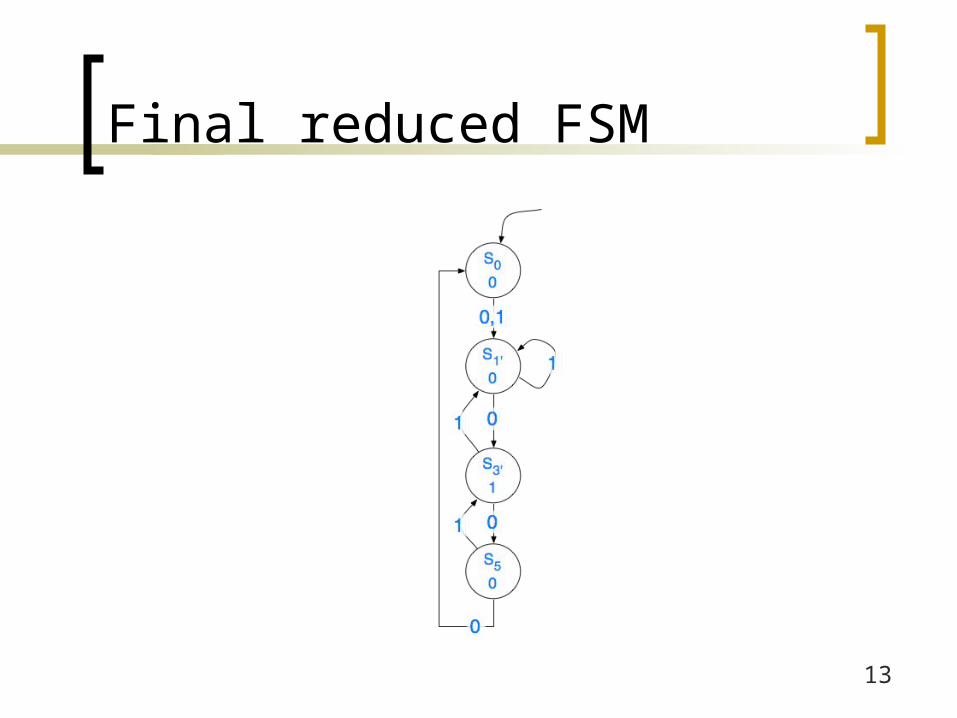
13
Final reduced FSM
14
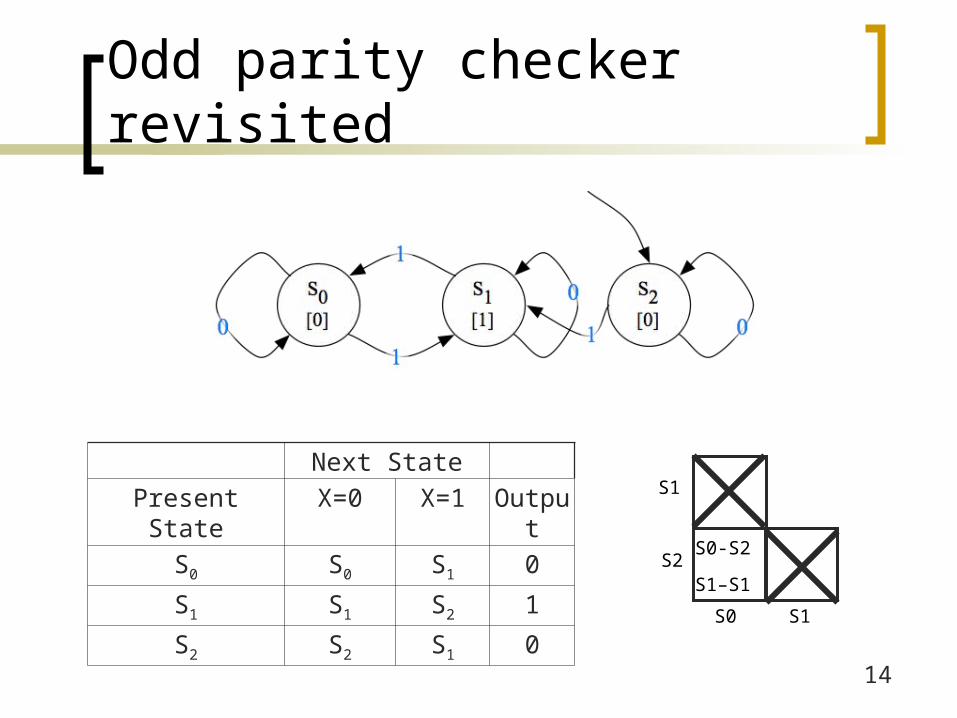
Odd parity checker revisited
Next State
Present State X=0 X=1 Output
S0 S0 S1 0
S1 S1 S2 1
S2 S2 S1 0
S1
S2
S0 S1
S0-S2
S1–S1
15
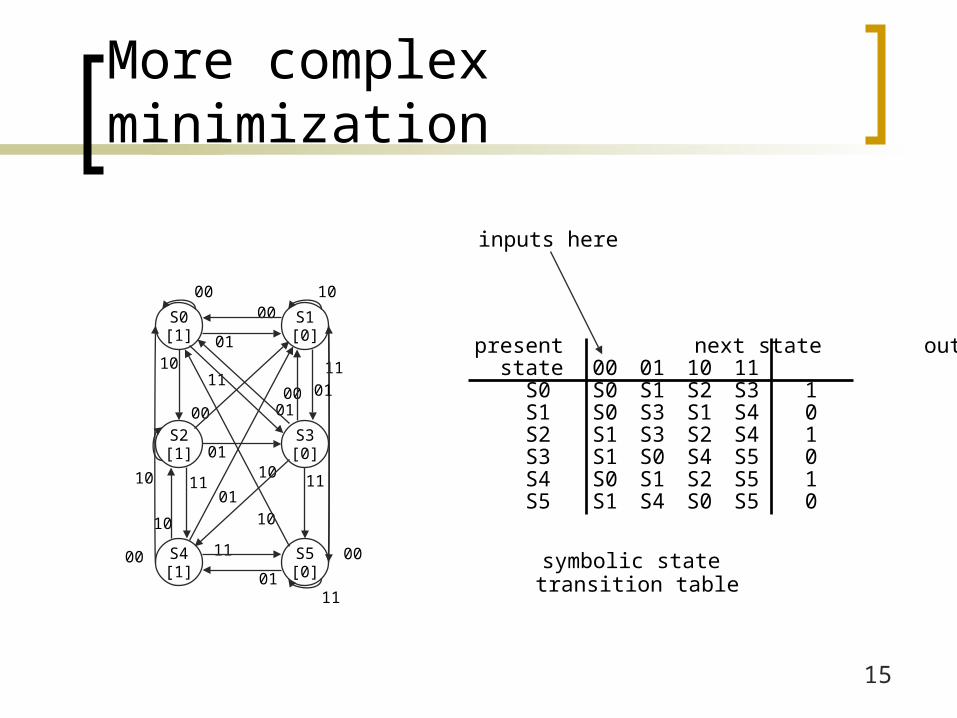
More complex minimization
symbolic state transition table
present next state output state 00 01 10 11 S0 S0 S1 S2 S3 1 S1 S0 S3 S1 S4 0 S2 S1 S3 S2 S4 1 S3 S1 S0 S4 S5 0 S4 S0 S1 S2 S5 1 S5 S1 S4 S0 S5 0
inputs here
1001
11
00
00
01
1110
10
01
1100
1000
11
00
1110
01
10
1101
00
S0[1]
S2[1]
S4[1]
S1[0]
S3[0]
S5[0]
01
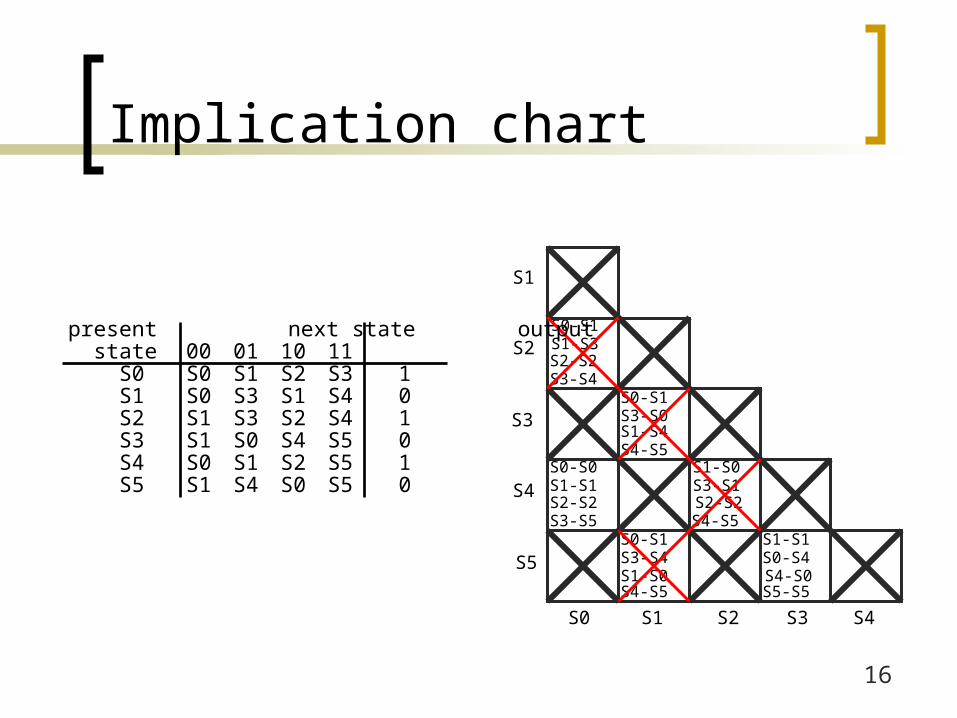
16
Implication chart
S0-S1 S1-S3 S2-S2 S3-S4
S0-S0 S1-S1 S2-S2 S3-S5
S0-S1 S3-S0 S1-S4 S4-S5
S0-S1 S3-S4 S1-S0 S4-S5
S1-S0 S3-S1 S2-S2S4-S5
S4-S0S5-S5
S1-S1 S0-S4
S1
S2
S3
S4
S5
S0 S1 S2 S3 S4
present next state output state 00 01 10 11 S0 S0 S1 S2 S3 1 S1 S0 S3 S1 S4 0 S2 S1 S3 S2 S4 1 S3 S1 S0 S4 S5 0 S4 S0 S1 S2 S5 1 S5 S1 S4 S0 S5 0

17
Minimized FSM
minimized state table(S0==S4) (S3==S5)
present next state output state 00 01 10 11 S0' S0' S1 S2 S3' 1 S1 S0' S3' S1 S3' 0 S2 S1 S3' S2 S0' 1 S3' S1 S0' S0' S3' 0
present next state output state 00 01 10 11 S0 S0 S1 S2 S3 1 S1 S0 S3 S1 S4 0 S2 S1 S3 S2 S4 1 S3 S1 S0 S4 S5 0 S4 S0 S1 S2 S5 1 S5 S1 S4 S0 S5 0
S0-S1 S1-S3 S2-S2 S3-S4
S0-S0 S1-S1 S2-S2 S3-S5
S0-S1 S3-S0 S1-S4 S4-S5
S0-S1 S3-S4 S1-S0 S4-S5
S1-S0 S3-S1 S2-S2S4-S5
S4-S0S5-S5
S1-S1 S0-S4
S1
S2
S3
S4
S5
S0 S1 S2 S3 S4

18
Minimizing not always good
Two FSMs for 0 1 edge detection

19
Minimizing not always good
In Q1 Q0 Q1+ Q0
+
0 0 0 0 00 0 1 0 00 1 1 0 01 0 0 0 11 0 1 1 11 1 1 1 1– 1 0 – –
Q1+ = In Q0
Q0+ = In
Out = Q1’ Q0

20
Minimizing not always good
In Q1 Q0 Q1+ Q0
+
0 0 0 0 00 0 1 1 00 1 0 0 0
0 1 1 1 01 0 0 0 11 0 1 1 11 1 0 0 1
1 1 1 1 1
Q1+ = Q0
Q0+ = In
Out = Q1’ Q0

21
A little perspective
These kinds of optimizations are what CAD (Computer Aided Design) / EDA (Electronic Design Automation) is all about
The interesting problems are almost always computationally intractable to solve optimally
People really care about the automation of the design of billion-transistor chips