1 m ichael b aker c orporation 2004 investor relations presentation ipaa oil & gas investment...
TRANSCRIPT

1
MICHAEL BAKER CORPORATION2004 Investor Relations Presentation
IPAA Oil & Gas Investment SymposiumApril 19, 2004

2
Safe Harbor
Note with respect to Forward-Looking Statements:This presentation of Financial Review and Operations Review
contains forward-looking statements concerning future operations and performance of the Company. Forward-looking statements are subject to market, operating and economic risks and uncertainties that may cause the Company’s actual results
in future periods to be materially different from any future performance suggested herein. Factors that may cause such
differences include, among others: increased competition, increased costs, changes in general market conditions, changes in industry trends, changes in the regulatory
environment, changes in anticipated levels of government spending on infrastructure, and changes in loan relationships or sources of financing, changes in management, and changes in information systems. Such forward-looking statements are
made pursuant to the Safe Harbor Provisions of the Private Securities Litigation Reform Act of 1995.

3
Company Overview
• Leader in Professional Services– Transportation and Civil Infrastructure Engineering– Oil & Gas Production Operations & Maintenance
• Well Positioned for Revenue Growth– Expanding Onshore Opportunities for Operations &
Maintenance Services– Strong Defense and Homeland Security Spending– Transportation Spending Bill Pending
• Record Backlog Exceeding $1.0 Billion

4
Performance of Core Businesses
$179$203
$228 $244 $242 $251
$69$80
$121
$158 $163$175
$134$162$150 $165
$45$39
$43 $55
$515 - $530
$205$179
$189
$426
$283
$248
$405
$349
$402
$210
$0
$100
$200
$300
$400
$500
$600
1994 1995 1996 1997 1998 1999 2000 2001 2002 2003 2004
Dollars in Millions
Engineering Energy
Co
nti
nu
ing
Bu
sin
es
s R
ev
en
ue
Guidance

5
Growth Strategy
• Maximize The Growth Potential Of Our Business Segments
• Optimize The Profitability Of Our Services Through Business Process Excellence
• Innovate The Methods In Which We Deliver Our Services To Our Clients
• Leverage The Skills And Relationships Of The Entire Company

6
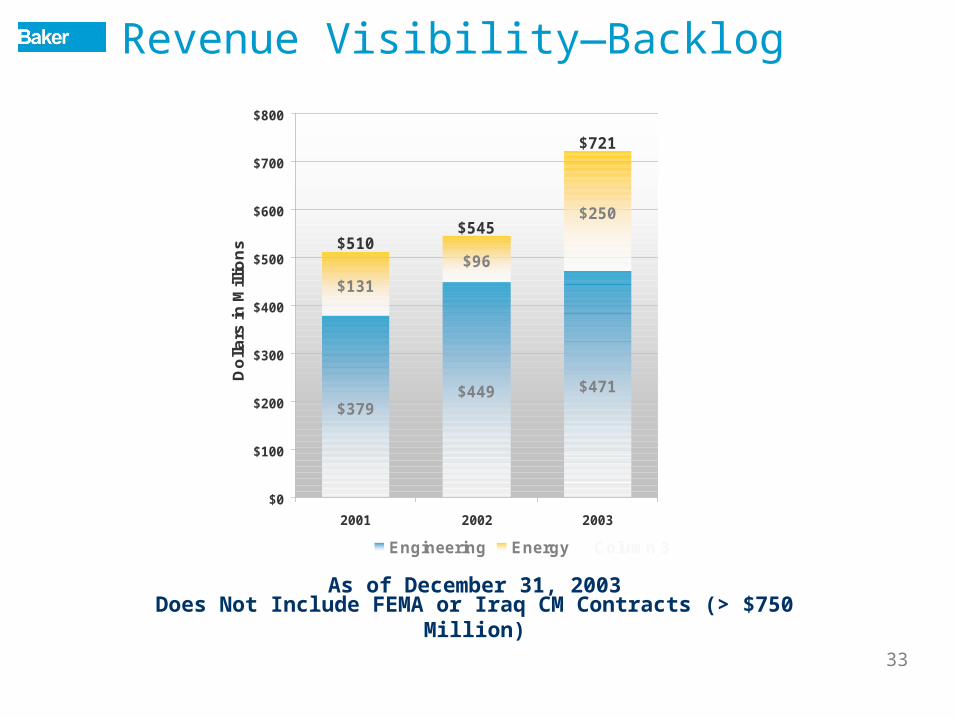
Revenue Visibility—Backlog
As of December 31, 2003
Does Not Include FEMA or Iraq CM Contracts (> $750 Million)
$379$449 $471
$131
$96
$250
$510$545
$721
$0
$100
$200
$300
$400
$500
$600
$700
$800
2001 2002 2003
Do
llars
in M
illio
ns
Engineering Energy Column 3

7
2004 Earnings Guidance
$0.25
$1.12$0.95 - $1.05
$0.00
$0.20
$0.40
$0.60
$0.80
$1.00
$1.20
2002 2003 2004 Guidance
EPS

8
Energy Markets and Services
Houston
Lafayette
London
Lagos
Caracas
Bangkok
AnchorageSupply Chain Management
O&M Services
Manpower
Training
Recruiting
Major and Independent Oil & Gas
LOC
ATIO
N
LOC
ATIO
N
SE
RV
ICE
S
SE
RV
ICE
S
CUSTOMERSCUSTOMERS
Abu Dhabi
Operations Engineering
Total Asset Management
Trinidad
Algeria

9
Energy Growth Markets
• Onshore Managed Services
• Deepwater Gulf of Mexico
• International

10
Managed Services Market Potential

11
– GenesisGenesis– Horn MountainHorn Mountain– ThunderhorseThunderhorse– AtlantisAtlantis– Mad DogMad Dog– HolsteinHolstein– NakikaNakika– MarlinMarlin– PompanoPompano
D E E P W A T E R
Energy Market Dynamics and Transitions - Gulf of Mexico
• Small and Mid-Size Independents Purchasing Shelf Properties
• Major and Large Independents Moving from Shelf to Deepwater and/or International
S H E L F – Mid to Small Size
– PetroniusPetronius– TyphoonTyphoon– NeptuneNeptune– GunnisonGunnison– BoomvangBoomvang– MorpethMorpeth– AlleghenyAllegheny– Canyon StationCanyon Station
Baker’s Deepwater ProjectsBaker’s Deepwater Projects

12
San Juan Basin
Panhandle, Anadarko and Hugoton Basins
Permian Basin
• Onshore Presents New Opportunities for Managed Services
Powder River Basin
Green River Basin
Energy Market Growth Drivers

13
Energy Market Growth Drivers
• Onshore Huber Energy– Two Managed Services Agreements– Texas Panhandle & Powder River Basins– $144 Million, 4 Years– Performance-Based– 8% to 12% Margin Potential

14
Energy Market Growth Drivers
Texas Panhandle

15
Energy Market Growth Drivers—International Opportunities
Mexico
London
Venezuela
Angola
Trinidad
Kazakhstan
Thailand
Equatorial Guinea
Egypt
Algeria
Ecuador
People’s Republic of China
Israel
South Korea
ChadNigeria

16
Energy Sector – Recent Project Awards
Thailand
Algeria
Nigeria
• Chevron Offshore Limited - Thailand– O&M of Tantawan and Benchamas Fields in the
Gulf of Thailand– 5-Year Contract Renewal Worth $6 Million Per
Year– Largest, Most Comprehensive O&M Contract
Assignment in the Gulf of Thailand– Development and Implementation of
Nationalization and Training Programs
• Nigeria LNG– $8.5 Million Per Year Contract– Comprehensive Maintenance Services for Bonny
Island LNG Plant– Training and Nationalization Programs
• Burlington Resources - Algeria– $5 Million Per Year Contract – O&M Support for Pre-commissioning,
Commissioning and Operational Phases of the MLN Field at Berkine
– Recruitment, Assessment, and Training of Algerian Nationals
• Others:– Karachaganak Petroleum Operating
(KPO) – Kazakhstan
– Ameriven Hamaca Project – Venezuela
– Kizomba Surface Wellhead Platform (SWHP) – Offshore Angola
Angola
Kazakhstan
Venezuela

17
Focused Engineering Practice Areas
• Transportation
• Federal Sector– Department of Defense– Civilian

18
Federal Sector Growth Drivers
$31.2
$36.5
$40.2
$0
$10
$20
$30
$40
$50
2003 2004 2005
Do
llars
in B
illio
ns
Department of Homeland Security
$365$380
$400$420
$441$462
$484
$0
$100
$200
$300
$400
$500
2003 2004 2005 2006 2007 2008 2009
Do
llars
in B
illio
ns
Department of Defense
BUDGETS
Source: Homeland Security, Budget in Brief, Fiscal Year 2005 ( www.dhs.gov )
Source: United States Department of Defense, News Release (02.03.03), ( http://www.defenselink.mil/news )

19
Federal Sector Growth Strategies
• Broader and Deeper with Existing Clients
• Secure Program Management/Mission Support Opportunities
• Leverage Engineering/Energy Expertise

20
Federal Sector – Recent Project Awards• Federal Emergency Management Agency
– Up to $750 Million, 5-Year Contract– Multi-Hazard Flood Map Modernization– Major Program Management Role– 10 Regional Management Centers Across U.S.– Performance-Based
• US-VISIT– +/- $11 Million in Pending Projects– Exit/Entry Assessment/Planning Engineering– Land/Air/Water Points of Entry

21
Federal Sector – Recent Project Awards• Iraq Construction Management – U.S. Army COE/CPA
– $1.2 Billion, 5-Year, ID/IQ Contract– Stanley Baker Hill Joint Venture– CM Services for Iraq Reconstruction– Leveraging Engineering/Energy Expertise
• U.S. Army COE – Central Command– $1.5 Billion, 5-Year, ID/IQ Contract– Sub to Parsons Corp.– Operations/Facilities Support in Central Asia, Middle East, Horn of Africa– Planning, Design, Procurement, Logistics, Design-Build

22
• U.S. Air Force Center for Environmental Excellence– $2.1 Billion, 5-Year ID/IQ Contract– Design-Build Team with Sundt Construction– A/E Services at DoD Facilities Worldwide– One of 9 Teams
• Base Realignment and Closure (BRAC)– $1.0 Billion Program– Honey Lake Parcel in California– First Conservation Conveyance of U.S. Army Property– $4.0 Million Program Management/Technical Services Contract– Other Opportunities Identified
Federal Sector – Recent Project Awards

23
Transportation Market Growth Drivers• TEA-21 Reauthorization Legislation
– President: $256 Billion– House: $275 Billion– Senate: $318 Billion
• Key Baker States Continuing to Award Work
• Recent Project Wins– Indiana I-69 Design– Ironton-Russell Bridge Design– Fulton Road Bridge Design (Ohio)– Utah Transit Authority Commuter Rail Design– New York State DOT Construction Management of Three Bridges– Environmental On-Call Services for Houston District of TexDOT (renewal)– Engineering Open End for District 12 of PennDOT

24
MICHAEL BAKER CORPORATIONFinancial Overview

25
Total Contract Revenues
$243.6 $242.6 $250.6
$158.2 $162.6$175.4
$403.2 $405.3$426.0
$515 - $530
$0
$50
$100
$150
$200
$250
$300
$350
$400
$450
$500
$550
Total Reported Engineering Energy
2001 2002 2003
$405.2$401.8
(in millions)
$426.0
2004Guidance

26
Income From Operations
$12.7
$10.3
$6.4
$10.1
$6.6
$1.4
$15.4 - $17.0
$20.4
$17.2
$6.4
$0
$5
$10
$15
$20
$25
Total Reported Engineering Energy
2001 2002 2003
(in millions)
$16.9
$22.8
$7.8
2004Guidance

27
Operating Performance
2000 2001 2002 2003TOTAL CONTRACT REVENUES
Total Reported $390,710 $403,222 $405,264 $425,984Less Non-Core 41,625 1,372 50 —
ENERGY 120,708 158,236 162,612 175,428ENGINEERING 228,377 243,614 242,602 250,556
Total Core Contract Revenues $349,085 $401,850 $405,214 $425,984
TOTAL OPERATING INCOME (Pre-Corp. O/H)Total Reported $ 17,543 $ 31,436 $ 28,207 $ 21,891
ENERGY 9,759 12,843 9,498 5,356% of Energy Revenues 8.1% 8.1% 5.8% 3.0%ENGINEERING 16,007 18,583 16,025 17,899% of Engineering Revenues 7.0% 7.6% 6.6% 7.0%
Total Core Operating Income (Pre-Corp. O/H)
$ 25,766 $ 31,426 $ 25,523 $ 23,255
(in thousands)

28
Earnings Per Share2000 2001 2002 2003
REPORTED EPS $0.65 $1.33 $1.12 $0.25
Pro Forma EPSCore Operating Income 25,766 31,426 25,523 23,255Less Corporate Overhead (6,818 ) (11,058 ) (10,980 ) (15,530 )Operating Income 18,948 20,368 14,543 7,725
Tax Rate 51.0% 45.5% 45.0% 58.0%Provisions for Income Tax 9,663 8,848 5,991 4,480
Net Income 9,285 11,101 7,999 3,245
Outstanding Shares (Diluted) 8,238 8,425 8,515 8,384
PRO FORMA EPS $1.13 $1.32 $0.94 $0.39

29
Cash Flow
2001 2002 2003
NET INCOME $11.2 $9.6 $2.1Depreciation & Amortization 5.2 4.0 4.9Other 3.2 (22.7) (21.8)
Cash Provided by/(Used in) Operations 19.6 (9.1) (14.8)
Capital Expenditures (4.1) (11.4) (4.8)Sale/(Purchase) of Investments 9.0 (1.0) —
Receipt/(Funding) of Litigation Escrow (12.7) 12.3 —
Share Repurchase (0.4) — (0.7)
Proceeds from Sale of Stock Options 0.3 0.6 —
Net Borrowings/(Repayments) (2.3) — 13.5Cash (Used in)/ Provided by Investing and Financing Activities
(10.2) 0.5 8.0
Net Increase (Decrease) in Cash $ 9.4 $(8.6) $(6.8)
(in millions)

30
Stock Performance (24 Months)
$14.90
$9.78
$8.62
$8.65
$8.60
$10.95
$8.95
$8.76
$10.00$10.30
$13.75
$14.25$15.00
$15.48
$10.70$10.05
$9.75
$9.50
$9.85
$10.60
$10.35
$10.90
$10.80
$12.67
$12.55
$0.00
$2.00
$4.00
$6.00
$8.00
$10.00
$12.00
$14.00
$16.00
Closing Share Price

31
Balance Sheet2001 2002 2003
ASSETSCash $ 18.5 $ 9.9 $ 3.1A/R 67.6 65.7 75.8Cost in Excess of Billing 25.3 29.7 51.6
PP&E 10.3 17.5 17.4Intangibles 9.8 9.5 9.2Other 20.1 12.8 16.3
Total Assets $151.6 $145.1 $173.4
LIABILITIESTrade A/P 21.9 20.4 22.1Accrued Other 68.2 53.3 65.2
Long-Term Debt — — 13.5
SHAREHOLDERS’ EQUITY 61.5 71.4 72.6
Total Liabilities and Shareholders’ Investment $151.6 $145.1 $173.4
Backlog $509.6 $545.2 $720.7
Shares Repurchased 31,300 — 80,400
(in millions)

32
Conclusion
• Maximize Growth– Energy
Expand Position in Markets with Long-Term Investment Strategy (Onshore, Deepwater, International)
Enhance Competitive Position in Historical Markets Via Cost Containment/Reduction (GOM Shelf)
– Engineering Continue to Pursue Federal Sector Projects Position in Key States for Renewed Transportation Funding Invest Strategically in Growth Markets
33
Revenue Visibility—Backlog
As of December 31, 2003
Does Not Include FEMA or Iraq CM Contracts (> $750 Million)
$379$449 $471
$131
$96
$250
$510$545
$721
$0
$100
$200
$300
$400
$500
$600
$700
$800
2001 2002 2003
Do
llars
in M
illio
ns
Engineering Energy Column 3

34
MICHAEL BAKER CORPORATION2004 Investor Relations Presentation
IPAA Oil & Gas Investment SymposiumApril 19, 2004