1 making america work* jon forman alfred p. murrah professor of law university of oklahoma law and...
TRANSCRIPT

1
Making America Work*Jon Forman
Alfred P. Murrah Professor of Law
University of Oklahoma
www.law.ou.edu/faculty/forman.shtml
Law and Society Association
Law, Society, and Taxation Panel 07
Montreal, Canada
May 30, 2008
*A presentation based on Jonathan Barry Forman, Making America Work (Washington, DC: Urban Institute Press, 2006).

2
Figure 1. Share of Household Income
0
10
20
30
40
50
60
Poorest 20% Middle 20% Richest 20%
Per
cent
Free market After taxes & transfers

3
Figure 2. How Taxes and Transfers Improved Equity, 2004
0%
20%
40%
60%
80%
100%
0% 20% 40% 60% 80% 100%
Percent of households
Per
cen
t of
hou
seh
old
inco
me
Line of perfect equality
Lorenz curve (income before taxesand transfers)
Lorenz curve (income after taxes andtransfers)

4
Figure 3. Family Income by Percentile, 1950-2003 (2003 dollars)
$0
$20,000
$40,000
$60,000
$80,000
$100,000
$120,000
$140,000
$160,000
$180,000
1950 1960 1970 1980 1990 2000
20th percentile
40th percentile
60th percentile
80th percentile
95th percentile
Source: U.S. Census Bureau (2005b), table F-1.

5
Figure 4. Ratio of Average Household Income of the Top 5 and 20 Percent of Households to the Average Household Income of the Bottom 20 Percent of Households, 1970-2000
10.6 9.8 10.211.3 11.9
13.2 13.8
16.214.5 14.7
17.0
19.1
22.7
24.6
0
5
10
15
20
25
30
1970 1975 1980 1985 1990 1995 2000
Year
Rat
io
Top 20%/bottom 20%
Top 5%/bottom 20%
Source: U.S. Census Bureau (2004b), table IE-3.

6
Table 1. Average Annual Earnings of Full-time Workers, 2004
Doctors $128,689
Lawyers 105,716
Economists 71,672
Nurses 53,289
Police 50,063
Auto mechanics 38,967
Secretaries 32,349
Garbage collectors 31,284
Orderlies 20,959
Waiters and waitresses 8,789

7
Figure 5. Distribution of Earnings, 2004
$15,600 $26,000 $36,000$50,000
$84,000
$0
$100,000
$200,000
$300,000
$400,000
0 10 20 30 40 50 60 70 80 90 100
Percentile
Ear
nin
gs

8
Figure 6. Distribution of Workers by Earnings Category, 2004
0
1
2
3
4
5
6
7
8
9
10
11
12
< 0 15 30 45 60 75 90 105 120 135 150 165 180 195 210 225 240 >250
Earnings (thousands of dollars)
Per
cent
of
wor
kers

9
Figure 7. Wages by Percentile, 1979-2003
$0
$5
$10
$15
$20
$25
$30
$35
$40
1979 1985 1991 1997 2003
Year
Dol
lars
per
hou
r 20
03$)
95th percentile
90th percentile
80th percentile
50th percentile
20th percentile
10th percentile

10
Figure 8. The Size Distribution of Wealth, 2004: Percentage Share of Wealth Held by...
34.3
24.6
12.3 13.4
84.7
11.33.8
0.20
10
20
30
40
50
60
70
80
90
100
Top 1% Next 4% Next 5% Next10%
Top20%
2nd20%
3rd 20% Bottom40%
Per
cent

11
Figure 9. The Distribution of Various Resources, by Quintiles
0%
20%
40%
60%
80%
100%
Lowest Second Middle Fourth Highest
Consumer unitconsumption, 1999
Household earnings,1998
Household income,1998
Household wealth,1998

12
Figure 10. Share of Household Income
0
10
20
30
40
50
60
Poorest20%
Middle 20% Richest20%
Per
cen
t
Egalitarian Free market After taxes & transfers Just?

13
Recent Policy Trends Encouraging Work
• Welfare reform
• Cutting tax rates on earned income
• Outlawed employment discrimination
• Social Security, pension, labor markets
14
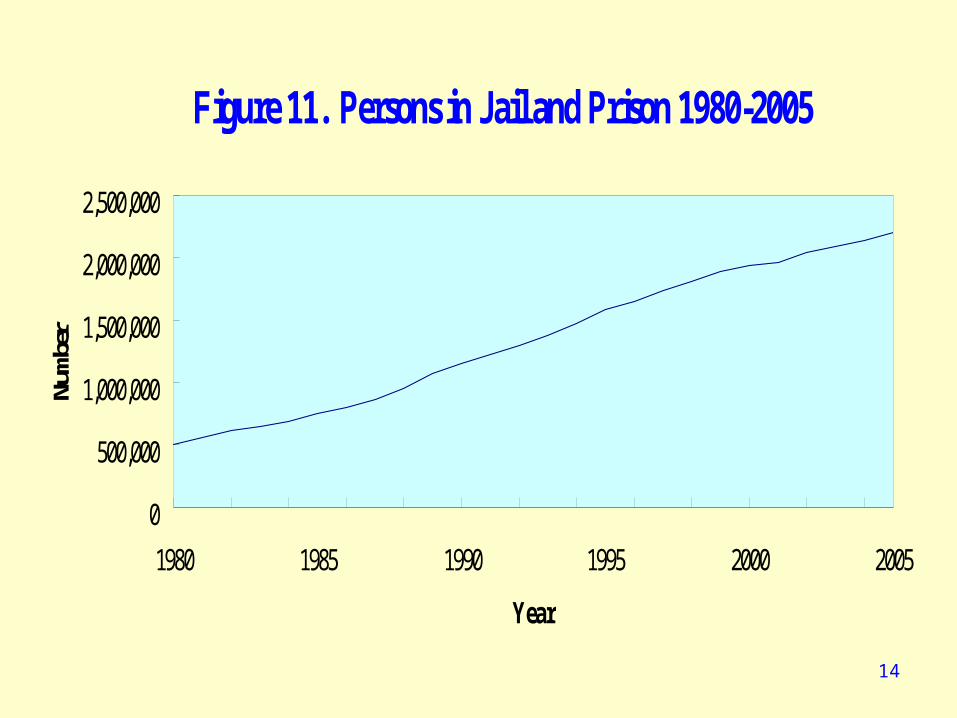
Figure 11. Persons in Jail and Prison 1980-2005
0
500,000
1,000,000
1,500,000
2,000,000
2,500,000
1980 1985 1990 1995 2000 2005
Year
Num
ber
15
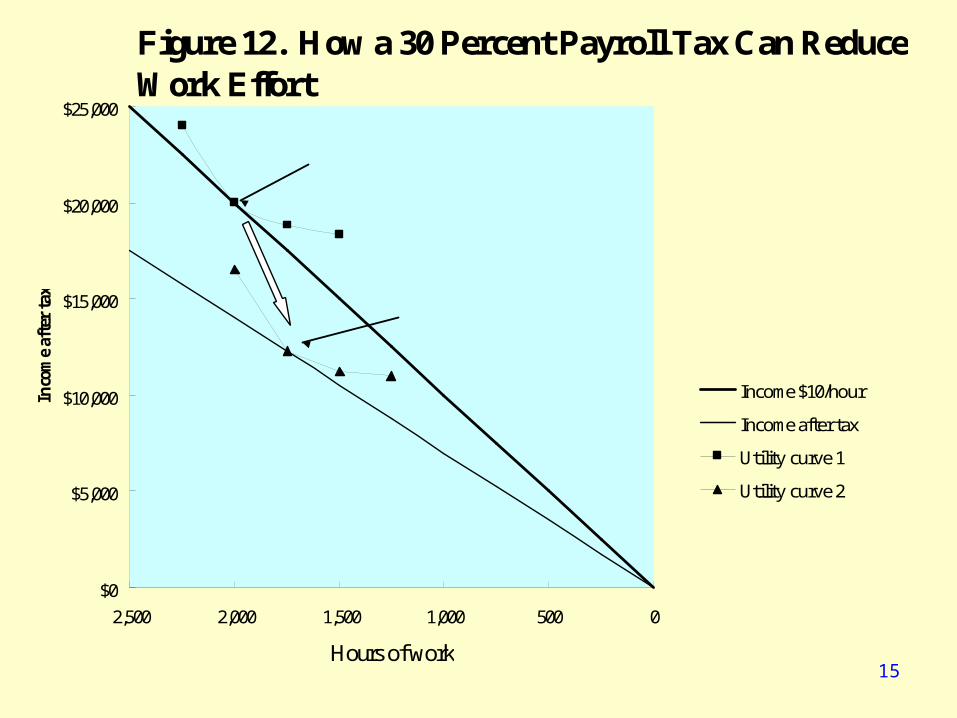
Figure 12. How a 30 Percent Payroll Tax Can Reduce Work Effort
$0
$5,000
$10,000
$15,000
$20,000
$25,000
05001,0001,5002,0002,500
Hours of work
Inco
me
afte
r ta
x
Income $10/hour
Income after tax
Utility curve 1
Utility curve 2
After: 1,750 hours, $12,500/year
Before: 2,000 hours, $20,000/year

16
Top 10 Income Tax Expenditures, 2009(Billions of Dollars)
Health insurance exclusion $168
Mortgage interest deduction 101
401(k) plans 51
Charitable contrib. (other than health & education) 47
Accelerated depreciation 44
Capital gains (except timber, iron ore, coal) 55
Deductible nonbusiness state and local taxes other than on houses
33
Employer plans 46
Step-up of basis at death 37
Capital gains exclusion on homes 34
2009 Federal Budget, Analytical Perspectives, Chapter 19, Tax Expenditures, Table 19-3

17
Some Specific Recommendations
• Making Taxes Work• Making Welfare Work• Modestly Raising the Minimum Wage and
indexing It for Inflation• A Two-Tiered Social Security System• A Restructured Pension System• Universal Health Care• Move Toward Full Employment

18
Fig. 13. Percentage Composition of Federal Receipts by Source: 1940-2005
0
10
20
30
40
50
60
1940 1950 1960 1970 1980 1990 2000
Year
Per
cent
Individual Income Tax
Corporation Tax
Social Insurance
Excise Taxes
Other

19
Figure 14. Income Tax Rates, Single Parent with Two Children and Earned Income Only, 2006
0%
10%
20%
30%
40%
50%
60%
$0 $50,000 $100,000 $150,000 $200,000
Earned income
Tax
rate

20
Figure 15. Social Security Tax Rates on Earned Income, 2006
0%
10%
20%
30%
40%
50%
60%
$0 $50,000 $100,000 $150,000 $200,000
Earned income
Tax
rat
e

21
Figure 16. U.S. Payroll Tax Rates: Selected Years
0
2
4
6
8
10
12
14
16
18
20
1940 1960 1980 2006
Year
Perc
ent p
aid
join
tly b
y em
ploy
ee a
nd e
mpl
oyer
Medicare
Social Security

22
Figure 17. Actual Tax Rate on Single Parents with Earned Income Only, 2006
-40%
-20%
0%
20%
40%
60%
$0 $50,000 $100,000 $150,000 $200,000
Earned income
Eff
ecti
ve t
ax r
ate
Effective tax rate Linear trend line

23
35.9%
58.8%
88.6%
0%
20%
40%
60%
80%
100%
Tax Plus FoodStamps &
Health
Plus TANF,Housing,
Child Care
Figure 18. Average Cumulative Tax Rates Confronting Low-to-Moderate-Income
Families ($10k - $40k)

24
0%
10%
20%
30%
40%
50%
60%
$0 $50,000 $100,000 $150,000 $200,000
Earned income
Tax
rat
e
Figure 19. Rates in a Comprehensive Tax and Transfer System

25
$0
$1,000
$2,000
$3,000
$4,000
$5,000
$0 $20,000 $40,000 $60,000 $80,000
Earned income
Cre
dit A
mou
nt t
$2,000 per worker credit $2,000 per worker credit with phase-out
Figure 20. $2,000 per Worker Earned Income Credit, with or without a Phase-out
26
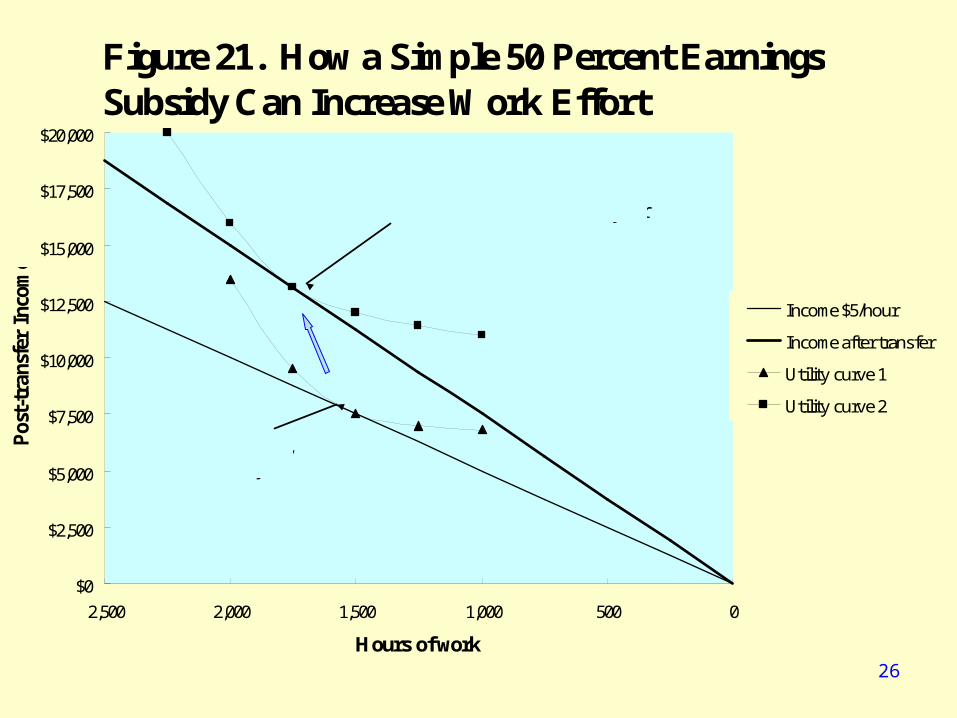
Figure 21. How a Simple 50 Percent Earnings Subsidy Can Increase Work Effort
$0
$2,500
$5,000
$7,500
$10,000
$12,500
$15,000
$17,500
$20,000
05001,0001,5002,0002,500
Hours of work
Pos
t-tr
ansf
er I
ncom
e
Income $5/hour
Income after transfer
Utility curve 1
Utility curve 2
After: 1,750 hours, $13,125/year
Before:
1,500 hours,$7,500/year
27
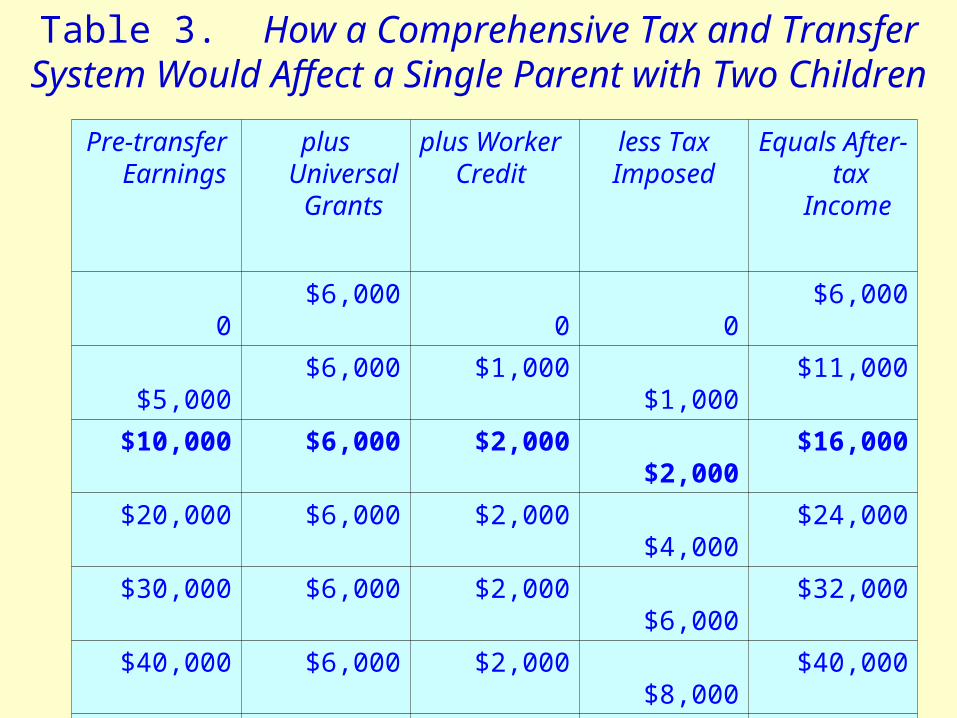
Pre-transfer Earnings
plus Universal
Grants
plus Worker Credit
less TaxImposed
Equals After-tax
Income
0 $6,000 0 0 $6,000
$5,000 $6,000 $1,000 $1,000 $11,000
$10,000 $6,000 $2,000 $2,000 $16,000
$20,000 $6,000 $2,000 $4,000 $24,000
$30,000 $6,000 $2,000 $6,000 $32,000
$40,000 $6,000 $2,000 $8,000 $40,000
$50,000 $6,000 $2,000 $10,000 $48,000
$100,000 $6,000 $2,000 $27,500 $80,500
$150,000 $6,000 $2,000 $45,000 $113,000
$200,000 $6,000 $2,000 $62,500 $145,500
Table 3. How a Comprehensive Tax and Transfer System Would Affect a Single Parent with Two Children

28
Figure 22. How a Comprehensive Tax and Transfer System Would Affect Single Parents
$0
$50,000
$100,000
$150,000
$200,000
$0 $50,000 $100,000 $150,000 $200,000
Earnings
Pos
t-ta
x, p
ost-
tran
sfer
inco
me
Pre-transfer earnings
Post-tax, post transferincome

29
$0
$5,000
$10,000
$15,000
$20,000
$25,000
1960 1970 1980 1990 2000Year
Ear
ning
s
Poverty level,family of three
Poverty level,family of four
Annualminimum wageearnings
Figure 23. Minimum-Wage Earnings versus Poverty Levels, 1960-2007

30
Figure 24. Life Expectancies at Birth versus Social Security Retirement Age
4045505560657075808590
1900 1940 1980 2020 2060
Year of birth
Age
Life expectancy at birth, males
Life expectancy at birth, females
Full retirement age for people born that year

31
Figure 25. Labor Force Participation of Men Age 55 and Older, 1950-2004
0%
20%
40%
60%
80%
1950 1960 1970 1980 1990 2000
Year
Pa
rti
cip
ati
on
ra
te
Men age 55 and over
Men age 65 and over
32
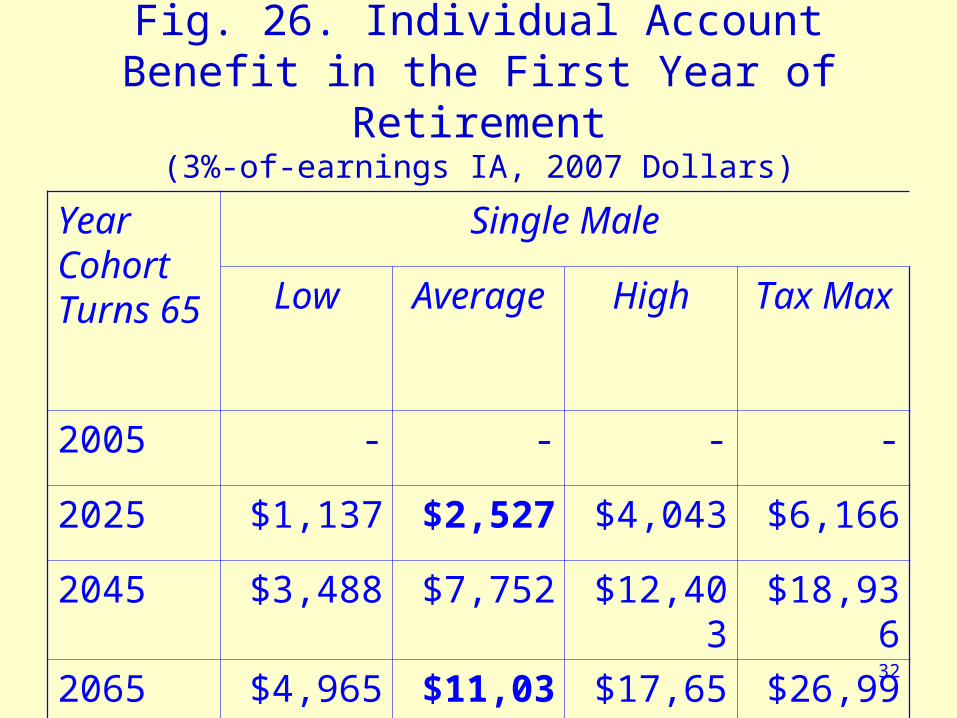
Fig. 26. Individual Account Benefit in the First Year of Retirement
(3%-of-earnings IA, 2007 Dollars)
Year Cohort Turns 65
Single Male
Low Average High Tax Max
2005 - - - -
2025 $1,137 $2,527 $4,043 $6,166
2045 $3,488 $7,752 $12,403 $18,936
2065 $4,965 $11,033 $17,652 $26,998

33
Fig. 27. Individual Account Replacement Rates
(3%-of-earnings IA as a Percent of Final Wage)
Year Cohort Turns 65
Single Male
Low Average High Tax Max
2005 0.0 0.0 0.0 0.0
2025 5.1 5.1 5.1 5.0
2045 12.5 12.5 12.5 12.5
2065 14.4 14.4 14.4 14.4

34
Table 4. Health Coverage 2006
Source of Coverage millions percentage
Total population 296.8 100.0
Employment-based coverage
177.2 59.7
Individually Purchased 27.1 9.1
Public 80.3 27.1
Medicare 40.3 13.6
Medicaid 38.3 12.9
Military health care 10.5 3.5
No health insurance 47.0 15.8

35
Clusters without Coverage
• Employees of small businesses• Workers who lose their jobs• Workers who decline employer coverage• Low-income parents• Low-income childless adults• The near elderly• Young adults• Children• Immigrants

36
Transition to Expanded Coverage
• Tax Changes: cap the exclusion for employer-provided insurance at a fixed dollar amount and gradually replace it with a tax credit
• Employer Mandate: require employers to offer a plan, and automatically enroll workers
• Individual Mandate: require workers to get coverage

37
Summary—Making America Work
• Government should intervene– To encourage work– Promote economic justice
• Tax, spending, and regulatory proposals– Increase the size of the economic pie– Allow us to divide it more equally

38
About the Author• Jonathan Barry Forman (“Jon”) is the Alfred P. Murrah
Professor of Law at the University of Oklahoma, where he teaches courses on tax and pension law.
• Professor Forman is also Vice Chair of the Board of Trustees of the Oklahoma Public Employees Retirement System (OPERS) and the author of Making America Work (Washington, DC: Urban Institute Press, 2006), http://www.urban.org/books/makingamericawork/index.cfm.
• Prior to entering academia, Professor Forman served in all three branches of the federal government. He has a law degree from the University of Michigan, and he also has master’s degrees in economics and psychology.
• Jon can be reached at [email protected] or (405) 325-4779. His web page is www.law.ou.edu/faculty/forman.shtml.