1 met 12 global climate change - lecture 9 climate models and the future shaun tanner san jose state...
TRANSCRIPT

1
MET 12 Global Climate Change - Lecture 9
Climate Models and the Future
Shaun TannerSan Jose State University
Outline Current status Scenarios Global Models Future Predictions

2
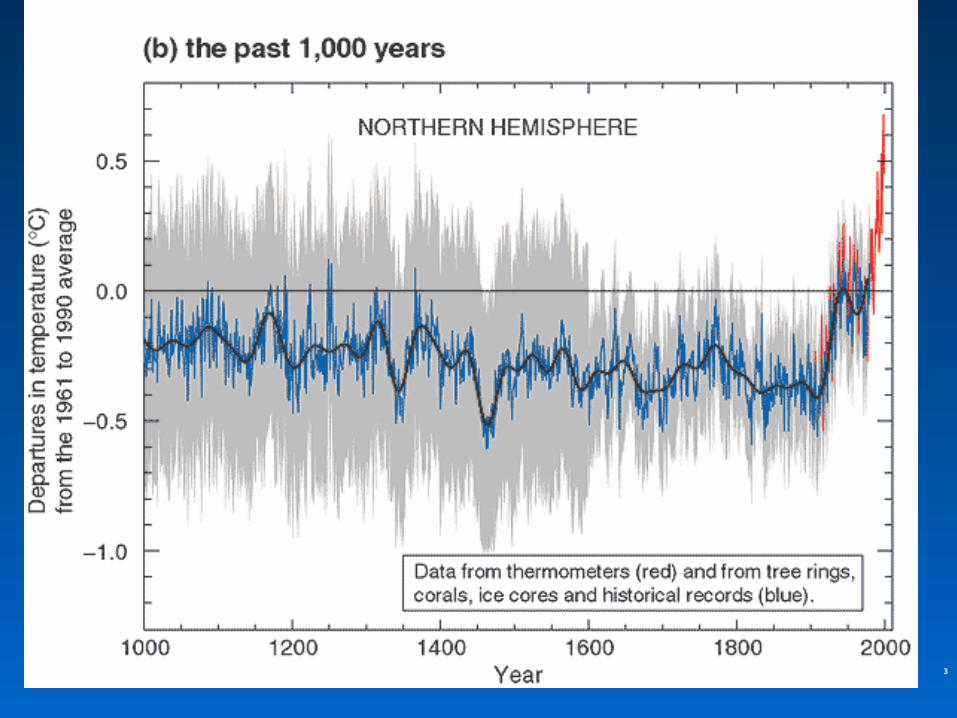
3

4
5
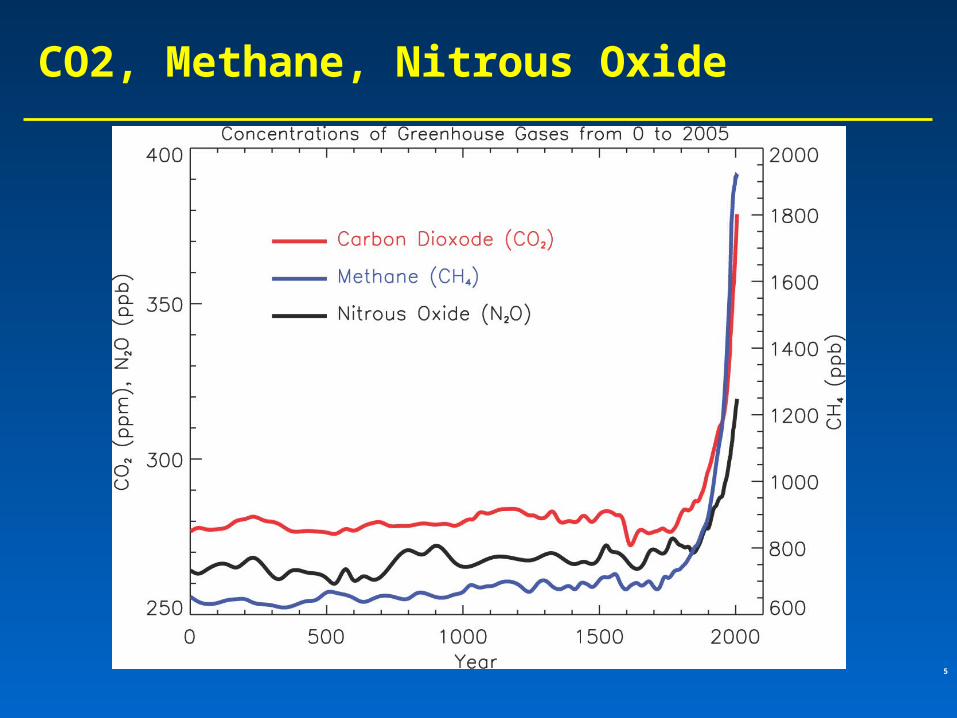
CO2, Methane, Nitrous Oxide


7
Climate Change and humans
Anthropogenic increases in – greenhouse-gas concentrations– sulfate aerosols due to anthropogenic
emissions Emission scenarios have been developed Changes in solar irradiance and volcanic
aerosols– Unpredictable and difficult to model
Q: How do we predict what the future climate will be like?
A: We use global models of the earth system
8

Sequence of Steps
1. Estimate future GHGs concentration2. Using future GHG levels, calculate
what future climate (e.g. temp, precip) will be like.
3. Assess the uncertainty of the predictions
9

Global Climate Modeling
1. Carbon cycle model2. Global Climate Model
10

Figure 4.6 Main floor of the Earth Simulator Center in Yokohama, Japan

Figure 4.7 Elements of a global climate model

Figure 4.8 Genealogy of atmosphere GCMs

Figure 4.9 Examples of grid box systems
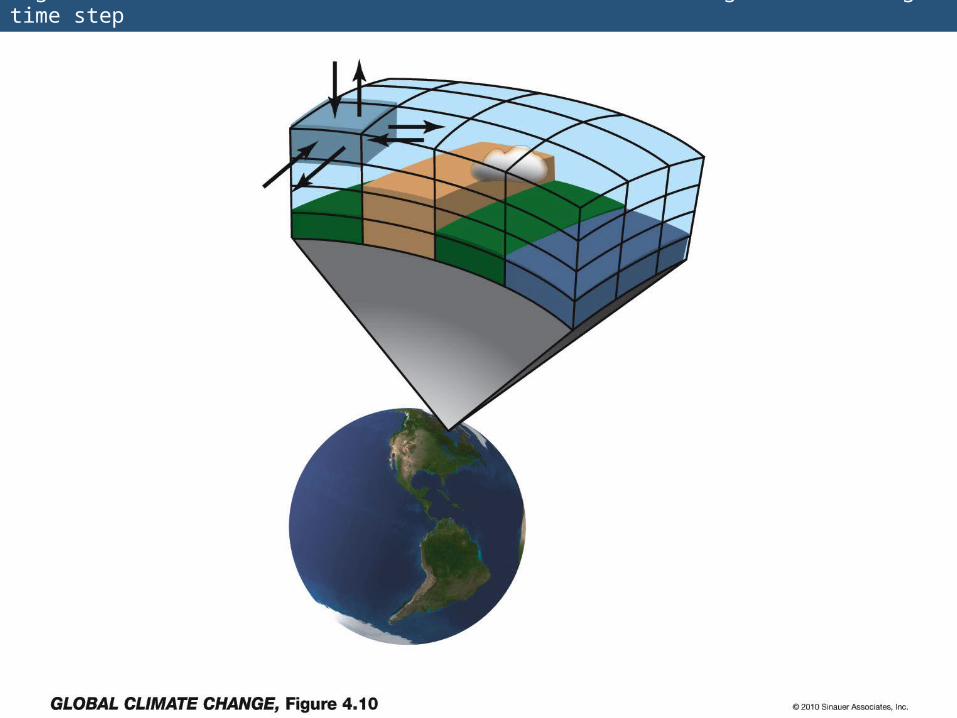
Figure 4.10 GCMs characterize fluxes into and out of a grid box during a time step

16
Calculation of Future CO2 Concentrations
Carbon Cycle Model – Simulates atmosphere-biosphere and atmosphere-ocean interactions
CO2 Emissions -How much is going into atmosphere
CO2 Concentration - How much remains in atmosphere

17
Carbon Cycle Models
Atmosphere/ocean and atmosphere/biosphere interactions not well understood
Model calculations contain uncertainty; the largest uncertainty: – Future uptake of carbon by the biosphere– Future uptake of carbon by the oceans

Global Population Type of energy generation
– Fossil intensive
– Renewable energy Growth of Economy Type of Economy
– Material based
– Service and information based Cooperation among countries
– More homogeneous - share technologies
– More isolated - larger divide between rich/poor countries
What factors affect future CO2 levels?
19

In 10 years, what do you expect you’ll earn annually?
1. Less than $20k
2. Between $20-40k
3. Between $40-60k
4. Between $60-80k
5. Between $80-100k
6. Between $100-150k
7. Over $150k

21
What kind of car will you most likely purchase next?
1. SUV
2. Truck
3. Sportcar
4. Minivan
5. Station wagon
6. 4 door sedan
7. Hybrid (gas/electric)
8. Electric
What best explains your eating patterns now?
1. Eat meat most meals
2. Eat meat a few times a week (3-5 times)
3. Eat meat occasionally (1-2 times per week)
4. Eat meat very occasionally (1-2 per month)
5. Vegetarian
6. Vegan

Scenarios (1)
23

24
Scenarios (2)
A1 storyline– World of rapid economic growth– Population peaks 2050– Different branches dependent on energy type/use
A1FI – Fossil intensive – continued dependence on coal/oil
A1T – Non-fossil intensive energy use (Technology) A1B – Balance between fossil and non-fossil
A2 storyline– Heteorogenous world –technologies are not shared
across borders, – population continues to increase

25
Scenarios (3)
B1 storyline– Similar population as A1– Global exchange/cooperation– Change in economic structures from product
oriented to service oriented.– Focus on social and economic sustainability
B2 storyline– Population like A2– Similar environmental and social focus– More regionally oriented (not as much
exchange between countries).

Figure 4.16 Emissions scenarios (Part 1)

Figure 4.16 Emissions scenarios (Part 2)
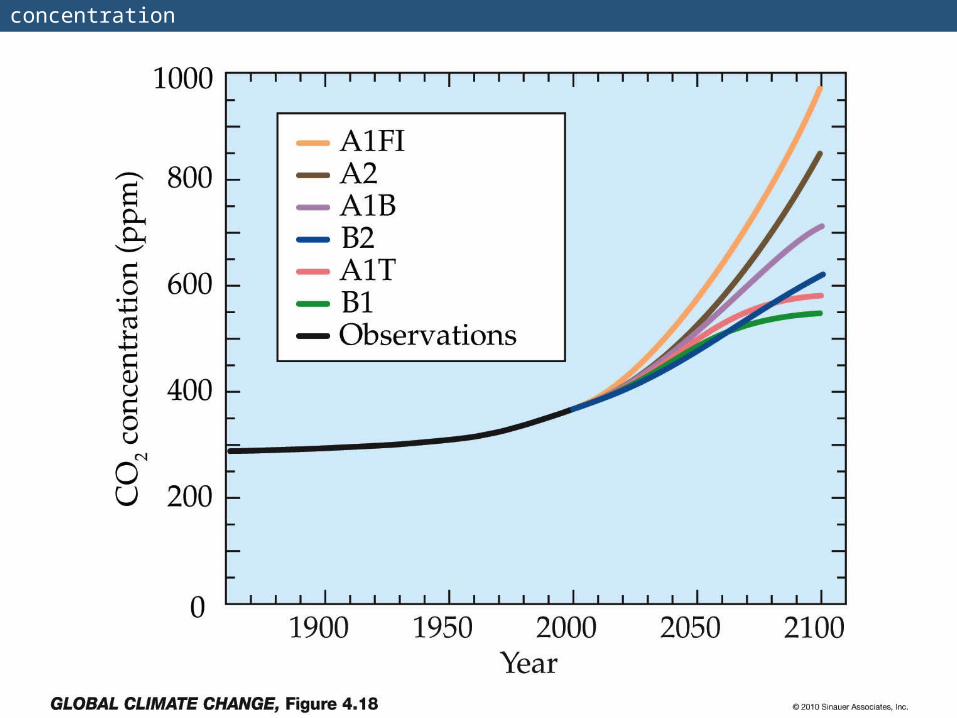
Figure 4.18 Past and predicted changes in global average atmospheric CO2 concentration
29
Climate Model
A climate model is a mathematical representation of the physical processes that control climate– Basically everything that affects climate– Sun, atmosphere (greenhouse gases,
aerosols), hydrosphere, land surface, cryosphere
Equations are very complicated– Some of the world’s largest supercomputers
are running climate models

30
Model Schematic
Climate Model
Changes in greenhouse-gas concentrations and changes in albedo due to aerosols
Climate change (i.e. temperature, precipitation etc.)
31
Model Verification: Can it be done?
Before you can trust any of these models, they must be verified.– We can use past climate as a test.
If your model can simulate the past climate, then there is a reasonable chance that the
model can accurately predict future climate.

32
Can we predict changes in past climate?

Figure 4.29 Observed global temperature changes versus simulations via the HadGEM1 GCM

What conclusions can you infer from these model experiments?
1.
2.
34

35
These experiments demonstrate that
1. The warming of the entire 20th century is largely due to humans
2. The warming of the last 50 years is largely due to humans.
3. Natural factors are largely responsible for the warming of the 20th century
4. Natural factors are not important in the early 20th century, but more important in the last part of the 20th century.

36
Climate models
1. Are not useful for predicting the temperature changes observed during the 20th century.
2. Show that volcanic eruptions and changes in sunlight are responsible for most of the changes observed over the 20th century.
3. Can predict the 20th century observed temperature changes with natural factors only.
4. Can only predict the 20th century observed temperature changes when they include both human and natural contributions.

What conclusions can you infer from these model experiments?
1. Models can reasonably predict
temperature variations over the last
150 years.
2. Most of the observed warming in the
past 50 years is attributable to human
activities.
37

Future Projections
38

39
Carbon Emissions
UNEP 2003

Figure SPM.5

Figure 4.34 Projected changes in surface temperatures comparing data (Part 2)

Figure 4.38 Projections of 21 GCMs about changes over the present century in precipitation

Figure 4.35 Past and future sea ice and sea level

44
Future predictions: main changes in climate
Higher temperatures - especially on land
– Arctic shows the largest warming Hydrological cycle more intense
– More rain overall Sea levels rise
– Why? Changes at regional level –hard to predict More intense weather (extremes)
– Floods, droughts etc.

45
Activity 4
1. Based on the A2 scenario, what is the
predicted CO2 concentration, temperature
change and sea level change in 2100?2. Based on the B1 scenario, what is the
predicted CO2 concentration, temperature change and sea level change in 2100?
3. Explain the differences.

46
47
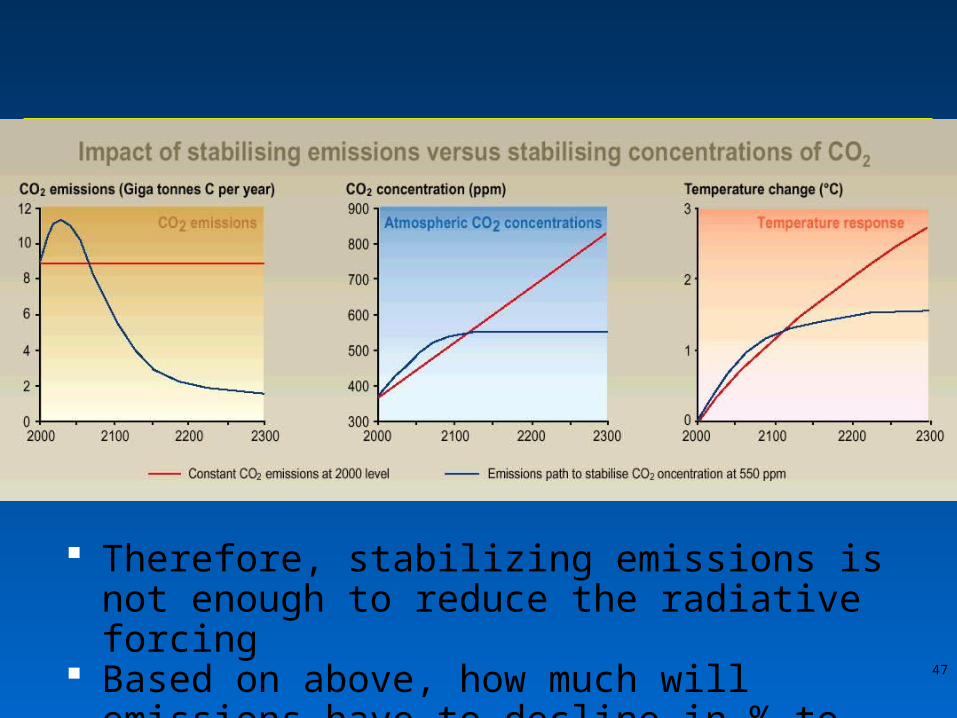
Therefore, stabilizing emissions is not enough to reduce the radiative forcing
Based on above, how much will emissions have to decline in % to stabilize CO2 at 550ppm?

Mean Temperature (2050):
relative to 1961-90
A1FI is A, B or C?
B2 is A, B or C?
AB
C
48
49
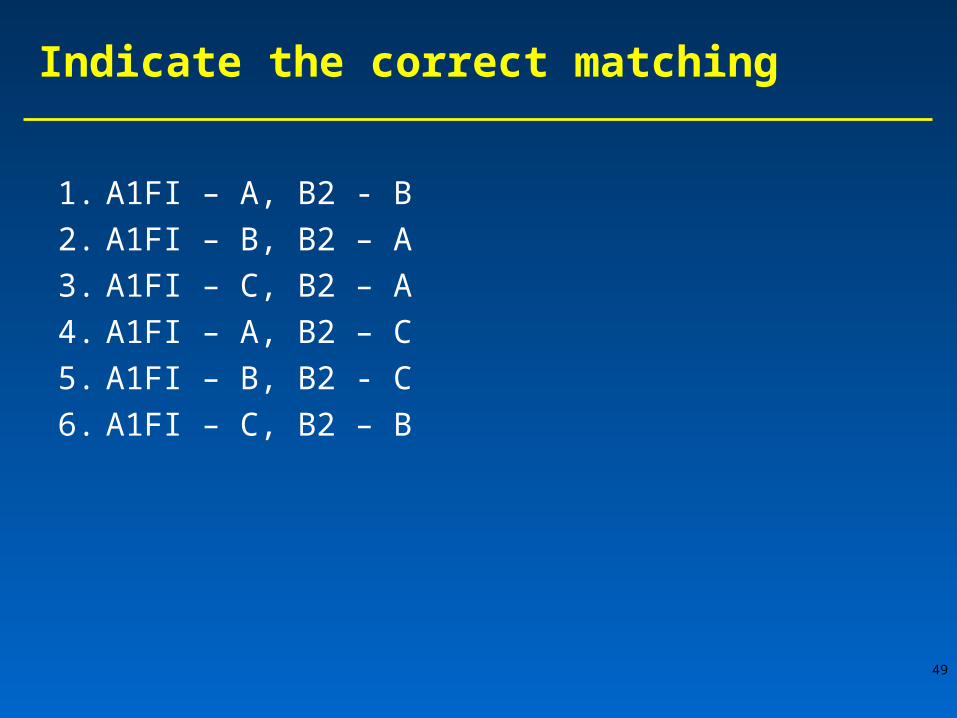
Indicate the correct matching
1. A1FI – A, B2 - B
2. A1FI – B, B2 – A
3. A1FI – C, B2 – A
4. A1FI – A, B2 – C
5. A1FI – B, B2 - C
6. A1FI – C, B2 – B

Mean Temperature (2050):
relative to 1961-90
A1F
A2
B2
50

51
A
B
C
Constant Aerosols ____
Increasing aerosols____
Decreasing aerosols____

The correct order of the graph is (Constant, Increasing Aerosols and Decreasing Aerosols)
1. A B C
2. A C B
3. B A C
4. B C A
5. C A B
6. C B A
52
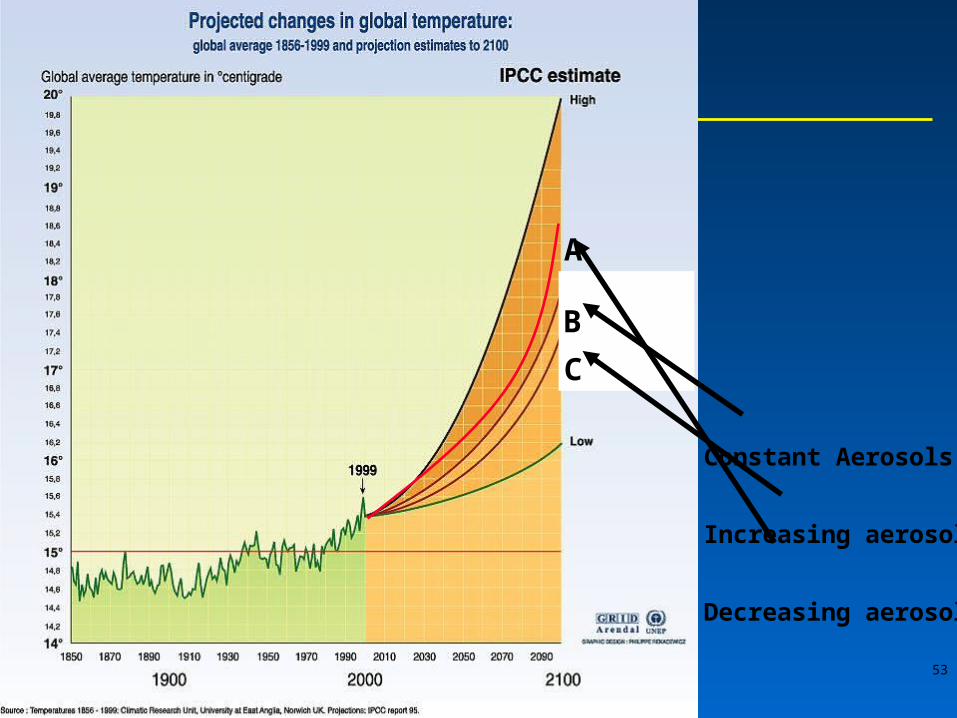
53
A
B
C
Constant Aerosols
Increasing aerosols
Decreasing aerosols

54
If CO2 emissions were stabilized at present day values, CO2 concentrations would
1. Continue to increase
2. Stabilize
3. Start to decrease